wind energy - site.iugaza.edu.pssite.iugaza.edu.ps/mabualtayef/files/re-ch04.pdf · wind energy...
TRANSCRIPT

1
Wind Energy
Associate Professor Mazen Abualtayef Environmental Engineering Department
Islamic University of Gaza, Palestine
Adapted from a presentation by
S. Lawrence Leeds School of Business, Environmental Studies
University of Colorado, Boulder, CO, USA

2
Ancient Resource Meets 21st Century

3
Wind Turbines
Power for a House or City

4
Wind Energy Outline
History and Context
Advantages
Design
Siting
Disadvantages
Economics
Project Development
Policy
Future

5
History and Context

6
Wind Energy History 1 A.D.
Hero of Alexandria uses a wind machine to power an organ
~ 400 A.D. Wind driven prayer wheels in Tibet
600 to 800 The first practical windmills were in use in Iran
1200 to 1850 Golden era of windmills in western Europe – 50,000 9,000 in Holland; 10,000 in England; 18,000 in Germany
1850’s Multiblade turbines for water pumping made and marketed in U.S.
1882 Thomas Edison commissions first commercial electric generating stations in
NYC and London
1900 Competition from alternative energy sources reduces windmill population
to fewer than 10,000
2000 ~ The world's first operational offshore large-capacity floating wind turbine,
Hywind, became operational in the North Sea off Norway in late 2009. By late 2011, Japan announced plans to build a multiple-unit floating wind
farm, with six 2-megawatt turbines, off the Fukushima coast of northeast Japan

7
Increasingly Significant Power Source
coal
petroleum
natural gas
nuclear
hydro
other renewables
wind
Wind could
generate
6% of
nation’s
electricity
by 2020 Wind currently produces less than
1% of the nation’s power.
Source: Energy Information Agency
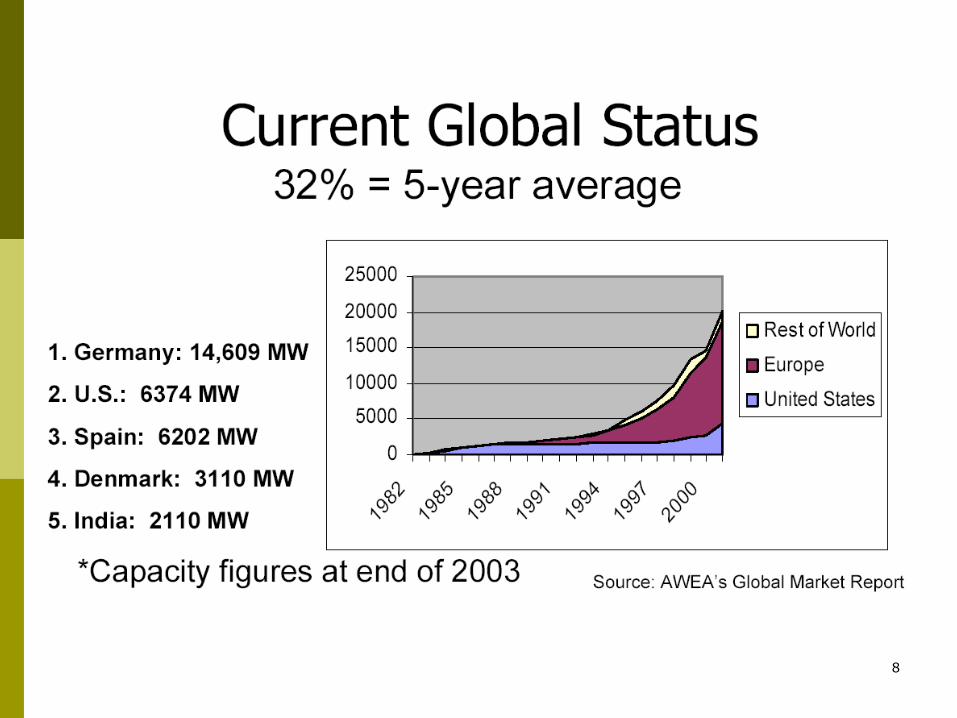
8
10
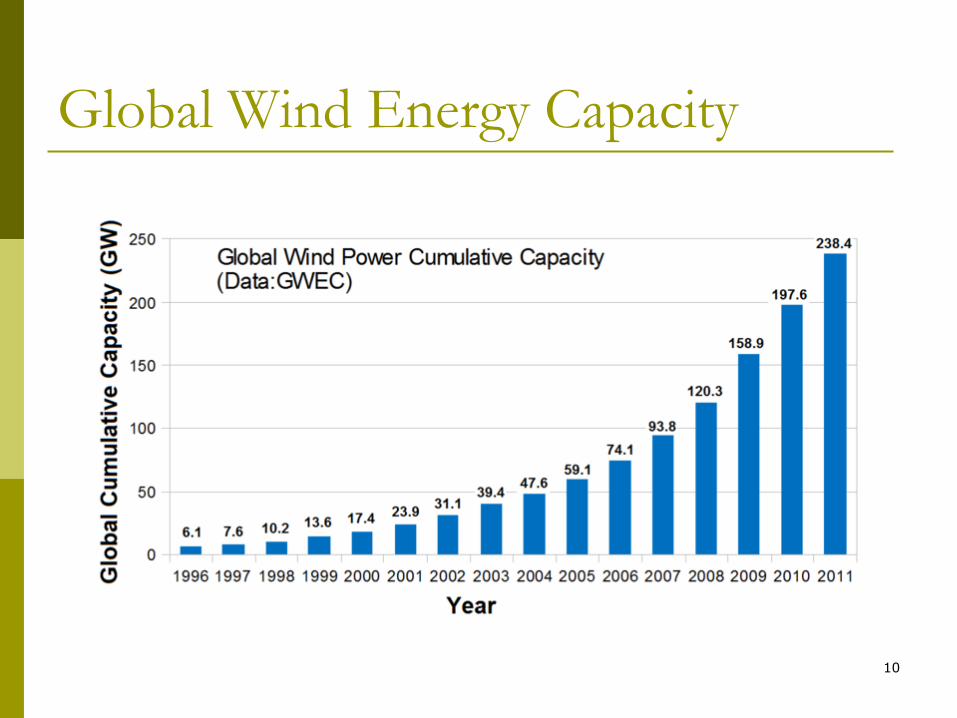
Global Wind Energy Capacity

11
Wind Energy Projects in AC
The Arab Countries (AC) had installed wind energy:
Egypt: 550 MW
Tunisia: 750 GWh annually
Morocco: 289 MW
Algeria: 10 MW
Lybia: 62 MW
Source: http://www.renewablesb2b.com/ahk_egypt/en/portal/index/news/show/592e52e2b91fb7a9

12
Zafarana farm, Egypt – 550MW
• Operate with wind speeds
between 7-10 m/s
• Total of 710 turbines
• 600-850 KW of electricity
each turbine
• Construction began 2001
• Ended by 2010
• Hub height – 47m
Video
13
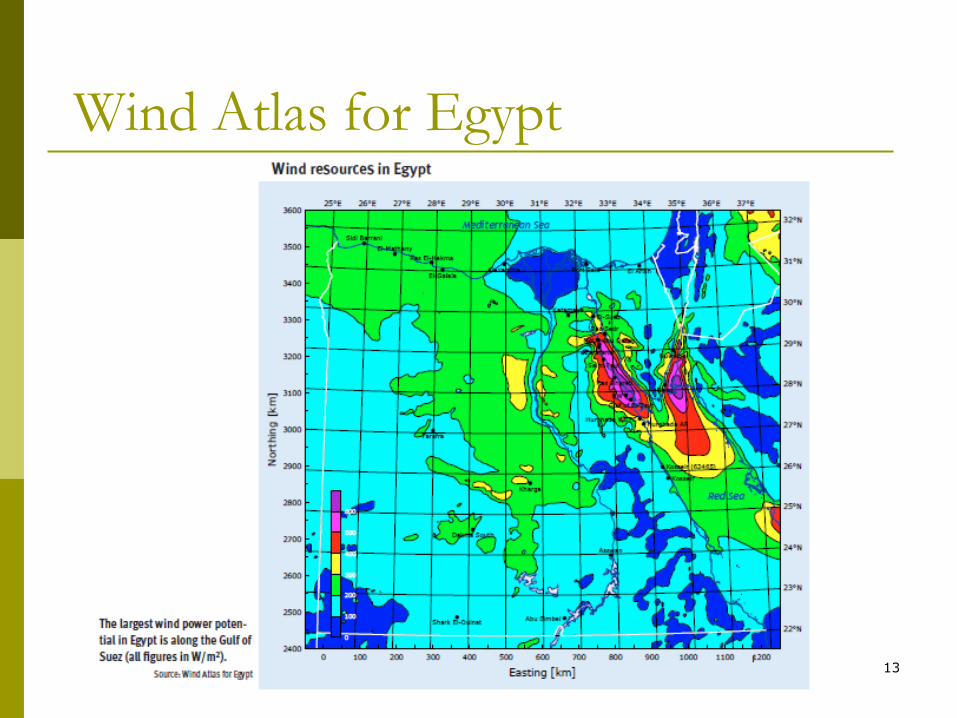
Wind Atlas for Egypt

14
Wind Power Advantages

15
Advantages of Wind Power
Environmental
Economic Development
Fuel Diversity & Conservation
Cost Stability
16
Environmental Benefits
No air pollution: One 750-kW wind turbine
would displace 1.5 million kg of carbon dioxide
per year
No greenhouse gasses
Does not pollute water with mercury
No water needed for operations
Wind energy system operations do not generate air or water emissions and do not produce hazardous waste. Nor do they deplete natural resources such as coal, oil, or gas, or cause environmental damage through resource extraction and transportation. Wind's pollution-free electricity can help reduce the environmental damage caused by power generation.

17
Pollution from Electric Power
Source: Northwest Foundation, 12/97
23%
28%
33%
34%
70%
0% 20% 40% 60% 80%
Toxic Heavy Metals
Particulate Matter
Nitrous Oxides
Carbon Dioxide
Sulfur Dioxide
Percentage of U.S. Emissions
Electric power plants are primary source of industrial air pollution

18
Economic Development Benefits
Expanding Wind Power development brings jobs to rural communities
Increased tax revenue
Purchase of goods & services

19
Wind farms can revitalize the economy of rural communities, providing steady income through lease or royalty payments to farmers and other landowners. Although leasing arrangements can vary widely, a reasonable estimate for income to a landowner from a single utility-scale turbine is about $3,000 a year. For a 250-acre farm, with income from wind at about $55 an acre, the annual income from a wind lease would be $14,000, with no more than 2-3 acres removed from production. Such a sum can significantly increase the net income from farming. Farmers can grow crops or raise cattle next to the towers. Farmers are not the only ones in rural communities to find that wind power can bring in income. In Spirit Lake, Iowa, the local school is earning savings and income from the electricity generated by a turbine. In the district of Forest City, Iowa, a turbine recently erected as a school project is expected to save $1.6 million in electricity costs over its lifetime. Additional income is generated from one-time payments to construction contractors and suppliers during installation, and from payments to turbine maintenance personnel on a long-term basis. Wind farms also expand the local tax base, and keep energy dollars in the local community instead of spending them to pay for coal or gas produced elsewhere. Finally, wind also benefits the economy by reducing "hidden costs" resulting from air pollution and health care. Several studies have estimated that 50,000 Americans die prematurely each year because of air pollution. •Each MW of wind power development provides 2.5-3 jobs years of employment. •Wind provides 1 skilled operations and management job for every 10 turbines installed. •Wind plants can be a valuable source of property tax income for local governments.
Economic Development Benefits

20
Fuel Diversity Benefits
Domestic energy source
Inexhaustible supply ال ينضب
Small, dispersed design
US winds could generate more electricity in 15 years than all of Saudi Arabia’s oil—without being depleted. Wind facilities consist of small generators that cannot be easily be damaged at the same time and are easy to replace. If a wind facility is damaged, there is no secondary risk to the public, such as in the release of radioactivity, explosions, or the breaching of a dam. Wind plants can be built quickly to respond to electricity supply shortages.

21
Cost Stability Benefits
Flat-rate pricing
Hedge التحوط against fuel price volatility risk
Wind electricity is inflation-proof واقية من التضخم

22
Wind Power Design

23
Air density
= ½ × air density × swept rotor area × (wind speed)3
A V3
Area = r2 Instantaneous Speed
(not mean speed)
kg/m3 m2 m/s
Power in the Wind (Watts)

24
Wind Energy Natural Characteristics
Wind Speed
Wind energy increases with the cube of the wind speed
10% increase in wind speed translates into 30% more electricity
2X the wind speed translates into 8X the electricity
Height
Wind energy increases with height to the 1/7 power
2X the height translates into 10.4% more electricity
71
1
2
1
2
h
h
v
v
h
h
25
Wind Energy Natural Characteristics
Air density Wind energy increases proportionally with air density
Humid climates have greater air density than dry climates
Lower elevations have greater air density than higher elevations
Blade swept area Wind energy increases proportionally with swept area of the
blades Blades are shaped like airplane wings
10% increase in swept diameter translates into 21% greater swept area
Longest blades up to 164 m in diameter Resulting in 220 m total height

26
Betz Limit
Theoretical maximum energy extraction from wind = 16/27 = 59.3%
Undisturbed wind velocity reduced by 1/3
Albert Betz (1928)
Betz Limit with values of 0.35-0.45
Only 10-30% of the power of the wind is actually converted into usable electricity

Example of Wind Power
Largest wind turbines with a rotor blade diameter of 164 m
Air density = 1.225 kg/m3
Wind speed = 14 m/s
Rotors sweep area = π x r2 = 21,124 m2
Wind Power = 0.5 x 21,124 x 1.225 x (14)3
= 35,500,000 Watts (35MW)
The turbine is rated at 8MW due to Betz Limit
Total wind power = 8MW x 8,760 hours =
= 70GWh/year 27
28
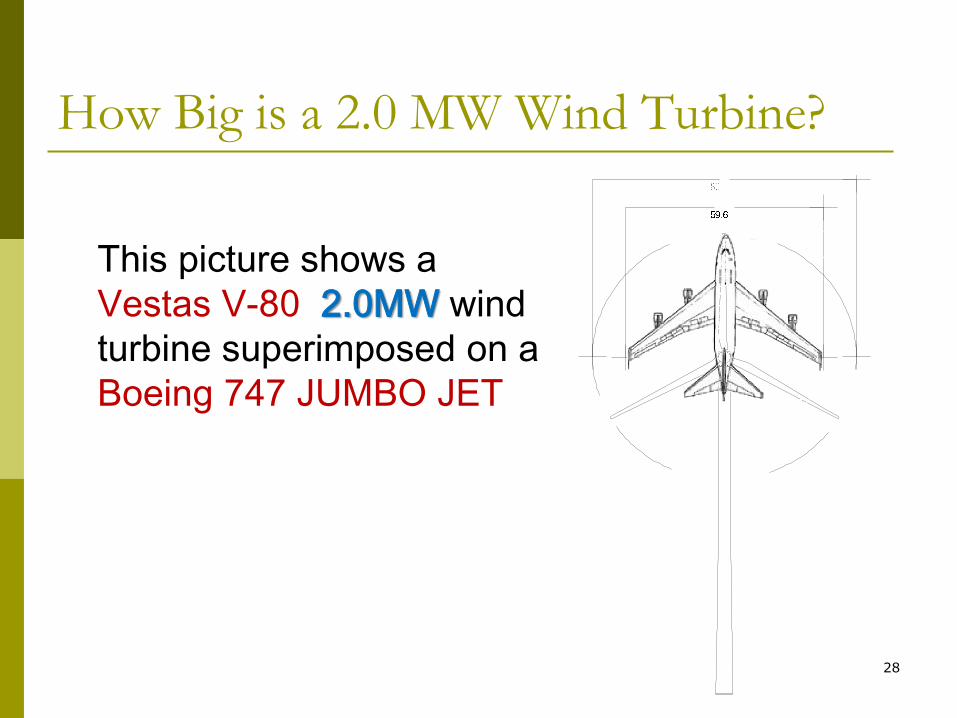
This picture shows a
Vestas V-80 2.0MW wind
turbine superimposed on a
Boeing 747 JUMBO JET
How Big is a 2.0 MW Wind Turbine?

29
0
500
1000
1500
2000
2500
Po
wer,
KW
MPH 50 40 30 20 10
Wind Turbine Power Curve
Vestas V80 2.0MW Wind Turbine
MPS 25 20 15 10 5
30
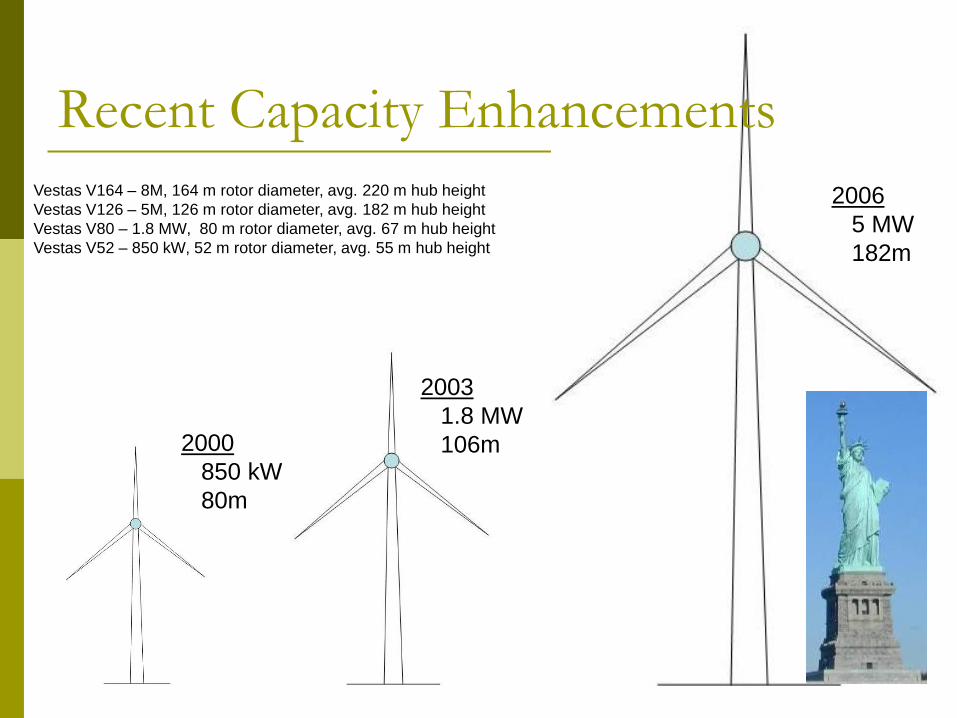
2003
1.8 MW
106m
2000
850 kW
80m
2006
5 MW
182m
Recent Capacity Enhancements
Vestas V164 – 8M, 164 m rotor diameter, avg. 220 m hub height
Vestas V126 – 5M, 126 m rotor diameter, avg. 182 m hub height
Vestas V80 – 1.8 MW, 80 m rotor diameter, avg. 67 m hub height
Vestas V52 – 850 kW, 52 m rotor diameter, avg. 55 m hub height

31
1. Hub controller 11. Blade bearing
2. Pitch cylinder 12. Blade
3. Main shaft 13. Rotor lock system
4. Oil cooler 14. Hydraulic unit
5. Gearbox 15. Machine foundation
6. Top Controller 16. Yaw gears
7. Parking Break 17. Generator
8. Service crane 18. Ultra-sonic sensors
9. Transformer 19. Meteorological gauges
10. Blade Hub
10
16 17
12
5
12
Nacelle Components
32
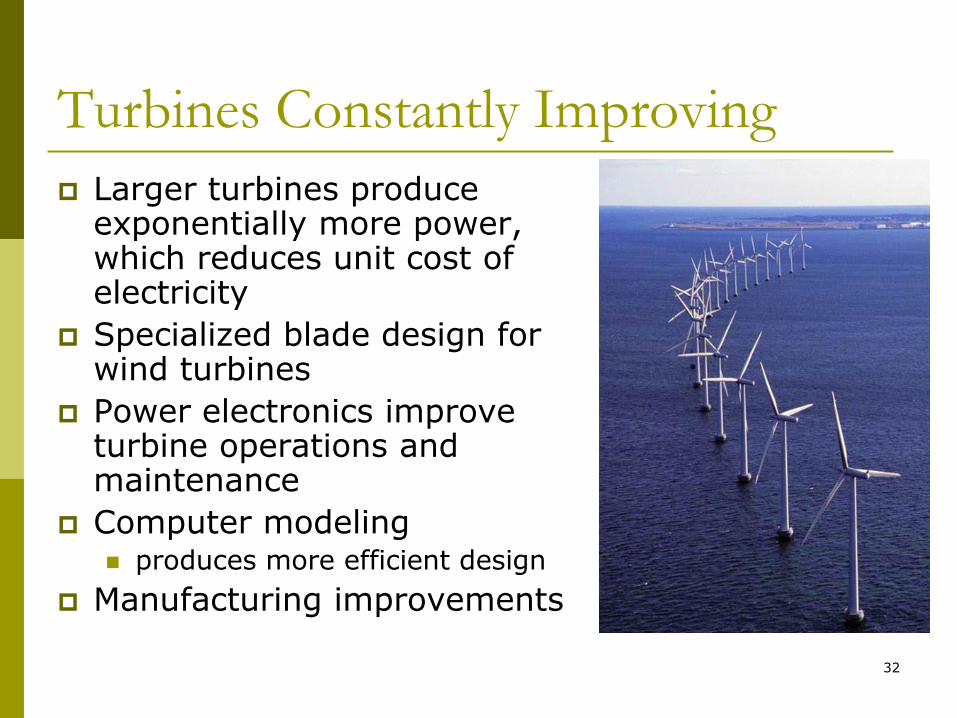
Turbines Constantly Improving
Larger turbines produce exponentially more power, which reduces unit cost of electricity
Specialized blade design for wind turbines
Power electronics improve turbine operations and maintenance
Computer modeling produces more efficient design
Manufacturing improvements
33
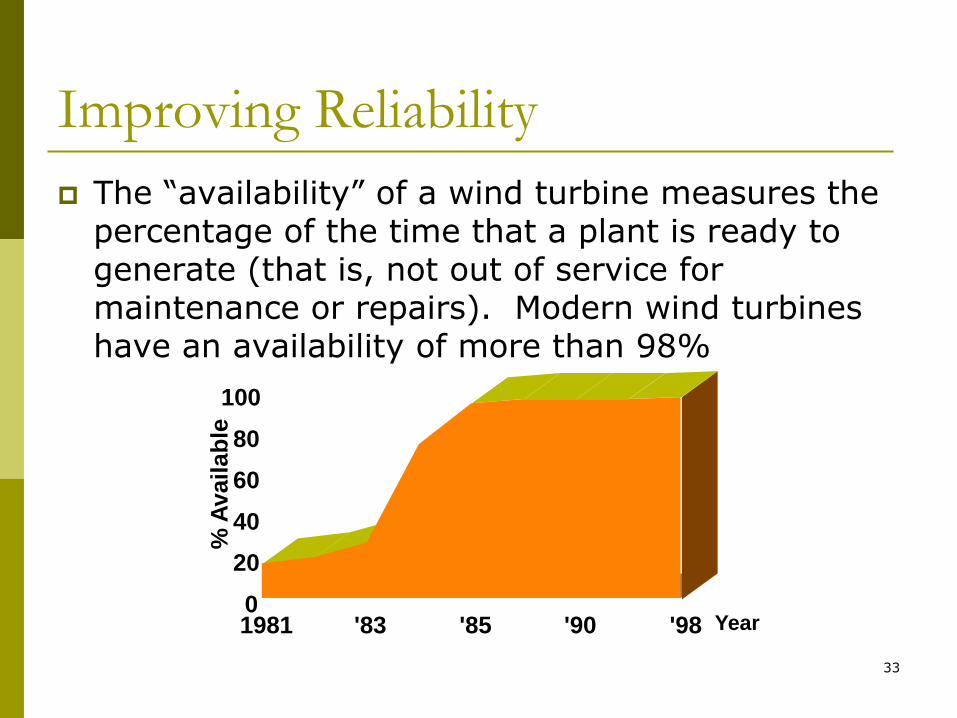
Improving Reliability
The “availability” of a wind turbine measures the percentage of the time that a plant is ready to generate (that is, not out of service for maintenance or repairs). Modern wind turbines have an availability of more than 98%
1981 '83 '85 '90 '98
% A
vail
ab
le
Year 0
20
40
60
80
100
34
Wind Project Siting

35
Wind Power Class
10 m (33 ft) Speed
m/s (mph)
50 m (164 ft) Speed m/s
(mph)
1
0 0
4.4 (9.8) 5.6 (12.5) 2
5.1 (11.5) 6.4 (14.3) 3
5.6 (12.5) 7.0 (15.7) 4
6.0 (13.4) 7.5 (16.8) 5
6.4 (14.3) 8.0 (17.9) 6
7.0 (15.7) 8.8 (19.7) 7
9.4 (21.1) 11.9 (26.6)
Wind speed is for standard sea-level conditions.
Wind Power Classes

36
Average wind power

37
Siting a Wind Farm
Winds Minimum class 4 desired for utility-scale wind farm (>7
m/s at hub height)
Transmission Distance, voltage excess capacity
Permit approval Land-use compatibility
Public acceptance
Visual, noise, and bird impacts are biggest concern
Land area Economies of scale in construction
Number of landowners
Land-use Guidelines
Ranges from 7.5 MW per mile for 660-kW turbines to 11.8 MW per mile for 1.5-MW turbines
Arrays: For a multi-rowed array (spaced 3x10 rotor diameters), 15-20 of acres of land is needed per MW of
capacity. Only 5% of this area is needed for turbines, access roads, and other equipment.

38
Wind Disadvantages

39
Market Barriers
Siting
Avian = birds
Noise
Aesthetics
Intermittent source of power مصدرمتقطع
Transmission constraints
Operational characteristics different from conventional fuel sources
Financing

40
Wind Energy and the Grid
Pros
Small project size
Short/flexible development time
Dispatchability
Cons
Generally remote location
Grid connectivity -- lack of transmission capability
Intermittent output
Only When the wind blows (night? Day?)
Low capacity factor
Predicting the wind -- we’re getting better
41
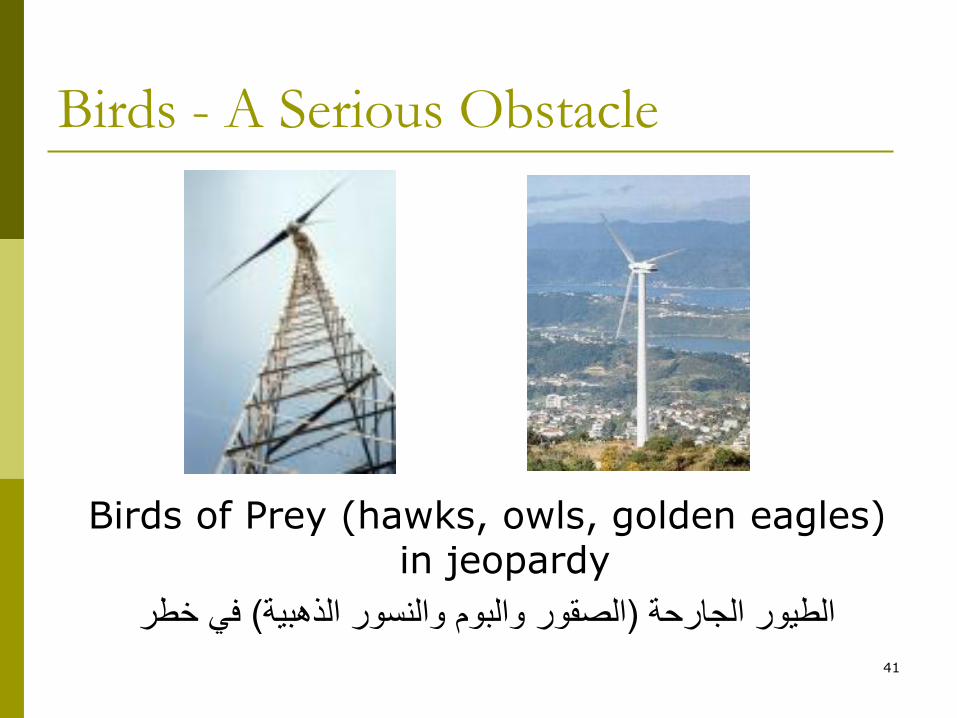
Birds - A Serious Obstacle
Birds of Prey (hawks, owls, golden eagles) in jeopardy
في خطر( الصقور والبوم والنسور الذهبية)الطيور الجارحة
42
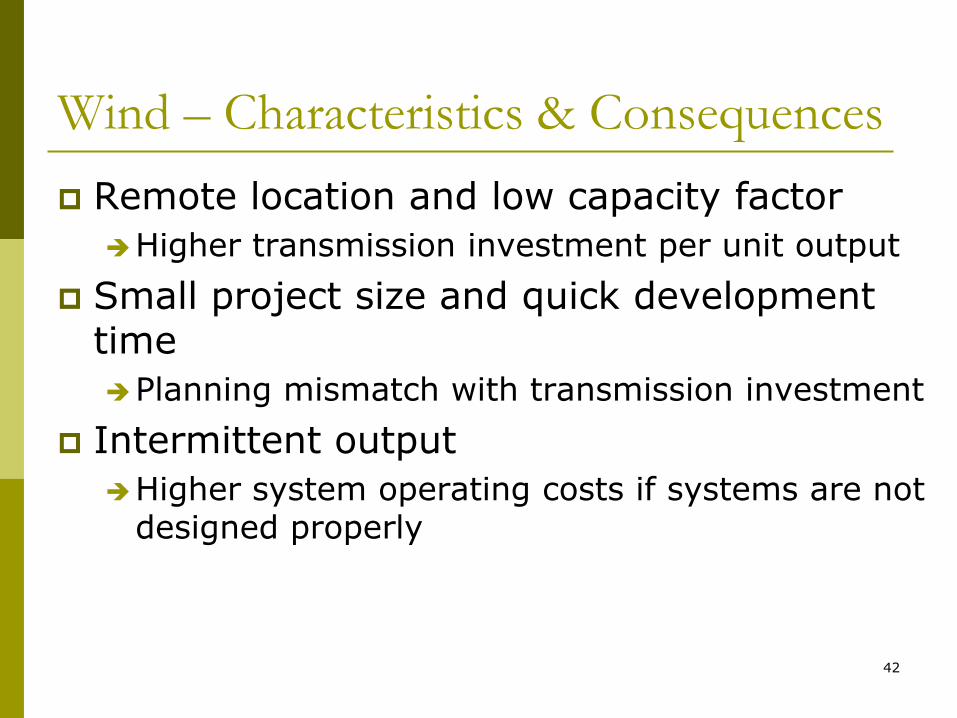
Wind – Characteristics & Consequences
Remote location and low capacity factor
Higher transmission investment per unit output
Small project size and quick development time
Planning mismatch with transmission investment
Intermittent output
Higher system operating costs if systems are not designed properly

43
Wind Economics

44
Wind Farm Design Economics
Key Design Parameters
Mean wind speed at hub height
Capacity factor
Start with 100%
Subtract time when wind speed less than optimum
Subtract time due to scheduled maintenance
Subtract time due to unscheduled maintenance
Subtract production losses
Dirty blades, shut down due to high winds
Typically 33% at a Class 4 wind site

45
Wind Farm Financing
Financing Terms
Interest rate
Loan term
Up to 15 years
46
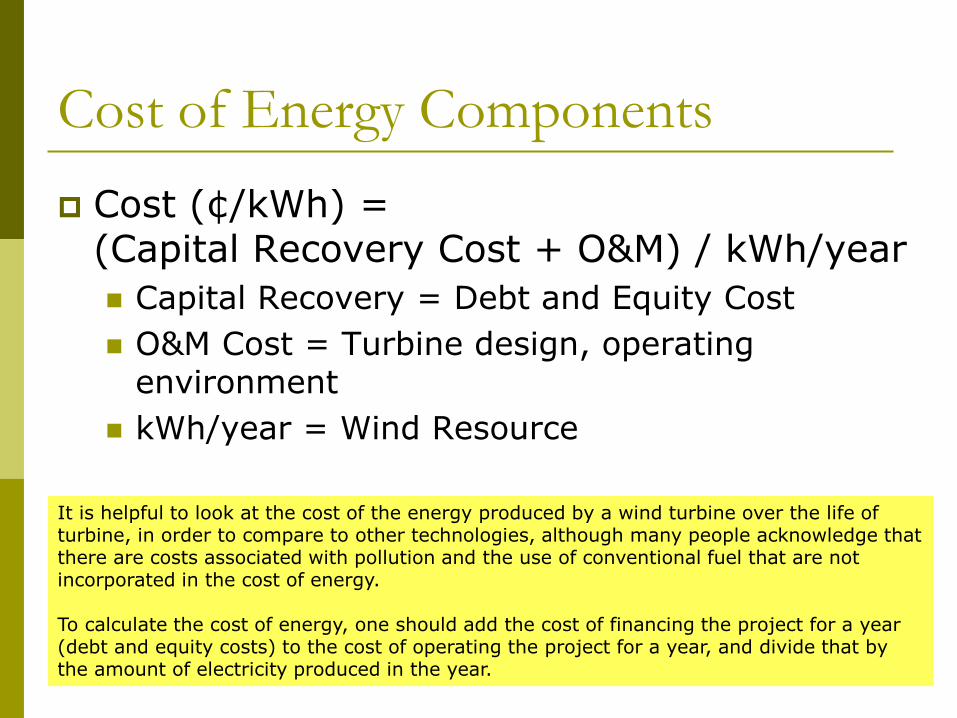
Cost of Energy Components
Cost (¢/kWh) = (Capital Recovery Cost + O&M) / kWh/year
Capital Recovery = Debt and Equity Cost
O&M Cost = Turbine design, operating environment
kWh/year = Wind Resource
It is helpful to look at the cost of the energy produced by a wind turbine over the life of turbine, in order to compare to other technologies, although many people acknowledge that there are costs associated with pollution and the use of conventional fuel that are not incorporated in the cost of energy. To calculate the cost of energy, one should add the cost of financing the project for a year (debt and equity costs) to the cost of operating the project for a year, and divide that by the amount of electricity produced in the year.
47
$0.00
$0.10
$0.20
$0.30
$0.40
1980 1984 1988 1991 1995 2000 2005
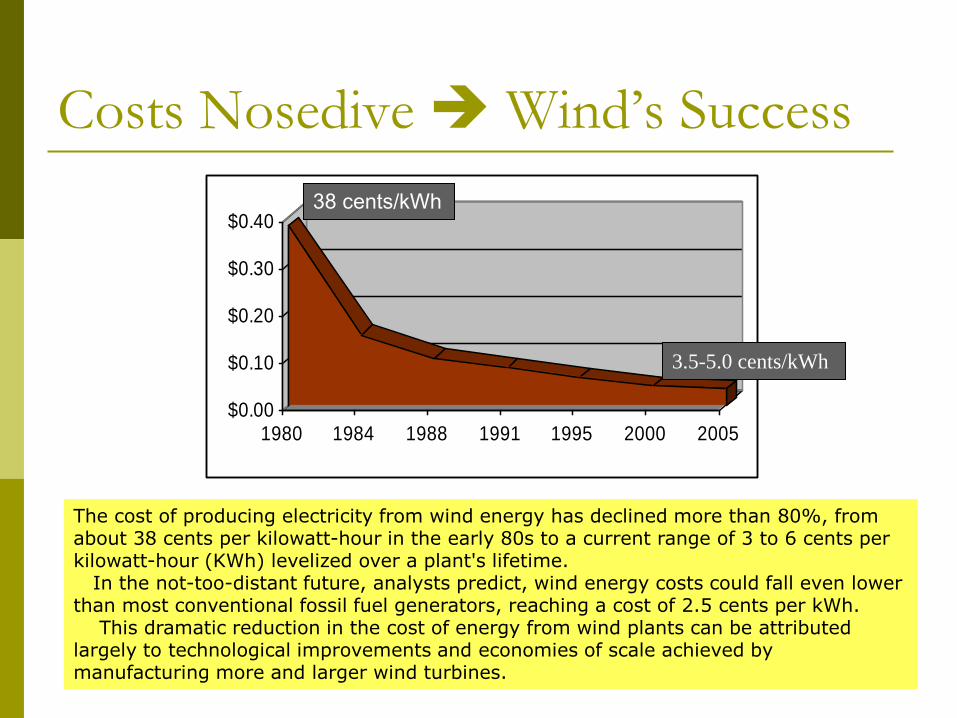
38 cents/kWh
Costs Nosedive Wind’s Success
3.5-5.0 cents/kWh
The cost of producing electricity from wind energy has declined more than 80%, from about 38 cents per kilowatt-hour in the early 80s to a current range of 3 to 6 cents per kilowatt-hour (KWh) levelized over a plant's lifetime. In the not-too-distant future, analysts predict, wind energy costs could fall even lower than most conventional fossil fuel generators, reaching a cost of 2.5 cents per kWh. This dramatic reduction in the cost of energy from wind plants can be attributed largely to technological improvements and economies of scale achieved by manufacturing more and larger wind turbines.
48
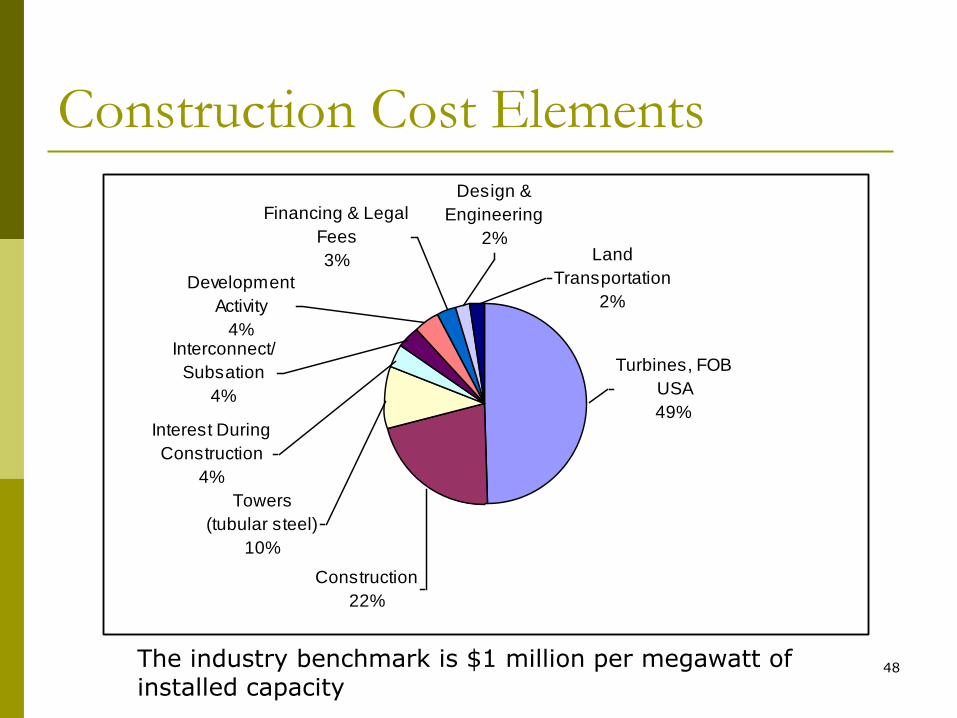
Construction Cost Elements
Turbines, FOB
USA
49%
Construction
22%
Towers
(tubular steel)
10%
Interest During
Construction
4%
Interconnect/
Subsation
4%
Land
Transportation
2%Development
Activity
4%
Design &
Engineering
2%
Financing & Legal
Fees
3%
The industry benchmark is $1 million per megawatt of installed capacity

49
0%
20%
40%
60%
80%
100%
750 kW 1500 kW 3000 kW
Wind Farm Component Costs
Balance of System
Transportation
Foundations
Tower
Control System
Drive Train Nacelle
Blades and Rotor
Wind Farm Cost Components
50
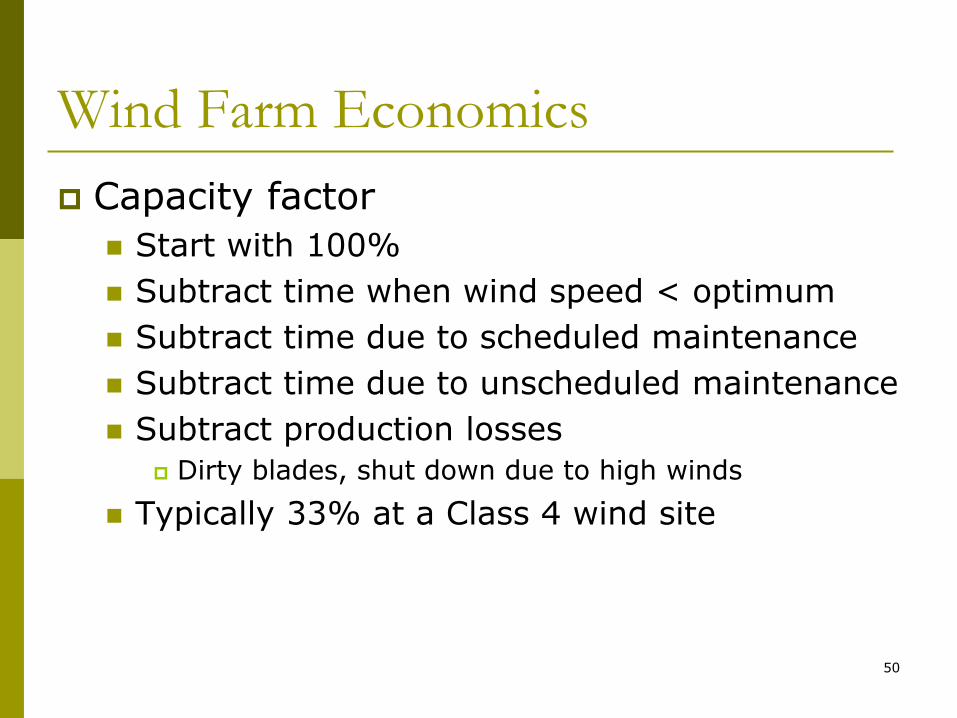
Wind Farm Economics
Capacity factor
Start with 100%
Subtract time when wind speed < optimum
Subtract time due to scheduled maintenance
Subtract time due to unscheduled maintenance
Subtract production losses
Dirty blades, shut down due to high winds
Typically 33% at a Class 4 wind site

51
Improved Capacity Factor
Performance Improvements due to:
Better siting
Larger turbines/energy capture
Technology Advances
Higher reliability
Capacity factors > 35% at good sites

52
Wind Farm Economics
Key parameter
Distance from grid interconnect
≈ $350,000/mile for overhead transmission lines in USA

53
Wind Farm Economics
Example
200 MW wind farm
Fixed costs - $1.23M/MW
Class 4 wind site
33% capacity factor
10 miles to grid
6%/15 year financing
100% finance
20 year project life
Determine Cost of Energy - CoE

54
Wind Farm Economics
Total Capital Costs $246M + (10 x $350K) = $249.5M
Total Annual Energy Production 200 MW x 1000 x 365 x 24 x 0.33 = 578,160,000 kWh
Total Energy Production 578,160,000 x 20 = 11,563,200,000 kWh
Capital Costs/kWh 3.3 ¢/kWh (2.2 without interest)
Operating Costs/kWh 1.6¢/kWh
Cost of Energy – New Facilities Wind – 4.9¢/kWh
Coal – 3.7¢/kWh
Natural gas – 7.0¢/kWh
Operating costs include:
Scheduled maintenance – 0.25¢
Unscheduled maintenance – 0.75¢
Levelized replacement costs – 0.40¢
other cost – 0.20¢

55
Wind Farm Development
56
Wind Farm Development
Key parameters
Wind resource
Zoning/Public Approval/Land Lease
Power purchase agreements
Connectivity to the grid
Financing
Tax incentives
57
Wind Farm Development
Wind resource Absolutely vital to determine finances
Wind is the fuel
Requires historical wind data Daily and hourly details
Install metrological towers Preferably at projected turbine hub height
Multiple towers across proposed site
Multiyear data reduces financial risk Correlate long term offsite data to support short term
onsite data

58
Wind Farm Development
Zoning/Public Approval/Land Lease
Obtain local and governmental approvals
Often includes Environmental Impact Studies
Impact to wetlands, birds
Negotiate lease arrangements with ranchers, farmers, etc.
Annual payments per turbine or production based
:ranchers مربي الماشية

59
Wind Farm Development
Power Purchase Agreements, PPA Must have upfront financial commitment from utility
15 to 20 year time frames
Utility agrees to purchase wind energy at a set rate
e.g. 5.9¢/kWh
Financial stability/credit rating of utility important aspect of obtaining wind farm financing
PPA only as good as the creditworthiness of the uitility
Utility goes bankrupt – you’re in trouble
11,563,200,000 kWh 1.0¢/kWh $115M

60
Wind Farm Development
Connectivity to the grid
Obtain approvals to tie to the grid
Obtain from grid operators
Power fluctuations stress the grid
Especially since the grid is operating near max capacity

61
Wind Farm Development
Financing
Once all components are settled…
Wind resource
Zoning/Public Approval/Land Lease
Power Purchase Agreements (PPA)
Connectivity to the grid
Turbine procurement
Construction costs
…Take the deal to get financed

62
Closing the Deal
Small developers utilize a “partnership flip
”وجهة الشراكة
Put the deal together
Sell it to a large wind owner
Large wind owner assumes ownership and builds the wind farm

63
Future Trends

64
Expectations for Future Growth
20,000 total turbines installed in 2010
6% of electricity supply by 2020
100,000 MW of wind power will be
installed by 2020

65
Future Cost Reductions
Financing Strategies
Manufacturing Economy of Scale
Better Sites and “Tuning” Turbines for Site Conditions
Technology Improvements

66
Future Tech Developments
Application Specific Turbines
Offshore
Limited land/resource areas
Transportation or construction limitations
Low wind resource
Cold climates

67
The Future of Wind - Offshore
•1.5 - 6 MW per turbine
•60-120 m hub height
•5 km from shore, 30 m deep
ideal
•Gravity foundation, pole, or
tripod formation
•Shaft can act as artificial
reef

68
Wind Energy Storage
Pumped hydroelectric George town facility – Completed 1967 Two reservoirs separated by 1000 vertical feet Pump water uphill at night or when wind energy
production exceeds demand Flow water downhill through hydroelectric turbines during
the day or when wind energy production is less than demand
About 70 - 80% round trip efficiency Raises cost of wind energy by 25% Difficult to find, obtain government approval and build
new facilities
Compressed Air Energy Storage Using wind power to compress air in underground storage
caverns Salt domes, empty natural gas reservoirs
Costly, inefficient

69
Hydrogen storage Use wind power to electrolyze
water into hydrogen Store hydrogen for use later in
fuel cells 50% losses in energy from
wind to hydrogen and hydrogen to electricity
25% round trip efficiency Raises cost of wind energy by
4X
Wind Energy Storage

70
Oceanic Energy
Next