wind feasibility study - suny canton · suny canton – wind feasibility study energy of 12.2 cents...
TRANSCRIPT

Submitted To:New York Power Authority
123 Main StreetWhite Plains, NY 10601Attention: Guy Sliker
Date:October 25, 2009
WIND FEASIBILITY STUDYSUNY Canton
Submitted By:Staci Clark, Assistant Program Manager
[email protected]: 518‐213‐0044 ext. 1010
Fax: 518‐213‐0045

P a g e | 2
SUNY Canton – Wind Feasibility Study
Executive Summary At the request of the New York Power Authority (NYPA), AWS Truewind (AWST) has performed a preliminary assessment of the feasibility of siting a wind system on the SUNY Canton campus. The analysis helped determine the appropriate size, model, hub height, and location for a wind system that could be installed at the facility.
In 2005, Greenman‐Pedersen, Inc. (GPI) performed a preliminary study to evaluate the feasibility of installing a wind turbine on the SUNY Canton campus and recommended three possible installation sites. Through the use of a Geographic Information System (GIS) and a site visit, AWST determined that the sites initially recommended would provide viable options for wind energy development. A large open field to the west of the campus (foundation lands) was also evaluated for wind energy development.
The campus entrance was determined to be the most attractive location for wind energy development. The site is approximately 160 meters from the Nevaldine Technology Center and southwest of the P7 parking lot. This decision was based on available land area, exposure to the wind, existing land uses, and proximity to residences and property boundaries.
The wind resource at the site was examined using windTrends and the MesoMap™ system. The proposed turbine location has a predicted mean annual wind speed of 5.27 m/s at 50 m above ground level and 5.80 m/s at 75 m above ground level. The uncertainty level on all wind speed estimates is approximately 0.35 m/s.
Local restrictions and setbacks were evaluated to select an appropriate turbine height and the facility’s time series load data was evaluated to determine the benefit of distributed generation. This comparison assisted in the determination of an appropriate wind turbine size and model. The Fuhrländer FL 600 was selected for analysis due to the relatively small available area at the entrance to the campus and restrictions on wind energy development in other areas.
Taking into account typical energy losses experienced by wind turbines, the average net annual energy output from 1997 – 2008 was estimated to be 789 MWh/yr and 1,066 MWh/yr for the 50 and 75 m tower heights, respectively. The net capacity factor for the FL 600 was predicted to be approximately 15.0% and 20.3% for the two heights. The production statistics for the FL 600 are summarized in Table 1.
Table 1: Average Annual Wind Energy Production and Energy Offset for FL 600
Performance Indicator 50 m 75 m Average Annual Wind Speed 5.27 m/s 5.80 m/s Average Annual Net Energy Production 789 MWh 1,066 MWh Net Capacity Factor 15.0% 20.3% Offset for Given Load 10.9% 14.6%
A preliminary economic evaluation assumed a break‐even scenario over a 20‐year expected project lifetime (20‐year payback period, 0% return on equity). The analysis resulted in an estimated cost of

P a g e | 3
SUNY Canton – Wind Feasibility Study
energy of 12.2 cents per kWh using a 50 m tower or 10.3 cents per kWh using a 75 m tower. In order to match the college’s current energy rate from a wind turbine on campus, NYPA would have to supply 42% of the initial invested capital ($669,392) for the 50 m tower scenario, or 29% of the initial invested capital ($508,469) for the 75 m tower scenario. The preliminary economic analysis assumes a best‐case scenario in which all energy generated by the turbine is used onsite and no energy is sold back to the grid at the utility’s avoided cost rate.
Potential barriers to installing a renewable energy system at the proposed location include:
• Obtaining necessary permissions to site the turbine at the campus entrance,
• Campus/community reaction
• Final economics for a wind system installation.

P a g e | 4
SUNY Canton – Wind Feasibility Study
Table of Contents Executive Summary ....................................................................................................................................... 2
Table of Contents .......................................................................................................................................... 4
Table of Tables .............................................................................................................................................. 5
Table of Figures ............................................................................................................................................. 6
1. Introduction ......................................................................................................................................... 7
2. Review of Prior Feasibility Study .......................................................................................................... 8
3. Site Selection ...................................................................................................................................... 10
4. Wind Resource Definition .................................................................................................................. 14
5. Wind Turbine Selection ...................................................................................................................... 19
6. Load Evaluation and Energy Production Potential ............................................................................. 21
7. Electrical Interconnection Options ..................................................................................................... 26
8. Operations and Maintenance Planning .............................................................................................. 30
9. Economics .......................................................................................................................................... 31
10. Environmental and Siting Issues .................................................................................................... 35
11. Conclusions and Recommendations .............................................................................................. 41
12. Appendices ..................................................................................................................................... 43
P a g e | 5
SUNY Canton – Wind Feasibility Study
Table of Tables Table 1: Average Annual Wind Energy Production and Energy Offset for FL 600 ........................................ 2
Table 2: Coordinates for the Initial Areas of Interest for Turbine Installation ........................................... 10
Table 3: Physical Characteristics of the Fuhrländer FL ............................................................................... 20
Table 4: Electrical and Mechanical Characteristics of the Fuhrländer Turbines ......................................... 20
Table 5: Assumed wind turbine energy losses for one FL 600 .................................................................... 21
Table 6: Average Annual Wind Energy Production for FL 600 .................................................................... 21
Table 7: Wind Energy Production and Energy Offset for FL 600 from 8/1/2008 ‐ 7/31/2009 ................... 24
Table 8: IEEE 1547 Protection Standards ................................................................................................... 28
Table 9: List of the Closest NYS Wind Projects ........................................................................................... 30
Table 10: FL 600 Installed Cost Breakdown ................................................................................................ 33
Table 11: Economic/Financial Input Ranges ............................................................................................... 33
Table 12: Noise Emission Levels for the FL 600 ......................................................................................... 36
P a g e | 6
SUNY Canton – Wind Feasibility Study
Table of Figures Figure 1: SUNY Canton Campus Map ......................................................................................................... 10
Figure 2: Initial Areas of Interest for Turbine Installation .......................................................................... 11
Figure 3: Area 2 from Across the Street looking NNW at the Potential Turbine Location ........................ 13
Figure 4: Wind Rose for Proposed Site ...................................................................................................... 14
Figure 5: Wind Resource Map for Proposed Site ....................................................................................... 15
Figure 6: Historic Annual Wind Distribution for Proposed Site .................................................................. 16
Figure 7: Wind Speed Frequency Distribution for Proposed Site ............................................................... 16
Figure 8: Monthly Wind Distribution for Proposed Site ............................................................................. 17
Figure 9: Seasonal Wind Distribution for Proposed Site ............................................................................. 17
Figure 10: Diurnal Wind Distribution for Proposed Site ............................................................................ 18
Figure 11: Fuhrländer 50m/ 600 kW .......................................................................................................... 19
Figure 12: Annual Energy Production at Two Hub Heights ......................................................................... 22
Figure 13: Seasonal Energy Production at Two Hub Heights ...................................................................... 22
Figure 14: Monthly Energy Production at Two Hub Heights ...................................................................... 23
Figure 15: Diurnal Energy Production at Two Hub Heights ........................................................................ 23
Figure 16: Example comparison of turbine production and campus consumption (summer) ................... 24
Figure 17: Example comparison of turbine production and campus consumption (winter) ..................... 25
Figure 18: SUNY Canton 4,160 V / 23 kV Substation ................................................................................. 26
Figure 19: FL 600 Power Converter (photo courtesy of Lorax‐Energy) ...................................................... 27
Figure 20: Wind Turbine Noise .................................................................................................................. 36
Figure 21: Causes of Bird Fatalities ............................................................................................................. 38

P a g e | 7
SUNY Canton – Wind Feasibility Study
1. Introduction
At the request of the NYPA, AWST has performed a preliminary assessment of the feasibility of siting a wind system on the SUNY Canton campus. The results of this study are intended to facilitate future decision‐making and the identification of logical next steps.
The feasibility evaluation consists of the following components:
• Review of Prior Feasibility Study: A prior feasibility study from 2005 by GPI was evaluated.
• Site Selection: Using a desktop analysis and site visit, AWST evaluated the available land area, exposure to the wind, existing land uses, and proximity to residences and property boundaries.
• Wind Resource Definition: The wind resource at the proposed project location was analyzed and the annual average and diurnal, monthly, and seasonal variations are presented.
• Wind Turbine Selection: A review of available technologies and other factors led to recommendations on the turbine model for the specific project site.
• Load Evaluation and Energy Production Potential: The potential energy generation of a Fuhrländer FL 600 kW wind turbine was determined using the modeled wind resource data, the manufacturer supplied power curve, and expected system and environmental loss factors. Using supplied time series load data, the theoretical energy production was compared with the facility’s consumption on an hourly basis.
• Electrical Interconnection Options: The connection of an FL 600 wind turbine to the facility was designed to minimize costs and energy losses.
• Operation and Maintenance Planning: A review of available maintenance and warranty programs is presented, along with locations of nearby sites featuring wind turbines from the same manufacturer.
• Economics: The estimated cost of energy was computed for a single turbine installation at SUNY Canton.
• Environmental Issues: Visual impact, noise, FAA regulations, birds and bats, land cover/use, archeological/historical, and other issues are common obstacles to wind projects. These issues were discussed and recommendations were presented on how best to deal with each issue.
Finally, the Conclusions and Recommendations section summarizes the findings and suggests future development activities.

P a g e | 8
SUNY Canton – Wind Feasibility Study
2. Review of Prior Feasibility Study
In 2005, GPI performed a preliminary study to evaluate the feasibility of installing a wind turbine on the SUNY Canton campus. The study assessed the wind energy potential, general technology and installation considerations, and economics of a potential wind system at SUNY Canton.
The GPI feasibility study assessed three potential areas for wind development:
1. West of the water tower, between the water tower and the north/south access road 2. North of the water tower, across the east/west access road 3. In the woods west of the water tower, halfway between the north/south access roads and the
power lines
GPI selected the Area 3 as the most favorable for a wind system installation. AWST reviewed these three sites and determined that the proposed Area 1 was too close to a neighboring residential development and a nearby water tower to meet local regulations. Similarly, Area 3, although recommended in the GPI report, was omitted due to required structure setbacks. AWST selected Area 2 from the GPI report as the best location for a potential wind system.
The GPI feasibility study computed net energy estimates by obtaining wind data from the 2005 version of the New York State Wind Map developed by Truewind Solutions (now AWST). This data included wind speed data at a 65 meter hub height. In order to provide a better evaluation of the wind energy system, the AWST feasibility study includes modeled wind resource data on an hourly basis.
The GPI feasibility study evaluated the installation of three Fuhrlander turbine sizes: 1,000 kW, 600 kW, and 250 kW. GPI employed the WindCAD Turbine Performance Model to compute annual energy estimates for each turbine model. The study determined that the 1,000 kW turbine would have an average output of 176 kW (corresponding to 1,543 MWh of annual energy generation), accounting for approximately 18% of Canton’s annual energy consumption. While this analysis provides a reasonable approximation of the annual energy generation of the turbine, the analysis did not compute hourly generation potential. The AWST study used hourly wind resource data to create a theoretical hourly energy production from the wind energy system. This methodology allowed the annual average and hourly production for load matching to be calculated.
The installed project cost was estimated to be $1,978 per kW in the GPI study. The study assessed the cost of energy based on this installed project cost, both with and without considering the effect of potential grants and energy cost offsets. The study considered the effect of applying the 25% USDA grant for rural communities and the 15% NYSERDA rebate. Installed project costs have risen dramatically since the 2005 report was issued and renewable energy incentives have changed; the AWST study analyzed present economic conditions to better determine the current feasibility of the project. The AWST analysis assumed that a SUNY Canton project would be eligible for a 30% cash grant according to The American Recovery and Reinvestment Act of 2009, but not eligible for the Production Tax Credit, Investment Tax Credit, or MACRS depreciation schedule, since SUNY Canton is a non‐taxable government entity and the associated foundation is a non‐profit organization.

P a g e | 9
SUNY Canton – Wind Feasibility Study
An assessment of environmental issues was not performed in the original feasibility study conducted for SUNY Canton by GPI; however, some key points were identified in the site visit evaluation.

P a g e | 10
SUNY Canton – Wind Feasibility Study
3. Site Selection
SUNY Canton, Figure 1, is a two and four‐year state college for technology, health, management and public service.
Figure 1: SUNY Canton Campus Map
Initially, AWST evaluated several areas of interest for the installation of a wind system, given as coordinates in Table 2 and shown in Figure 2. These locations were visited during a site visit on September 21, 2009.
Table 2: Coordinates for the Initial Areas of Interest for Turbine Installation
Site Designation Description Latitude Longitude Area 1 Campus Entrance #1 44.599750° ‐75.185529° Area 2 Campus Entrance #2 44.601220° ‐75.185576° Area 3 Foundation Lands 44.604660° ‐75.202030°

P a g e | 11
SUNY Canton – Wind Feasibility Study
Figure 2: Initial Areas of Interest for Turbine Installation
Residence
Residence

P a g e | 12
SUNY Canton – Wind Feasibility Study
While those three areas present enough space and access for a wind system installation, possible zoning restrictions were considered to further evaluate the sites. Canton, NY does not have specific regulations on the siting of wind energy systems; however, a model local law for St. Lawrence County gives possible restrictions that will be encountered through the permitting process. The St. Lawrence County model local law suggests the following setbacks and siting requirements for municipalities within the county:
• Towers may only be located in Wind Overlay Zones; defined by the town,
• Systems must be located at least 500 ft from the nearest site boundary/roads, and wetlands/water bodies,
• Systems must be located at least 1.5 times its height from any structure and 1000 ft from the nearest residence (including buildings such as dormitories, schools, or other buildings used for educational purposes),
• Maximum structure height is 500 ft
• Minimum noise of 50 dbA at nearest off‐site building, based on independent certification
• Required studies for DEIS include: shadow flicker, visual impact, fire protection, noise analysis, property value analysis, electromagnetic interference, transportation impacts, ground water impacts, cultural resources, and wildlife impacts.
Using the above recommendations, Area 3 was eliminated due to the distance of transmission required to interconnect to the campus’ existing electrical infrastructure. Additionally, there were several residences to the east and south of Area 3, which may impact permitting. Area 1 was eliminated due to its close proximity to the campus water tower and neighboring residences. Area 2, shown in Figure 3, was determined to offer the more feasible option for wind energy development. This location meets the example local law requirements for external boundary lines and structures; however, the relatively small space forces restrictions on the size of the wind turbine. Since the model local law only applies to neighboring properties and boundary lines, the university will have some flexibility in siting the turbine near university owned buildings/roads. The turbine should be centrally located within this area to increase distances from nearby roads and the P7 parking lot.

P a g e | 13
SUNY Canton – Wind Feasibility Study
Figure 3: Area 2 from Across the Street looking NNW at the Potential Turbine Location

P a g e | 14
SUNY Canton – Wind Feasibility Study
4. Wind Resource Definition
AWST estimated the wind resource for the proposed location at two possible tower heights, 50 m and 75 m, using a virtual meteorological mast (VMM) analysis. A VMM analysis produces a representative calendar year of hourly wind speed, direction, temperature, atmospheric pressure, and air density at a client‐specified location.
A virtual meteorological mast was created at the proposed turbine location for both heights using windTrends, which produced hourly meteorological data (wind speed, direction, temperature, pressure, and air density). The windTrends data set was adjusted using a higher resolution windNavigator® data and sheared to the appropriate hub height. AWST made multiple refinements to coupled mesoscale and microscale model outputs, and then, using an estimated wind profile for the chosen site, scaled this data to each proposed hub height (50 and 75 m). Thus, a complete climatology of typical conditions was created at the selected heights above ground.
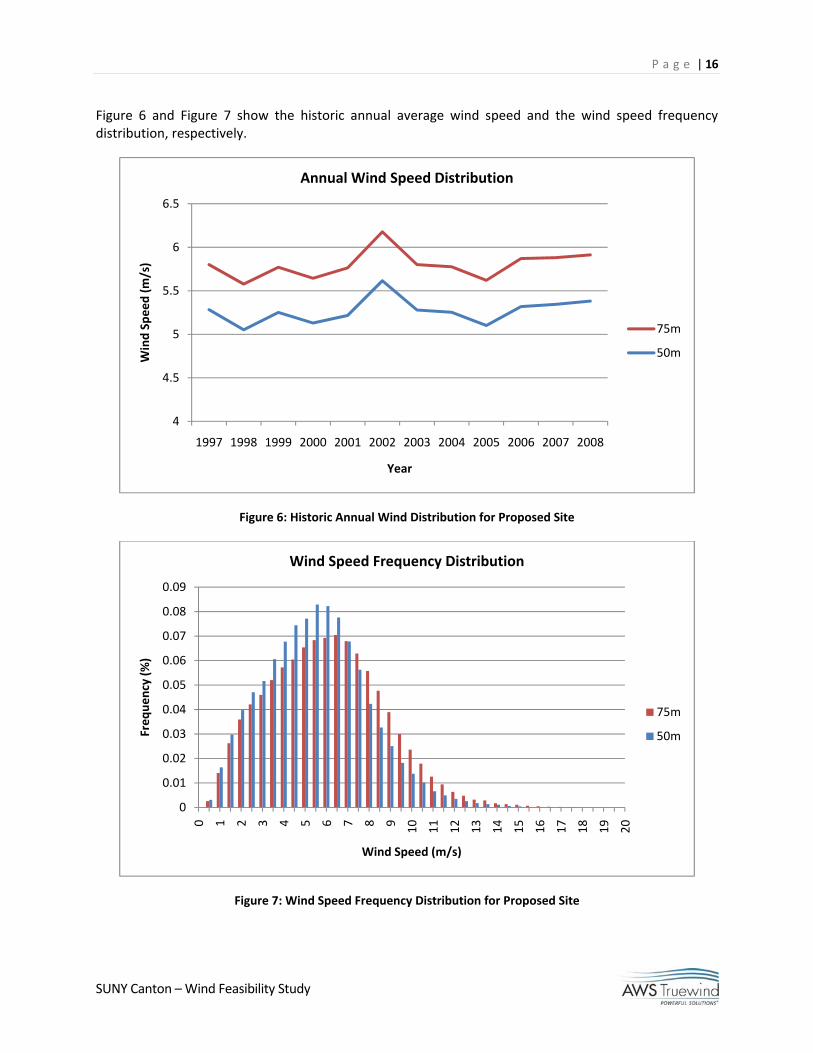
The average annual wind speed at the proposed location is approximately 5.27 m/s and 5.80 m/s at 50 and 75 m, respectively. The wind rose is shown in Figure 4 and the wind resource map at 60 meters is included in Figure 5. Wind resource estimates are intended for this preliminary feasibility study. For applications requiring greater accuracy, the wind resource estimates should be confirmed by measurement.
Figure 4: Wind Rose for Proposed Site

P a g e | 15
SUNY Canton – Wind Feasibility Study
Figure 5: Wind Resource Map for Proposed Site
P a g e | 16
SUNY Canton – Wind Feasibility Study
Figure 6 and Figure 7 show the historic annual average wind speed and the wind speed frequency distribution, respectively.
Figure 6: Historic Annual Wind Distribution for Proposed Site
Figure 7: Wind Speed Frequency Distribution for Proposed Site
4
4.5
5
5.5
6
6.5
1997 1998 1999 2000 2001 2002 2003 2004 2005 2006 2007 2008
Wind Speed (m
/s)
Year
Annual Wind Speed Distribution
75m
50m
0
0.01
0.02
0.03
0.04
0.05
0.06
0.07
0.08
0.09
0 1 2 3 4 5 6 7 8 9 10 11 12 13 14 15 16 17 18 19 20
Freq
uency (%
)
Wind Speed (m/s)
Wind Speed Frequency Distribution
75m
50m

P a g e | 17
SUNY Canton – Wind Feasibility Study
Figure 8 and Figure 9 show the monthly and seasonal wind distribution for the location at both possible hub heights. As is typical for the region, the wind is strongest in the winter and weakest in the summer.
Figure 8: Monthly Wind Distribution for Proposed Site
Figure 9: Seasonal Wind Distribution for Proposed Site
3
3.5
4
4.5
5
5.5
6
6.5
7
Jan Feb Mar Apr May Jun Jul Aug Sep Oct Nov Dec
Wind Speed (m
/s)
Month
Monthly Wind Speed Distribution
75m
50m
3
3.5
4
4.5
5
5.5
6
6.5
Winter (Dec‐Feb) Spring (Mar‐May) Summer (Jun‐Aug) Fall (Sep‐Nov)
Wind Speed (m
/s)
Season
Seasonal Wind Speed Distribution
75m
50m

P a g e | 18
SUNY Canton – Wind Feasibility Study
The diurnal distribution of the wind, Figure 10, shows that the wind resource is greatest at night and is weakest in mid‐day.
Figure 10: Diurnal Wind Distribution for Proposed Site
3
3.5
4
4.5
5
5.5
6
6.5
70
100
200
300
400
500
600
700
800
900
1000
1100
1200
1300
1400
1500
1600
1700
1800
1900
2000
2100
2200
2300
Wind Speed (m
/s)
Hour
Diurnal Wind Speed Distribution
75m
50m
P a g e | 19
SUNY Canton – Wind Feasibility Study
5. Wind Turbine Selection
AWST completed an initial overview of turbine options for the proposed site. As discussed earlier, the relatively small available area restricts the size of the wind turbine due to possible local zoning. Additionally, due to the close location of campus roads, a wind turbine with a blade length of less than 50 meters is required. With these concerns in mind, there are only a few viable options for turbine selection: Fuhrländer FL 250, Fuhrländer FL 600, and the Northwind 100 kW.
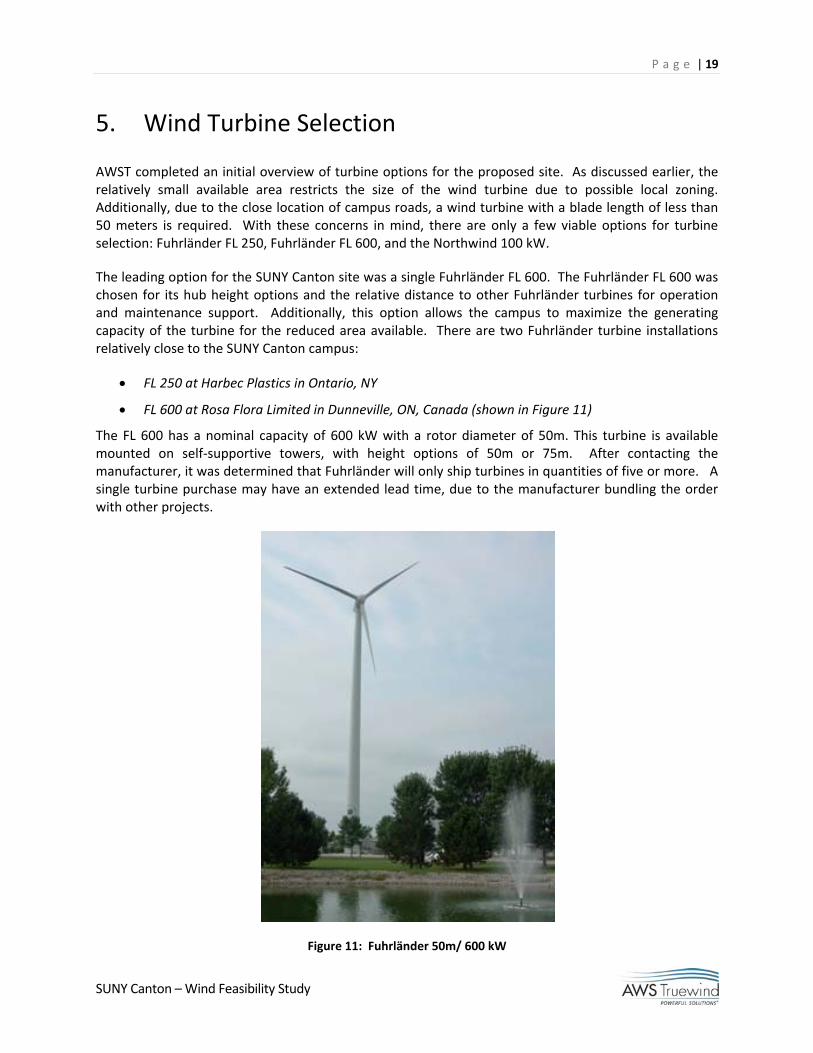
The leading option for the SUNY Canton site was a single Fuhrländer FL 600. The Fuhrländer FL 600 was chosen for its hub height options and the relative distance to other Fuhrländer turbines for operation and maintenance support. Additionally, this option allows the campus to maximize the generating capacity of the turbine for the reduced area available. There are two Fuhrländer turbine installations relatively close to the SUNY Canton campus:
• FL 250 at Harbec Plastics in Ontario, NY
• FL 600 at Rosa Flora Limited in Dunneville, ON, Canada (shown in Figure 11)
The FL 600 has a nominal capacity of 600 kW with a rotor diameter of 50m. This turbine is available mounted on self‐supportive towers, with height options of 50m or 75m. After contacting the manufacturer, it was determined that Fuhrländer will only ship turbines in quantities of five or more. A single turbine purchase may have an extended lead time, due to the manufacturer bundling the order with other projects.
Figure 11: Fuhrländer 50m/ 600 kW

P a g e | 20
SUNY Canton – Wind Feasibility Study
Table 3: Physical Characteristics of the Fuhrländer FL
Manufacturer/Model Fuhrländer FL 600 Rating 600 kW Hub Height (m) 50 / 75 Rotor Diameter (m) 43 / 50 Rotor Area (sq m) 1452/1963
Structure Height (m) 71.5 / 75 96.5 / 100
Blade Material Epoxy/fiber glass with integrated lightning protection
Cut in WS (m/s) 3 Rated WS (m/s) 10.8 Cut Out WS (m/s) 20 Rated Rotor Speed (rpm) 25 Rotor Speed Range (rpm) 13‐27
Estimated Installed Price (USD 2007) $1,498,379 / $1,648,379
Current Lead Time 14 ‐ 16 months Noise Parameters (dB) 98 at Hub; 45 at 100 m
Table 4: Electrical and Mechanical Characteristics of the Fuhrländer Turbines
Manufacturer/Model Fuhrländer FL 600 Rated Power (kW) 600 Maximum Power (kW) Not Stated Power Regulation Pitch Voltage (V) 690 Rated Output (kVA) 660 Power Factor 1.0; controllable Output Frequency (Hz) 50/60
Generator Type 3‐Phase Double‐Fed Asynchronous Generator – Variable Voltage and Frequency
Generator Lifetime 20 years (service life)
Yaw System Sliding bearing 3 electric yaw motors
Pitch System Gearbox/servo motor (max 12 deg/sec)
Brake System Full Span Blade Feathering Emergency Disc Brake
Desktop Monitoring System
Remote data and control
P a g e | 21
SUNY Canton – Wind Feasibility Study
6. Load Evaluation and Energy Production Potential
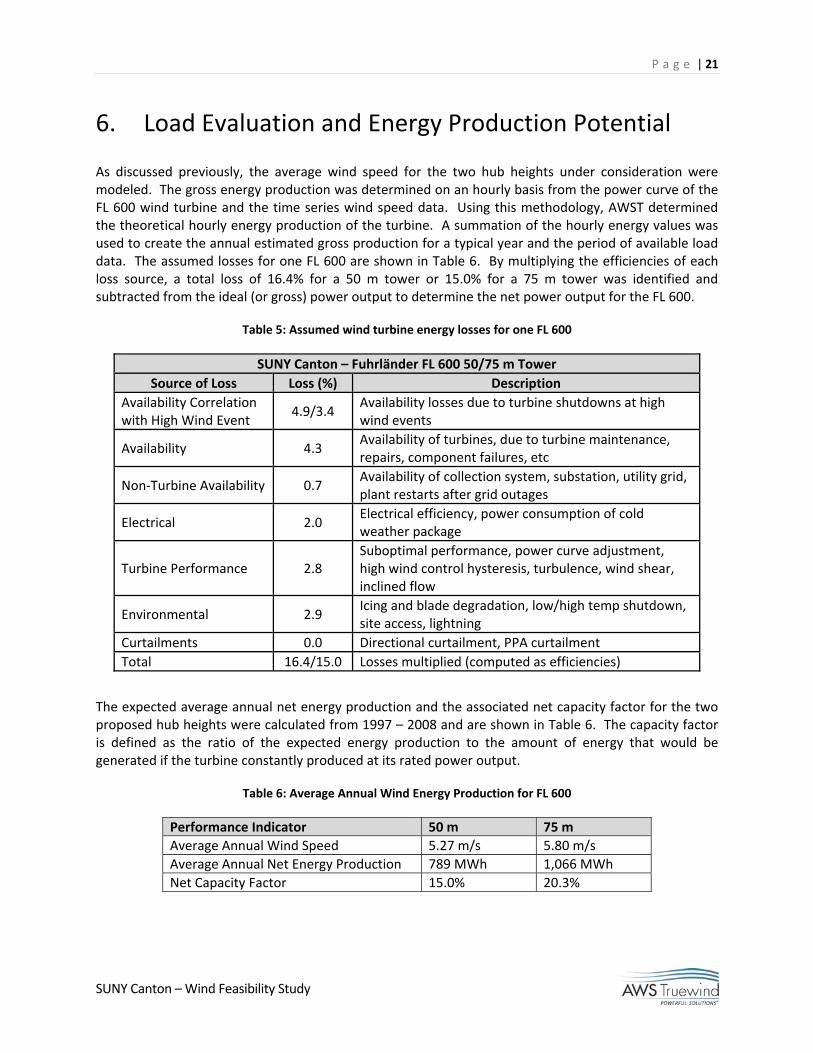
As discussed previously, the average wind speed for the two hub heights under consideration were modeled. The gross energy production was determined on an hourly basis from the power curve of the FL 600 wind turbine and the time series wind speed data. Using this methodology, AWST determined the theoretical hourly energy production of the turbine. A summation of the hourly energy values was used to create the annual estimated gross production for a typical year and the period of available load data. The assumed losses for one FL 600 are shown in Table 6. By multiplying the efficiencies of each loss source, a total loss of 16.4% for a 50 m tower or 15.0% for a 75 m tower was identified and subtracted from the ideal (or gross) power output to determine the net power output for the FL 600.
Table 5: Assumed wind turbine energy losses for one FL 600
SUNY Canton – Fuhrländer FL 600 50/75 m Tower Source of Loss Loss (%) Description
Availability Correlation with High Wind Event
4.9/3.4 Availability losses due to turbine shutdowns at high wind events
Availability 4.3 Availability of turbines, due to turbine maintenance, repairs, component failures, etc
Non‐Turbine Availability 0.7 Availability of collection system, substation, utility grid, plant restarts after grid outages
Electrical 2.0 Electrical efficiency, power consumption of cold weather package
Turbine Performance 2.8 Suboptimal performance, power curve adjustment, high wind control hysteresis, turbulence, wind shear, inclined flow
Environmental 2.9 Icing and blade degradation, low/high temp shutdown, site access, lightning
Curtailments 0.0 Directional curtailment, PPA curtailment Total 16.4/15.0 Losses multiplied (computed as efficiencies)
The expected average annual net energy production and the associated net capacity factor for the two proposed hub heights were calculated from 1997 – 2008 and are shown in Table 6. The capacity factor is defined as the ratio of the expected energy production to the amount of energy that would be generated if the turbine constantly produced at its rated power output.
Table 6: Average Annual Wind Energy Production for FL 600
Performance Indicator 50 m 75 m Average Annual Wind Speed 5.27 m/s 5.80 m/s Average Annual Net Energy Production 789 MWh 1,066 MWh Net Capacity Factor 15.0% 20.3%

P a g e | 22
SUNY Canton – Wind Feasibility Study
Figure 12 shows the historic annual energy production from the FL 600 at the proposed location.
Figure 12: Annual Energy Production at Two Hub Heights
Figure 13 shows the expected seasonal energy production from the FL 600 at the proposed location.
Figure 13: Seasonal Energy Production at Two Hub Heights
0
200
400
600
800
1000
1200
1400
1997 1998 1999 2000 2001 2002 2003 2004 2005 2006 2007 2008
Energy Produ
ction (M
Wh)
Year
Annual Energy Production
75m
50m
0
50
100
150
200
250
300
350
400
Winter (Dec‐Feb) Spring (Mar‐May) Summer (Jun‐Aug) Fall (Sep‐Nov)
Energy Produ
ction (M
Wh)
Season
Seasonal Energy Production
75m
50m

P a g e | 23
SUNY Canton – Wind Feasibility Study
Figure 13 shows the expected monthly energy production from the FL 600 at the proposed location.
Figure 14: Monthly Energy Production at Two Hub Heights
Figure 13 shows the expected diurnal energy production from the FL 600 at the proposed location.
Figure 15: Diurnal Energy Production at Two Hub Heights
0
20
40
60
80
100
120
140
Jan Feb Mar Apr May Jun Jul Aug Sep Oct Nov Dec
Energy Produ
ction (M
Wh)
Month
Monthly Energy Production
75m
50m
0
20
40
60
80
100
120
140
160
180
010
020
030
040
050
060
070
080
090
010
0011
0012
0013
0014
0015
0016
0017
0018
0019
0020
0021
0022
0023
00
Energy Produ
ction (kWh)
Hour
Diurnal Energy Production
75m
50m

P a g e | 24
SUNY Canton – Wind Feasibility Study
When the turbine production is compared to the hourly energy consumption, the turbine would have produced less than the consumption of the school over 99.7% of the time for the period between 8/1/2008 ‐ 7/31/2009; this effectively optimizes the value of the generated energy, since the energy will directly offset the consumption at the rate the college purchases energy and will not be sold back to the grid at a reduced rate. Table 7 below shows the energy production and offset statistics for the time period between 8/1/2008 ‐ 7/31/2009.
Table 7: Wind Energy Production and Energy Offset for FL 600 from 8/1/2008 ‐ 7/31/2009
Performance Indicator 50 m 75 m Average Wind Speed 5.17 m/s 5.68 m/s Net Energy Production 759 MWh 1,018 MWh Net Capacity Factor 14.4% 19.4% Offset for Time Period 10.9% 14.6% Average Hourly Offset 12.2% 16.5% Percent of Time Production Below Consumption 99.9% 99.7%
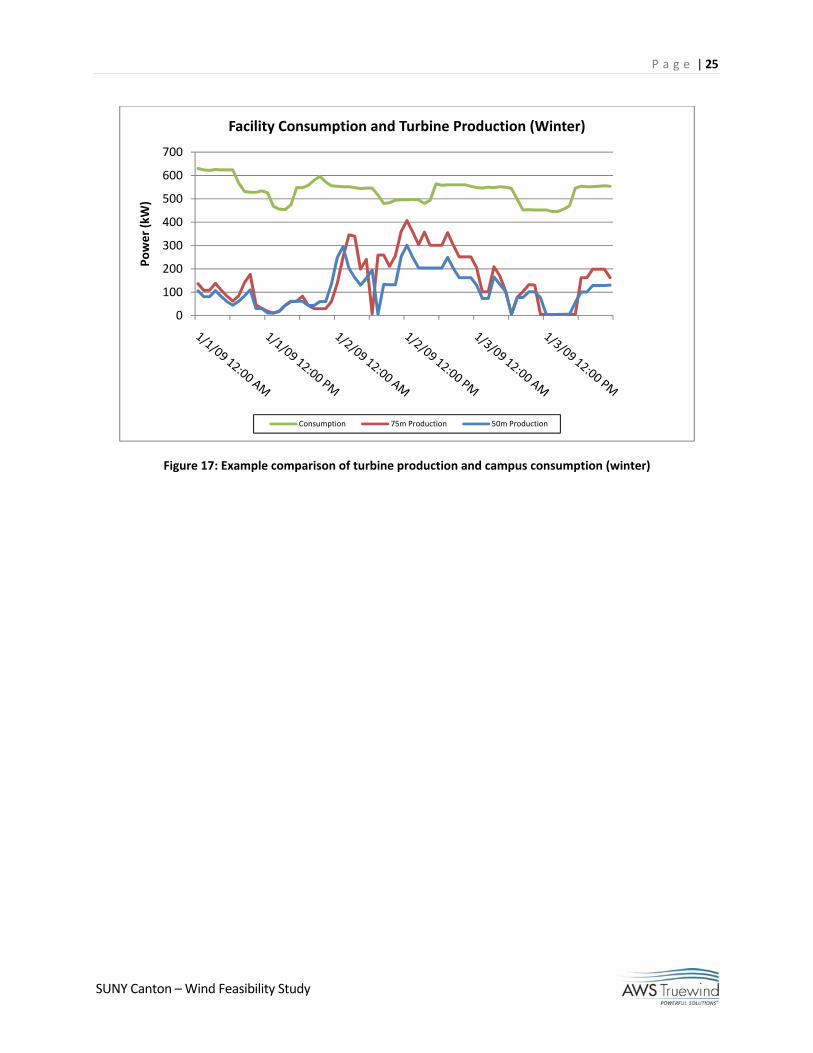
Figure 16 and Figure 17 provide an example of the turbine’s hourly production to the campus’ energy consumption for both the summer and winter during the year in question. As shown, the production of the turbine is almost always below the consumption of the college.
Figure 16: Example comparison of turbine production and campus consumption (summer)
0
200
400
600
800
1000
1200
1400
1600
Power (kW)
Facility Consumption and Turbine Production (Summer)
Consumption 75m Production 50m Production
P a g e | 25
SUNY Canton – Wind Feasibility Study
Figure 17: Example comparison of turbine production and campus consumption (winter)
0
100
200
300
400
500
600
700Po
wer (kW)
Facility Consumption and Turbine Production (Winter)
Consumption 75m Production 50m Production

P a g e | 26
SUNY Canton – Wind Feasibility Study
7. Electrical Interconnection Options
The SUNY Canton campus connects to the National Grid electric system via a 4,160 V / 23 kV substation, shown in Figure 18, owned in full by the university. Currently, SUNY Canton is in the planning stages for a new substation, located adjacent to the existing system, which will also be connected to National Grid via 4,160 V / 23 kV transformers and associate switchgear. The university facilities are supplied power from a series of 4,160 V transmission loops.
Figure 18: SUNY Canton 4,160 V / 23 kV Substation
Since the substation is approximately 1 km away from the proposed turbine locations, AWST recommends connecting the wind turbine directly to the universities’ system via the 4,160 V transmission loop at the south end of the campus. The line tap would occur at the underground vault near the Cooper Service area, as this is the nearest vault to the proposed location.
A pad mounted transformer will be located at the base of the tower to increase the voltage from 690V to 4,160V for interconnection. The National Grid electric system would remain connected to SUNY Canton once the wind turbine was installed, as the wind turbine will rarely produce enough power to fully meet the campus’ energy consumption.

P a g e | 27
SUNY Canton – Wind Feasibility Study
SUNY Canton is subject to the New York State Public Service Commission Standardized Interconnection Requirements (SIR), as they are directly connected to National Grid, an entity regulated by the Public Service Commission. For Inverter based systems, such as the FL 600 and shown in Figure 19, the applicant can follow the SIR expedited application process, which can be found on the New York State Department of Public Services webpage1.
Figure 19: FL 600 Power Converter (photo courtesy of Lorax‐Energy)
The SIR application requires that distributed generation of 25 kW to 2 MW meet the standards set forth in IEEE standard 1547. The standards require the project to have a visible disconnect switch, have the necessary protective functions, and maintain power quality standards on the distribution system.
A utility grade disconnect would be located between the turbine and the vault to isolate the wind turbine if abnormalities were detected. National Grid may require a second disconnect switch controlled by an intertie protection relay, which would allow National Grid to isolate the turbine if abnormal conditions appear on their power lines.
1 http://www.dps.state.ny.us/Final_SIR_02‐12‐09_Clean.pdf

P a g e | 28
SUNY Canton – Wind Feasibility Study
The FL 600 is equipped with electrical protection devices, as well as mechanical protection devices. The protection system for the FL 600 is certified by Germanischer Lloyd (GL). As such, the protection devices should be consistent with or greater than the IEEE 1547 standards (required in the SIR) listed in Table 8.
Table 8: IEEE 1547 Protection Standards
P a g e | 29
SUNY Canton – Wind Feasibility Study
The FL 600 maintains the necessary power quality requirements. The turbine utilizes a double‐fed asynchronous generator and IGBT inverter. These system elements limit the total harmonic distortion (THD) to approximately 1%, well below the requirement of less than 5% for voltages less than 69 kV. The incorporated power electronics also create minimal voltage flicker and associated voltage sag. The FL 600 has variable reactive power (VAR) capabilities from 0.9 lagging to 0.95 leading, which can strengthen the local grid by adding reactive power support to the system.
Assuming that the given load data represents a typical year, the FL 600 will produce more power than the load requires less than 0.3% of the time. SUNY Canton will need to work with National Grid to determine what will be done with the excess power. Options could include net metering, curtailment strategies, or an off‐taker agreement for the excess energy with National Grid.
Net metering would allow the university to offset future energy use with the excess production. Currently, the state of New York has a set net metering program for projects that are less than 2 MW in size. To learn more about New York’s net metering program see the Database of State Incentives for Renewable Energy and Efficiency2.
Curtailment is a systematic cutback of production to maintain a given maximum level. National Grid may require that SUNY Canton implement a curtailment strategy to maintain production equal to or less than the load, if the electrical system does not allow bi‐directional power flow to the grid.
Finally, the University could enter an off‐taker agreement with National Grid. The following are the most typical agreements for the backflow of minimal power onto the grid:
• Wholesale: The off‐taker pays the generator wholesale power purchase price (NYISO average is approximately 4 cents per kWh). This method will require a power purchase agreement to be set up with the utility.
• Contribution: The off‐taker is given the excess power at no value to the generator (0 cents per kWh). This method will require documentation of understanding with the utility.
2 http://www.dsireusa.org/

P a g e | 30
SUNY Canton – Wind Feasibility Study
8. Operations and Maintenance Planning
AWST recommends that SUNY Canton secure a Factory Maintenance Contract (FMC) to ensure proper maintenance of the wind turbine. The FMC provides bi‐annual preventive maintenance visits plus 24/7 monitoring of the wind turbine system by the Fuhrländer Maintenance Center. The approximate cost of this service is $10,000 per MW per year. As this would be a contract between SUNY Canton and Fuhrländer, the final cost will be negotiated at purchase. The cost of the FMC is included in the economic analysis for the life of the turbine.
A one‐year Factory Warranty is covered in the cost of the Fuhrländer turbines; this warranty covers any defects in materials and workmanship from manufacturing and installation of the turbine. However, AWST recommends that SUNY Canton obtain the 5 year extended warranty offered by Fuhrländer. The extended warranty is available for approximately $10,000 per MW per year, and will cover issues outside of the preventive maintenance. The cost of the 5‐year warranty extension is included in the economic analysis. The FMC recommended above is a necessary pre‐condition for Warranty service.
Two SUNY Canton staff would be trained in turbine shut‐down and electrical isolation procedures in case of emergency. These staff would be provided with Supervisory, Control, and Data Acquisition (SCADA) computer interface in their school office. This would allow them to determine system status and shut down the turbine if local conditions require and communication cannot be established with the Maintenance Center in Germany. However, as stated above, the turbines do not typically require any on‐site monitoring; 24/7 monitoring is provided by the Fuhrländer Maintenance Center as part of the FMC. Additionally, training SUNY Canton staff members will allow them to interact with the Maintenance Center and perform limited ground based assistance to help make more efficient use of the traveling technicians’ time when they come to perform unscheduled maintenance on the turbines.
As discussed previously, there are two Fuhrländer turbine installations relatively close to the SUNY Canton campus, which could facilitate an easier maintenance schedule with the above recommendations. Other nearby wind energy projects are shown in Table 9.
Name County Turbine # Units Harbec Plastics Wayne FL 250 1 Rosa Flora ON, Canada FL 600 1 Maple Ridge Lewis Vestas (V82) 195 Fenner Madison GE 1.5 SLE 20 Munnsville Madison GE 1.5 SLE 23 Madison Madison Vestas (V66) 7 Chateaugay Franklin GE 1.5 SLE 71 Clinton Clinton GE 1.5 SLE 67 Ellenburg Clinton GE 1.5 SLE 54 Altona Clinton GE 1.5 SLE 58
Table 9: List of the Closest NYS Wind Projects
A small quantity of parts should be kept at the facility for quick access. A list of suggested spare parts is located in Appendix 1.

P a g e | 31
SUNY Canton – Wind Feasibility Study
9. Economics
The cost of energy from a distributed wind project includes several factors besides those constituting the initial capital costs. In basic terms, the total expenses required to build and operate a project over its effective lifetime, divided by the total energy generated by the project, yields the cost of energy (i.e., dollars per kWh). Lower energy costs are therefore attainable at windier sites when capital and operating costs among sites are comparable. The cost of energy is affected by a variety of inputs, including:
• A capital structure consisting of both equity and debt portions
• Operations and maintenance (O&M) costs
• The life span of the wind turbine (assumed to be 20 years)
• The wholesale rate for Renewable Energy Credits
• The annual inflation rate
• The debt service coverage ratio
• The loan terms (payback period and interest rate)
• The target return on equity (assumed to be 0%)
• Government incentives, including the Production Tax Credit (PTC), the Investment Tax Credit (ITC), and the Federal Cash Grant (explained in more detail below)
• Depreciation of the turbine’s value over time (affecting the taxable basis)
• Net annual energy production generated by the turbine
In order to gain a better perspective on the potential costs of a single wind turbine installation, a hypothetical cost of energy analysis was performed. A preliminary economic evaluation assumed a break‐even scenario over a 20‐year expected project lifetime (20‐year payback period, 0% return on equity). This analysis utilized representative values for the cost variables listed above.
Government Incentives
The selected government incentive affects the cost of energy. Three alternatives are available: the PTC, the ITC, or the Federal Cash Grant. The current PTC offers $0.021 per kWh of wind generation, adjusted annually for inflation. The ITC and the Federal Cash Grant offer 30% credit toward the project’s qualifying costs, which is typically 95% of the installed project cost.3 Although quantitatively equivalent, the Federal Cash Grant differs from the ITC in that it is provided up front, where the ITC is apportioned over a five year period. The PTC is favorable for projects with high capacity factors, since incentives are awarded per unit of generation. Alternatively, the ITC and the Cash Grant are favorable for projects with a high installed cost, since incentives are offered as a percentage of the qualifying installed project cost. The Cash Grant has an advantage over the PTC and ITC incentives in that it favors projects without a tax
3 NREL Report: “PTC, ITC, or Cash Grant?” March 2009. Web site: http://eetd.lbl.gov/ea/emp/reports/lbnl‐1642e.pdf

P a g e | 32
SUNY Canton – Wind Feasibility Study
credit appetite: the PTC or ITC’s value is dependent on the organization’s taxes being large enough to absorb the magnitude of credit offered, while the Cash Grant is not dependent on an organization’s tax appetite. Because of the high installed cost per kW associated with single turbine projects and the absence of tax appetite for the proposed public wind project, the Cash Grant scenario is likely to be the more favorable incentive option, and has been applied in the analysis.
Net Annual Energy Production
Multiple variables affect the net annual energy production estimate, including the wind resource, turbine selection, and loss assumptions. The net annual energy production values of 789 MWh (50 m tower) and 1,066 MWh (75 m tower) computed in Section 6, were used to complete the cost of energy analysis.
Total Installed Cost and O&M Cost The total installed cost of the project was based on a quote from Fuhrländer in early 2007. Fuhrländer estimates the installed cost of a single FL 600 (50 m tower) to be approximately $1,498,379 (see Table 10 for a breakdown from the manufacturer). This corresponds to an installed cost of $2,497 per kW. Utilizing a 75 m tower would increase the single turbine cost by approximately $150,000, corresponding to an installed cost of $2,747 per kW. While actual installed costs vary from project to project based on site‐specific considerations, these prices provide a reasonable target estimate for the cost of energy analysis. The 2007 installed cost was appreciated by 2.5% annually to account for inflation, making installed costs for the analysis $2,656 per kW (50 m tower) and $2,922 per kW (75 m tower).
The O&M cost estimate of $0.015/kWh was based on Fuhrländer’s reported O&M servicing cost of $10,000/MW per year (2007), with additional contingency assumed for repairs and spare parts.
Economic/Financial Inputs Economic and financial inputs drive the cost of energy. The analysis computed the cost of energy based on economic and financial input parameters, as described in Table 11.

P a g e | 33
SUNY Canton – Wind Feasibility Study
Table 10: FL 600 Installed Cost Breakdown
Specifications Rotor Diameter 50 m Power Regulation Stall Tower Type Tubular Steel Tower Height 50 m Crane Capacity/Boom Length 350 Ton/50 m
Foundation Volume (m3) 200 Turbine Costs
Cost of Turbine and Blades $ 879,028 US Customs Duty (2.5%) $ 21,976 Turbine and Blade Freight $ 50,050 Tower and Foundation Insert $ 287,025 Tower Freight $ 25,300 Total Cost $ 1,263,379
Estimated Customer Costs Engineered Drawings $ 15,000 Electrical $ 25,000 Foundation $ 70,000 Erection and Startup $ 125,000 Est. On‐Site Installation Costs $ 235,000
Total Installed Cost $ 1,498,379
Table 11: Economic/Financial Input Ranges
Input Value Units Notes
Capital cost (Installed) 2,656/2,922 $/kW 50 m/75 m tower
O&M costs 0.015 $/kWh
Tax depreciation (MACRS, 5 year property) 90 % N/A (see below)
Tax depreciation (MACRS, 15 year property) 5 % N/A (see below)
Effective income tax rate 0 % Non‐taxable entity
ITC subsidy on qualifying capital 30 %
Renewable Energy Credit (wholesale value) 0.015 $/kWh
Annual inflation rate 2.5 %
Discount rate 7.5 Nominal %
Equity 35 %
Debt 75 %
Return on equity 0 %
Term 14 Years
Interest rate 9 %

P a g e | 34
SUNY Canton – Wind Feasibility Study
Cost of Energy
The cost of energy was computed by optimizing the cash flow model to a target return on equity of 0% (this assumes that the wind project pays for itself over its 20‐year lifetime). The calculated cost of energy for the project was 12.2 cents per kWh (50 m tower), or 10.3 cents per kWh (75 m tower). The lower cost of energy for the 75 m tower scenario indicates that the greater amount of energy produced at the higher hub height more than offsets the additional cost of the taller tower.
These estimates are sensitive to project‐specific site conditions, design decisions, and financing parameters. The installed capital cost and net annual energy production are the most significant inputs to the cost of energy. Turbine type and O&M costs will also affect the cost of energy. However, these cost‐of‐energy estimates provide a useful benchmark for future planning and evaluation purposes.
An electric bill for the SUNY Canton campus dated October 4, 2004 indicates a cost of energy of 5.343 cents per kWh at that time. Assuming transmission and SBC charges, inflating to the present (2.5% per year), and accounting for the Renewable Energy Credit wholesale rate (assumed to be 1.5 cents per kWh), the current equivalent cost of energy is approximately 7.9 cents per kWh. Energy formerly bought from the local grid would be displaced by the wind energy project, reducing electric bills by $62,324/$84,240 annually for the 50 m/70 m tower scenarios, respectively.
In order to match the college’s current energy rate (7.9 cents per kWh) from a wind turbine on campus, NYPA would have to supply 42% of the initial invested capital ($669,392) for the 50 m tower scenario, or 29% of the initial invested capital ($508,469) for the 75 m tower scenario.

P a g e | 35
SUNY Canton – Wind Feasibility Study
10. Environmental and Siting Issues
There are several environmental and siting issues that must be addressed when siting a wind project. Though they are typically minimal or localized in comparison to other energy technologies, the primary concerns include visual impacts, noise, airspace restrictions, interference to radar and microwave telecommunication towers, bird and bat effects, land cover and land use issues including critical habitat and wetlands, and archaeological and historical significant areas. Other relevant aspects include shadow flicker, ice throw, and geotechnical related issues. An assessment of environmental issues was not performed in the original feasibility study conducted for SUNY Canton by GPI, however, some key points were identified in the site visit evaluation. This section provides a brief description of these key sensitivities, including possible mitigation strategies and study costs.
Visual Impact
The proposed turbine for the facility is the Fuhrländer FL 600 with either a 50 meter hub height or a 75 meter hub height and a 43 ‐ 50 meter rotor diameter, making the total structure height of the turbine either 71.5 ‐ 75 meters or 96.5‐100 meters, respectively.
Installed on top of one of the highest hills in the area, the turbine would likely be visible from most of the Village of Canton. As such, the 50m hub height could possibly be easier to permit and more accepted by the community. However, the blades of the FL 600 will move at a slow pace of 23 RPM, which means it will take several seconds for each blade to complete a full revolution around the hub of the turbine. People find slow moving rotors to be less obtrusive than the fast moving rotors found on small residential wind turbine models.
A site visit to a nearby existing FL 600 may help the community understand the potential visual impact. Also, photosimulations and a Zone of Visual Influence (ZVI) study may provide more material for public acceptance. These visualizations services help to document the visual impact arising from installing a wind turbine in the landscape.
The ZVI analysis employs GIS with digital terrain data, turbine coordinates and turbine dimensions to determine the areas from which the turbine would be visible. Initial results are usually conservative, as the model does not take into account atmospheric effects or vegetation and buildings effects on turbine visibility. To create more realistic results, land cover data and estimated tree coverage can be integrated into the analysis; however, atmospheric diffraction is still not considered.
P a g e | 36
SUNY Canton – Wind Feasibility Study
Noise
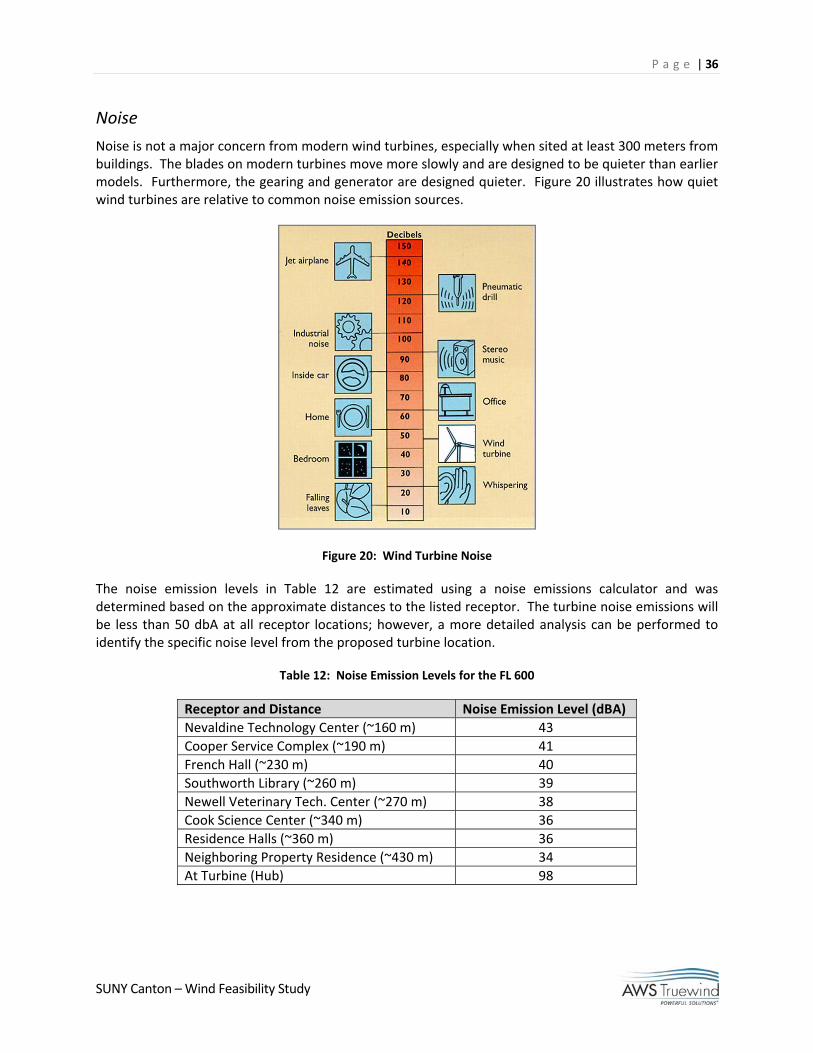
Noise is not a major concern from modern wind turbines, especially when sited at least 300 meters from buildings. The blades on modern turbines move more slowly and are designed to be quieter than earlier models. Furthermore, the gearing and generator are designed quieter. Figure 20 illustrates how quiet wind turbines are relative to common noise emission sources.
Figure 20: Wind Turbine Noise
The noise emission levels in Table 12 are estimated using a noise emissions calculator and was determined based on the approximate distances to the listed receptor. The turbine noise emissions will be less than 50 dbA at all receptor locations; however, a more detailed analysis can be performed to identify the specific noise level from the proposed turbine location.
Table 12: Noise Emission Levels for the FL 600
Receptor and Distance Noise Emission Level (dBA) Nevaldine Technology Center (~160 m) 43 Cooper Service Complex (~190 m) 41 French Hall (~230 m) 40 Southworth Library (~260 m) 39 Newell Veterinary Tech. Center (~270 m) 38 Cook Science Center (~340 m) 36 Residence Halls (~360 m) 36 Neighboring Property Residence (~430 m) 34 At Turbine (Hub) 98
P a g e | 37
SUNY Canton – Wind Feasibility Study
Federal Aviation Administration (FAA) Restrictions
Federal Aviation Regulation (FAR) Part 77 specifies the policies that apply to objects affecting navigable airspace. It is required to file a Notice of Proposed Construction with the FAA for any structure taller than 200ft that would be installed at the site. FAR Part 77 outlines a long list of specific criteria to determine if an object of new construction will penetrate a number of imaginary surfaces extending from an airport’s runway(s). These imaginary surfaces are important to aircraft navigating the airspace near an airport. If a wind turbine penetrates one or more of these imaginary surfaces, it will be considered an obstruction. This does not necessarily mean that it cannot be built, but further study would be required to determine if the wind turbine would be a hazard. Aviation warning lights and/or blade markings would likely be required for any wind turbine over 200 feet. The FAA typical makes a determination within 90 days of submittal. AWST submitted a case for the SUNY Canton site on behalf of NYPA (study number 2009‐WTE‐11075‐OE) on October 15, 2009.4 The case is under consideration and is attached to this report as an appendix.
An initial aviation review indicates that there are no airports in the immediate proximity of the project; the nearest airport, Ogdensburg International, is approximately 15 miles to the northwest of the site.
Radar and Telecommunication Interference
Radar interference issues have been becoming more prevalent across the United States as the number of wind turbine installation proposals have increased. In January 2006, Congress mandated a study of the effects of proposed wind turbines on military operations, including aircraft radar, triggering special scrutiny by the FAA and the Department of Defense (DOD). The perceived military problem is that the tall turbines might create false signals picked up by military radar. As the process now works, the DOD can weigh in, but after reviews are complete, the FAA makes the final decision. Because the Congress mandated study is taking longer than expected, concerns about impacts led the DOD and the Department of Homeland Security (DHS) to issue an Interim Policy on Proposed Windmill Farm Locations on March 21, 2006. This policy states:
“The DOD/DHS Long Range Radar Joint Program Office Interim Policy is to contest any
establishment of windmill farms within radar line of site of the National Air Defense and
Homeland Security Radars. This is to remain in effect until the completion of the study
and publishing of the Congressional Report.”
Although it is unlikely that the installation of one turbine at the proposed location will cause any major radar interference issues, we recommend that an expert be contacted to evaluate the project. Additionally, AWST recommends that a microwave beam path study be performed to identify any microwave communication pathways that intersect the project area. In this study, the impact to local broadcast systems and cell towers should be addressed as well.
4 FAA Cases are entered electronically at https://oeaaa.faa.gov/oeaaa/external/portal.jsp.

P a g e | 38
SUNY Canton – Wind Feasibility Study
Birds and Bats
As with any other tall structure, birds may collide with a wind turbine. Migratory birds tend to fly at altitudes well above the top of the turbine blades, and under good visibility conditions, birds will change direction to avoid flying directly into a turbine. The risks for collision may increase when fog, clouds, rain, or darkness reduce visibility. However, there is no reason to believe that wind turbines would pose a significantly greater threat than other tall towers located in the vicinity.
A review of studies of avian mortality at more than fifteen U. S. wind power facilities reveals relatively few fatalities overall and no ecologically significant mortality at any site, with the possible exception of Golden Eagle fatalities in the Altamont Pass area of California. In Europe, fatality rates have also been low and not ecologically significant. Habitat destruction and avoidance of turbine areas have been documented for some species in some locations, but the impacts have not been considered significant.
Wind's overall impact on birds, as shown in Figure 21, is low compared with other human‐related sources of avian mortality. Wind turbines cause less than 1 bird death per 10,000 fatalities.
Figure 21: Causes of Bird Fatalities
After a preliminary desktop analysis, some potential concerns were identified. The SUNY Canton campus is located less than 1 mile east of the Upper and Lower Lakes Wildlife Management Area, which is part of the larger Libson Grasslands Important Bird Area. No other significant bird or hawk watch sites were identified. Still, a phase I avian risk assessment should be performed at the site to better understand the resident and migratory bird activity in the area, and to ensure that protected and/or endangered species will not be affected. The study would consider songbirds, breeding bird surveys, raptor migration surveys, and wintering bird success, and could involve several site visits at different times of the year to verify any desktop information. An analysis of potential bat concerns, including the protected Indiana brown bat, should be conducted as well. The New York State Department of Environmental Conservation (NYSDEC), in January 2009, issued Guidelines for Conducting Bird and Bat Surveys at Commercial Wind Projects which would provide guidance for these studies.

P a g e | 39
SUNY Canton – Wind Feasibility Study
Land Cover and Land Use
Aside from visual and regulatory, or zoning‐related issues, an assessment of the local land cover and land use types provides an overview of nearby land features. This may include impact to water features, agricultural lands, critical habitat for endangered or threatened species, or other protected areas that may be affected by the development of the wind farm.
Beyond the site description provided in the project orientation and site visit summary, a desktop study of local protected lands indicates that the SUNY Canton campus is 6.5 miles west of the Crary Mills State Forest. No other significant features were identified in the area however, additional research is recommended. This research may include further analysis of the items mentioned above as well as scenic rivers, vistas, or recreational areas. In addition, site visits should be performed to ground truth the desktop information and to delineate wetlands or complete terrestrial community maps.
Archaeological and Historic Significance
It is important to review the cultural impacts that a proposed wind farm may have within the vicinity of the proposed installation. For the purpose of this study, a brief analysis of historic datasets indicates that the SUNY Canton campus is approximately 0.5 miles northwest of the Village Park Historic District. Further analysis of local archaeological factors and historic sites is recommended. Information should be gathered from the New York State Office of Parks, Recreation and Historic Preservation (NYSOPRHP).
Other Concerns
There are other environmental issues that should be taken into consideration when reviewing the feasibility of a wind project at a designated location, including shadow flicker, ice throw, geologic and geotechnical related issues. A shadow flicker analysis is suggested to evaluate the potential for turbines to affect nearby structural receptors as a result of the moving blades causing different light intensities and casting shadows.
Ice throw is an important safety issue to take into consideration. The likeliness of ice to form on the blades of a turbine should be assessed by conducting scientific research on the region. This is especially of concern in mountainous areas or northern latitudes where icing is a common cold weather phenomenon.
Geologic and geotechnical reports can be acquired to determine the constructability of a site as well as potential environmental impacts including soil erosion and water quality degradation. The study would provide a review of the subsurface soils and strata, and is recommended to identify the proper foundation type, materials and underground electrical system for a wind project.
Study Costs
Depending on the range of issues at the project site and nearby, the cost to perform the various environmental and siting related studies varies significantly. The approach most consultants would take is to complete a desktop analysis as a first step to collect any background data, through literature searches, internet resources, and correspondence with various agencies or related organizations. This research would likely result in more detailed maps of the project area, as well as further identification of construction impacts or necessary permits.

P a g e | 40
SUNY Canton – Wind Feasibility Study
The next step would be to perform field evaluations by visiting the site to further document site conditions or concerns more specific to the environmental analysis than what was conducted by AWST staff. This would be followed by greater data collection and ultimately delivery of some final report. For some projects, an Environmental Assessment Form would be provided and no further reporting would be necessary. However, depending on the site characteristics and issues, additional permitting may be required, or to an even greater extent, an Environmental Impact Statement (EIS) completed.
To perform a basic desktop analysis and report, the study cost may range from $18,000 to $25,000. These costs are estimates based on three different environmental firms in the area.
For projects requiring much greater detail or having more significant environmental related issues, project costs may be on the upward end of $50,000 ‐ $75,000. These estimates consider each of the areas mentioned above, which may not be required for all sites. The following is an approximate breakdown of some of the costs:
• Visual Analysis and Photosimulations ‐ $8,000 ‐ $10,000
• Noise ‐ $3,000 ‐ $10,000
• Telecommunication ‐ $1,000 ‐ $4,000
• Birds and Bats ‐ $11,000 ‐ $34,000
• Threatened and Endangered Species ‐ $4,000 ‐ $12,000
• Wetlands ‐ $11,000 ‐ $16,000
• Existing Use and Historic Conditions ‐ $10,000
• Cultural ‐ $7,000

P a g e | 41
SUNY Canton – Wind Feasibility Study
11. Conclusions and Recommendations
In 2005, GPI performed a preliminary study to evaluate the feasibility of installing a wind turbine on the SUNY Canton campus. The study determined that there was a realistic potential for technical, economic, and environmental viability. The present study provides further analysis of the available wind resource, suitable installation areas, appropriate wind turbine technology, and detailed economic estimates. Specifically, AWST recommends that a single Fuhrländer 600 kW turbine be installed on a 50 m tower at Area 2 within the school property. The reasons for this recommendation are summarized below.
Through desktop research and a site visit, AWST determined the most suitable area for wind energy development on the campus. It was determined that the area of interest is restricted in physical size due to its relatively close location to roads and buildings. After a review of the school’s electric consumption, it was determined that a single turbine will offset only a portion of the school’s consumption and will exceed the onsite consumption less than 0.3% of the time for the analyzed period. From this comparison, it became apparent that a wind turbine with tower heights between 50‐75 m would offer a more viable option for installation.
The number of available turbine models on the American market with tower heights in this range is very limited. The main turbine manufacturer that offers turbines in this range is Fuhrländer. Fuhrländer offers their 600 kW FL 600 at two tower heights: 50 and 75 meters.
Two AWST engineers visited the school in September 2009 and assessed the different possibilities of installing a wind turbine. Areas 1, 2, and 3 appeared to offer the most feasible options for installing a wind turbine. However, through further analysis, Area 3 was removed from consideration due to its close proximity to neighboring residences and distance from the campus’ electrical infrastructure. Area 1 was eliminated due to its close proximity to the water tower and neighboring residences; this area may be better suited for a ground mounted photovoltaic installation. The expected average annual wind speeds at Area 2 are 5.27 m/s and 5.80 m/s at 50 and 75 m, respectively. Therefore, the most promising development scenario is the installation of one Fuhrländer 600 kW turbine on a 50 m or 75 m tall tower at the campus entrance, Area 2.
During the period of available load data, the wind turbine would have produced approximately 10.9% to 14.6% of the school’s electric consumption, depending on the size of turbine tower. While the 75 m tower will produce more energy, it may prove more difficult to permit than the 50 m version. The feasibility of the final project will depend on many factors, including, but not limited to, financial incentive, permitting, and campus/community reaction.
Energy formerly bought from the local grid would be displaced by the wind energy project, reducing electric bills by $62,324/$84,240 annually (for the 50 m/75 m tower scenarios, respectively). Energy generated by the wind project will cost approximately 12.2 cents per kWh (50 m tower) or 10.3 cents per kWh (75 m tower).
Potential barriers to installing a wind turbine at SUNY Canton include the following:
• Obtaining necessary permissions to site the turbine at the campus entrance,

P a g e | 42
SUNY Canton – Wind Feasibility Study
• Campus/community reaction
• Final economics for a wind system installation.

P a g e | 43
SUNY Canton – Wind Feasibility Study
12. Appendices
Appendix 1: List of spare parts recommended by Fuhrländer for one FL 600. .......................................... 44
Appendix 2: FAA Case Study Number 2009‐WTE‐11705‐OE ...................................................................... 45

P a g e | 44
SUNY Canton – Wind Feasibility Study
Appendix 1: List of spare parts recommended by Fuhrländer for one FL 600.

P a g e | 45
SUNY Canton – Wind Feasibility Study
Appendix 2: FAA Case Study Number 2009‐WTE‐11705‐OE