wind in ireland integration and cost issues david milborrow [email protected]
TRANSCRIPT


Author’s previous encounters in Ireland
•Participated with ESB and other EU utilities in EC-funded studies of wind impacts c.1988
•Member of Advisory Panel which selected turbines for Bellacorick, 1990/91
• Invited speaker at IWEA Conference, 1996
•Adviser to developer based in Co Cork on several windfarms (some now built) since 1994
•No permanent affiliations!
Scope of talk
•Assimilating wind Issues? Problems? Costs? Limits?
•Extra costs to consumers of adding wind Sensitivities?
Very brief economic interlude
•Much interest in “Extra cost of renewables”
• Justified by “External costs” of thermal sources, esp Global Warming
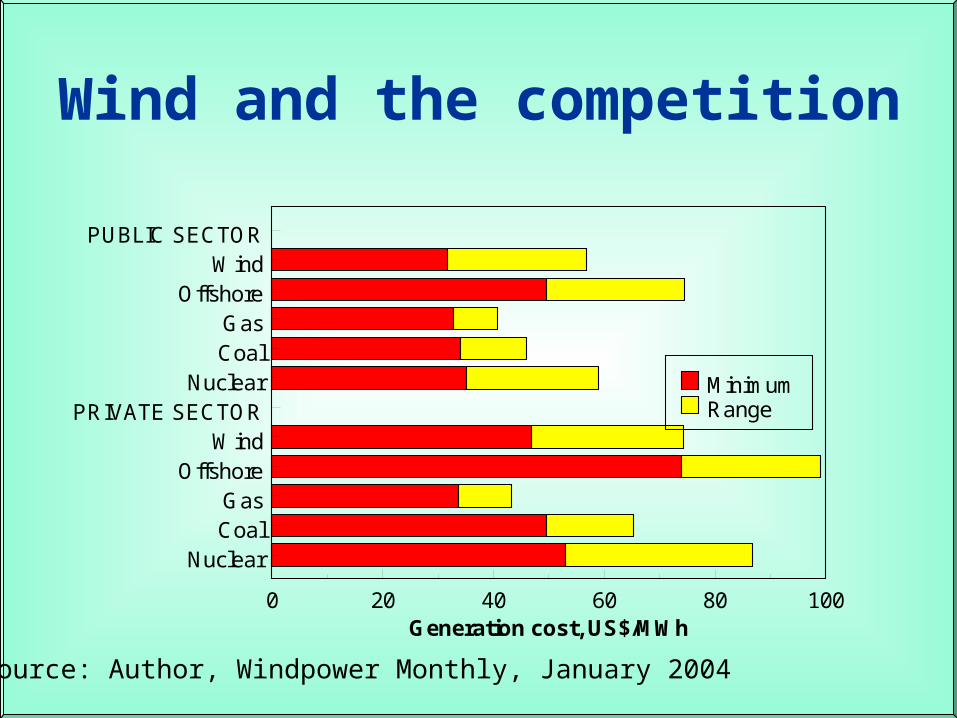
Wind and the competition
PUBLIC SECTORWind
OffshoreGasCoal
NuclearPRIVATE SECTOR
WindOffshore
GasCoal
Nuclear
0 20 40 60 80 100Generation cost, US$/MWh
MinimumRange
Source: Author, Windpower Monthly, January 2004
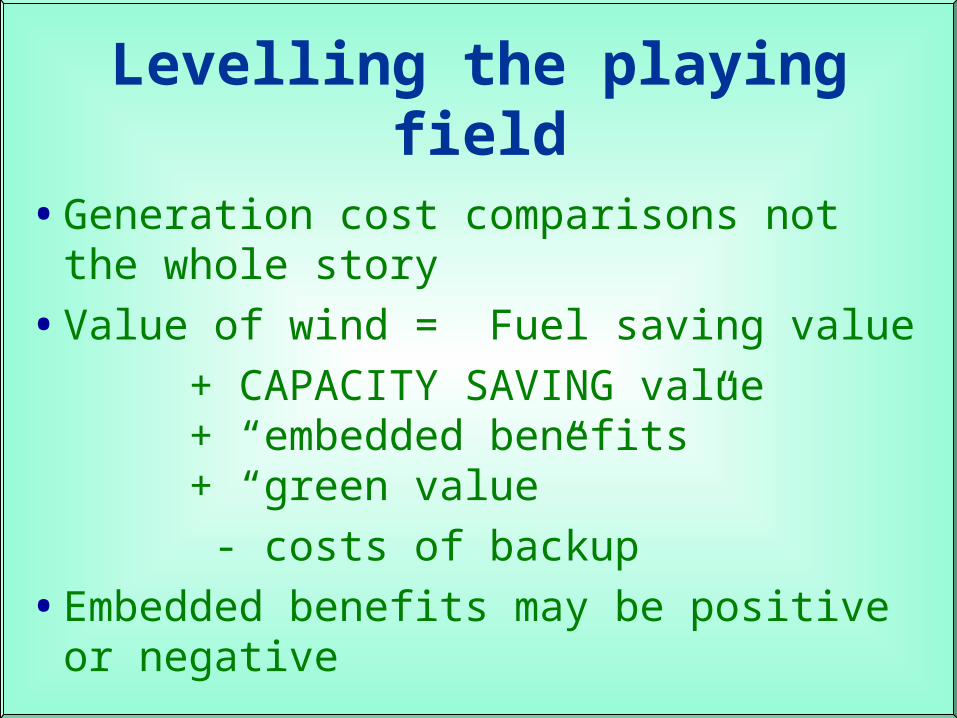
Levelling the playing field
•Generation cost comparisons not the whole story
•Value of wind = Fuel saving value + CAPACITY SAVING
value + “embedded benefits” + “green value” - costs of backup
•Embedded benefits may be positive or negative
Who has looked at integration issues?
• Ireland ESB (1990), CEGB, and other EU utilities, as part of
co-ordinated study IWEA, “Geographical dispersion of wind in Ireland”,
1999 Garrad Hassan “Impacts” study, 2003 University College, Dublin
• UK DTI/Carbon Trust Network Study, Intermittency Module, has c.40 worldwide refs back to 1980
• Grid operators: Eltra, NGT, Nordel, and US utilities
Ireland is different
•Could be first self-contained electricity system to operate with significant wind input Denmark is not isolated, but source of
useful data, as W Denmark system similar in size
W Denmark currently runs with wind supplying ~20% of consumption
Ties with neighbours mean that effective wind supply is about 10% - still respectable!
Integration topics
•Electricity networks
•Behaviour of wind plant
•Assimilating wind into networks Storage Capacity credit
•Transmission issues
•The future
Electricity systems
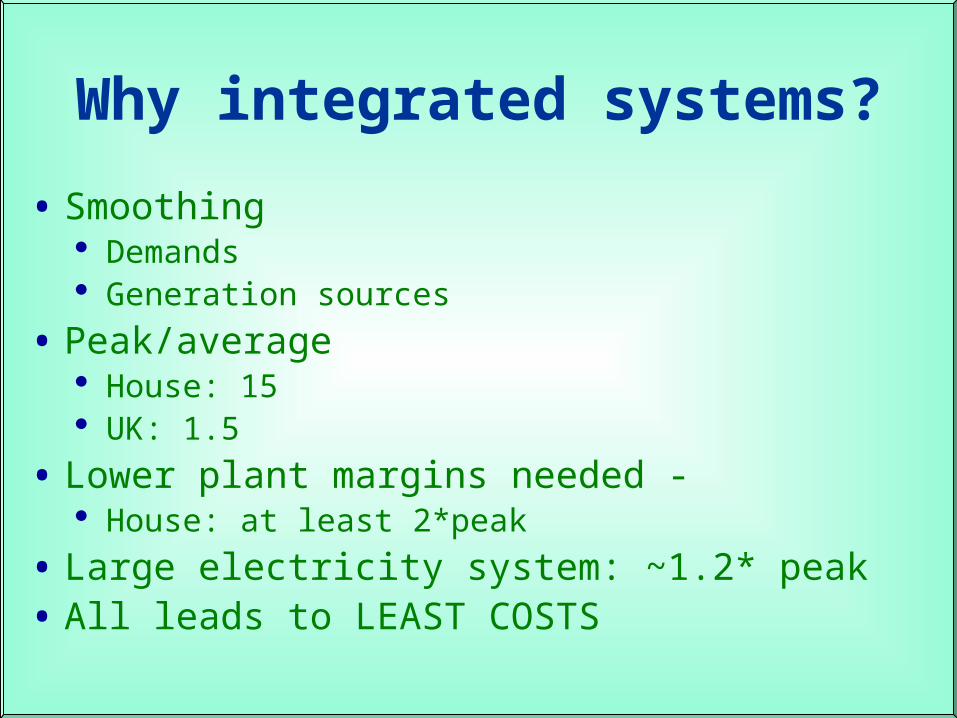
Why integrated systems?
• Smoothing Demands Generation sources
• Peak/average House: 15 UK: 1.5
• Lower plant margins needed - House: at least 2*peak
• Large electricity system: ~1.2* peak• All leads to LEAST COSTS
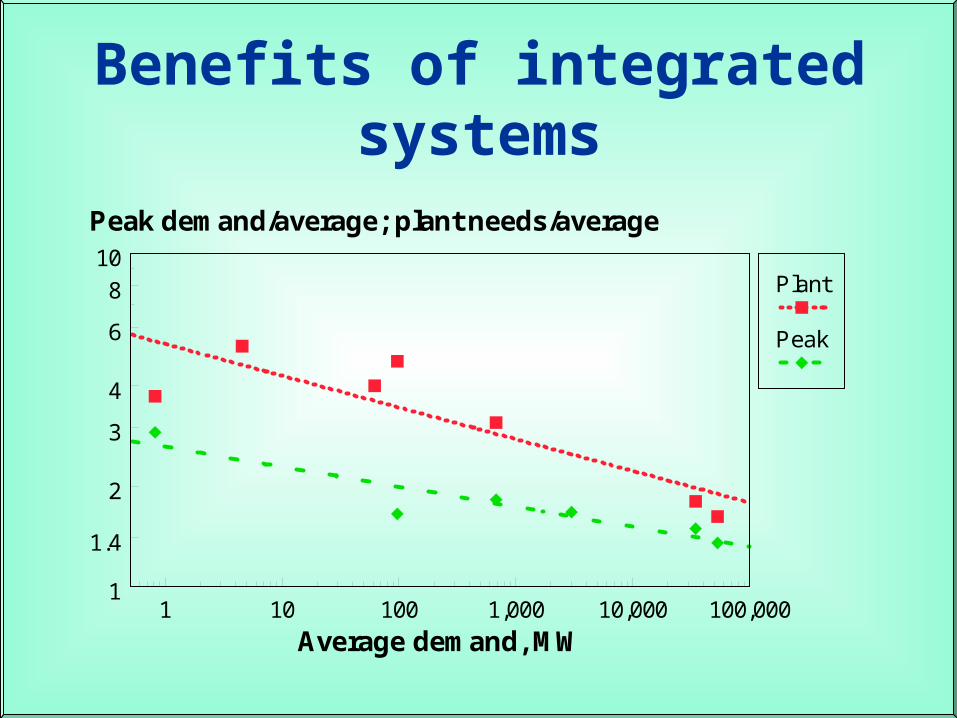
Benefits of integrated systems
1 10 100 1,000 10,000 100,0001
1.4
2
3
4
6
8
10
Average demand, MW
Peak demand/average; plant needs/average
Plant
Peak
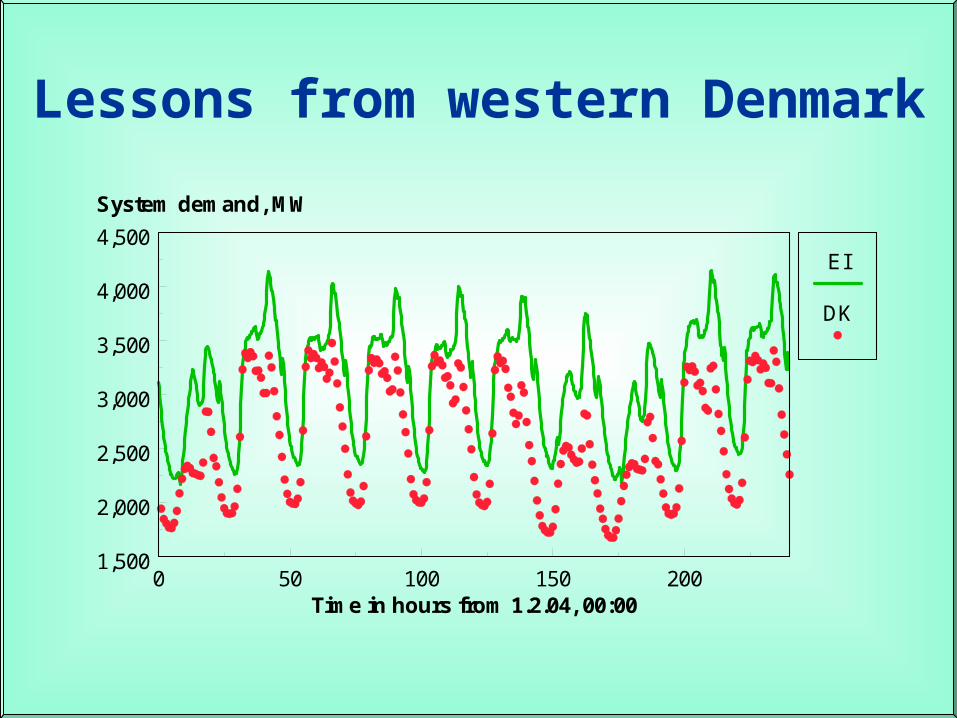
Lessons from western Denmark
0 50 100 150 2001,500
2,000
2,500
3,000
3,500
4,000
4,500
Time in hours from 1.2.04, 00:00
System demand, MW
EI
DK
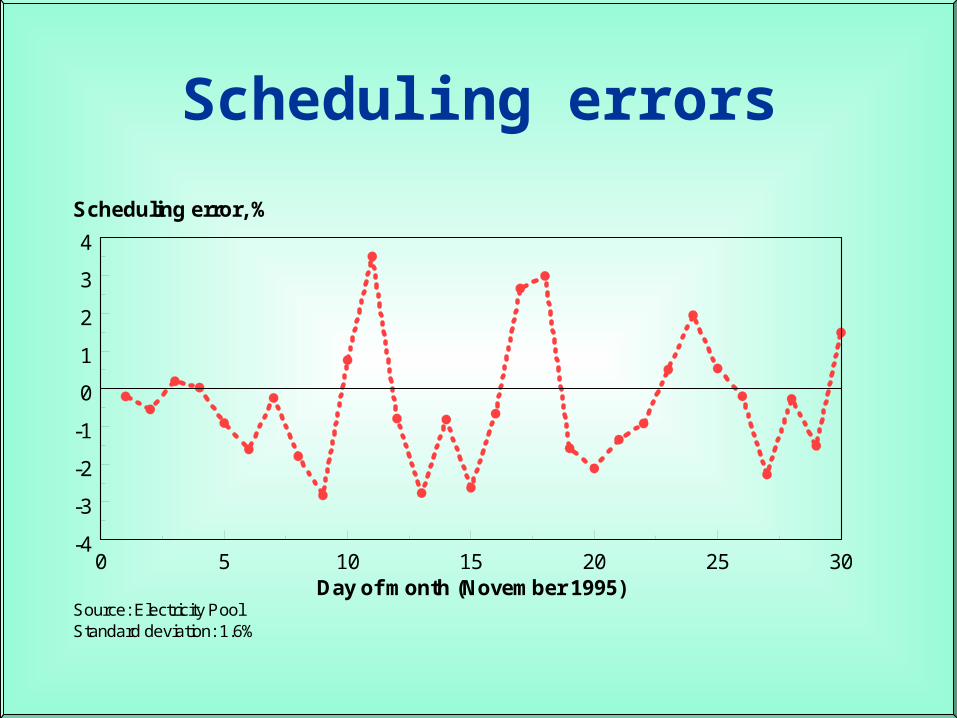
Scheduling errors
Source: Electricity PoolStandard deviation: 1.6%
0 5 10 15 20 25 30-4
-3
-2
-1
0
1
2
3
4
Day of month (November 1995)
Scheduling error, %
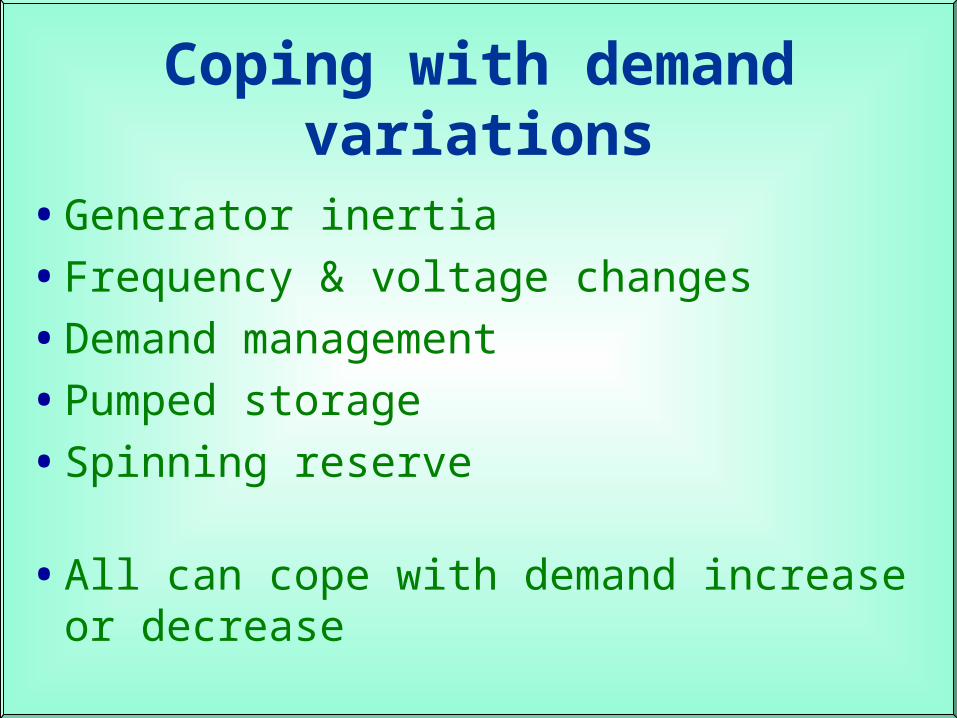
Coping with demand variations
•Generator inertia
•Frequency & voltage changes
•Demand management
•Pumped storage
•Spinning reserve
•All can cope with demand increase or decrease

Wind characteristics

Smoothing makes a difference
0 5 10 15 200
200
400
600
800
1,000
Time, hours
Wind output, MW
Singlefarm
Distributedfarms

Smoothing of power swings
-100 -50 0 50 100
0.01
0.1
1
10
Change, % rated capacity
Time, %
1 farm
WesternDenmark
Time interval: 1 hour
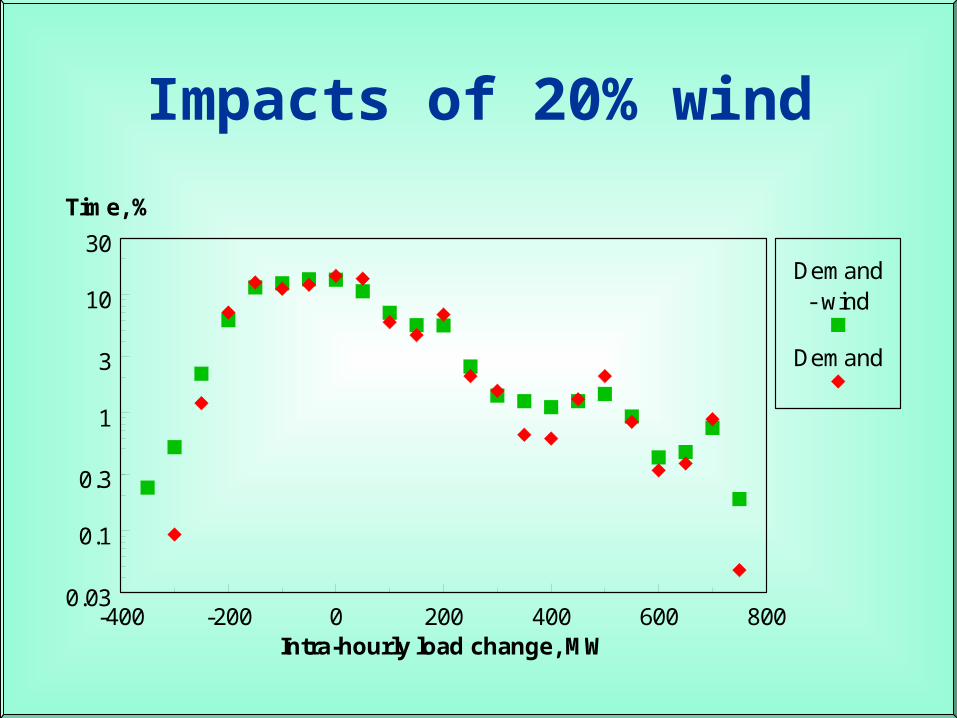
Impacts of 20% wind
-400 -200 0 200 400 600 8000.03
0.1
0.3
1
3
10
30
Intra-hourly load change, MW
Time, %
Demand- wind
Demand
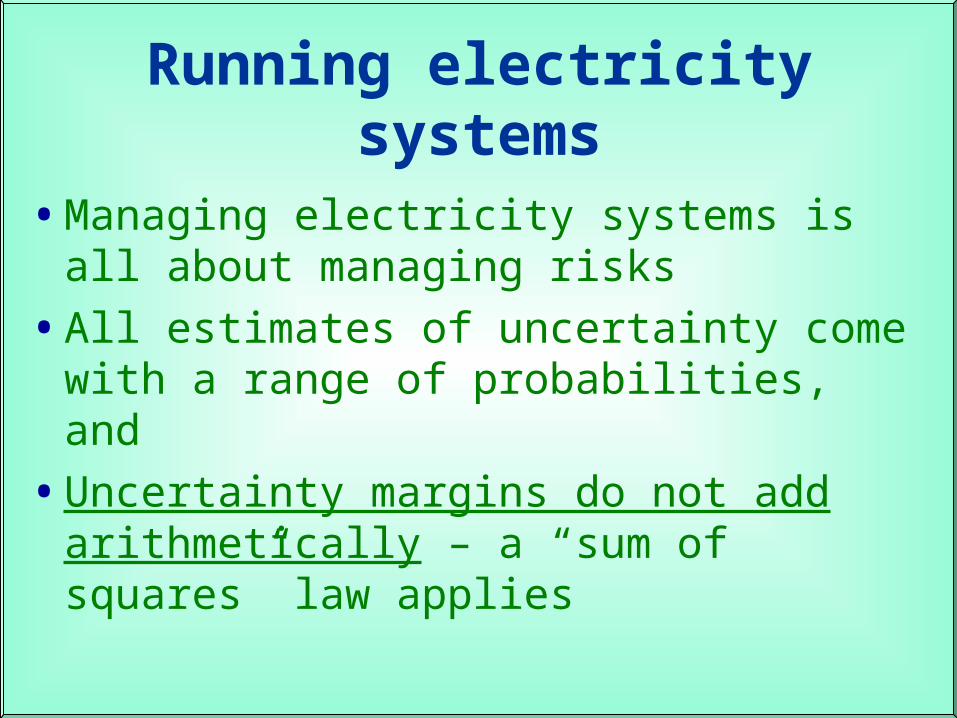
Running electricity systems
•Managing electricity systems is all about managing risks
•All estimates of uncertainty come with a range of probabilities, and
•Uncertainty margins do not add arithmetically – a “sum of squares” law applies
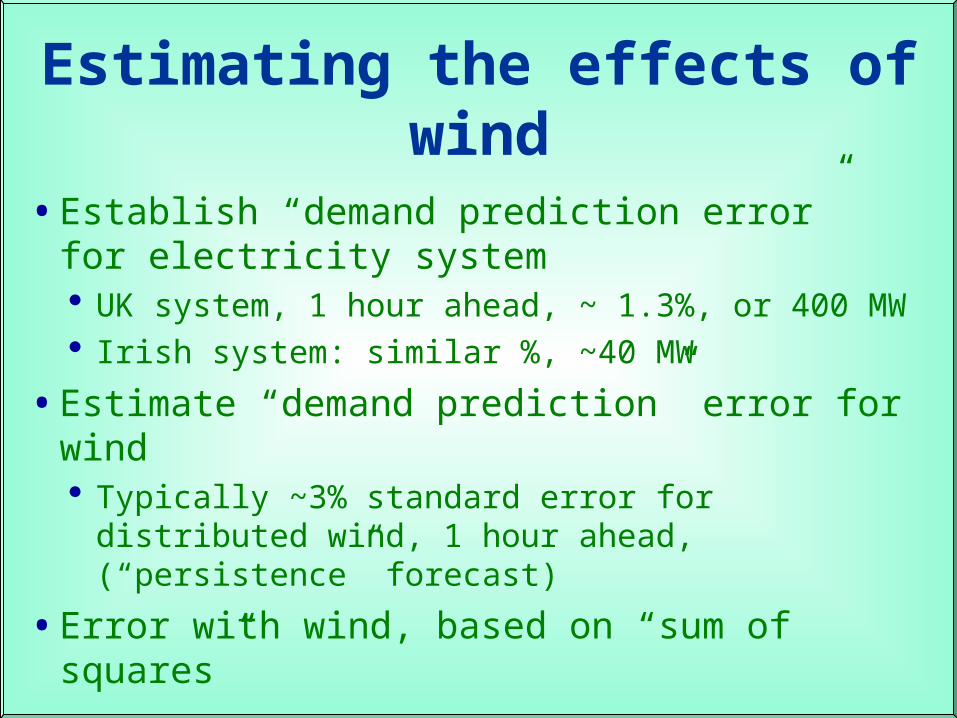
Estimating the effects of wind
•Establish “demand prediction error” for electricity system UK system, 1 hour ahead, ~ 1.3%, or 400 MW Irish system: similar %, ~40 MW
•Estimate “demand prediction” error for wind Typically ~3% standard error for distributed
wind, 1 hour ahead, (“persistence” forecast)
•Error with wind, based on “sum of squares”
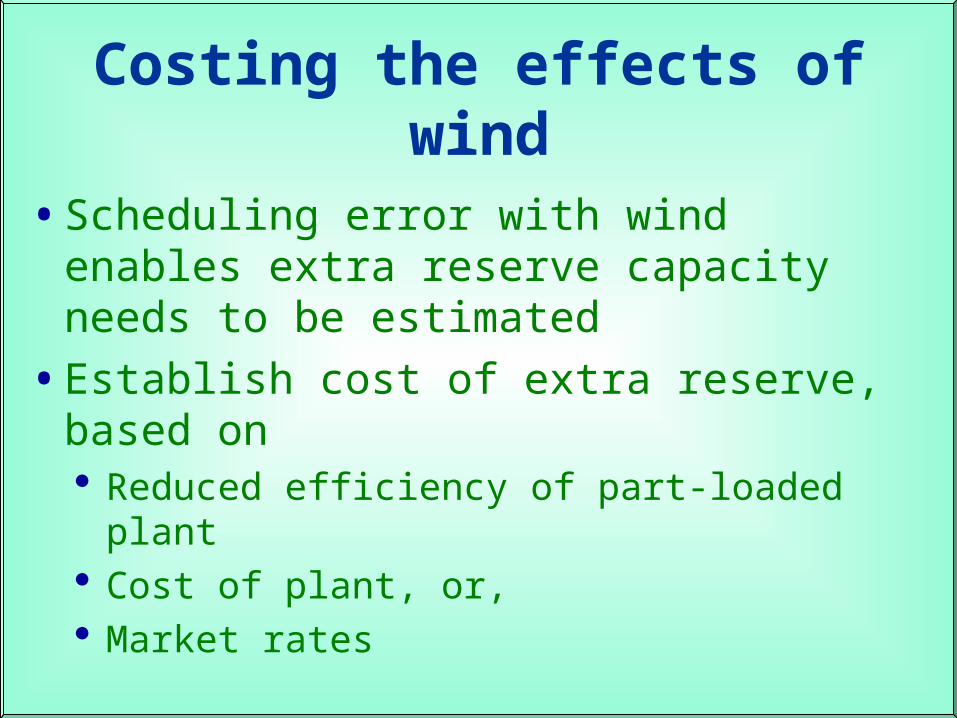
Costing the effects of wind
•Scheduling error with wind enables extra reserve capacity needs to be estimated
•Establish cost of extra reserve, based on Reduced efficiency of part-loaded plant Cost of plant, or, Market rates
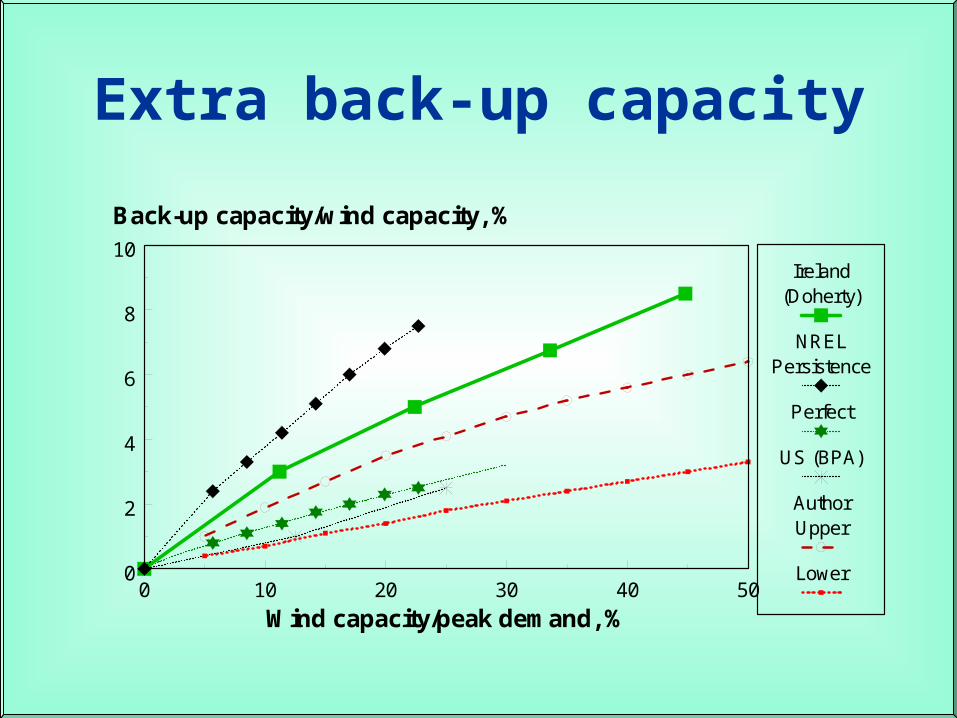
Extra back-up capacity
0 10 20 30 40 500
2
4
6
8
10
Wind capacity/peak demand, %
Back-up capacity/wind capacity, %
Ireland(Doherty)
NRELPersistence
Perfect
US (BPA)
AuthorUpper
Lower
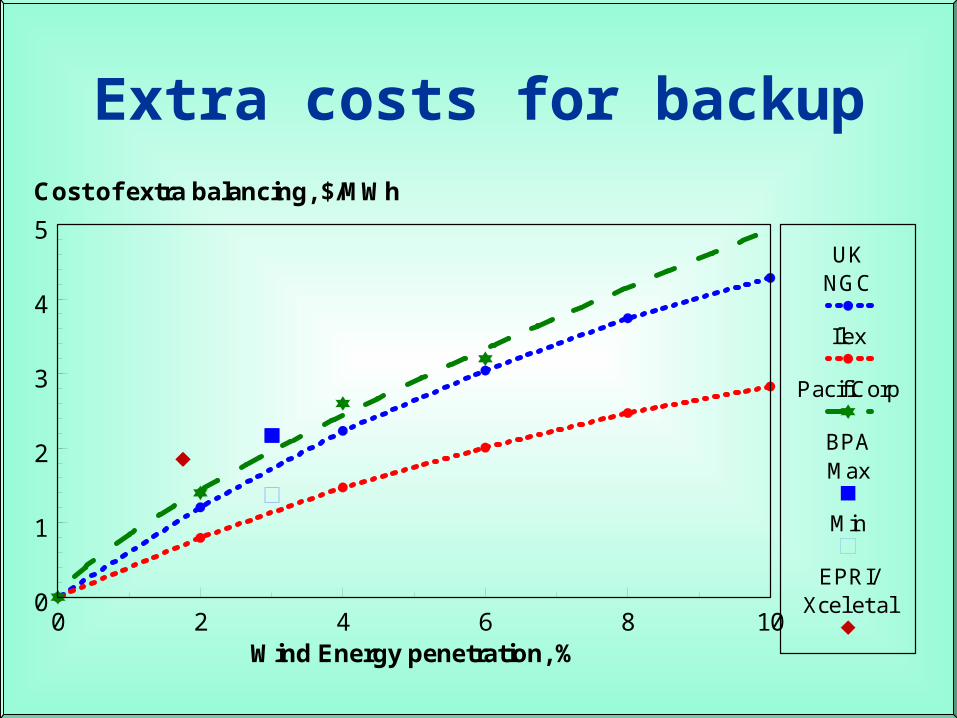
Extra costs for backup
0 2 4 6 8 100
1
2
3
4
5
Wind Energy penetration, %
Cost of extra balancing, $/MWh
UKNGC
Ilex
PacifiCorp
BPAMax
Min
EPRI/Xcel et al

Storage
•"Renewables need storage" ? Rather misleading!
•Only the intermittent sources
•"Storage can transform the economics of the intermittent renewables" ?
•Only if they are very low cost!
•Several studies have concluded that economics must be studied separately; may be useful to system, or as reserve
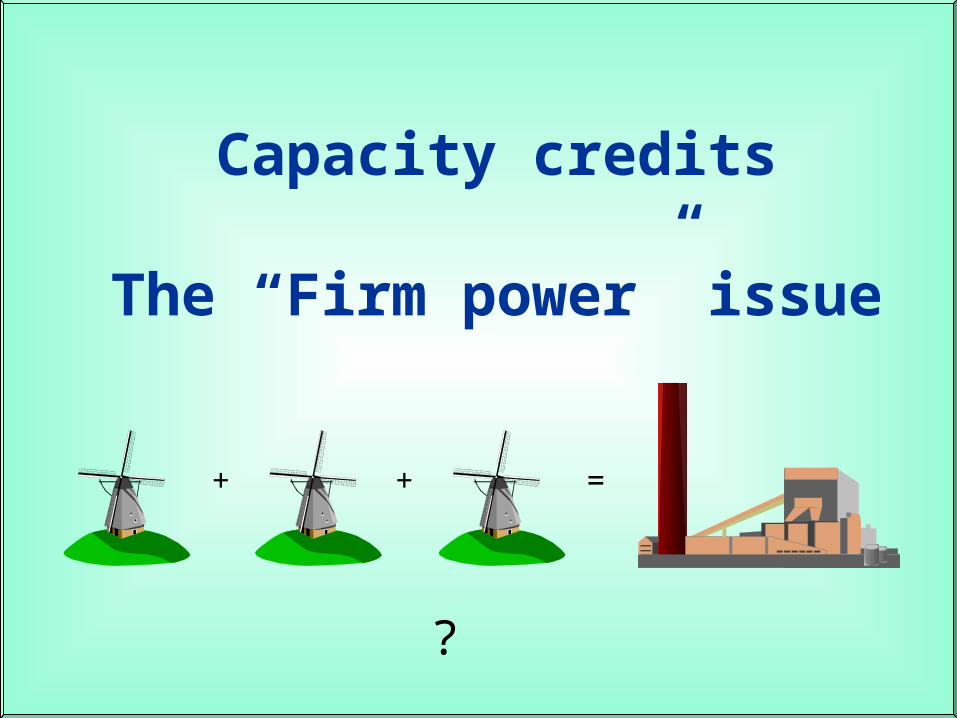
Capacity credits
The “Firm power” issue
+ + =
?

Capacity credits
•Controversial, despite -
•Most authoritative studies confirm wind HAS a capacity credit. Includes Ireland
•Note that definitions a muddle Some refer to firm power, some to thermal
plant Firm power is less than rated capacity – For ALL types of plant!!
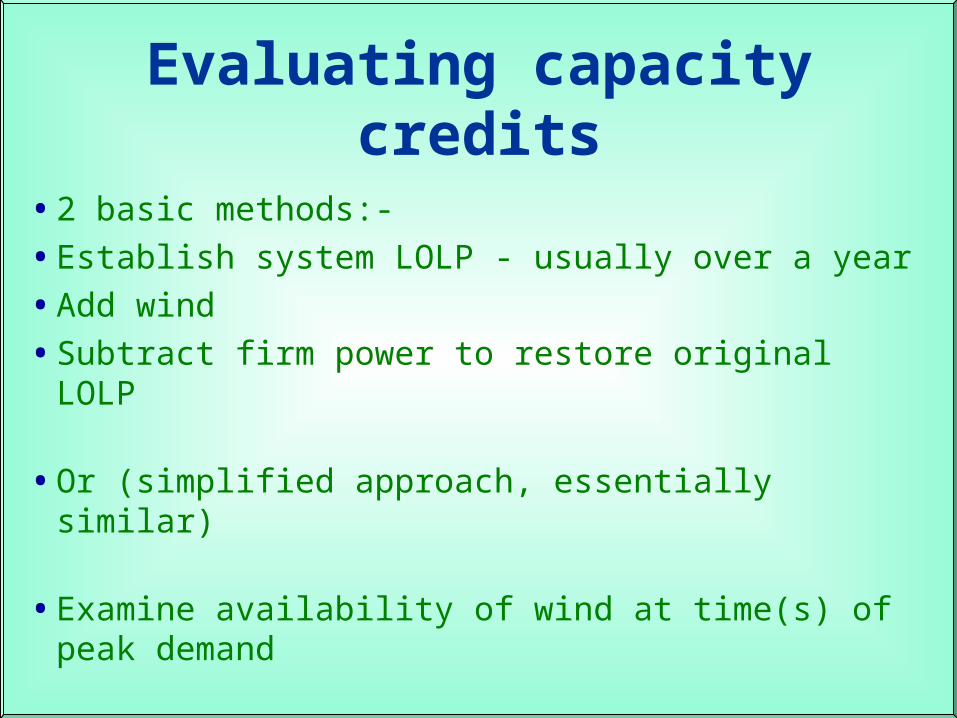
Evaluating capacity credits
•2 basic methods:-
•Establish system LOLP - usually over a year
•Add wind
•Subtract firm power to restore original LOLP
•Or (simplified approach, essentially similar)
•Examine availability of wind at time(s) of peak demand
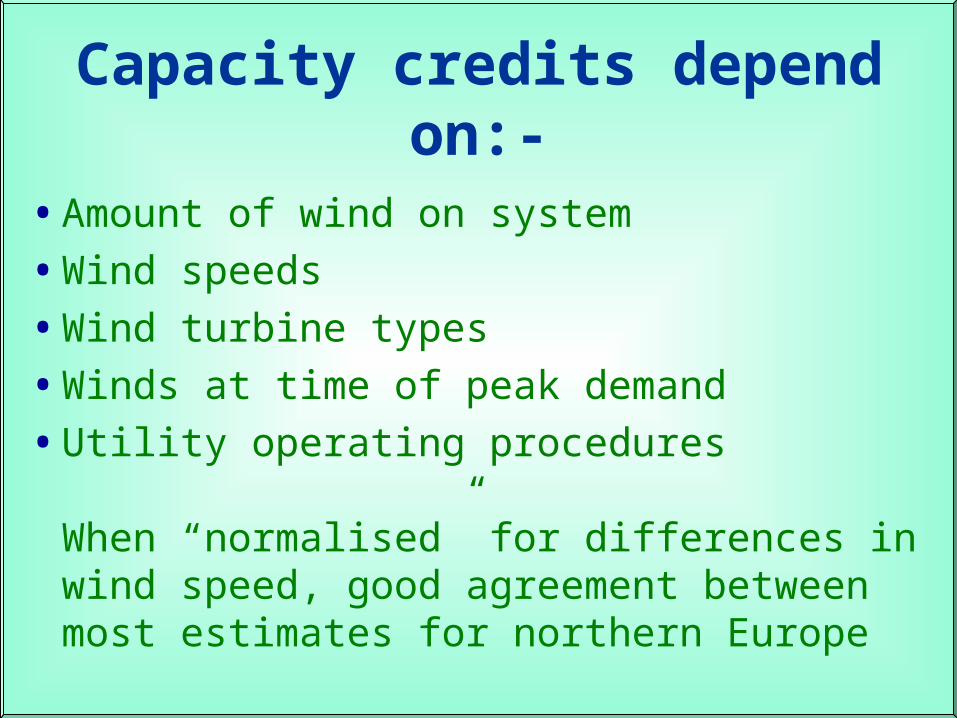
Capacity credits depend on:-
•Amount of wind on system
•Wind speeds
•Wind turbine types
•Winds at time of peak demand
•Utility operating procedures
When “normalised” for differences in wind speed, good agreement between most estimates for northern Europe
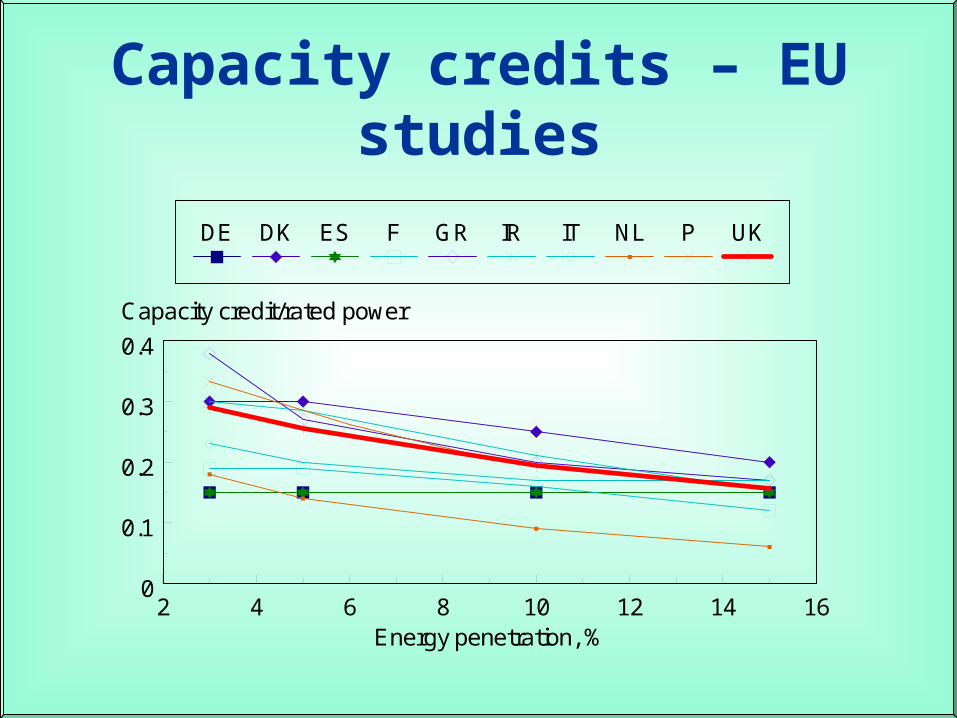
Capacity credits – EU studies
2 4 6 8 10 12 14 160
0.1
0.2
0.3
0.4
Energy penetration, %
Capacity credit/rated power
DE DK ES F GR IR IT NL P UK
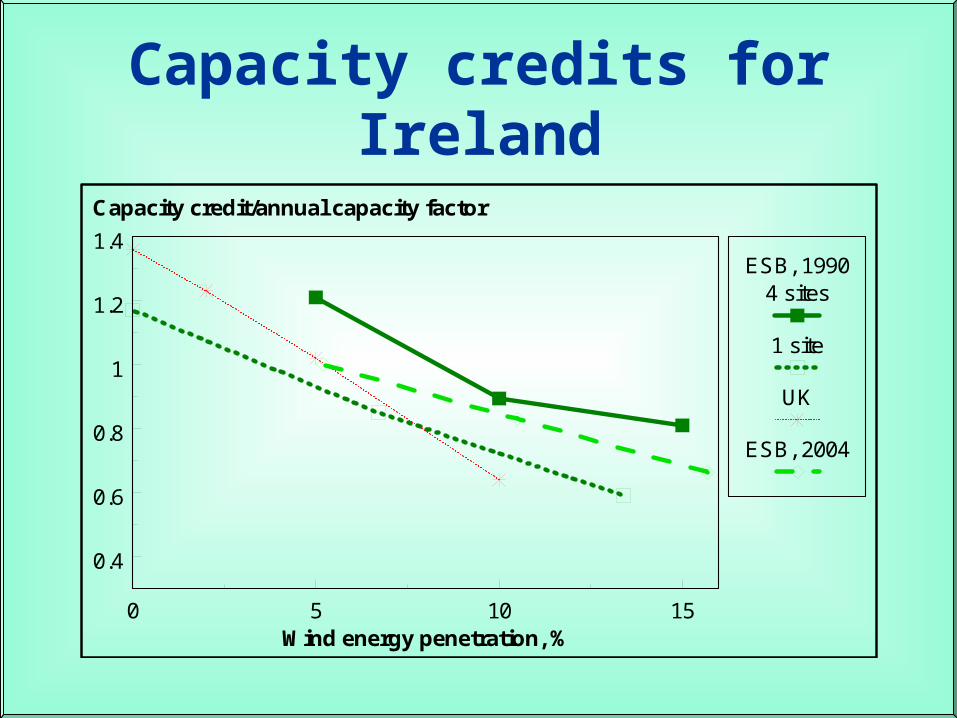
Capacity credits for Ireland
0 5 10 15
0.4
0.6
0.8
1
1.2
1.4
Wind energy penetration, %
Capacity credit/annual capacity factor
ESB, 19904 sites
1 site
UK
ESB, 2004
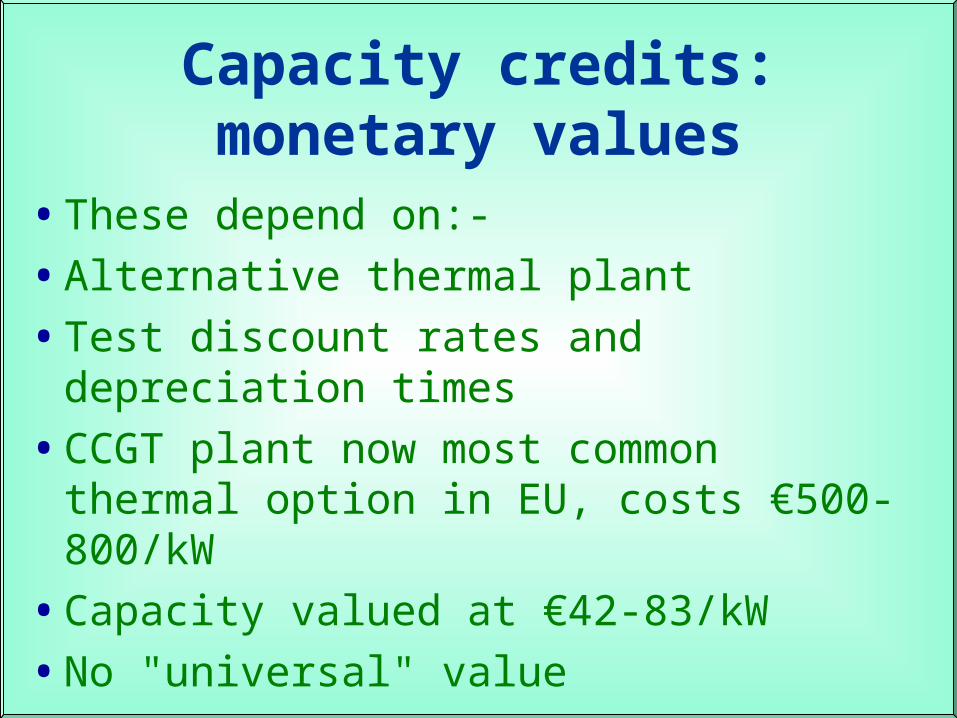
Capacity credits: monetary values
•These depend on:-
•Alternative thermal plant
•Test discount rates and depreciation times
•CCGT plant now most common thermal option in EU, costs €500-800/kW
•Capacity valued at €42-83/kW
•No "universal" value
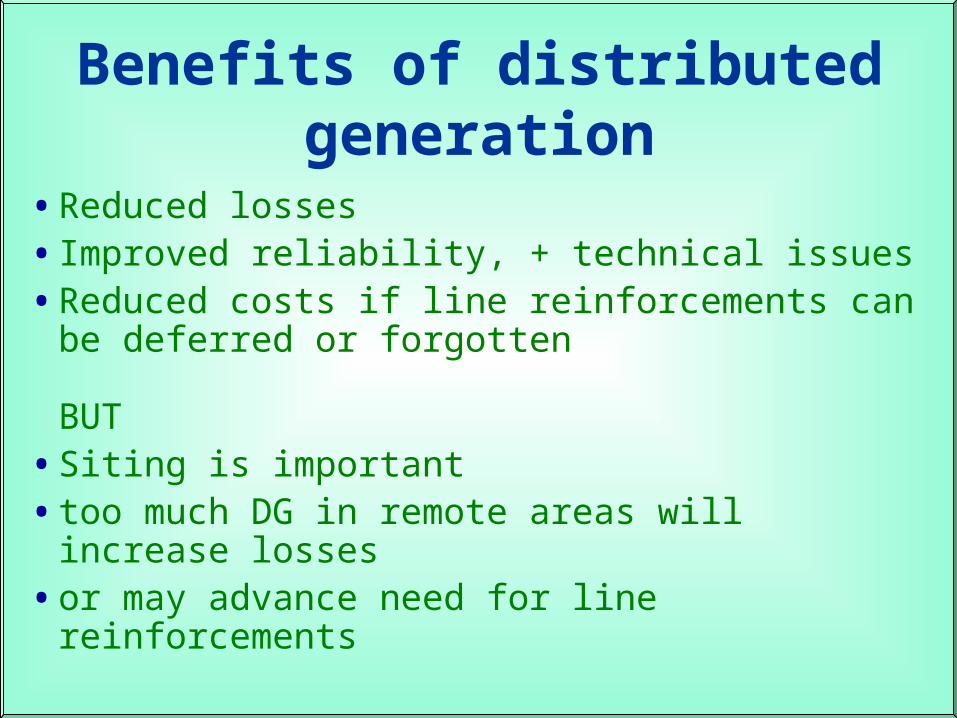
Benefits of distributed generation
•Reduced losses• Improved reliability, + technical issues•Reduced costs if line reinforcements can
be deferred or forgotten
BUT•Siting is important•too much DG in remote areas will increase
losses•or may advance need for line
reinforcements
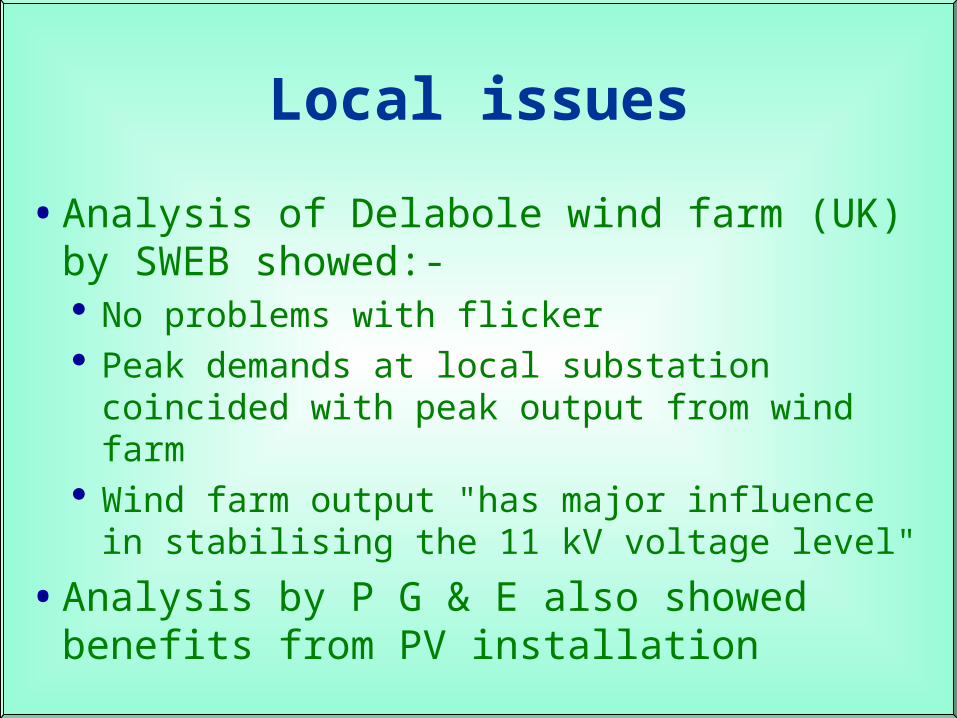
Local issues
•Analysis of Delabole wind farm (UK) by SWEB showed:- No problems with flicker Peak demands at local substation
coincided with peak output from wind farm Wind farm output "has major influence in
stabilising the 11 kV voltage level"
•Analysis by P G & E also showed benefits from PV installation
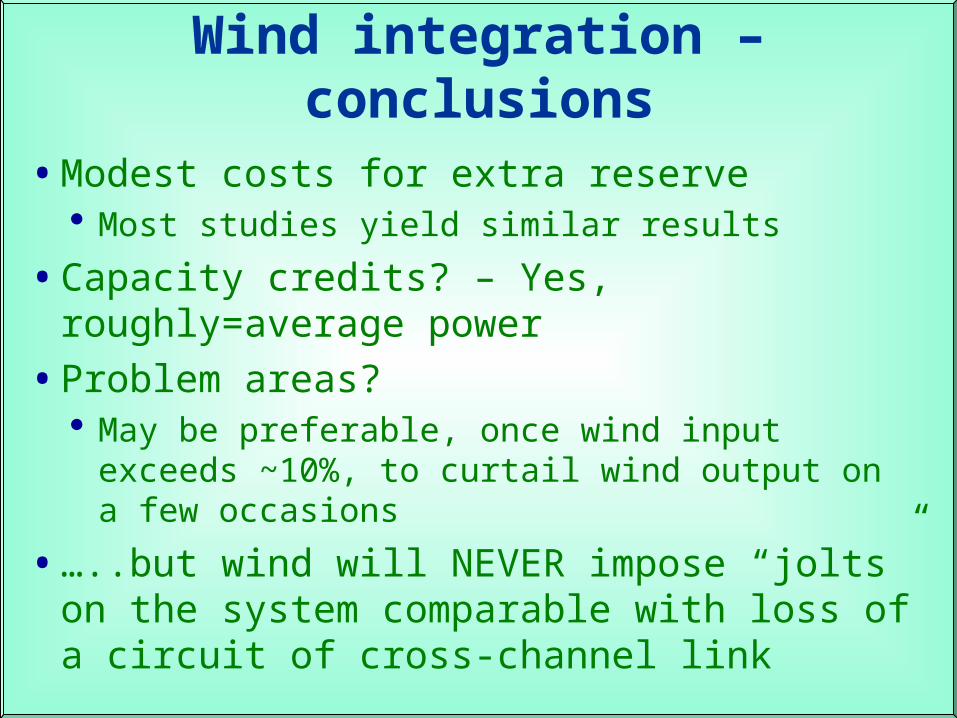
Wind integration – conclusions
•Modest costs for extra reserve Most studies yield similar results
•Capacity credits? – Yes, roughly=average power
•Problem areas? May be preferable, once wind input exceeds
~10%, to curtail wind output on a few occasions
•…..but wind will NEVER impose “jolts” on the system comparable with loss of a circuit of cross-channel link
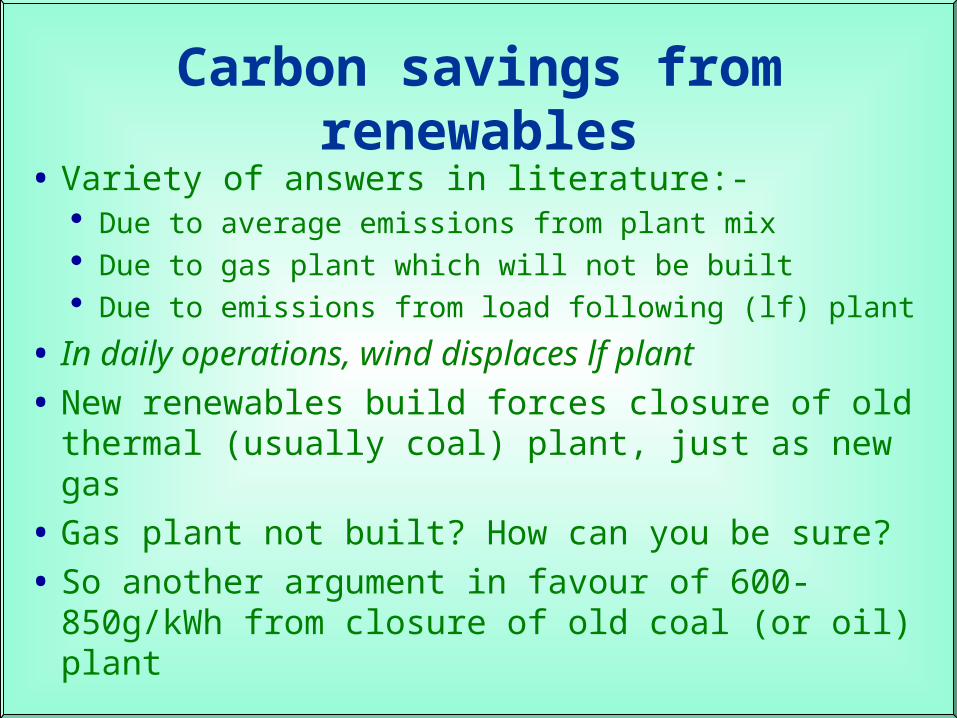
Carbon savings from renewables
• Variety of answers in literature:- Due to average emissions from plant mix Due to gas plant which will not be built Due to emissions from load following (lf) plant
• In daily operations, wind displaces lf plant
• New renewables build forces closure of old thermal (usually coal) plant, just as new gas
• Gas plant not built? How can you be sure?
• So another argument in favour of 600-850g/kWh from closure of old coal (or oil) plant
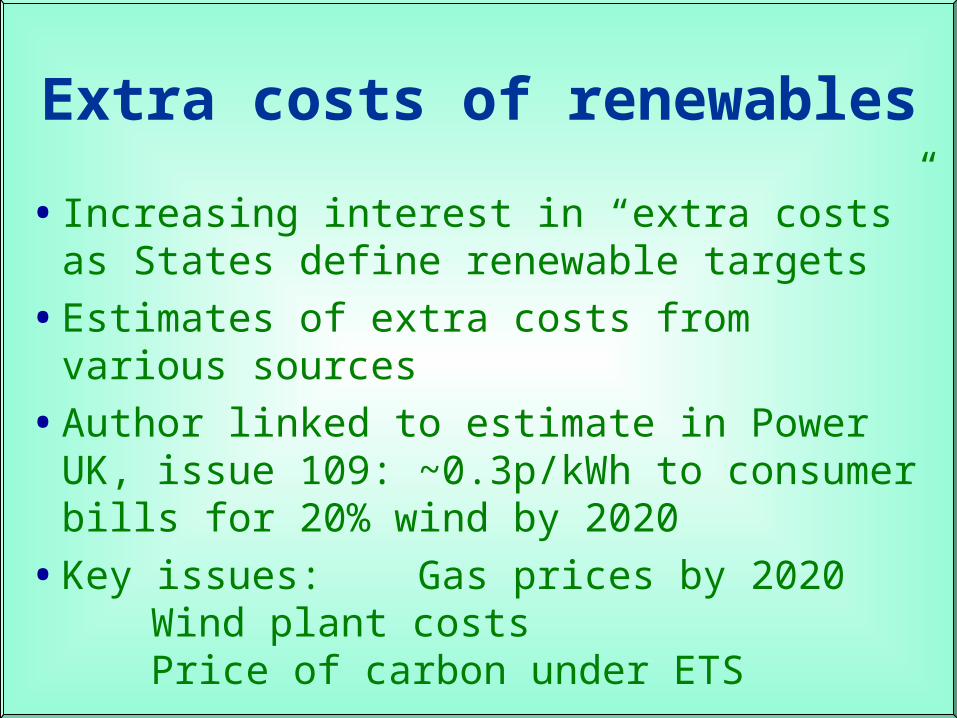
Extra costs of renewables
• Increasing interest in “extra costs” as States define renewable targets
•Estimates of extra costs from various sources
•Author linked to estimate in Power UK, issue 109: ~0.3p/kWh to consumer bills for 20% wind by 2020
•Key issues: Gas prices by 2020Wind plant costsPrice of carbon under ETS

Possible future Irish scenarios
System MW
5000 5000 5000 6500 6500 6500
Wind % 5 10 16 12 20 27
Wind MW
500 1000 1500 1500 2500 3500
Offshore %
25 30 40 40 45 50
Date 2005 2008 2010 2010 2017 2025
Source of base data (green): ESBNG; author’s assumptions in red

Future gas prices
Source: US DoE, Annual Energy Outlook, 2004
2000 2005 2010 2015 2020 202512
14
16
18
20
22
Year
Gas price to electricity generators, $/MWh
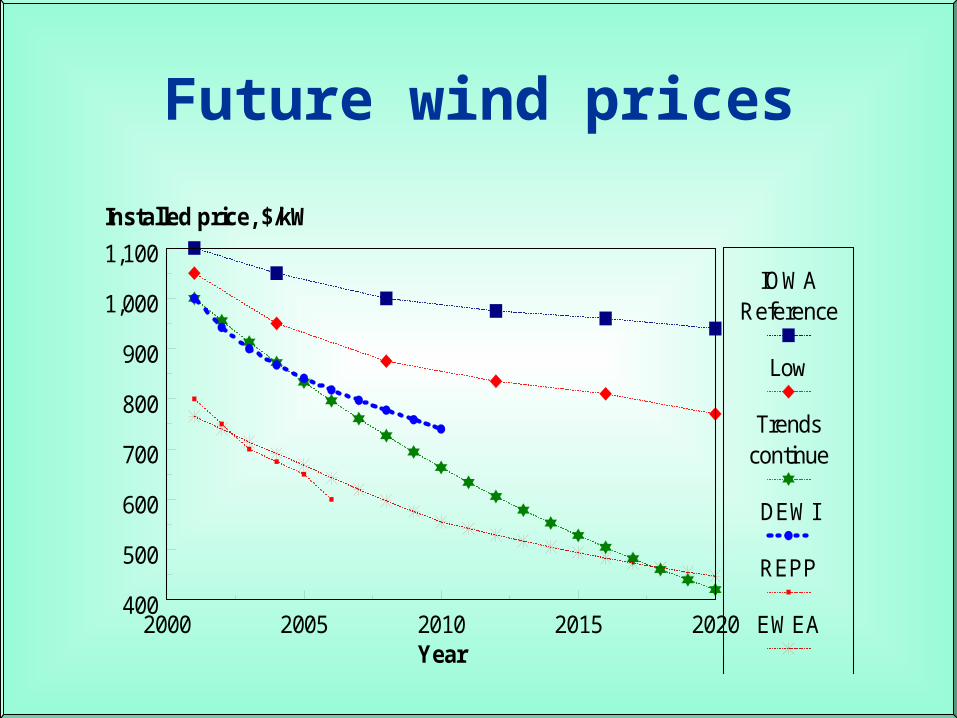
Future wind prices
2000 2005 2010 2015 2020400
500
600
700
800
900
1,000
1,100
Year
Installed price, $/kW
IOWAReference
Low
Trendscontinue
DEWI
REPP
EWEA

Possible costs to electricity consumers of
adding wind
US DoE gas price trendsNo allowance for costs under ETS
2005 2010 2015 2020 2025-0.6
-0.4
-0.2
0
0.2
0.4
0.6
0.8
1
Year
Extra cost, €/MWh

Thank you!
The End