wind loads on heliostats and pv trackers at various ... et al+2011+wind loads on... · 2 solar...
TRANSCRIPT

* Corresponding author: Tel.: ++49 711 6862 479, Fax: ++49 711 6862 8032
Wind loads on heliostats and photovoltaic trackers at various Reynolds numbers A. Pfahla,*, H. Uhlemannb aGerman Aerospace Center (DLR) Solar Research Pfaffenwaldring 38-40 D – 70569 Stuttgart Germany [email protected] bGerman Dutch Wind Tunnels (DNW) Bunsenstrasse 10 D – 37073 Göttingen Germany [email protected] Available online at http://www.sciencedirect.com/science/article/pii/S0167610511001231 © 2011 The Authors. Published by Elsevier Ltd. Journal of Wind Engineering and Industrial Aerodynamics, Vol. 99, Issue 9, Sept. 2011, Pages 964–968 doi:10.1016/j.jweia.2011.06.009
Abstract Wind loads on heliostats are usually determined at boundary layer, low-speed wind tunnels at which the design full-scale Reynolds number cannot be reached. In doing so, it is supposed the wind load coefficients are Reynolds number independent, which is known to be the case for sharp edged bodies. But for the stow position the usually round torque tube is directly exposed to the wind and could influence the wind loads. By measurements in a high-pressure wind tunnel, it can be demonstrated that the design-relevant wind load coefficients are not Reynolds number dependent. However, the inclination of the mirror plane in stow position, due to the deflection of the heliostats structure at high Reynolds number, leads to increased wind loads and must be considered. The results are also valid for photovoltaic trackers of similar shape. Keywords heliostat, PV tracker, wind load, Reynolds number, high pressure wind tunnel, central receiver, solar tower, concentrated solar power, solar thermal
1 Introduction

2
Solar thermal power plants are a promising option to cover significant parts of increasing energy demand. At solar tower plants (Figure 1), sun-light is concentrated by mirrors that track the sun in two axes, the so-called heliostats. To reduce the blocking of each other, the heliostats reflect the sun rays to the top of a tower. There a receiver absorbs the radiation and supplies thermal energy to a power cycle; alternatively, the energy is used by chemical thermal processes or concentrated photovoltaic generation.
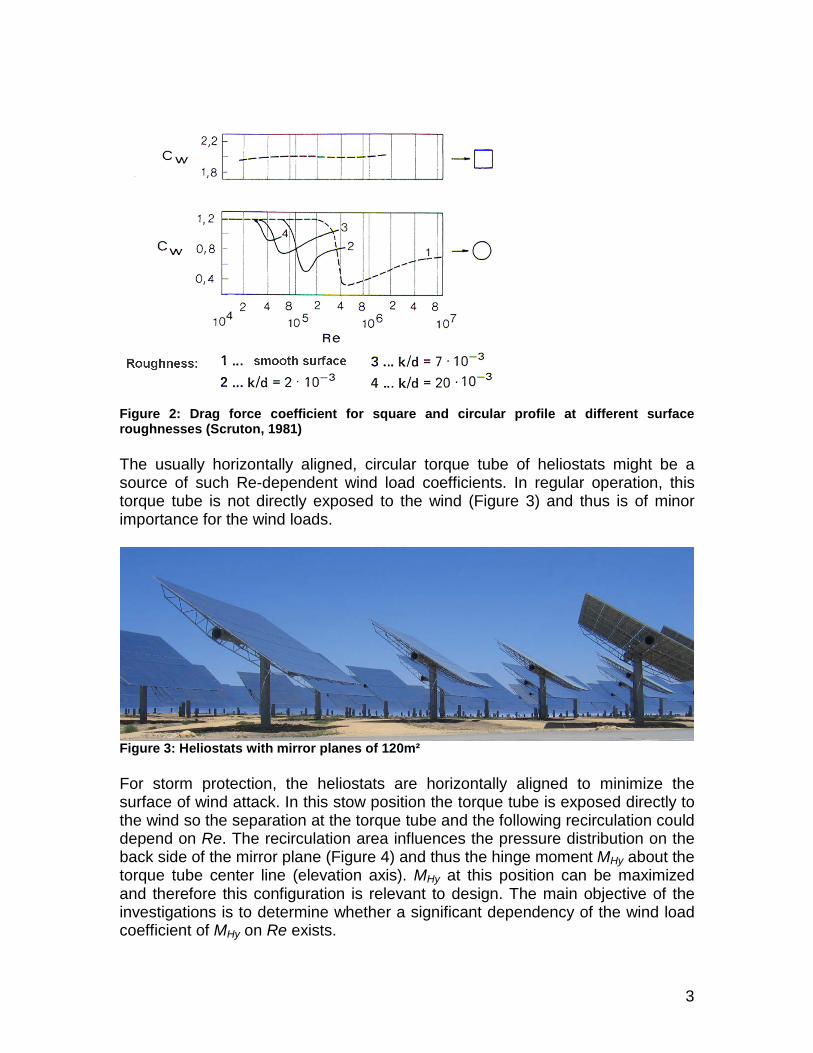
Figure 1: Solar tower plant (BSE, 2011) The heliostat field is the main cost factor of solar tower plants. For a cost efficient dimensioning of the heliostats, the wind loads must be known. Wind tunnel measurements that have been published so far have all performed at Reynolds numbers (Re) considerably below the maximum values that can occur in realty. While the drag force coefficient of sharp-edged bodies does not depend on Re because the separation is determined by the edges, for structures with round edges it may significantly vary beyond a certain critical Re depending on the surface roughness (k/d = grain size of sand / diameter of cylinder), see Figure 2.
3
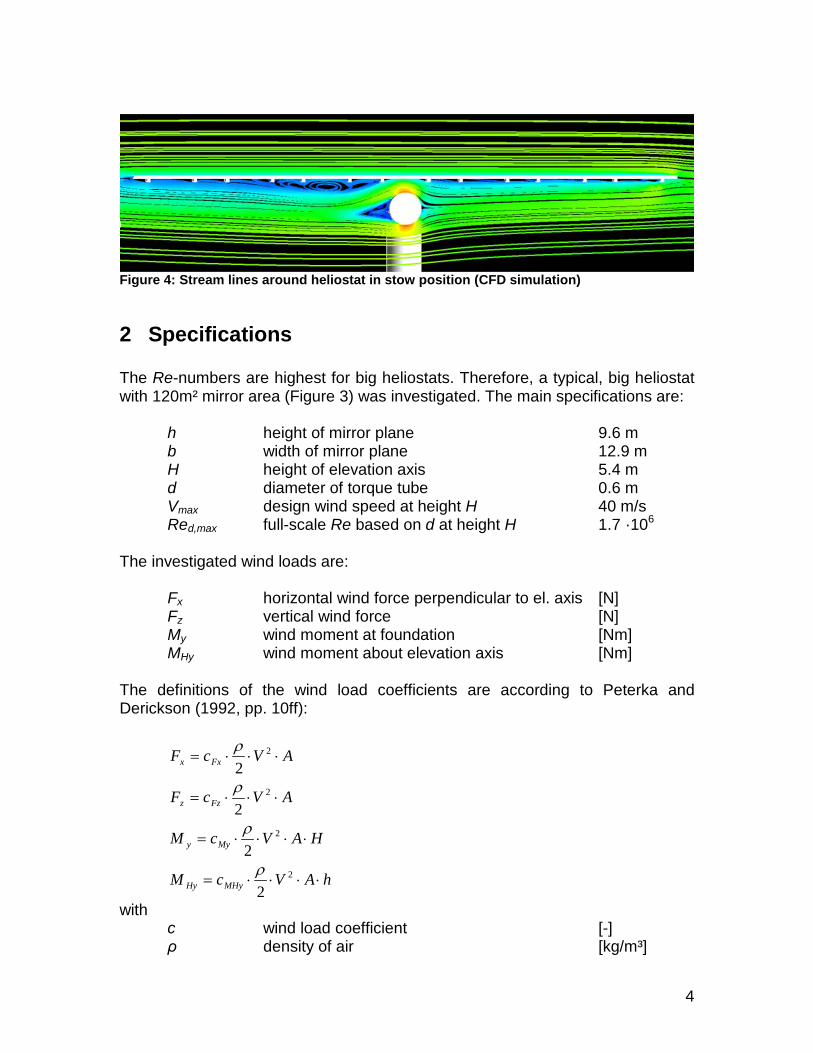
Figure 2: Drag force coefficient for square and circular profile at different surface roughnesses (Scruton, 1981) The usually horizontally aligned, circular torque tube of heliostats might be a source of such Re-dependent wind load coefficients. In regular operation, this torque tube is not directly exposed to the wind (Figure 3) and thus is of minor importance for the wind loads.
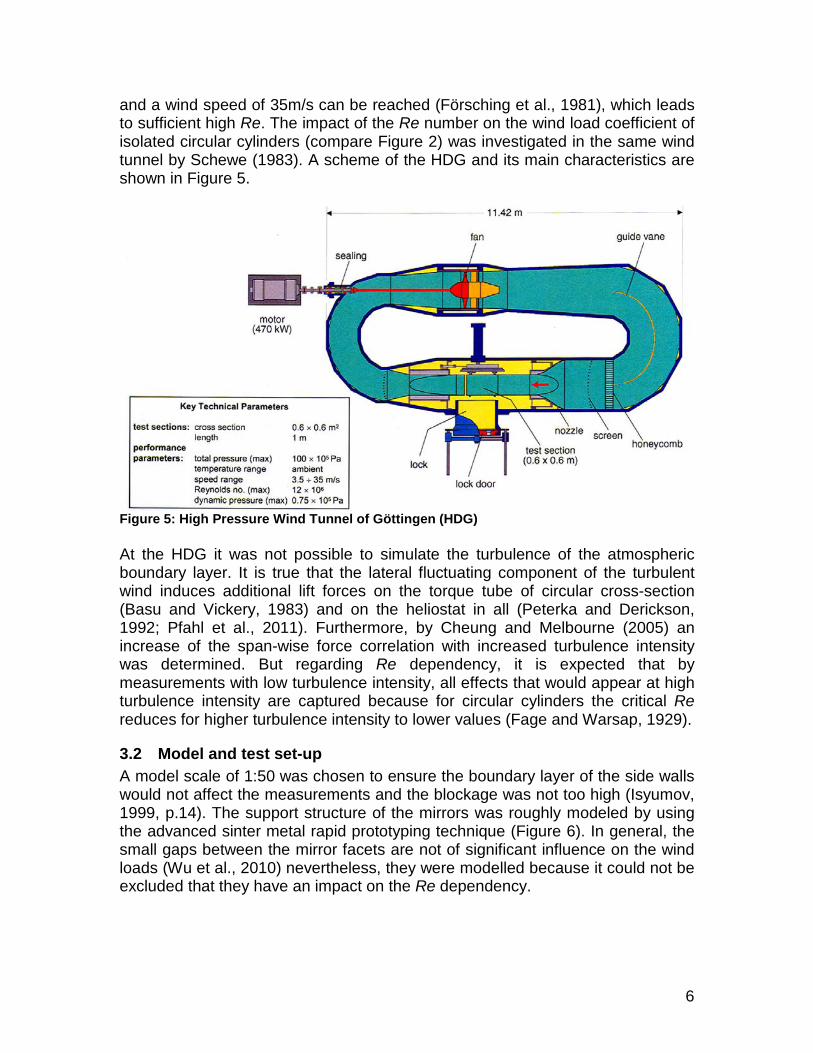
Figure 3: Heliostats with mirror planes of 120m² For storm protection, the heliostats are horizontally aligned to minimize the surface of wind attack. In this stow position the torque tube is exposed directly to the wind so the separation at the torque tube and the following recirculation could depend on Re. The recirculation area influences the pressure distribution on the back side of the mirror plane (Figure 4) and thus the hinge moment MHy about the torque tube center line (elevation axis). MHy at this position can be maximized and therefore this configuration is relevant to design. The main objective of the investigations is to determine whether a significant dependency of the wind load coefficient of MHy on Re exists.
4
Figure 4: Stream lines around heliostat in stow position (CFD simulation)
2 Specifications The Re-numbers are highest for big heliostats. Therefore, a typical, big heliostat with 120m² mirror area (Figure 3) was investigated. The main specifications are: h height of mirror plane 9.6 m b width of mirror plane 12.9 m H height of elevation axis 5.4 m d diameter of torque tube 0.6 m Vmax design wind speed at height H 40 m/s Red,max full-scale Re based on d at height H 1.7 ·106 The investigated wind loads are: Fx horizontal wind force perpendicular to el. axis [N] Fz vertical wind force [N] My wind moment at foundation [Nm] MHy wind moment about elevation axis [Nm] The definitions of the wind load coefficients are according to Peterka and Derickson (1992, pp. 10ff):
AVcF Fxx ⋅⋅⋅= 2
2ρ
AVcF Fzz ⋅⋅⋅= 2
2ρ
HAVcM Myy ⋅⋅⋅⋅= 2
2ρ
hAVcM MHyHy ⋅⋅⋅⋅= 2
2ρ
with c wind load coefficient [-] ρ density of air [kg/m³]

5
V mean wind speed at elevation axis height H [m/s] A mirror area [m²]
3 Method 3.1 Selection of tool For the determination of the Re dependency, computational fluid dynamics (CFD) is not feasible because the prediction of the position of the separation point of round-shaped bodies is not reliable yet. The determination of the Re dependency in the atmosphere at full scale is hardly possible because the appearance of the needed high wind speeds is seldom and not predictable. Investigations in a wind tunnel at real scale would demand a huge wind tunnel, which was not available. Measurements in conventional wind tunnels would be relatively cheap, but the needed Re cannot be reached; Re reduces with the model scale (Re is linear to the length scale):
ηρ lV ⋅⋅
=Re
with l characteristic length [m]
η dynamic viscosity [kg·m/s] Even if the required wind speed could be reached, the results of the measurements would not be reliable because the Mach number would be higher than 1 at regions of high wind speed (especially at the thickest cross section of the cylinder) so the flow could not be regarded as incompressible which is a requirement for the assumption of similarity (Hucho, 2002, pp. 439ff). By roughening of the round shapes the critical Re can be reduced (see Figure 2). But it is still too high to be reached by conventional boundary layer wind tunnels. Furthermore, the flow of the recirculation area would be influenced which would distort the results. Re can also be increased by using a fluid of lower kinematic viscosity (ν=η/ρ), like water (15 times lower than air), as realized in water tunnels. But at high fluid speed, cavitation occurs so the achievable Re is too low for the given task (Hucho, 2002, p. 470). In kryo channels, the kinematic viscosity is reduced as well – through cooling of the fluid. However, the Mach number is also increased and therefore (because of the Mach number limitation) the specified Re number could not be reached at the available Kryo Channel of Cologne (Vieweger, 1989). Instead of cooling the fluid it also can be pressurized to increase its density. At the High Pressure Wind Tunnel of Göttingen (HDG), up to 100bars (=10MPa)
6
and a wind speed of 35m/s can be reached (Försching et al., 1981), which leads to sufficient high Re. The impact of the Re number on the wind load coefficient of isolated circular cylinders (compare Figure 2) was investigated in the same wind tunnel by Schewe (1983). A scheme of the HDG and its main characteristics are shown in Figure 5.
Figure 5: High Pressure Wind Tunnel of Göttingen (HDG) At the HDG it was not possible to simulate the turbulence of the atmospheric boundary layer. It is true that the lateral fluctuating component of the turbulent wind induces additional lift forces on the torque tube of circular cross-section (Basu and Vickery, 1983) and on the heliostat in all (Peterka and Derickson, 1992; Pfahl et al., 2011). Furthermore, by Cheung and Melbourne (2005) an increase of the span-wise force correlation with increased turbulence intensity was determined. But regarding Re dependency, it is expected that by measurements with low turbulence intensity, all effects that would appear at high turbulence intensity are captured because for circular cylinders the critical Re reduces for higher turbulence intensity to lower values (Fage and Warsap, 1929).
3.2 Model and test set-up A model scale of 1:50 was chosen to ensure the boundary layer of the side walls would not affect the measurements and the blockage was not too high (Isyumov, 1999, p.14). The support structure of the mirrors was roughly modeled by using the advanced sinter metal rapid prototyping technique (Figure 6). In general, the small gaps between the mirror facets are not of significant influence on the wind loads (Wu et al., 2010) nevertheless, they were modelled because it could not be excluded that they have an impact on the Re dependency.

7
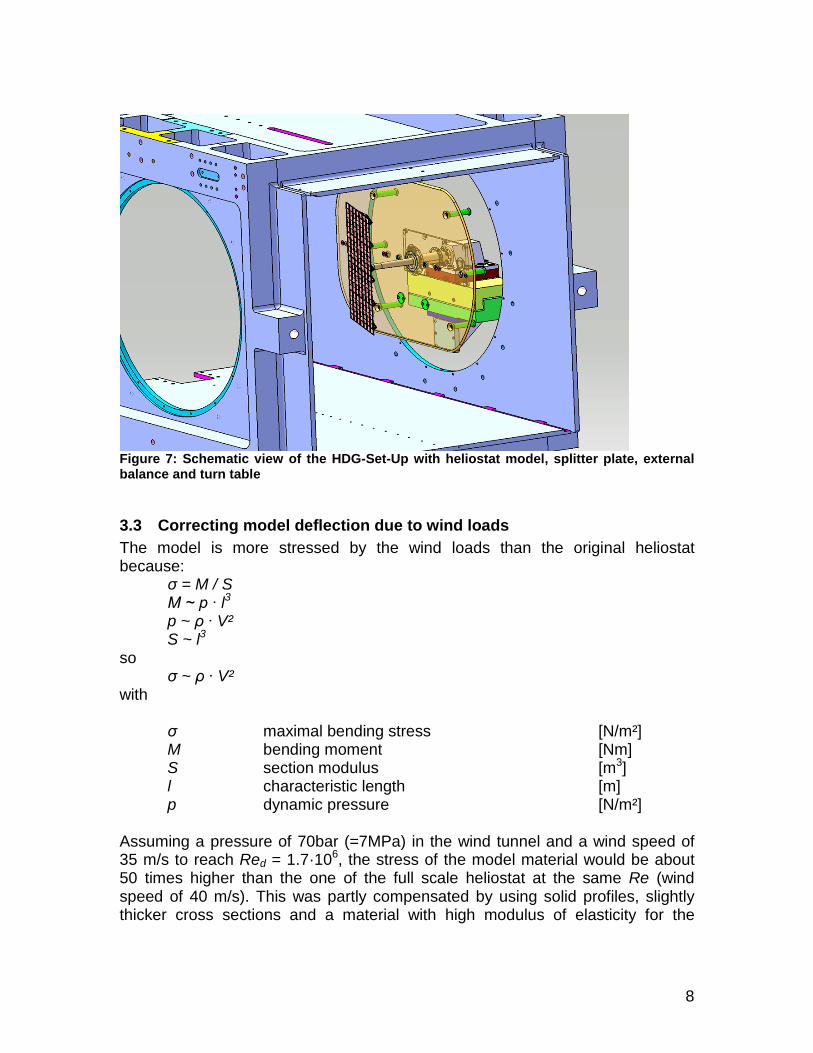
Figure 6: Heliostat model in HDG, scale 1:50 The heliostat model was arranged above a splitter plate, simulating the ground, and connected to a strain gauge balance outside the test section. The whole set-up is integrated into the side wall. Here the heliostat model is mounted by its pylon to the external balance (Figure 7). Although possible in the HDG, no wind-over-ground profile was simulated because for the stow position, it should be of negligible influence. A 90° angle of wind attack to the torque tube at horizontal mirror plane was investigated because at this configuration the influence of the torque tube should be highest.
8
Figure 7: Schematic view of the HDG-Set-Up with heliostat model, splitter plate, external balance and turn table
3.3 Correcting model deflection due to wind loads The model is more stressed by the wind loads than the original heliostat because:
σ = M / S M ~ p ∙ l3 p ~ ρ ∙ V² S ~ l3 so
σ ~ ρ ∙ V² with
σ maximal bending stress [N/m²] M bending moment [Nm] S section modulus [m3] l characteristic length [m] p dynamic pressure [N/m²]
Assuming a pressure of 70bar (=7MPa) in the wind tunnel and a wind speed of 35 m/s to reach Red = 1.7·106, the stress of the model material would be about 50 times higher than the one of the full scale heliostat at the same Re (wind speed of 40 m/s). This was partly compensated by using solid profiles, slightly thicker cross sections and a material with high modulus of elasticity for the

9
model. Nevertheless, at high Re, deflection of the model could not be avoided which is critical because it influences the results significantly. To eliminate the influence of the deflection, the inclination caused by the measured loads at high Re was calculated via FEM (finite element method). The model was validated by calculating and measuring the deflection at a nominal panel inclination angle of the mirror plane of 10° and at Red = 1.7·106. Taking the backlash of the bearing also into account, a good accordance between measurements and simulation could be assessed (Figure 8).
Figure 8: Calculated (left and middle) and measured (right) deflection of wind tunnel model at Re = 1.7·106 With the FEM model, the influence of the deflection could be eliminated by the following steps:
• Measurement of the moment about the pylon base for a nominal panel inclination of 0° at Red = 1.7·106
• Calculation of the pressure distribution according to the typical pressure distribution of an even plate at small angles of wind attack and according to the measured moment about the pylon base
• Calculation of the deflection caused by this pressure distribution via FEM model and determination of the resulting inclination of the mirror plane
• Measurement of the wind loads at the calculated inclination at low Re • Comparison of the wind load coefficients at Red = 1.7·106 and a nominal
panel inclination of 0° and at the calculated inclination and low Re: If a Re dependency exists the values should be different.
4 Results All six components of the aerodynamic loads were systematically measured at Red= 0.2·106 - 1.7·106, at nominal inclination (at unloaded mirror plane) and yaw angles of 0º (storm idle position). The diagram (Figure 9, solid lines) shows the

10
coefficients of drag (cFx), lift (cFz), and pitching moment about pylon base (cMy) over Re. According to Schlichting and Truckenbrodt (1969, pp. 72ff), a linear, increasing pressure toward the edge of attack can be assumed as pressure distribution for even plates at small angles of wind attack. With this approach and taking the measured loads into account, the according pressure distribution was determined and applied to the FEM model. An average deflection of the mirror plane of 4° was calculated. For nominal inclination of 4° and low Red= 0.45·106, the coefficients of drag (cFx), lift (cFz), and pitching moment (cMy) were measured and are given in Figure 9 as single measuring points.
Figure 9: Wind load coefficients for various Re and resulting 0°-4° inclination of the mirror plane due to deformation (solid lines) and for 4° inclination at low Re The solid lines of Figure 9 represent the measured values for the nominal panel inclination of 0º, but with the actual load induced inclination between 0º (low Re-number) and 4º (highest Re-number). If the measured value at Red= 0.45·106 at nominal panel inclination of 4º (which needs no correction) is compared with the measured value at Red= 1.7·106 at nominal panel inclination of 0º which has to be corrected to 4º, it can be concluded that the design-driving components drag, lift and pitching moment coefficients are not depending on Re (dashed line).
5 Discussion At the stow position, the drag force Fx, lift force Fz , pitching moment My and hinge moment MHy reach their maximal value at storm conditions. Thus, their values at stow position are relevant for the design of heliostats. Since MHy is hard to measure directly, it is calculated by the drag force Fx and by the moment at the

11
pylon feet My (Peterka and Derickson, 1992, p. 10). As the wind load coefficients of Fx and My show no Re dependency, the wind load coefficient of MHy is not Re dependent as well. cFz shows a slight decrease with Re (dashed line). But compared to the increase due to deflection (solid line), it is small and is within the range of the uncertainties of the method.
6 Conclusions No design-relevant Re dependency of the wind load coefficients of heliostats at stow position was measured. Thus, it is valid to determine the wind load coefficients at conventional boundary layer wind tunnels at low Re. But at the layout of heliostats their possible deflection through wind loads and the resulting increase of the inclination of the mirror plane at high Re must be considered. Hence, stiffness and damping of the structure must be high enough to avoid torsional divergence, flutter, galloping and resonance due to vortex shedding of the structure itself or of upstream structures at any possible Re number (Cook, 1985). The results of this investigation can not be transferred to solar trough collectors because the round shape of the trough is surely of bigger influence than the torque tube of a heliostat. Hosoya et al. (2008, pp. 39f) performed wind tunnel measurements for trough collectors with various Re, but the critical Re was not reached (compare with Figure 2). An approval of the Re independency of the wind load coefficients of solar trough collectors is still absent and could be also examined in the High Pressure Wind Tunnel of Göttingen.
7 Acknowledgment The authors thank the DLR division “Energy” for the financing of the measurements.
8 References Basu, R.I., Vickery, B.J., 1983. Across-wind vibrations of structure of circular cross-section. Part II. Development of a mathematical model for full-scale application. Journal of Wind Engineering and Industrial Aerodynamics, 12, 75-97. BSE, 2011. www.brightsourceenergy.com/media_room. Cheung, J.C.K., Melbourne, W.H., 2005. Spanwise deck sectional force correlation of bridge in motion in turbulent flow. Proceedings of the Sixth Asia-Pacific Conference on Wind Engineering, Seoul, Korea, 150-157.

12
Cook, N.J., 1985. The designer’s guide to wind loading of building structures – Part 1: Background, damage survey, wind data and structural classification. Butterworths, London. Fage, A.., Warsap, J.H., 1929. The effects of turbulence and surface roughness on the drag of a circular cylinder. British Aeronautical Research Concil, Rept1179, 248-255, London. Försching, H.W., Melzer, E., Schewe, G., 1981. Ein neuer Windkanal für gebäudeaerodynamische und aeroelastische Untersuchungen bei Reynoldszahlen bis 107, Konstruktiver Ingenieurbau Berichte, 35/36, 127-133. Hosoya, N., Peterka, J.A., Gee, R.C., Kearney, D., 2008. Wind Tunnel Test of Parabolic Trough Solar Collectors, NREL Subcontract Report NREL/SR-550-32282, Golden, Colorado. Hucho, W.H., 2002. Aerodynamik der stumpfen Körper, Vieweg Verlag, Braunschweig/Wiesbaden. Isyumov, N. (Ed.), 1999. Wind Tunnel Studies of Buildings and Structures. ASCE Manuals and Reports on Engineering Practice No. 67, Virginia. Peterka, J.A., Derickson R.G., 1992. Wind load design methods for ground based heliostats and parabolic dish collectors. Report SAND92-7009, Sandia National Laboratories, Springfield. Pfahl, A., Buselmeier, M., Zaschke, M, 2011. Wind loads on heliostats and photovoltaic trackers of various aspect ratios. Solar Energy, article in press, doi: 10.1016/j.solener.2011.06.006. Schewe, G., 1983. On the force fluctuations acting on a circular cylinder in crossflow from subcritical up to transcritical Reynolds numbers. Journal of Fluid Mechanics, 133, 265-285. Schlichting, H., Truckenbrodt, E. 1969. Aerodynamik des Flugzeuges, Zweiter Band: Aerodynamik des Tragflügels (Teil 2 ), des Rumpfes, der Flügel-Rumpf-Anordnung und der Leitwerke, Springer Verlag, Berlin/Göttingen/Heidelberg. Scruton, C., 1981. An Introduction to Wind Effects on Structures. Engineering design guides 40, Oxford University Press. Vieweger, G., 1989. The Kryo-Kanal Köln – KKK, DLR internal report, Cologne. Wu, Z. et al., 2010. An experimental and numerical study of the gap effect on wind load on heliostat, Renewable Energy, 35, 797-806.