wind power in the united states: technology, economic, · pdf fileorder code rl34546 wind...
TRANSCRIPT

Order Code RL34546
Wind Power in the United States: Technology, Economic, and Policy Issues
June 20, 2008
Jeffrey Logan and Stan Mark KaplanSpecialists in Energy Policy
Resources, Science, and Industry Division

Wind Power in the United States:Technology, Economic, and Policy Issues
Summary
Rising energy prices and concern over greenhouse gas emissions have focusedcongressional attention on energy alternatives, including wind power. Although windpower currently provides only about 1% of U.S. electricity needs, it is growing morerapidly than any other energy source. In 2007, over 5,000 megawatts of new windgenerating capacity were installed in the United States, second only to new naturalgas-fired generating capacity. Wind power has become “mainstream” in manyregions of the country, and is no longer considered an “alternative” energy source.
Wind energy has become increasingly competitive with other power generationoptions. Wind technology has improved significantly over the past two decades.CRS analysis presented here shows that wind energy still depends on federal taxincentives to compete, but that key uncertainties like climate policy, fossil fuel prices,and technology progress could dominate future cost competitiveness.
A key challenge for wind energy is that electricity production depends on whenwinds blow rather than when consumers need power. Wind’s variability can createadded expenses and complexity in balancing supply and demand on the grid. Recentstudies imply that these integration costs do not become significant (5-10% ofwholesale prices) until wind turbines account for 15-30% of the capacity in a givencontrol area. Another concern is that new transmission infrastructure will be requiredto send the wind-generated power to demand centers. Building new lines can beexpensive and time-consuming, and there are debates over how construction costsshould be allocated among end-users and which pricing methodologies are best.
Opposition to wind power arises for environmental, aesthetic, or aviationsecurity reasons. New public-private partnerships have been established to addressmore comprehensively problems with avian (bird and bat) deaths resulting from windfarms. Some stakeholders oppose the construction of wind plants for visual reasons,especially in pristine or highly-valued areas. A debate over the potential for windturbines to interfere with aviation radar emerged in 2006, but most experts believeany possible problems are economically and technically manageable.
Federal wind power policy has centered primarily on the production tax credit(PTC), a business incentive to operate wind facilities. The PTC is set to expire onDecember 31, 2008. Analysts and wind industry representatives argue that the on-again off-again nature of the PTC is inefficient and leads to higher costs for theindustry. While there is often bipartisan support for the PTC in Congress, debatecenters more fundamentally on how to offset its revenue losses. A federal renewableportfolio standard — which would mandate wind power levels — was rejected in theSenate in late 2007; its future is uncertain.
If wind is to supply up to 20% of the nation’s power by 2030, as suggested bya recent U.S. Department of Energy report, additional federal policies will likely berequired to overcome barriers, and ensure development of an efficient wind market.
Contents
Introduction . . . . . . . . . . . . . . . . . . . . . . . . . . . . . . . . . . . . . . . . . . . . . . . . . . . . . . 1
Background . . . . . . . . . . . . . . . . . . . . . . . . . . . . . . . . . . . . . . . . . . . . . . . . . . . . . . 2The Rise of Wind . . . . . . . . . . . . . . . . . . . . . . . . . . . . . . . . . . . . . . . . . . . . . . 3Benefits and Drawbacks of Wind Power . . . . . . . . . . . . . . . . . . . . . . . . . . . . 5
Wind Resources and Technology . . . . . . . . . . . . . . . . . . . . . . . . . . . . . . . . . . . . . . 8Wind Power Fundamentals . . . . . . . . . . . . . . . . . . . . . . . . . . . . . . . . . . . . . . 8
Physical Relationships . . . . . . . . . . . . . . . . . . . . . . . . . . . . . . . . . . . . . . 8Wind Resources . . . . . . . . . . . . . . . . . . . . . . . . . . . . . . . . . . . . . . . . . . . . . . . 9
Offshore Wind . . . . . . . . . . . . . . . . . . . . . . . . . . . . . . . . . . . . . . . . . . . 11Wind Power Technology . . . . . . . . . . . . . . . . . . . . . . . . . . . . . . . . . . . . . . . 11
Types of Wind Turbines . . . . . . . . . . . . . . . . . . . . . . . . . . . . . . . . . . . 12Capacity Factor . . . . . . . . . . . . . . . . . . . . . . . . . . . . . . . . . . . . . . . . . . 14Wind Research and Development Emphasis . . . . . . . . . . . . . . . . . . . . 14
Wind Industry Composition and Trends . . . . . . . . . . . . . . . . . . . . . . . . . . . . . . . 15Wind Turbine Manufacturers and Wind Plant Developers . . . . . . . . . . . . . 18International Comparisons . . . . . . . . . . . . . . . . . . . . . . . . . . . . . . . . . . . . . . 19
Wind Power Economics . . . . . . . . . . . . . . . . . . . . . . . . . . . . . . . . . . . . . . . . . . . . 22Cost and Operating Characteristics of Wind Power . . . . . . . . . . . . . . . . . . 23
Wind Operation and System Integration Issues . . . . . . . . . . . . . . . . . . 24Levelized Cost Comparison . . . . . . . . . . . . . . . . . . . . . . . . . . . . . . . . . . . . . 26
Wind Policy Issues . . . . . . . . . . . . . . . . . . . . . . . . . . . . . . . . . . . . . . . . . . . . . . . . 32Siting and Permitting Issues . . . . . . . . . . . . . . . . . . . . . . . . . . . . . . . . . . . . . 32Transmission Constraints . . . . . . . . . . . . . . . . . . . . . . . . . . . . . . . . . . . . . . . 36
Federal Renewable Transmission Initiatives . . . . . . . . . . . . . . . . . . . . 38Renewable Production Tax Credit . . . . . . . . . . . . . . . . . . . . . . . . . . . . . . . . 39
PTC Eligibility: IOUs vs. IPPs . . . . . . . . . . . . . . . . . . . . . . . . . . . . . . 40Specific PTC Legislative Options . . . . . . . . . . . . . . . . . . . . . . . . . . . . 40Carbon Constraints and the PTC . . . . . . . . . . . . . . . . . . . . . . . . . . . . . 41Alternatives to the PTC . . . . . . . . . . . . . . . . . . . . . . . . . . . . . . . . . . . . 41
Renewable Portfolio Standards . . . . . . . . . . . . . . . . . . . . . . . . . . . . . . . . . . 42Federal RPS Debate . . . . . . . . . . . . . . . . . . . . . . . . . . . . . . . . . . . . . . . 42
Conclusions . . . . . . . . . . . . . . . . . . . . . . . . . . . . . . . . . . . . . . . . . . . . . . . . . . . . . 43
Appendix. Financial Analysis Methodology and Assumptions . . . . . . . . . . . . . 44
List of Figures
Figure 1. Cumulative Installed U.S. Wind Capacity . . . . . . . . . . . . . . . . . . . . . . . 3Figure 2. Wind Power Aerodynamics . . . . . . . . . . . . . . . . . . . . . . . . . . . . . . . . . . 8Figure 3. U.S. Wind Resources Potential . . . . . . . . . . . . . . . . . . . . . . . . . . . . . . 10
Figure 4. Evolution of U.S. Commercial Wind Technology . . . . . . . . . . . . . . . . 12Figure 5. Components in a Simplified Wind Turbine . . . . . . . . . . . . . . . . . . . . . 13Figure 6. Installed Wind Capacity By State in 2007 . . . . . . . . . . . . . . . . . . . . . . 16Figure 7. Existing and Planned North American Wind Plants by Size . . . . . . . . 17Figure 8. U.S. Wind Turbine Market Share by Manufacturer in 2007 . . . . . . . . 18Figure 9. Global Installed Wind Capacity By Country . . . . . . . . . . . . . . . . . . . . 20Figure 10. Component Costs for Typical Wind Plants . . . . . . . . . . . . . . . . . . . . 23
List of Tables
Table 1. Wind Energy Penetration Rates by Country . . . . . . . . . . . . . . . . . . . . . 20Table 2. Assumptions for Generating Technologies . . . . . . . . . . . . . . . . . . . . . . 27Table 3. Economic Comparison of Wind Power with Alternatives . . . . . . . . . . . 31Table 4. Selected Wind Power Tax Incentive Bills Compared . . . . . . . . . . . . . . 41Table A-1. Base Case Financial Factors . . . . . . . . . . . . . . . . . . . . . . . . . . . . . . . 47Table A-2. Base Case Fuel and Allowance Price Forecasts . . . . . . . . . . . . . . . . 48Table A-3. Power Plant Technology Assumptions . . . . . . . . . . . . . . . . . . . . . . . 49
Wind Power in the United States:Technology, Economic and Policy Issues
Introduction
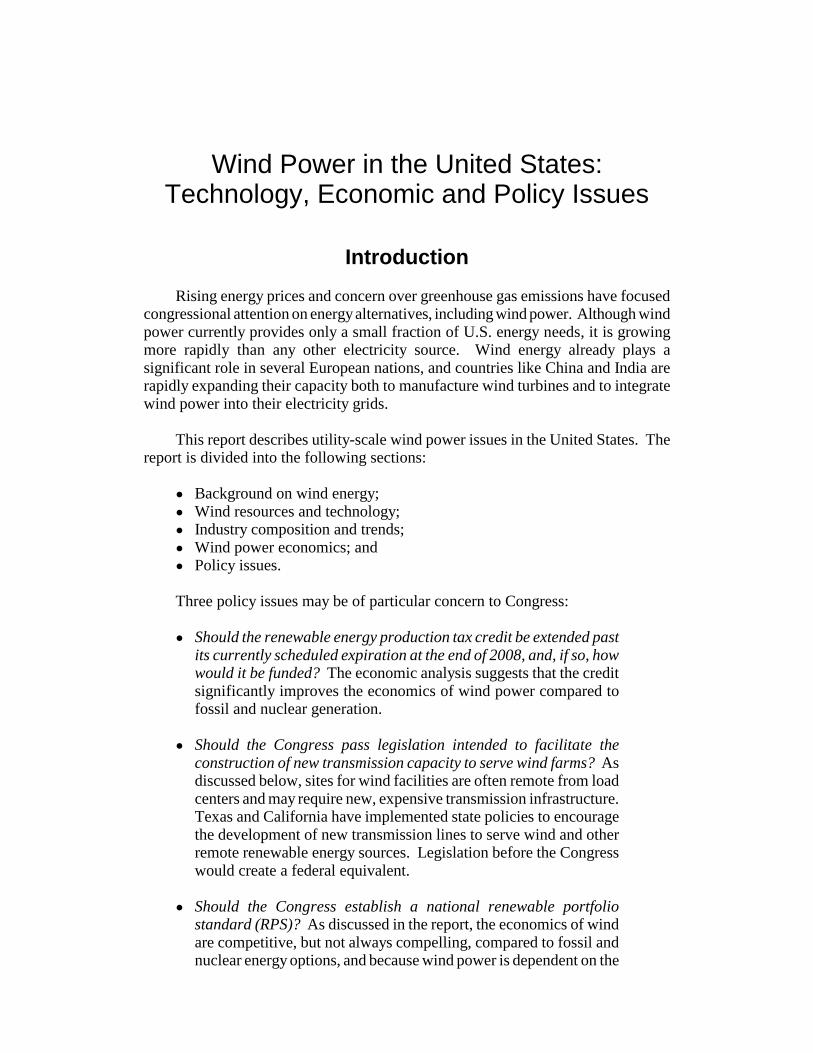
Rising energy prices and concern over greenhouse gas emissions have focusedcongressional attention on energy alternatives, including wind power. Although windpower currently provides only a small fraction of U.S. energy needs, it is growingmore rapidly than any other electricity source. Wind energy already plays asignificant role in several European nations, and countries like China and India arerapidly expanding their capacity both to manufacture wind turbines and to integratewind power into their electricity grids.
This report describes utility-scale wind power issues in the United States. Thereport is divided into the following sections:
! Background on wind energy;! Wind resources and technology;! Industry composition and trends;! Wind power economics; and! Policy issues.
Three policy issues may be of particular concern to Congress:
! Should the renewable energy production tax credit be extended pastits currently scheduled expiration at the end of 2008, and, if so, howwould it be funded? The economic analysis suggests that the creditsignificantly improves the economics of wind power compared tofossil and nuclear generation.
! Should the Congress pass legislation intended to facilitate theconstruction of new transmission capacity to serve wind farms? Asdiscussed below, sites for wind facilities are often remote from loadcenters and may require new, expensive transmission infrastructure.Texas and California have implemented state policies to encouragethe development of new transmission lines to serve wind and otherremote renewable energy sources. Legislation before the Congresswould create a federal equivalent.
! Should the Congress establish a national renewable portfoliostandard (RPS)? As discussed in the report, the economics of windare competitive, but not always compelling, compared to fossil andnuclear energy options, and because wind power is dependent on the

CRS-2
1 T. Gray, Proceedings of the Wind Energy and Birds/Bats Workshop: Understanding andResolving Bird and Bat Impacts, American Wind Energy Association and American BirdConservancy, September 2004, p. 6. 2 R. Wiser and M. Bolinger, Annual Report on U.S. Wind Power Installation, Cost andPerformance Trends: 2007, U.S. Department of Energy (DOE), May 2008, p.14.3 Investment tax credits in the 1980s offered incentives for the installation of windequipment. They did not reward wind project developers for actually generating electricity.From the 1990s through today, production tax credits have encouraged builders to maximizethe output of wind electricity since they earn credits for each kilowatt-hour generated.
vagaries of the weather it is not as reliable as conventional sources.Some benefits of wind power cited by proponents, such as a long-term reduction in demand for fossil fuels, are not easily quantified.To jump-start wind power development past these hurdles, manystates have instituted RPS programs that require power companiesto meet minimum renewable generation goals. A national RPSrequirement has been considered and, to date, rejected by Congress.
Other policy questions, such as federal funding for wind research anddevelopment, and siting and permitting requirements, are also outlined.
Background
The modern wind industry began in the early 1980s when the first utility-scaleturbines were installed in California and Denmark.1 Wind power then, as today, wasdriven by high energy prices, energy insecurity, and concern about environmentaldegradation. Early wind turbines, installed primarily at Altamont Pass outside of SanFrancisco in California, were primitive compared to today’s machines, and sufferedfrom poor reliability and high costs. Like most new technology, early wind turbineshad to go through a process of “learning by doing,” where shortcomings werediscovered, components were redesigned, and new machines were installed in acontinuing cycle.
Today’s wind industry is notably different from that in the early 1980s. Windturbines now are typically 100 times more powerful than early versions and employsophisticated materials, electronics, and aerodynamics. Costs have declined, makingwind more competitive with other power generation options. Large companies andinvestment banks now drive most wind power activity compared to the early days ofcollaborating scientists, inventors, and entrepreneurs.2
From the mid-1980s to the late 1990s the U.S. wind industry stagnated due tolow energy prices and the technology’s reputation for high cost and low reliability.But researchers continued to make improvements in the technology, driving downcosts and improving reliability. New federal and state incentives encourageddevelopers to focus on the production of electricity at wind plants (also known aswind farms) and not just installing the equipment.3 In 1999, the U.S. industry begana period of rapid expansion, slowed occasionally by expiring federal incentives.

CRS-3
4 This statement is supported by the economic analysis presented later in the report; by thefact that wind accounts for over 6% of total in-state electricity generation in Minnesota,Iowa, Colorado and South Dakota; and by the amount of proposed wind power projectsunder development (225,000 megawatts) in 2007 compared to all other power plants(212,000 megawatts) combined. See R. Wiser and M. Bolinger, Annual Report on U.S. WindPower Installation, Cost, and Performance Trends: 2007, DOE, May 2008, pp. 7-10.5 Electric generating capacity, measured in watts, is an expression of instantaneous poweroutput. Electricity generation is measured in watt-hours and is an expression of energyproduced over time. For example, a 1,000 watt generator that operates all day wouldproduce 24,000 watt-hours (24 kilowatt-hours) of energy. Prefixes kilo (thousand), mega(million), giga (billion), and tera (trillion) are often used with these units. Capacityreferences are from: Energy Efficiency and Renewable Energy, “Wind Powering AmericaProgram,” DOE, January 2008. [http://www.eere.energy.gov/windandhydro/windpoweringamerica/wind_installed_capacity.asp]. Generation references are from:Energy Information Administration (EIA), Supplement to the Electric Power Monthly March2008, Table ES.1.B, DOE, April 2008; and EIA, Electric Power Monthly March 2005, TableES.1.B., DOE, April 2005.
Strong growth continues to this day, but whether that growth will continue if federaltax incentives expire at the end of 2008, as currently scheduled, is unclear.
The Rise of Wind
Wind power is no longer an “alternative” source of energy in many regions ofthe country.4 It is the fastest growing source of new power generation in the UnitedStates. Between 2004 and 2007, installed wind turbine generating capacity increasedby 150% (see Figure 1), and power generation from wind turbines more thandoubled.5
0
2,000
4,000
6,000
8,000
10,000
12,000
14,000
16,000
18,000
1995 1996 1997 1998 1999 2000 2001 2002 2003 2004 2005 2006 2007
Source: U.S. Department of Energy, Wind Pow ering America Program, 2008.
Meg
awat
ts (
MW
)
Figure 1. Cumulative Installed U.S. Wind Capacity

CRS-4
6 New wind plants accounted for roughly 30% of total new power plant capacity installedin the United States in 2007. “Installed U.S. Wind Power Capacity Surged 45% in 2007,”American Wind Energy Association, January 17, 2008.7 Global Wind 2007 Report, Global Wind Energy Council, 2008, p.64.8 Global Wind 2007 Report, Global Wind Energy Council, 2008, p. 6.9 Global Wind 2007 Report, Global Wind Energy Council, 2008, pp.8-10.10 The PTC is an incentive for business developers of wind farms and other renewableenergy projects that produce electricity. It is discussed in the Policy Issues section later inthis report. Also see CRS Report RL34162, Renewable Energy: Background and Issues forthe 110th Congress, by Fred Sissine.11 Twenty-six states and the District of Columbia currently have mandatory RPS programs,requiring utilities to provide a minimum percentage of their electricity from approvedrenewable energy sources. Five others have non-binding goals. These numbers are reportedby the Federal Energy Regulatory Commission (FERC) and can be accessed at[http://www.ferc.gov/market-oversight/mkt-electric/overview/elec-ovr-rps.pdf].12 Wind farms in the United States generated approximately 32 billion kilowatt-hours in2007 compared to total power sector generation of 4,160 billion kilowatt-hours. EnergyInformation Administration (EIA), Electric Power Monthly, DOE, March 2008 Edition,Table ES1.B. The American Wind Energy Association forecasts that the U.S. wind industrywill generate 48 billion kilowatt-hours of electricity in 2008.
Only the amount of new natural gas-fired generating capacity installed duringthis period exceeded that of wind.6 In 2007 the U.S. wind power industry broughtover 5,000 megawatts of new generating capacity on-line, the largest annual increaseever by any country.7 The United States was not alone in strong growth for windpower in 2007: global installations rose by 27% to reach a total of 94,123megawatts.8 Only Germany, with 22,247 megawatts, has more wind power capacitythan the United States.9
Wind power’s growth is driven by a combination of the following:
! improvements in wind energy technology,! high and volatile fossil fuel prices,! the federal wind production tax credit (PTC) incentive,10
! state renewable portfolio standards (RPS),11
! difficulty siting and financing new coal-fired power plants givenexpectation of a future carbon constraint, and
! consumer preference for renewable energy.
However, wind power still accounts for only about 1% of the total electricitygenerated in the United States.12 In some regions, a lack of transmission capacity isalready beginning to constrain further growth in the wind power sector. And in stateslike Iowa, Texas, and Minnesota, where wind power has achieved a higher share oftotal electricity generation, there are concerns that additional wind power could leadto higher prices or threaten grid security. Finally, there is currently a shortage ofwind turbine components and a backlog in scheduling transmission interconnection,leading to delays and rising costs.

CRS-5
13 These issues are further discussed in the Wind Operation and Systems Integration Issuessection of this report. 14 This is about 5-10% of the price of typical wholesale electric power, according to CRScalculations. R. Wiser and M. Bolinger, Annual Report on U.S. Wind Power Installation,Cost and Performance Trends: 2006, U.S. DOE, May 2007, p. 20.15 “ERCOT Files Wind Transmission Options with Commission,” Electric ReliabilityCouncil of Texas (ERCOT) Press Release, April 2, 2008.16 Energy Efficiency and Renewable Energy, 20% Wind Energy by 2030: Increasing WindEnergy’s Contribution to U.S. Electricity Supply, U.S. DOE, May 2008, p. 95.
Benefits and Drawbacks of Wind Power
There are frequently noted benefits and drawbacks to wind energy. Text Box1 and Text Box 2 summarize selected problems and benefits, respectively, for windpower.
Drawbacks. A key challenge for windenergy is that electricity production depends onwhen and how consistently winds blow rather thanwhen consumers most need power. This variabilitycan create added expenses and complexity inbalancing supply and demand on the grid.13 Severalrecent studies note that system integration costs donot become significant ($3 to $5 per megawatt-hour) until wind turbines account for 15-30% of thecapacity in a control area.14 These apparentlymodest cost estimates have yet to be confirmedwithin the context of the U.S. electricity system.
Another concern is that new transmissioninfrastructure may be required to send the wind-generated power to where it is needed. This can bean expensive and time-consuming effort. There aredebates over how construction costs should beallocated among end users and which pricingmethodologies are most economically efficient. Although transmission constraintsface all new power generating options, wind power is especially handicapped becausewind resources are often far from demand centers and do not usually use the fullcapacity of the transmission line due to the variable output. Texas is analyzing newtransmission capacity to send wind-generator power from West Texas to the morepopulated northern and eastern sections of the state that could cost from $3 billionto over $6 billion.15 On a national scale, the U.S. Department of Energy (DOE) statesthat the most cost-effective way to meet a 20% wind energy target by 2030 would beby constructing over 12,000 miles of new transmission lines at a cost ofapproximately $20 billion.16 (See the section on Transmission Constraints for moreon this issue.)
Text Box 1. SelectedProblems Facing Wind
Power
- Power output depends onwhen the wind blows, notwhen users need electricity.- New transmissioninfrastructure is oftenrequired.- Depends on inconsistentfederal incentives.- Causes bird and batdeaths.- Considered unsightly bysome.- Can interfere with radar insome cases.

CRS-6
17 EIA, Federal Financial Interventions and Subsidies in Energy Markets 2007, U.S. DOE,April 2008, Table ES5.18 M. Barradale, “Impact of Policy Uncertainty on Renewable Energy Investment: WindPower and PTC,” U.S. Association for Energy Economics Working Paper No. 08-003,January 2008.19 Wind power does have “lifecycle emissions” associated with the materials that go intoturbine and transmission line construction, operation and maintenance activities, anddecommissioning. A study by the International Energy Agency estimated lifecycle carbondioxide emissions for wind power at 7-9 grams of CO2 per kilowatt-hour. For comparison,coal- and natural gas-fired plants released 955 and 430 grams per kilowatt-hour,respectively. International Energy Agency, Benign Energy?: The EnvironmentalImplications of Renewables, Table 3-1 and 3-2, 1998.20 CRS calculation based on EIA data for 2006 and estimates for 2007. EIA, Electric PowerMonthly, U.S. DOE, April 15, 2008, Table ES1.B. For comparison, total U.S. electric powersector emissions of carbon dioxide in 2006 were over 2,500 million tonnes. EIA, ElectricPower Annual, U.S. DOE, Table 5.1, October 2007.
Wind power is supported by federal and state incentives. In 2007, the EnergyInformation Administration (EIA) of DOE estimated that federal incentives for wind — primarily the PTC — totaled $724 million.17 In 2008, incentives could exceed$1 billion if wind generation expands from 32 billion kilowatt-hours to 48 billionkilowatt-hours as estimated by the American Wind Energy Association (AWEA), anational trade association promoting wind. Costs to states using RPS policies aredifficult to estimate because they are mandated requirements. Some believe thatthese are high costs to pay for a relatively small amount of energy. Others note thatwind energy is an evolving technology and additional breakthroughs are possible.Many in the industry believe that the on-again, off-again nature of the federal PTCincentives harm rational development of the sector.18
Among some critics, wind power also results in unacceptable bird and batdeaths. To others, it is the visual impacts that wind turbines have on the landscape,or the noise that causes objection. Finally, increasingly tall wind turbines haveinterfered with military and airport radar. These issues are discussed in a later sectionof the report.
Benefits. Wind turbines have no direct emissions of air pollutants, includingoxides of sulfur and nitrogen, mercury, particulates, and carbon dioxide.19 They alsooffset the need to mine, process, and ship coal and uranium; drill and transportnatural gas (and to a much lesser degree, oil); and construct or maintain hydroelectricdams. As noted previously, wind power contributed approximately 32 billionkilowatt-hours of electricity to the U.S. electricity grid in 2007; if that electricity hadbeen generated using the average mix of power plants in the United States, anadditional 19.5 million tons of carbon dioxide would have been released that year.20

CRS-7
21 “Wind Power’s Contribution to Electric Power Generation and Impact on Farms and RuralCommunities,” Government Accountability Office, GAO-04-756, September 2004, p. 1.22 According to the U.S. Department of Agriculture (USDA), projected revenue in 2008-09for corn grown in the United States is $846 per acre. (See World Agricultural Supply andDemand Estimates, USDA, May 9, 2008, p. 12.) Total expenses per acre to produce thiscorn in 2006 were $410 (See “Commodity Costs and Returns: U.S. and Regional Cost andReturn Data,” USDA Economic Research Service, available at [http://www.ers.usda.gov/Data/CostsAndReturns/data/current/C-Corn.xls]. Expenses for 2008-09 have increased dueto higher fuel and fertilizer costs. Assuming these expenses to be 25% higher in 2008-09leads to $513 per acre, and net income of $333 per acre. According to NREL, about 0.5acres of land is removed from production for each turbine, leading to a loss of cornproduction of about $165 dollars per turbine. (See “Power Technologies Energy Data Book:Wind Farm Area Calculator,” NREL. Available at [http://www.nrel.gov/analysis/power_databook/calc_wind.php].)23 S. Greenhouse, “Millions of Jobs of a Different Collar,” New York Times, March 26,2008.
Given rising prices for coal, natural gas, andnuclear fuel, power suppliers are drawn to thecertainty that wind — while variable — isinexhaustible and has no fuel cost. By displacingcoal-fired and gas-fired generation, wind powerwould reduce the demand for these fuels, perhapsmoderating future prices and price volatility.
Wind plants can catalyze rural developmentbecause farmers and ranchers receive royaltypayments from wind developers who lease theirland; the vast majority remains available for cropsor grazing. Farmers and ranchers typically receivefrom project developers $2,000-5,000 per year foreach turbine on their land.21 The land taken out ofproduction for wind turbine pads, access roads, andancillary equipment reduces income for cornfarmers, for example, by about $165 per turbine.22
Wind energy provides an additional source ofrevenue for local governments in the form ofproperty taxes on wind plant owners. Windturbines — unlike fossil and nuclear power plants— do not require water for cooling, a potentiallyimportant issue in areas with scarce water resources. Also, the lead time for planningand constructing wind plants is shorter than that for nuclear and coal, assumingtransmission access is not an issue.
Finally, wind power proponents argue that wind energy creates “green collar”manufacturing and field service jobs rather than traditional carbon-intensiveemployment.23 A study by Navigant Consulting in February 2008 estimated that76,000 U.S. jobs in the wind industry were at risk if the PTC is not renewed well
Text Box 2. SelectedBenefits of Wind Power
- Operations do not producecarbon dioxide or other airpollutants.- Reduces power marketexposure to volatile fuelprices.- Assists rural developmentby giving landownersincome from land leases.- May provide more “greenjobs” than other powergeneration options.- Offers shorter constructionlead time than some otheroptions.- Provides competitiveelectricity, especially atpeak times.- Does not require water foroperations.

CRS-8
24 “Economic Impacts of Tax Credit Expiration,” Navigant Consulting, prepared for theAmerican Wind Energy Association and the Solar Energy Research and EducationFoundation, February 2008, p. 21.25 Typical new U.S. wind plants ranged from 100 to 300 megawatts of installed capacity in2007. Horse Hollow (Texas) is the largest U.S. wind plant, at 736 megawatts. Althoughsome wind plants have capacity on par with traditional fossil fuel power plants, theyproduce comparatively less electricity because winds blow inconsistently. 26 See Energy Efficiency and Renewable Energy, Small Wind Electric Systems: A U.S.Consumer’s Guide, DOE, March 2005.
before its expiration in December 2008.24 It is unclear how many U.S. jobs are at riskif traditional power plants are not built.
Wind Resources and Technology
This section begins with a description of how wind turbines work. It thenprovides information on wind resources in the United States, both on and offshore.Finally, the section outlines technology trends in the wind power sector.
Wind Power Fundamentals
Unequal solar heating of the Earth’satmosphere and oceans creates wind.Wind turbine blades, like airplanewings, produce lift when air passes overone side of their shaped surface morerapidly than another (Figure 2). This liftspins the turbine blades and rotor, whichis connected to a generator through agearbox inside the housing. Thegenerator, and accompanying powerconditioning equipment, then deliverselectricity to the transmission grid at theappropriate voltage and frequency. Theprocess is roughly opposite to a commonhousehold fan, which uses electricity toturn the blades and create air motion.
Wind turbines can stand alone or beintegrated into wind farms with powergenerating capacity equaling that of atraditional power plant.25 This report focuses only on large, utility-scale windturbines. Smaller, off-grid wind power applications are also growing rapidly,although their aggregate impact is limited.26
Physical Relationships. The evolution of wind power technology andmarket development has been influenced by three physical relationships. First, a
Figure 2. Wind PowerAerodynamics

CRS-9
27 Cubing a number requires multiplying it by itself 2 additional times (i.e, 23 = 2x2x2 = 8).The mathematical formula for wind turbine power output (P), usually measured in watts, is
P = k DAV3,where k is a constant that depends on turbine design characteristics and physical limitations,D is the density of air, A is the area swept out by the turbine rotor blades (namely, Br2 , withr being the length of the rotor blade), and V is the wind velocity.28 For wind mapping resources, see NREL website [http://www.nrel.gov/wind].
wind turbine’s power output varies with the cube of wind speed.27 Thus, all else heldconstant, if wind velocity doubles, power output increases eight-fold. Wind powerdevelopers, therefore, face the challenge of finding where winds blow best. Windsat 250 feet in altitude are stronger and steadier than those closer to the ground; thisfactor explains why wind turbine towers are placed high in the air.
Second, power output varies with the area swept out by the turbine bladesduring their rotation. Doubling a turbine blade’s length will yield a quadrupling ofpower output. Today’s utility-scale wind turbine blades are commonly 130 feet longor more in an attempt to harness more energy. Turbine manufacturers have devotedattention over the past two decades to finding materials strong and durable enoughto handle the twisting forces that are transmitted from the longer blades through therotor and gearbox in fluctuating winds.
Finally, power output increases directly with air density. Density is typicallyhigher in winter months and at low altitudes, and lower in summer months and athigh altitudes. Winds near the cold Scandinavian seas, for example, contain moreexploitable energy than those of the hot, high-altitude desserts of the AmericanSouthwest.
Wind Resources
Wind resources in the United States, and elsewhere, have been studied fordecades. The National Renewable Energy Laboratory (NREL) has produced nationaland state wind resource maps that indicate areas with promising winds (Figure 3).28
“Excellent” winds mean those that average about 17 miles per hour or above at 150feet in altitude. Additional mapping efforts characterize seasonal and even dailyvariations in average wind speed. After using these maps to identify promisingregions, wind plant developers must still study and document local conditionscarefully — often for 12 months or longer — to ensure potential financiers thatrevenue streams will be sufficient and stable.

CRS-10
29 This is the theoretical potential. Energy Efficiency and Renewable Energy, WindPowering America: Clean Energy for the 21st Century, DOE, September 2004.30 Office of Energy Efficiency and Renewable Energy, 20% Wind Energy by 2030:Increasing Wind Energy’s Contribution to U.S. Electricity Supply, DOE, May 2008.31 The U.S. Great Plains states include parts of Colorado, Kansas, Montana, Wyoming,North Dakota, South Dakota, Nebraska, Oklahoma, New Mexico, and Texas. From ageographical standpoint the region extends into the Canadian provinces of Alberta,Manitoba, and Saskatchewan.32 See CRS Report RL33875, Electric Transmission: Approaches for Energizing a SaggingIndustry, by Amy Abel.
DOE estimates that total U.S. wind energy potential is over 10,000 billionkilowatt-hours annually — more than twice the total electricity generated from allsources in America today.29 While this potential is not realistically achievable, windpower advocates, supported by a recent DOE study, believe that wind power couldrealistically contribute 20% of the nation’s total electricity generation by the year2030.30 The U.S. Great Plains states contain most of the best onshore windresources.31 The main drawback to these rich wind resources is that they are locatedfar from densely populated areas and thus require the construction of transmissionlines to send the electricity to the load. Building these lines is often expensive, timeconsuming, and controversial.32
Figure 3. U.S. Wind Resources Potential

CRS-11
33 This estimate excludes two-thirds of the offshore areas ranging from 5 to 20 nautical milesfrom the shoreline to account for shipping lanes and wildlife, and view shed concerns; andone-third of the areas from 20 to nautical 50 miles out. See Technology White Paper: WindEnergy Potential on the U.S. Outer Continental Shelf, DOI, May 2006, pp. 1-2.34 R. Wiser and M. Bolinger, Annual Report on U.S. Wind Power Installation, Cost andPerformance Trends: 2007, U.S. Department of Energy, May 2008, p. 9.35 MMS manages the nation’s Outer Continental Shelf oil, natural gas, and other mineralresources. The Energy Policy Act of 2005 (EPACT05) granted MMS additional authorityto act as the lead federal agency for offshore renewable energy projects. EPACT05 §388stipulates that MMS authority does not supercede the existing authority of any other agencyfor project permitting, so a wind project on the OCS may also require other permits tooperate, although leasing and environmental review would be conducted by MMS.36 In 2006, the Senate considered a provision to the Coast Guard appropriations bill givingthe governor of Massachusetts authority to veto the Cape Wind project. A compromise wasreached that gave the Coast Guard greater authority over navigational safety related to theproject, but denied gubernatorial veto power. See §414 of P.L. 209-241.37 See [http://www.mms.gov/offshore/RenewableEnergy/RenewableEnergyMain.htm].38 See Offshore Wind Energy website [http://www.offshorewindenergy.org].
Offshore Wind. The U.S. Department of the Interior (DOI) estimates thatover 90,000 megawatts of wind resource potential lies off the coasts of New Englandand the Mid-Atlantic states in waters less than 100 feet deep.33 Offshore sitesgenerally have higher quality winds and are located closer to population centers, buttheir development costs are significantly higher. Offshore wind projects have beenslow to develop in the United States due to these high costs and public opposition.In Europe, a total of 1,099 megawatts of offshore wind had been installed by the endof 2007.34
The 420 megawatt Cape Wind project near Cape Cod, Massachusetts, is thelargest proposed U.S. offshore wind project to date and is currently awaiting a permitfrom the DOI’s Minerals Management Service (MMS).35 During the 109th Congress,a debate erupted over the project’s safety, cost, and environmental impact.36 CapeWind and other proponents say the project is a safe, clean way to develop renewableenergy and create jobs. Opponents of the project have collaborated to create theAlliance to Protect Nantucket Sound. According to the Alliance, the project posesthreats to the area’s ecosystem, maritime navigation, and the Cape Cod tourismindustry.
MMS released a Draft Environmental Impact Statement (EIS) for the CapeWind project in March 2008.37 The draft EIS did not indicate any critical factors thatcould derail the project. A final EIS is expected later in 2008. Other offshore U.S.wind projects have been proposed in Delaware (Bluewater) and Texas (Galveston).38
Wind Power Technology
Commercial, utility-scale wind turbines have evolved significantly from theirearly days in the 1980s and 1990s (Figure 4). They are larger, more efficient, andmore durable. How wind technology evolves in the future could be influenced by

CRS-12
39 The German company Enercon is testing two different 6 megawatt turbines, although theyare not yet available on commercial markets. The largest commonly used commercial windturbines are the 3.6 megawatt offshore units produced by Siemens and General Electric. 40 This assumes a capacity factor (see following subsection) of 34% and an EIA estimate ofthe average U.S. household consumption of 11,000 kilowatt-hours per year. 41 Horizontal turbines are further divided into classes depending on generator placement,type of generator, and blade control. For example, downwind turbines have their blades
(continued...)
congressional policy, both in research and development funding, and throughregulatory frameworks that influence market behavior.
Utility-scale wind turbines have grown in size from dozens of kilowatts in thelate 1970s and early 1980s to a maximum of 6 megawatts in 2008.39 The averagesize of a turbine deployed in the United States in 2007 was 1.6 megawatts, enoughto power approximately 430 U.S. homes.40 The average size of turbines continuesto expand as units rated between 2 and 3 megawatts become more common. Largerturbines provide greater efficiency and economy of scale, but they are also morecomplex to build, transport, and deploy.
Types of Wind Turbines. Industrial wind turbines fall into two generalclasses depending on how they spin: horizontal axis and vertical axis, also known as“eggbeater” turbines. Vertical axis machines, which spin about an axis perpendicularto the ground, have advantages in efficiency and serviceability since all of the controlequipment is at ground level. The main drawback to this configuration, however, isthat the blades cannot be easily elevated high into the air where the best winds blow.As a result, horizontal axis machines — which spin about an axis parallel to theground rather than perpendicular to it — have come to dominate today’s markets.41
Figure 4. Evolution of U.S. Commercial Wind Technology

CRS-13
41 (...continued)behind the generator and upwind turbines, in front. Generators can be asynchronous withthe grid, or operate at the same frequency. Blade speed can be fixed or variable, andcontrolled through pitch or stall aerodynamics. For a more complete discussion of windturbine technical issues, see P. Carlin, A. Laxson, and E. Muljadi, The History and State ofthe Art of Variable-Speed Wind Turbines, NREL, February 2001. 42 Generally, the yaw control will position the turbine to face the wind at a perpendicularangle. The turbine can avoid damage from excessive wind speeds by yawing away from thewind or applying the brake.43 The standard trailer for an 18-wheel tractor trailer is approximately 12.5 feet high and 8feet wide. Gross vehicle weight limitations are 80,000 pounds, corresponding to a cargo
(continued...)
A simplified diagram of a typical horizontal axis wind turbine is shown inFigure 5. The blades connect to the rotor and turn a low-speed shaft that is gearedto spin a higher-speed shaft in the generator. An automated yaw motor system turnsthe turbine to face the wind at an appropriate angle.42
There are barriers to the size of wind turbines that can be efficiently deployed,especially at onshore locations. Wind turbine components larger than standard over-the-road trailer dimensions and weight limits face expensive transport penalties.43
Figure 5. Components in a Simplified Wind Turbine

CRS-14
43 (...continued)weight of 42,000 pounds. According to NREL, the trailer limitations have the greatestimpact on the base diameter of wind turbine towers. R. Thresher and A. Laxson, “AdvancedWind Technology: New Challenges for a New Century,” NREL, June 2006.44 Renewable Energy Research Laboratory, “Wind Power: Capacity Factor, Intermittency,and What Happens When the Wind Doesn’t Blow?,” University of Massachusetts atAmherst, p. 1, November 2004. 45 Comparative Costs of California Central Station Electricity Generation Technologies,California Energy Commission, Appendix B, December 2007, p. 67.46 B. Parsons, “Grid-Connected Wind Energy Technology: Progress and Prospects,” NREL,1998, p. 5.
Other barriers to increasingly large turbines include (1) potential for aviation andradar interference, (2) local opposition to siting, (3) erection challenges (i.e,expensive cranes are needed to lift the turbine hubs to a height of 300 feet or more),and (4) material fatigue issues. Some of these issues are discussed in more detaillater.
Capacity Factor. As noted above, a wind turbine’s power output depends onwind speed. Capacity factor — a measure of how much electricity a power plantactually produces compared to its potential running at full load over a given periodof time — is a useful tool to summarize average annual wind availability and speedfor wind projects. The capacity factor a wind plant achieves strongly influences thecost of electricity produced and the profitability of the project. (See Wind PowerEconomics section later in this report.)
Capacity factors for power generation technologies vary considerably. Nuclearplants run nearly continuously at full load and only shut down under normalconditions to be refueled. The industry-wide average capacity factor for U.S. nuclearpower plants has been about 90% in recent years. Coal plants average a capacityfactor of 70%, but individual plants can have a much higher or lower utilization rate.Wind plants, on the other hand, have capacity factors typically ranging from 20% to40%.44 Wind turbines usually spin 65% to 90% of the time, but only at their fullrated capacity about 10% of the time. A recent study pegs the typical capacity factorfor wind turbines at 34%.45 Offshore wind turbines generally have higher capacityfactors than onshore units because ocean winds are steadier than those over land.
A high capacity factor helps lower a plant’s levelized, or annualized, cost ofelectricity (see section on Wind Power Economics). While a low capacity factor mayresult in relatively high costs per kilowatt-hour, a complete economic analysis woulddepend on when the electricity was produced. Since electricity is valued at differentprices according to daily and seasonal demand profiles, when a wind turbine actuallyproduces electricity can be as important as its overall capacity factor.
Wind Research and Development Emphasis. Future advances in windturbine technology are likely to be evolutionary rather than revolutionary.46
According to the NREL, which carries out much of DOE’s wind research and

CRS-15
47 S. Butterfield, “Technology Overview: Fundamentals of Wind Energy,” NREL, 2005.48 EIA, Annual Energy Review 2006, U.S. DOE, 2007, Table 8.2a.49 For more information, see U.S. Climate Change Technology Program: Technical Optionsfor the Near and Long Term, August 2005. [http://www.climatetechnology.gov]50 For more information on U.S. R&D on wind power, see 20% Wind Energy by 2030:Increasing Wind Energy’s Contribution to U.S. Electricity Supply, DOE, May 2008.
development (R&D) program, current efforts to improve wind power technology andreduce costs includes:
! offshore turbine deployment,! drivetrain (gearbox) innovation,! blade design innovation,! mechanical and power controls,! low wind speed turbine development,! manufacturing economies of scale, and! system integration improvement.47
Another general area of R&D activity is in energy storage. Energy storage doesnot increase power output — in fact, energy conversion always results in lost power — but storage can make wind power available when it is most needed. Currently,most energy storage options are expensive and still under development.
The most common energy storage method is hydroelectric pumped storage.During periods of strong winds and low power demand, wind turbine output can beused to pump water into a reservoir at a higher elevation. The water can be releasedthrough a hydroelectric generator later when the power is most needed. Manycountries have only limited pumped storage capacity and may have already exploitedwhat exists. In the United States, pumped storage accounts for several percent ofconventional hydroelectric power generation,48 but probably does not have potentialto grow significantly since many of the most economic sites have already beendeveloped and the public opposes new large-scale hydroelectric projects.
Other energy storage options such as compressed air energy storage andadvanced batteries face technical hurdles and high costs. Public and private sectorR&D is underway to bring down costs for these options, not just for the benefit ofwind power, but other variable energy sources as well.49 A technologicalbreakthrough in one of these storage options could enhance the ability of wind energyto supply large quantities of electricity on demand, but whether such breakthroughsare forthcoming is unpredictable.50
Wind Industry Composition and Trends
Within the United States, Texas is now the dominant state for wind power,followed by California, Minnesota, Iowa, Washington, and Colorado. Total installedwind capacity for each state at the end of 2007 is shown in Figure 6. California’searly lead in wind power has been eclipsed by rapid growth in Texas. Wind power

CRS-16
Figure 6. Installed Wind Capacity By State in 2007
installations are also growing rapidly in the Pacific Northwest states of Washingtonand Oregon, as well as in Colorado, Minnesota, Iowa, Illinois, and the Dakotas.Most of these states have good wind resources, renewable portfolio standards, andlocal government proponents to help overcome construction barriers. These state andlocal incentives supplement the federal production tax credit incentive. TheSoutheastern region of the United States is noticeably empty of wind power projectsdue primarily to poor wind resources. This issue may also influence the region’sgeneral opposition to a national RPS.
A more detailed map showing the location of each existing and planned windplant in North America by size is presented in Figure 7. Although planned windprojects far surpass the number of existing ones, there is no guarantee that they willall be constructed. Comparing wind resources from Figure 3 with existing andplanned wind plants in Figure 7 shows significant potential to continue tapping someof the best wind sites in the upper Great Plains region. Limited transmission capacityis one of the reasons high-quality wind regions like this are not seeing greater windplant development.

CRS-17
Source: Ventyx Energy, the Velocity Suite. Data reportedly updated through June 5, 2008. Note: Data for wind plants in Hawaii and Alaska are not available for this map.
Figure 7. Existing and Planned North American Wind Plants by Size

CRS-18
51 T. Wright, “India Windmill Empire Begins to Show Cracks,” Wall Street Journal, April18, 2008, P. A1.52 Wind Power Outlook 2008, AWEA, 2008, p. 4.
Wind Turbine Manufacturers and Wind Plant Developers
The major wind turbine suppliers to wind plants in the United States includeGeneral Electric (GE) Wind, Siemens, Vestas, Mitsubishi, Suzlon, and Gamesa.
The 2007 U.S. market share for each of these suppliers is shown in Figure 8.The GE 1.5 megawatt turbine was the most commonly installed unit in 2007. Vestas,Siemens, and Gamesa — European manufacturers with an increasing number ofproduction facilities in the United States — account for a combined market shareroughly equivalent to that of GE. Suzlon, an Indian manufacturer and the world’sfifth largest turbine producer, may face new challenges after having to recall manyof the turbine blades it sold into the U.S. market due to premature cracking.51 Othernew manufacturers are also entering the field. Clipper Windpower is gaining marketshare as manufacturing capacity grows for its new 2.5 megawatt turbines. Accordingto the Global Wind Energy Council, two Chinese firms, Gold Wind and Sinovel, arealso likely to enter international markets in 2009 with low-cost turbines.
Because shipping large wind turbine parts is expensive, suppliers buildmanufacturing facilities close to where wind plants will be installed. According toAWEA, wind industry manufacturing facilities in the United States grew from asmall base in 2005 to over 100 in 2007. New wind turbine component manufacturingfacilities opened in Illinois, Iowa, South Dakota, Texas, and Wisconsin in 2007,while seven other facilities were announced in Arkansas, Colorado, Iowa, NorthCarolina, New York, and Oklahoma.52 Expanding production and operations in theUnited States is especially attractive to European companies given the current value
Siemens16%
Vestas18%
Gamesa11%
Clipper1%
GE Wind44%
Suzlon4%
Mitsubishi7%
Source: R. Wiser and M. Bolinger, Annual Report on U.S. Wind Power Installation, Cost, and Performance Trends , U.S. DOE, p.10.
Figure 8. U.S. Wind Turbine Market Share byManufacturer in 2007

CRS-19
53 According to one report, in early 2008 General Electric had a backlog of wind turbineson order equal to $12 billion, more than twice the backlog in early 2007. M. Kanellos, “GEConfirms That Wind Turbine Supply Is Getting Worse,” CNet News.com, April 13, 2008.54 R. Wiser and M. Bolinger, Annual Report on U.S. Wind Power Installation, Cost, andPerformance Trends: 2007, DOE, May 2008, p. 15.55 AWEA 2007 Market Report, AWEA, January 2008, pp. 9-11.56 R. Wiser and M. Bolinger, Annual Report on U.S. Wind Power Installation, Cost andPerformance Trends: 2007, DOE, May 2008, p. 13.57 Global Wind 2007 Report, Global Wind Energy Council, 2008, p. 6.
of the euro to the dollar. Despite the expansion in turbine manufacturing facilitiesin the United States, Europe, and Asia, demand continues to exceed supply.53
Most wind plants in the United States are built and operated by independentpower producers (IPPs), also known as merchant providers, that are not regulatedutilities. IPPs have the most flexibility in taking advantage of the renewable taxincentives since regulated utilities cannot claim the renewable PTC. Still, investor-owned utilities do build and operate some wind plants; one estimate states thatutilities built just over 10% of the total new capacity in wind electricity in 2007.54
Dozens of companies from around the world develop and operate wind plantsin the United States. Selected examples of active developers and operators in early2008 include Acciona, AES, Babcock & Brown, Edison Mission, FPL Energy,Gamesa Energy, Horizon, Invenergy, John Deere, Noble Environmental, PPMEnergy, and RES Americas.55 According to DOE, consolidation among companiesremains strong, including the purchase of Horizon Wind by Energias de Portugal(from Portugal) and the acquisition of Airtricity North America by E.ON AG (fromGermany).56
International Comparisons
The United States led the world in wind power deployment until 1996 when itwas surpassed by Germany (Figure 9). Strong U.S. growth in new wind capacitypushed the United States into the number two spot ahead of Spain in 2007, and theGlobal Wind Energy Council (GWEC) expects the United States to become theworld leader in installed capacity again by the end of 2009.57

CRS-20
As countries deploy increasing quantities of wind capacity, new operationalissues need to be addressed. Grid operators must become accustomed to dealing withthe variability of wind in order to operate the system efficiently and reliably. Despitethe near parity in total wind generating capacity among the top three countries, theUnited States has a much lower percentage penetration rate of actual wind powergeneration than Denmark, Spain, Portugal, Ireland, and Germany (Table 1). TheseEuropean countries have gained experience operating their electricity grids at higherwind integration rates.
Table 1. Wind Energy Penetration Rates by Country
Country Wind Energy Penetration Rate (%)
Denmark 20
Spain 12
Portugal 9
Ireland 8
Germany 7
United States 1Source: R. Wiser and M. Bolinger, Annual Report on U.S. Wind Power Installation, Cost, andPerformance Trends: 2007, U.S. DOE, May 2008, p. 6.
Note: Wind energy penetration is defined here as the ratio of wind-generated electricity to the totalelectricity generated by all sources.
0
20,000
40,000
60,000
80,000
100,000
1995
1996
1997
1998
1999
2000
2001
2002
2003
2004
2005
2006
2007
Source: Adapted from J. Dorn, "Global Wind Power Capacity Reaches 100,000 M egawatts," Earth Policy Institute, M arch 2004.
Meg
awat
ts (
MW
)
Germany
U.S.
Spain
India
All Others
China
Figure 9. Global Installed Wind Capacity By Country

CRS-21
58 According to GWEC, installed wind power capacity in China grew by an average annualrate of 56% between 2001 and 2007. Approximately 3,500 megawatts of new wind wereinstalled in 2007. (Global Wind 2007 Report, GWEC, April 2008, p. 28.) According to astatement by Zhang Guobao, Vice Premier of the National Development and ReformCommission, China installed approximately 70,000 megawatts of new coal-fired generatingcapacity in 2007 as reported in Y. Wang, “China May Boost Power Capacity 40% in 3 Yearsas Demand Rises,” Bloomberg, May 12, 2008.59 C. Fu, “Fanning Wind Power Capacity,” Shanghai Daily, April 28, 2008.
China has the most rapidly growing wind sector in the world, but started froma very low base. New wind power additions in China are dwarfed by the amount ofnew coal-fired power plant construction.58 Chinese leaders are reportedly consideringa new wind power target of 100,000 megawatts by 2020, five-fold the previoustarget.59 The German experience with wind power is highlighted in Text Box 3.
In summary, wind technology has evolved over the past two decades, resultingin larger, more reliable machines. Manufacturing capacity in the United States hasexpanded significantly. These advances have led to increasingly competitive windelectricity costs, the topic of the next section.

CRS-22
Text Box 3. Focus on Wind Power in Germany
Germany is the world leader in installed wind power capacity. Given the country’srelatively modest wind and solar resources, it has ambitious plans for renewable energy,including a goal that renewable energy meet 20% of total energy needs by 2020.
The primary driver of wind power growth in Germany is the country’s “feed-intariff” policy that gives producers of wind power a guaranteed constant minimum priceover a maximum term of 20 years. The amount of the tariff depends on the location of thewind turbine and the specific year. The average 2007 payment was about 12.9 U.S.cents/kWh and is scheduled to slowly decline to about 10.9 cents/kWh by 2015.a
Electricity in Germany is relatively expensive; the wind industry’s impact on overallelectricity price is not clearly known.b
Wind accounts for about 18% of installed capacity and generates 7% of the
country’s electricity. Most of Germany’s wind farms lie in the northern Baltic coastregion where wind resources are superior. Wind plants are widely deployed in Germanyand few onshore areas with good wind resources remain to be developed. The shortageof onshore sites is leading Germany to replace older, less efficient wind turbines withlarger, more powerful models.
The shortage of high-quality onshore sites is also leading to an expansion ofoffshore wind plants. In 2006, the federal government passed a law stating that gridoperators must bear the costs for connecting to offshore wind plants as soon as they areready to begin producing power. At the end of 2007, Germany had installed only sevenmegawatts of offshore wind generating capacity, although it had hundreds of megawattsmore under development.
The German wind industry is not without critics. As elsewhere, critics state thatwind energy depends on expensive subsidies, especially the feed-in tariff and gridconnection requirements. As Germany is a relatively mature wind user, much of thecountryside is dotted with wind plants. Some Germans oppose the visual impact thesewind plants create and are concerned that they may impact the tourism industry. Finally,a recent study by the German Energy Agency claimed that wind power is an expensiveway to lower carbon dioxide emissions compared with other options.c
a. German Energy Agency, Planning of the Grid Integration of Wind Energy in Germany Onshore
and Offshore up to the Year 2020, February, 2005. The exchange rate used in thisconversion was 1.55 U.S. dollars per euro.
b. The impact of growing wind use on Germany’s electricity prices is obscured by largerrestructuring and liberalization within the sector. B. Odent, “Les factures d’électricitégermaniques se shootent à la libéralisation,” l’Humanité, June 29, 2007.
c. Project Steering Group, “Planning of the Grid Integration of Wind Energy in Germany Onshoreand Offshore Up to the Year 2020,” German Energy Agency, March 2005.
Wind Power Economics
Numerous complex variables affect the economics of wind power. This sectionincludes a financial analysis that compares the cost of building and operating windplants with competing technologies (coal, natural gas, and nuclear power). Thefinancial analysis provides an indicative picture of how the economics of wind

CRS-23
60 Variable O&M costs vary with the output of a generating station, such as the cost of theconsumables used by pollution control equipment. Fixed O&M, which is insensitive to thelevel of plant output, includes such costs as the salaries of plant staff and scheduledmaintenance. 61 S. Butterfield, “Fundamentals of Wind Technology,” NREL, presentation at AmericanWind Energy Association conference, May 15, 2005.
compare with other bulk power sources. A comprehensive analysis for a specificproject would take many other factors into consideration, including the cost of anynecessary transmission upgrades and other options (e.g., purchased power or demandreduction).
Cost and Operating Characteristics of Wind Power
Wind power is characterized by low variable costs and relatively high fixedcosts. Wind turbines have, of course, no fuel costs, and minimal variable operationsand maintenance (O&M) expense.60 In addition to having no direct expense for fuel,wind also does not incur the ancillary expenses associated with fossil fuelcombustion, such as air pollution control equipment and allowances needed tocomply with current law and, possibly, future carbon controls. Wind also does notincur the waste disposal costs associated with conventional generation, such asscrubber sludge disposal for coal plants and radioactive waste storage for nuclearplants.
As reported in 2005, the initial cost of wind turbines is about half of total windplant development costs (Figure 10).61
Construction22% Towers
10%
Turbines49%
Interest4%
Transport2%
Land Development
4%
Design2%
Connection4%
Fees3%
Source: National Renew able Energy Laboratory, 2005.
Figure 10. Component Costs for Typical Wind Plants

CRS-24
62 Capital intensive means that compared to some other generating sources, such as gas-firedplants, wind plants require a relatively large initial outlay to build the plant. This largeoutlay also translates into higher fixed costs, in the form of repayment of the debt portionof construction financing.63 These data were gathered by analysts at Lawrence Berkeley National Lab from 227completed wind projects totaling 12,998 megawatts of capacity. Reported in R. Wiser andM. Bolinger, Annual Report on U.S. Wind Power Installation, Cost, and PerformanceTrends: 2007, U.S. DOE, May 2008, pp. 21.64 L. Flowers, “Wind Energy Update,” NREL, February 2008.65 According to Cambridge Energy Research Associates, coal, gas, wind, and nuclear powerplants were, on average, 131% more expensive to build in late 2007 compared to 2000.Sector-specific cost increases include wind 108%, nuclear 173%, coal 78% and gas 92%.See “Costs to Build Power Plants Pressure Rates,” Wall Street Journal, May 27, 2008.66 R. Wiser, M. Bolinger, and G. Barbose, “Using the Production Tax Credit to Build aDurable Market for Wind Power in the United States,” Lawrence Berkeley NationalLaboratory, 2007.
Although wind plants have low variable costs, the fixed O&M costs arerelatively high, and wind power plants are capital intensive.62 As with othergeneration technologies, the cost of building a wind plant has increased in recentyears. The reported unit cost of wind projects constructed in the United Statesdeclined steadily through the 1990s and, according to one study, bottomed out atabout $1,400 per kilowatt of capacity in the 2000-2002 time period.63
Subsequently, project costs have risen steadily and averaged over $1,700 perkilowatt in 2007. Higher input prices (steel, cooper, concrete), a shortage of skilledworkers, unfavorable currency exchange, and shortages in key wind turbinecomponents and manufacturing capacity explain much of the overall cost increase.64
Rapidly rising costs have also been experienced by all other utility-scale generationtechnologies.65 In the case of wind, some analysts believe that the lapses in theproduction tax credit contributed to boom-and-bust cycles in the sector anddiscouraged steadier investment in new production capacity.66
Wind Operation and System Integration Issues. Operators try tomaximize the power output from units with high fixed costs so that those costs canbe spread over as many kilowatt-hours of electric generation as possible. Thisreduces the average cost of power from the unit and makes the unit’s power moreeconomical for consumers (and more marketable if the unit is operating in acompetitive market).
Wind plants, however, cannot run as baseload units (i.e., continuouslyoperating) because generation is subject to wind variability. Like solar power, windis a source of variable renewable power that is dependent on daily, seasonal, andlocational variations in the weather. Geographic diversity — that is, installing windturbines over a large area — may compensate to some degree for local variations inwind conditions, but ultimately wind power cannot achieve the same degree ofreliability or continuous operation as fossil or nuclear technology. The combination

CRS-25
67 Mike Mercer, “Power for a Calm Day,” Diesel & Gas Turbine Worldwide, October 2007.The station is Northwestern Energy’s Basin Creek plant, a 51.8 MW plant consisting of 9gas-fired diesel generators.68 B. Parsons, M. Milligan, et al. “Grid Impacts of Wind Power Variability: RecentAssessments from a Variety of Utilities in the United States,” conference paper presentedat the European Wind Energy Conference. Athens, Greece, 2006 [http://www.nrel.gov/docs/fy06osti/39955.pdf], p. 9.69 This is equivalent to 0.282 cents per kilowatt-hour. Gail Kinsey Hill, “BPA CalculatesAdministrative Costs of Wind Power,” The Oregonian, March 29, 2008.
of the relatively low capacity factor of wind plants and high fixed costs drives up thecost of wind-generated electricity.
The variable nature of wind power has an additional cost implication. Electricpower systems must be able to reliably meet all firm customer loads at all times. Forthis reason power systems are built around generating technologies that aredispatchable and predictable — that is, units that can be reliably turned on or off, orhave their output ramped up or down, as needed to meet changes in load. However,because a wind turbine is weather dependent it is not dispatchable or as predicableas a fossil or nuclear unit. As noted previously, energy storage can help address thisshortcoming in wind energy, although it also results in higher costs.
When a power system is dependent on only small amounts of wind generationto meet load, the variations in wind output can be absorbed by the system’s existingbuffer capacity. This capacity is either fossil fuel, nuclear, or dispatchable renewableenergy (e.g., hydroelectric, geothermal, and biomass). However, when windconstitutes a large part of the system’s total generating capacity, perhaps 10% to 15%or greater, the system must incur additional costs to provide reliable backup for thewind turbines. For example, in 2007 a utility in Montana built a gas-fired plant forthe primary purpose of compensating for wind power variability.67 Various estimateshave been made of the cost of integrating large blocks of wind capacity into a powersystem. Estimates for integration costs range from $1.85 to $4.97 per megawatt-hour.68 In 2008, the Bonneville Power Administration established a wind integrationcharge of $2.82 per megawatt-hour.69 (See Text Box 4 below for a description of arecent system integration issue in Texas.)
In summary, wind power has the economic advantage of zero fuel costs and nocosts for the pollution controls associated with the consumption of fossil and nuclearfuel. However, wind plants have relatively high fixed costs, and the plants cannot beoperated as intensively as fossil or nuclear plants due to the variability of the wind.Wind variability also creates system integration costs at high levels of windpenetration. These cost disadvantages are partly offset by the federal renewableproduction tax credit (discussed below) and also, in effect, by state renewableportfolio standards that mandate the use of renewable power.

CRS-26
70 Assuming the natural gas combined cycle was built by a utility reduces the estimated costin the Base Case by about $4 per megawatt-hour. This is due to the lower financing costsavailable to regulated utilities compared to IPPs. If the wind plant is built by a utility the
(continued...)
Text Box 4. Electricity Curtailment Event in Texas
A recent event in Texas serves to illustrate the challenge of integrating wind powerinto existing electricity grids. At 6:41 p.m. on February 26, 2008, the Electric ReliabilityCouncil of Texas (ERCOT, the manager of most of the electric power grid in Texas)activated its emergency electric curtailment plan due to low frequency on the electricitygrid. The emergency measure cut power to customers who had agreed in advance to suchaction in order to prevent more serious grid problems from occurring. The frequencydrop was caused by an unplanned shortfall in available generation sources (primarilywind) at the same time demand was increasing. According to ERCOT’s summary report,wind generator availability dropped from 1,700 megawatts three hours before the eventto about 300 megawatts at the point the emergency procedures were activated.
An action item ERCOT took from the event is to accelerate plans to implement animproved wind forecasting system. The summary report is available at[http://interchange.puc.state.tx.us/WebApp/Interchange/Documents/27706_114_577769.PDF].
Levelized Cost Comparison
Although wind power is not dispatchable, it is often seen as a replacement orsupplement for conventional baseload power plants. This is because when windconditions are favorable a wind turbine is used like a baseload plant: the wind turbineis run at full load as continuously as possible. The following economic analysistherefore compares wind power to the primary baseload alternative technologiesusing coal, nuclear power, or natural gas. Each technology is described briefly inText Box 5.
The generation costs of these technologies and wind power are compared usingthe financial analysis technique of levelized costs, which summarizes the estimatedlifetime costs of each system as a levelized (“annualized”) cost per megawatt-hourof generation. This analysis is for plants entering commercial service in 2015, andcosts are measured in constant 2008 dollars. The financial methodology and the keyassumptions concerning plant costs and operations are described in Appendix A. Thecurrent estimate of “overnight” construction costs for each technology — that is, thecost that would be incurred if a plant could be built instantly — are summarizedbelow in Table 2, along with the assumed capacity factor. Table 2 also indicates thetype of entity assumed to build each kind of plant. Coal and nuclear plants areassumed to be constructed by regulated utilities that have the financial resources andregulatory support to undertake these very large and expensive projects. The naturalgas combined-cycle plant is assumed to be built by an independent power producer(IPP). IPPs generally prefer gas-fired projects because of their relatively low capitalcosts and risk profiles. The wind plant is also assumed to be an IPP project becauseregulated utilities normally cannot make use of the production tax credit.70

CRS-27
70 (...continued)estimated cost increases by about $1 per megawatt-hour. This is the net effect of the lowerfinancing costs and the loss of the production tax credits. The renewable production taxcredit applies to sales of electricity by the wind plant owner to another entity. A utilitywhich operates a wind plant to serve its own load cannot take the credit. See 10 C.F.R. §451.4
Text Box 5. Description of Primary Power Generation Technologies
! Conventional (pulverized) coal. This is the conventional technologyused in most existing coal-fired power plants. Coal is ground to a finepowder, and then burned in a boiler to create steam which drives agenerator. Modern coal plants are equipped with environmental controlequipment that can greatly reduce air emissions, with the exception ofcarbon dioxide. No pulverized coal plants — or, for that matter, anyother kind of fossil-fueled power plant — have been built with carboncontrol technology.
! Natural Gas Combined Cycle. This is a standard technology widelyused to generate electricity. Natural gas is burned in a combustionturbine (the same type of technology used in a jet engine) to rotate agenerator and produce electricity. The waste heat, in the form ofexhaust gases, from the combustion turbine is then captured and usedto produce steam, which drives a second generator to produce moreelectricity. Combined cycle plants are relatively inexpensive to buildand very efficient, but use expensive natural gas as the fuel.
! Nuclear Power. These plants use heat from nuclear fission to producesteam for power generation. This report uses projected costs andperformance for next generation nuclear plants characterized, forexample, by simplified designs and modularized constructiontechniques.
Table 2. Assumptions for Generating Technologies
Technology Overnight Cost in 2008 (2008$ per Kilowatt of Capacity)
AssumedCapacityFactor
Type ofProject
Developer
Wind $1,900 34% IPP
Coal $2,600 85% Utility
Nuclear $3,700 90% Utility
Natural Gas $1,200 70% IPP
Sources: Overnight capital costs estimated by CRS based on a review of published information onrecent power projects. Capacity factor for coal plants is from Massachusetts Institute of Technology,The Future of Coal, 2007, p. 128. Natural gas plants are assumed to operate as baseload units witha capacity factor of 70%. Capacity factor for wind from California Energy Commission, “ComparativeCosts of California Central Station Electricity Generation Technologies,” December 2007, AppendixB, p. 67. Nuclear plant capacity factor reflects the recent industry average performance as reportedin EIA, Monthly Energy Review, Table 8.1. Also see Appendix A to this report.

CRS-28
71 Other factors, combinations of factors, and alternative cost forecasts could be evaluated.The economic analyses presented here consider just one subset of many potential alternativeassumptions. The subset was chosen to highlight some of the important determinants of thecompetitiveness of wind power.72 The nominal value of the nuclear production tax credit of $18 per megawatt-hour will bereduced if more than 6,000 megawatts of new nuclear capacity qualify for the credit. TheBase Case follows EIA’s long-term forecast assumption that the effective rate will bereduced to $12 per megawatt-hour because 9,000 megawatts of new nuclear capacity willqualify. See EIA, Annual Energy Outlook 2007, pp. 20-21.73 The status of the renewable PTC is discussed elsewhere in this report. 74 In 2008, the Congressional Budget Office (CBO) estimated the price of carbon dioxideallowances in 2013 at $30 per metric ton in nominal dollars. Given an estimated change inthe implicit price deflator of 17.2% between 2005 and 2013, this converts to $25.60 permetric ton in constant 2005 dollars. This value was rounded to $26 per metric ton tosimplify the presentation. See CBO, “Cost Estimate for S. 2191, America’s ClimateSecurity Act of 2007,” April 10, 2008, p. 8.75 EIA assumes that a 44% capacity factor would be achievable by 2010 for a wind plantlocated in the northwest. The wind capacity factor for this region actually declines overtime, to 41% by 2030, presumably because wind plants are increasingly located in lessfavorable locations. See EIA, Assumptions to the Annual Energy Outlook 2007, Table 73.Planning consultants to the utility Westar Energy assumed that wind plants located inKansas could achieve capacity factors of 42%. See Direct Testimony of Michael Elenbaason behalf of Westar Energy, before the Kansas State Corporation Commission, Docket 08-
(continued...)
Costs were estimated for six cases intended to illustrate some of the importanteconomic, operational, and government incentive factors that influence the relativeeconomics of wind power.71 The Base Case (Case 1) assumes continuation of therenewable production tax credit as currently formulated. It also assumes the nuclearplant qualifies for the nuclear production tax credit (at an effective rate of $12 permegawatt-hour)72 and loan guarantee program established by the Energy Policy Actof 2005. No carbon costs are assumed. The five alternative cases have the followingcharacteristics (each is identical to the Base Case except as indicated):
! Case 2: Reduced Incentives. The renewable production tax creditis assumed to terminate and is not renewed. The nuclear plant isassumed to not receive a loan guarantee.73
! Case 3: High Natural Gas Prices. Natural gas prices are assumedto be 50% higher than the current EIA forecast used in the BaseCase.
! Case 4: Carbon Costs. This case assumes the imposition ofcontrols on carbon emissions from fossil fueled power plants. Anillustrative allowance price of $25 per metric ton of carbon dioxideis assumed, escalating at a real rate of one percent per year, firstimposed in 2013.74
! Case 5: Wind Capacity Factor. This case assumes that the windplant has a capacity factor of 44% rather than the 34% used in theBase Case. The higher capacity factor could be the result ofimproved technology or a better-than-average location.75

CRS-29
75 (...continued)WSEE-309-PRE, October 1, 2007, pp. 11 and 13.76 The loan guarantee allows the nuclear plant to be financed with 80% debt at a low interestrate. In the absence of the loan guarantee the cost of debt increases and the debt portion ofthe financial structure drops to 50%. The balance of the financing is equity, which is moreexpensive than debt. Eliminating the loan guarantee, therefore, has a major impact on thecost of a nuclear project. The chief nuclear officer for Exelon, the power company with thelargest fleet of nuclear reactors in the United States, stated that constructing new nuclearplants will be “impossible” in the absence of loan guarantees (S. Dolley, “Nuclear PowerKey to Exelon’s Low-Carbon Plan,” Nucleonics Week, February 14, 2008). For furtherdiscussion of the importance of loan guarantees, see Tom Tiernan, “Nuclear Interests, WallStreet Concerned about Loan Guarantee Program, Legislation,” Electric Utility Week,August 20, 2007. Wind power is not eligible for the loan guarantees provided in EPACT05because it is not considered a commercial technology.77 For example, see EIA, Annual Energy Outlook Retrospective Review: Evaluation ofProjections in Past Editions (1982-2006), pp. 2, 3, and 5.
! Case 6: Wind Integration Cost. A system integration charge isadded to the cost of wind power. The assumed cost is theBonneville Power Administration charge of $2.82 per megawatt-hour. This cost is assumed to remain constant in real dollar termsfor the forecast period.
The results for the six cases are summarized below in Table 3. These estimatesshould be viewed as indicative and not definitive, and are subject to a high degree ofuncertainty. As shown in the table:
! In Case 1, the levelized cost of wind power is a few percent higherthan coal or gas-fired power; given the range of uncertainty in theassumptions, the costs of these options are essentially similar.Nuclear power, which is assumed to benefit from the full range offederal incentives (a production tax credit and loan guarantee) isabout 10% less expensive than wind and the least expensive of allthe alternatives examined.
! In Case 2, reducing incentives significantly changes the results. Ifthe renewable production tax credit is assumed to terminate, the costof wind power increases by 10%. In this situation coal and gas havea 14% to 15% cost advantage over wind. However, the biggestimpact of reducing incentives is on nuclear power. Assuming noloan guarantee, the cost of nuclear power increases by 28% (from$60 to $77 per megawatt-hour).76 In this situation, wind power’scost (also without a production tax credit) is essentially similar(slightly lower) than nuclear power.
! Natural gas prices have historically been difficult to forecast andoften underestimated.77 When gas prices are assumed to be 50%higher than in the Base Case, wind has an 18% cost advantage overgas-fired electricity (Case 3).
! The imposition of an illustrative cost of $25 per metric ton of carbondioxide on fossil-fired generation (Case 4) has the greatest impact on

CRS-30
78 Carbon costs have less impact on the gas plant because gas emits about half as muchcarbon dioxide per unit burned than coal, and a combined cycle gas-fired plant requires lessfuel to produce a unit of electricity than a pulverized coal plant.
the relative competitiveness of wind with coal. The carbon costtakes coal from a 4% cost advantage over wind in the Base Case toa 19% disadvantage. The impact on gas-fired power is significant,but less dramatic; gas goes from a 6% cost advantage to a 4%disadvantage when carbon costs are imposed.78
! As discussed above, the combination of high capital costs andrelatively low utilization rates, as measured by the capacity factor,creates a cost disadvantage for wind power. The importance ofutilization is illustrated by Case 5, which assumes a wind capacityfactor of 44%, compared to the 34% rate used in the Base Case.With a high capacity factor, wind has the lowest cost of thealternatives examined, and in particular is over 25% less costly thancoal or gas.
! The final case (Case 6) assumes the imposition of a systemintegration charge of $2.82 per Mwh on wind generation. As Table5 shows, costs under this case and the Base Case are similar.
In summary, the financial analysis suggests the following:
! Given the Base Case assumptions, including continuation of therenewable production tax credit, the cost of wind power iscomparable to coal and gas. The addition of an illustrative systemintegration charge, to account for large-scale wind penetration of autility system, does not greatly change these results.
! Federal financial incentive policies have a significant impact on thefinancial analysis. The economics of wind are materially worsewhen the production tax credit is eliminated, and materiallyimproved versus nuclear power when nuclear incentives arereduced.
! Improved technology or prime locations that allow wind projects toachieve high rates of utilization would significantly lower the costof wind power.
! Assuming higher natural gas prices than the current EIA referenceforecast, or the imposition of carbon charges on coal and gas, greatlyenhances the cost competitiveness of wind.
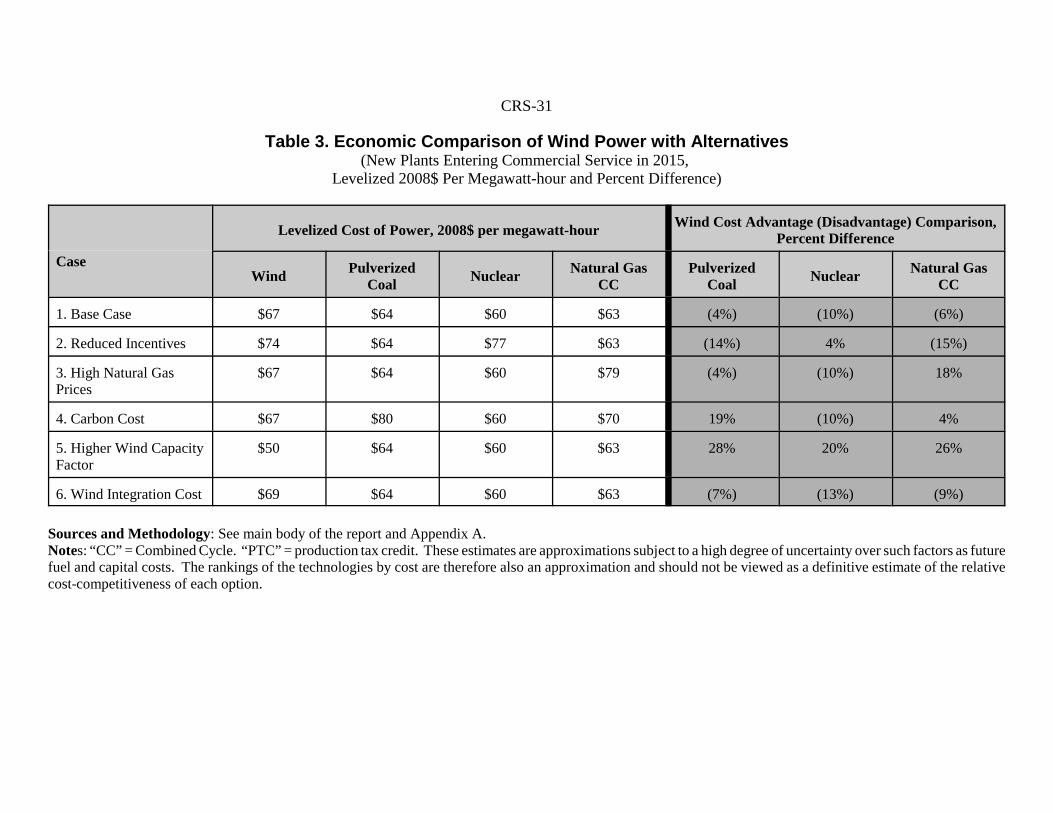
CRS-31
Table 3. Economic Comparison of Wind Power with Alternatives(New Plants Entering Commercial Service in 2015,
Levelized 2008$ Per Megawatt-hour and Percent Difference)
Case
Levelized Cost of Power, 2008$ per megawatt-hour Wind Cost Advantage (Disadvantage) Comparison,Percent Difference
Wind PulverizedCoal Nuclear Natural Gas
CCPulverized
Coal Nuclear Natural GasCC
1. Base Case $67 $64 $60 $63 (4%) (10%) (6%)
2. Reduced Incentives $74 $64 $77 $63 (14%) 4% (15%)
3. High Natural GasPrices
$67 $64 $60 $79 (4%) (10%) 18%
4. Carbon Cost $67 $80 $60 $70 19% (10%) 4%
5. Higher Wind CapacityFactor
$50 $64 $60 $63 28% 20% 26%
6. Wind Integration Cost $69 $64 $60 $63 (7%) (13%) (9%)
Sources and Methodology: See main body of the report and Appendix A.Notes: “CC” = Combined Cycle. “PTC” = production tax credit. These estimates are approximations subject to a high degree of uncertainty over such factors as futurefuel and capital costs. The rankings of the technologies by cost are therefore also an approximation and should not be viewed as a definitive estimate of the relativecost-competitiveness of each option.

CRS-32
79 Energy projects built on private land that receive federal grants or use federal transmissionlines must also meet federal requirements in the National Environmental Policy Act (42U.S.C. §4321).
80 Others might include the Bald and Golden Eagle Protection Act (16 U.S.C. §§668-668d),National Historic Preservation Act (16 USC §470), Clean Water Act (33 U.S.C. §1251),Rivers and Harbors Act of 1899 (33 U.S.C. §401), Comprehensive Environmental Response,Compensation, and Liability Act (CERCLA or Superfund, 42 U.S.C. §§9601-9675).81 More comprehensive information on federal, state and local regulations related to windenergy projects is found in: Energy Efficiency and Renewable Energy, “Federal Wind SitingInformation Center,” DOE [http://www1.eere.energy.gov/windandhydro/federalwindsiting/],Wind Energy Siting Handbook, AWEA, 2008 and Permitting of Wind Energy Facilities: AHandbook, National Wind Coordinating Committee, Revised 2002.82 National Research Council, Environmental Impacts of Wind-Energy Projects: Report inBrief, The National Academy of Sciences, 2007, p. 2.
Wind Policy Issues
This section of the report discusses government policy issues related to windpower. Some issues, such as permitting, are primarily state and local issues, but stillmay be a concern to congressional constituents. Other issues, such as the extensionof the renewable production tax credit, are clearly federal issues.
Siting and Permitting Issues
Like other electric power projects, wind energy projects built and operated inthe United States must comply with applicable federal, state, and local requirements.Most wind energy projects in the United States today are built on private land. As aresult, local and state jurisdictions play the most important role in siting andpermitting wind energy projects.79 These projects, however, usually must also meetcertain federal requirements such as those in the Endangered Species Act(U.S.C.§1531-1544), Migratory Bird Treaty Act (U.S.C.§§703-711), or HazardDetermination by the Federal Aviation Administration (FAA).80 Key siting andpermitting issues are discussed below.81
Wildlife Constraints. The main environmental objection to wind power isconcern about bird and bat collisions with wind turbines. A National Academy ofSciences report states that, “Out of a total of perhaps 1 billion birds killed annuallyas a result of human structures, vehicles and activities, somewhere between 20,000and 37,000 died in 2003 as a result of collisions with wind-energy facilities.”82
Although this is a small percentage of total birds killed, the impact on particularspecies could be significant, especially if wind power continues to expand rapidly.
Early wind turbines in California killed birds — especially raptors (huntingbirds like hawks, eagles, and owls, some of which are protected under theEndangered Species Act) — and catalyzed opposition to wind power among bird

CRS-33
83 These early turbines were not designed with avian populations in mind. The blades spunmuch more quickly than today’s turbines and the towers were often constructed of latticesteel, an enticing nesting feature for birds.84 Wind Power: Impacts on Wildlife and Government Responsibilities for RegulatingDevelopment and Protecting Wildlife, Government Accountability Office, GAO-05-906,September 2005, pp. 10-13.85 J. Layke, K. Porter, and A. Perera, “Diversifying Corporate Energy Purchasing with WindPower,” World Resources Institute, February 2008, p. 14.86 BWEC includes AWEA, Bat Conservation International, the U.S. Fish and WildlifeService, and the U.S. Department of Energy’s National Renewable Energy Laboratory.“Wind Energy and Wildlife: Frequently Asked Questions,” AWEA, 2008, p. 2.87 See, for example, “Bats and Wind Energy Cooperative” [http://www.batsandwind.org/].88 See, for example, National Research Council, Environmental Impacts of Wind-EnergyProjects: Report in Brief, The National Academy of Sciences, 200789 J. Layke, K. Porter, A. Perera, “Diversifying Corporate Energy Purchasing with WindPower,” World Resources Institute, 2008, p. 9.90 See “Interim Guidelines to Avoid and Minimize Wildlife Impacts from Wind Turbines,”U.S. Department of the Interior, Fish and Wildlife Service, 2003, [http://www.fws.gov/habitatconservation/wind.pdf].
enthusiasts.83 Although bird concerns remain, today’s turbines kill far fewer birdsper unit of electricity generated than early models, especially in California.84 Morerecently, a relatively large number of bat fatalities have occurred at wind plants inWest Virginia, Pennsylvania, New York, Alberta, and elsewhere.85 As a result, thewind industry and bat supporters formed a new organization, the Bats & WindEnergy Cooperative (BWEC) to fund studies designed to reduce bat mortality.86
Most experts concede that not enough is known about avian behavior to predictaccurately what the affect on species will be if wind plants continue to expand. Morecollaborative study is underway to improve understanding of ways to minimize aviandeaths.87 Potential mitigation options include:
! Stopping wind plants during key migratory periods,! Painting blades to improve visibility,! Avoiding locations, such as some mountain passes, already known
to be migration corridors,! Employing acoustic deterrents, and! Moving selected turbines.
In addition to birds and bats, wildlife protection experts are studying how windplant construction and operation affects terrestrial animals.88 Greater prairiechickens, for example, shy away from tall structures and may thus avoid living nearwind plants.89
Federal agencies produced interim recommended guidelines in 2003 to assistproject developers in considering and minimizing wildlife impacts.90 The DOI(through Fish and Wildlife Services, FWS) has established a Wind Turbine

CRS-34
91 The Charter describing the committee’s formation is available on the FWS website at[http://www.fws.gov/habitatconservation/Advisory_Committee_Charter_3_20_07.pdf].92 A. Rogers, J. Manwell, and S. Wright, Wind Turbine Acoustic Noise, University ofMassachusetts at Amherst, Renewable Energy Research Laboratory, June 2002.93 B. Voll, “Black Springs Wind Farm Shadow Flicker Study,” Energreen Wind, 2006, p.6.94 See also M. Brenner, et al., Wind Farms and Radar, The MITRE Corporation, JSR-08-126, January 2008.
Guidelines Advisory Committee to advise the Secretary on developing effectivevoluntary measures to minimize impacts to wildlife related to land-based windturbines.91 Early in the 110th Congress, Title VII of the New Direction for EnergyIndependence, National Security, and Consumer Protection Act (H.R. 3221) hadrequired formation of such a committee, but the provision was removed when the billwas merged with H.R. 6. As noted previously, Congress gave MMS primaryauthority over most aspects of siting off-shore wind plants through EPACT05.
Aesthetic and Social Issues. Some landowners object to the visual impactthat wind turbines create, especially near shore, mountainous, forested, protected, orother “valuable” areas. They view wind turbines as an unacceptable human orindustrial fingerprint on lands that should remain natural. These objections arereflected in the offshore Cape Wind project, where opponents argue that natural“landscapes” (or seascapes, in this case) will be forever altered by the wind turbines.
In addition to the visual impacts, there are other objections. All wind turbinesproduce mechanical and aerodynamic noise. Noise is thus a siting criterion forregulatory purposes. Early wind turbine models were often loud, especiallydownwind versions (blades behind the generator). Newer models are designed tominimize noise.92 Like visual aesthetics, wind turbine noise is often a matter ofindividual preferences and tolerances. For residences over 1 kilometer (0.6 miles)from a wind turbine, noise is generally not an issue.
Shadow flicker, also know as shadow casting or blinking, is defined asalternating changes in light intensity caused by the moving blades casting shadowson the ground or objects. No flicker shadow will be cast when the sun is obscuredby clouds or when the turbine is not rotating. This phenomenon can be annoying forresidents who live very close to turbines. Computer simulations can help projectdevelopers position turbines so that flicker does not interfere with nearby residences.Shadow flicker generally does not affect residences located 10 rotor diameters ormore (about 0.5 miles) from the turbine, except possibly early in the morning or latein the evening when shadows are long.93
Radar Issues. Wind turbines can interfere with civilian and military radar atsome locations. The potential interference occurs when wind turbines reflect radarwaves and cause ghosting (false readings) or shadowing (dead zones) on receivingmonitors. Radar interference thus raises national security and safety concerns.94

CRS-35
95 AWEA, “Wind Turbines and Radar: An Informational Resource,” June 2, 2006[http://www.awea.org/pubs/factsheets/060602_Wind_Turbines_and%20_Radar_Fact_Sheet.pdf].96 K. Kinsmore, and R. Wright, “Intent of March 21, 2006 Memorandum,” Department ofDefense and Department of Homeland Security Joint Program Office, July 10, 2006.97 The report was issues on September 27, 2006 and is available at [http://www.defense.gov/pubs/pdfs/WindFarmReport.pdf]98 Office of the Director of Defense Research and Engineering, The Effect of WindmillFarms on Military Readiness, DOD, September 2006, pp. 56-57.99 FAA requirements on potential obstructions are discussed at [https://oeaaa.faa.gov/oeaaa/external/portal.jsp].
Concern over wind power and radar interference appeared to peak afterCongress enacted the National Defense Authorization Act for Fiscal Year 2006 (P.L.109-163) on January 3, 2006. Section 358 of the law required the Department ofDefense (DOD) to submit to Congress within 120 days a report on the impacts ofwind plants on military readiness. In response, DOD and the Department ofHomeland Security (DHS) issued a temporary ruling on March 21, 2006, contestingthe construction of any wind plant within radar line of sight of key military radarfacilities until the report could be completed. AWEA stated in a June 2006 fact sheetthat the de facto moratorium on billions of dollars worth of wind investment in partsof the country was inappropriate.95 The temporary ruling was clarified on July 10,2006, in a joint DOD-DHS memo to the Federal Aviation Administration (FAA),96
calling for a case-by-case evaluation of the potential of wind projects on radarsystems. Permitting resumed for most of the affected projects later that year.
The DOD impacts report97 concluded that wind farms located within radar lineof sight of an air defense radar have the potential to degrade the ability of that radarto perform its intended function. It also noted that currently proven mitigationoptions to completely prevent any degradation in primary radar performance of airdefense radars are limited to methods that avoid locating wind turbines within theirradar line of sight. DOD has initiated research efforts to develop additionalmitigation approaches that in the future could enable wind turbines to be placedwithin radar line of sight of air defense radars without impacting their performance.98
The FAA has oversight over any object that could have an impact oncommunications in navigable airspace, either commercial or military. DODparticipates in the FAA review and evaluation of applications for potential impactsto its ability to defend the nation. The FAA requires that a Notice of ProposedConstruction or Alteration be filed for any project that would extend more than 200feet above ground level (or less in certain circumstances, for example if the object iscloser than 20,000 feet away from a public-use airport with a runway more than3,200 feet long).99
Although the DOD report noted limited options to “completely prevent” thedegradation of any performance of air defense radar systems, DOE believes thatpractical solutions to radar interference are achievable. DOE notes that in themajority of cases, interference is either not present, is not deemed significant, or can

CRS-36
100 U.S. DOE, “Wind Powering America,” available at [http://www.eere.energy.gov/windandhydro/windpoweringamerica/ne_issues_interference.asp].101 See CRS Report RL33875, Electric Transmission: Approaches for Energizing a SaggingIndustry, by Amy Abel.102 Actual costs are location dependent. Northwest Power Pool, “Canada — Northwest —California Transmission Options Study,” pp. 16-27, May 16, 2006.
be readily mitigated.100 Potential interference is highly site specific and depends onlocal features, type of radar, and wind plant characteristics. In most cases, radarinterference can be corrected with software that deletes radar signals from stationarytargets.
Transmission Constraints
Transmission constraints are considered to be one of the biggest challengesfacing the U.S. wind industry.
The electricity grid in the United States is aging and overloaded in some regions,and new investment is required to ensure reliable, efficient transmission ofelectricity.101 Siting new transmission lines is an expensive, time consuming, and,often, controversial endeavor. Wind plant developers seek access to transmissioncapacity that allows them to send their electricity to market without having to buildnew lines, especially ones they need to pay for themselves. As noted previously,much of the nation’s best wind resources are located in remote, lightly populatedareas where little transmission capacity exists. Demand centers, where the electricityis consumed, can be hundreds of miles away. A 2006 estimate puts the cost of newtransmission lines at $1.5- $2 million per mile, and costs may have increased since.102
Transmission constraints occur in at least 3 ways:
! Limited transmission capacity,! Scheduling difficulties in using existing lines, and! Delays in interconnecting new wind power sources to the grid.
Limited Transmission Capacity. Good sites for wind plants may belocated in areas with limited available capacity on the transmission network, or thesites may be distant from any existing transmission lines. These capacity limits arethe most fundamental constraint facing wind power project developers. It can takemany years to plan and build new infrastructure. Wind plant developers who buildin regions with limited or no transmission capacity may have to incur all constructioncosts for new or improved transmission infrastructure, an expensive proposition.
Texas is attempting to address its wind power transmission constraints throughcompetitive renewable energy zones (CREZs), which attempt to optimize the linkingof promising wind zones with demand centers and overcome the “chicken and egg”problem between wind plant developers and transmission providers. California ispursuing a similar CREZ policy, and other states, including New Mexico, Wyoming,

CRS-37
103 L. Chaset, “Comments of the Public Utility Commission of California,” FERC DocketNo. AD08-2-00, December 11, 2007; and S. Smith, “Wind on the Wires: Can TransmissionInfrastructure Adapt?,” Utility Automation and Engineering T&D, May 2008.104 P.L. 109-58, §1221.105 P.L. 109-58, §1242.106 Preventing Undue Discrimination and Preference in Transmission Service (Order 890),Federal Energy Regulatory Commission, February 16, 2007.107 See CRS Report RS21407, Federal Energy Regulatory Commission’s Standard Market
(continued...)
and Colorado, are expanding transmission infrastructure to accommodate wind andother electricity options.103
Under the Energy Policy Act of 2005 (EPACT05), in certain cases wheretransmission congestion exists, the Federal Energy Regulatory Commission (FERC)may use federal over-ride (eminent domain) authority to site new transmission lineswhen states have not acted to site those lines.104 Also under EPACT05, FERC isauthorized to approve a funding plan for new transmission that would charge the newgenerator for all costs associated with interconnection rather than socializing theinterconnection costs over all users of the transmission network.105 This type offunding could be cost prohibitive for small wind facilities.
Finally, EPACT05 also directed FERC to establish incentive rules to encouragegreater investment in the nation’s transmission infrastructure, promote electric powerreliability, and lower costs for consumers by reducing transmission congestion. OrderNo. 679 allows a public utility to obtain incentive rate treatment for transmissioninfrastructure investments under certain conditions.
Scheduling Difficulties. Transmission scheduling difficulties for windpower can result because the original rules for access to transmission capacity werenot designed with intermittent sources, like wind, in mind. As the electricity sectorslowly transforms itself from one with several hundred vertically integrated utilitieswith their own transmission control areas to one with a combination of regionaltransmission organizations (RTOs) and traditional control centers, the rules are beingrewritten. Under the old rules, economic penalties were applied to generators that didnot meet their day-ahead schedule requirements. For wind power, this occurredfrequently since power output varies with wind variability, making schedulingdifficult. Wind developers claim that the old rules discriminated against intermittentsources. In February 2007, FERC issued Order No. 890 to allow greater access totransmission lines for power generators of all types, including renewable energyprojects.106
Rate pancaking (using the transmission facilities of multiple operators andincurring access charges from each) is another scheduling barrier for wind power insome regions. Only large transmission systems acting as a single network resourceallow wind plants to avoid pancaking. FERC tried to promote a Standard MarketDesign order in 2002-2003 that might have provided greater uniformity totransmission pricing, but the effort was dropped due to opposition.107

CRS-38
107 (...continued)Design Activities, by Amy Abel.108 According to a recent DOE report, there were 225,000 megawatts of proposed windpower capacity in interconnection queues within 11 RTO, ISO, and utility regions at the endof 2007. As noted in the report, being in the queue does not guarantee that a project will bebuilt; many are at an early stage of development and may never achieve commercialoperations. For comparison, the report noted that about 212,000 megawatts of natural gas,coal, nuclear, solar, and “other” projects were also in queues. R. Wiser and M. Bolinger,Annual Report on U.S. Wind Power Installation, Cost and Performance Trends: 2007, U.S.Department of Energy, May 2008, pp. 9-10.109 Standardization of Generator Interconnection Agreements and Procedures (Order 2003),Federal Energy Regulatory Commission, July 24, 2003; Interconnection for Wind Energy(Order 661), Federal Energy Regulatory Commission, June 2, 2005.110 Interconnection Queuing Practices (Docket No. AD08-2-000), Federal EnergyRegulatory Commission, March 20, 2008.111 For more information on recent electricity transmission issues that may relate to windpower, see CRS Report RL33875, Electric Transmission: Approaches for Energizing aSagging Industry, by Amy Abel; and 20% Wind Energy by 2030: Increasing Wind Energy’sContribution to U.S. Electricity Supply, U.S. DOE, 2008.112 Testimony from this hearing is available at [http://energy.senate.gov/public/
Transmission Interconnection. There are long queues (waiting lists) insome regions of the country for wind and other power plant developers to getapproval to interconnect their new facilities with the grid.108 FERC issued Orders2003 and 661 to clarify transmission interconnection requirements and help addresspotential discrimination.109 FERC is also preparing new guidance to help RTOs andindependent system operators (ISOs) improve their queuing methodology.110 As longas there is a shortage of transmission capacity, however, transmission interconnectionqueuing is likely to remain a problem.111
Federal Renewable Transmission Initiatives. Two bills were introducedin the 110th Congress to address transmission of wind power and other renewableelectricity. The Clean Renewable Energy and Economic Development Act (S. 2076),introduced in September 2007, would, among other things, amend the Federal PowerAct to require national renewable energy zones. These zones would be specifiedareas that have the potential to generate 1,000 megawatts of electricity fromrenewable energy, a significant portion of which could be generated in a rural areaor on federal land.
The legislation would also require FERC to promulgate regulations to ensurethat (1) specified public utility transmission providers that finance renewableelectricity connection facilities in such zones recover incurred costs and a reasonablereturn on equity associated with the new transmission capacity; and (2) not less than75% of the capacity of specified high-voltage transmission facilities and lines is usedfor electricity from renewable energy. The legislation was referred to the Committeeon Energy and Natural Resources, which held a hearing on transmission issues forrenewable electricity resources on June 17, 2008.112

CRS-39
112 (...continued)index.cfm?FuseAction=Hearings.Hearing&Hearing_ID=7344491e-df7f-9a28-80ce-47fe52e63f1b].113 U.S. Congress, House Committee on Ways and Means, Tax Credits for ElectricityProduction from Renewable Sources. Hearing held May 24, 2005. Testimony of DeanGosselin, FPL Energy. pp. 25-26. [http://waysandmeans.house.gov/hearings.asp?formmode=detail&hearing=411].
A similar bill in the House, the Rural Clean Energy Superhighways Act (H.R.4059), was introduced in November 2007. It would also focus on creating nationalrenewable energy zones under certain conditions. It requires the President to identify,and provide public notice of, additional renewable energy trunkline facilities andnetwork upgrades required to increase substantially the generation of electricity fromrenewable energy within each potential zone. It directs FERC to pass regulations toensure that a public utility that finances transmission capacity to transmit electricityfrom renewable energy from a zone to an electricity consuming area recovers throughtransmission service rates all prudently incurred costs and a reasonable return onequity associated with construction and operation of the new transmission capacity.It also directs FERC, in specified circumstances, to permit a renewable energytrunkline built by a public utility located in a zone to be initially funded throughtransmission charges imposed upon (1) all the utility’s transmission customers inadvance of significant generation interconnection requests; or (2) all the transmissioncustomers of a Regional Transmission Organization (RTO) or independent systemoperator, if the trunkline is built in an area served by one or the other. Cost allocationprocedures are prescribed for new projects and network upgrades. A federal powermarketing administration, including the Tennessee Valley Authority (TVA), thatowns or operates electric transmission facilities is required to finance a networkupgrade or a renewable energy trunkline facility, if within a certain time frame noprivately or publicly funded entity commits to do so.
Renewable Production Tax Credit
The renewable production tax credit is an incentive to business developers ofwind plants and some other renewable energy projects that produce electricity. Foreach kilowatt-hour of energy produced, a developer can apply for a credit againsttaxes. In 2007, the credit stood at 2.0 cents per kilowatt-hour for claims against2006 taxes. According to industry members, the PTC expirations in 2000, 2002, and2004 have had a negative impact on the U.S. wind industry’s ability to invest in newproduction facilities efficiently.113
Proponents of extending the credit past 2008 argue that the PTC is meritedbecause it corrects a market failure by providing economic value for theenvironmental benefits of “clean” energy sources. Also, they contend it helps “levelthe playing field,” noting that there is an even longer history of federal subsidies for

CRS-40
114 Federal subsidies for conventional energy resources and technologies and for electricpower facilities (including large hydroelectric power plants) have been traced back as faras the 1920s and 1930s. See DOE (Pacific Northwest Laboratory), An Analysis of FederalIncentives Used to Stimulate Energy Production, 1980. p. 300. The EIA recently publishedthe latest in a series on federal energy incentives and subsidies: EIA, Federal FinancialInterventions and Subsidies in Energy Markets 2007, DOE, April 2008.115 GAO. Petroleum and Ethanol Fuels: Tax Incentives and Related GAO Work.(GAO/RCED-00-301R) September 25, 2000. The report notes that from 1968 through 2000,about $150 billion (constant 2000 dollars) worth of tax incentives were provided to supportthe oil and natural gas industries.
conventional energy.114 For example, they point to the percentage depletionallowance for oil and natural gas that has been in place for many decades.115
Opponents of extending the production tax credit beyond the end of 2008 arguethat generally there are no market failures that warrant special tax subsidies forparticular types of renewable energy technologies. They argue further that subsidiesgenerally distort the free market and that renewables should not get special treatmentthat exempts them from this principle. Also, regarding the concern about theenvironmental problems of conventional energy sources, they contend that the mostcost-effective economic policy is to put a tax on the pollution from energy sourcesand let the free market make the necessary adjustments. Another argument againstthe PTC is that intermittent renewable energy production has a fluctuating nature thatmakes it less valuable than energy produced by conventional facilities.
PTC Eligibility: IOUs vs. IPPs. The renewable PTC is not available toinvestor owned utilities (IOUs), although utilities do finance and own wind plants.Typically, independent power producers (IPPs) build, finance, and own wind plantsand sell power to regulated utilities. There are a number of financing mechanismswhere other providers of capital assist with financing wind plants in exchange for aportion of the tax credits. One question for Congress is whether utilities shouldbecome eligible to receive the PTC. Doing so would allow them to finance windplants at a lower cost since the interest rates they pay on debt is lower than what anIPP pays. This would reduce the cost of wind power. One impact of allowingutilities to receive the renewable tax credits is that they could become morecompetitive at producing wind than IPPs. This could threaten the growth of thedozens of companies that now build wind plants.
Specific PTC Legislative Options. Congress is considering a variety ofbills that would extend or modify selected renewable energy and energy efficiencytax incentives, including wind power. Title IV of the Alternative Minimum Tax andExtenders Tax Relief Act (S. 2886), which was introduced on April 17, 2008, wouldextend eight incentives. Title X of the Foreclosure Prevention Act (H.R. 3221),which passed the Senate on April 10, 2008, incorporates eight renewable energy andenergy efficiency tax incentives from the Clean Energy Tax Stimulus Act (S. 2821).The Renewable Energy and Energy Conservation Tax Act (H.R. 5351), which passedthe House on February 27, 2008, includes 16 incentives for renewable energy andenergy efficiency. Features of these bills as they relate to the PTC for wind energyare summarized in Table 4. For updated status on legislation related to the PTC, see
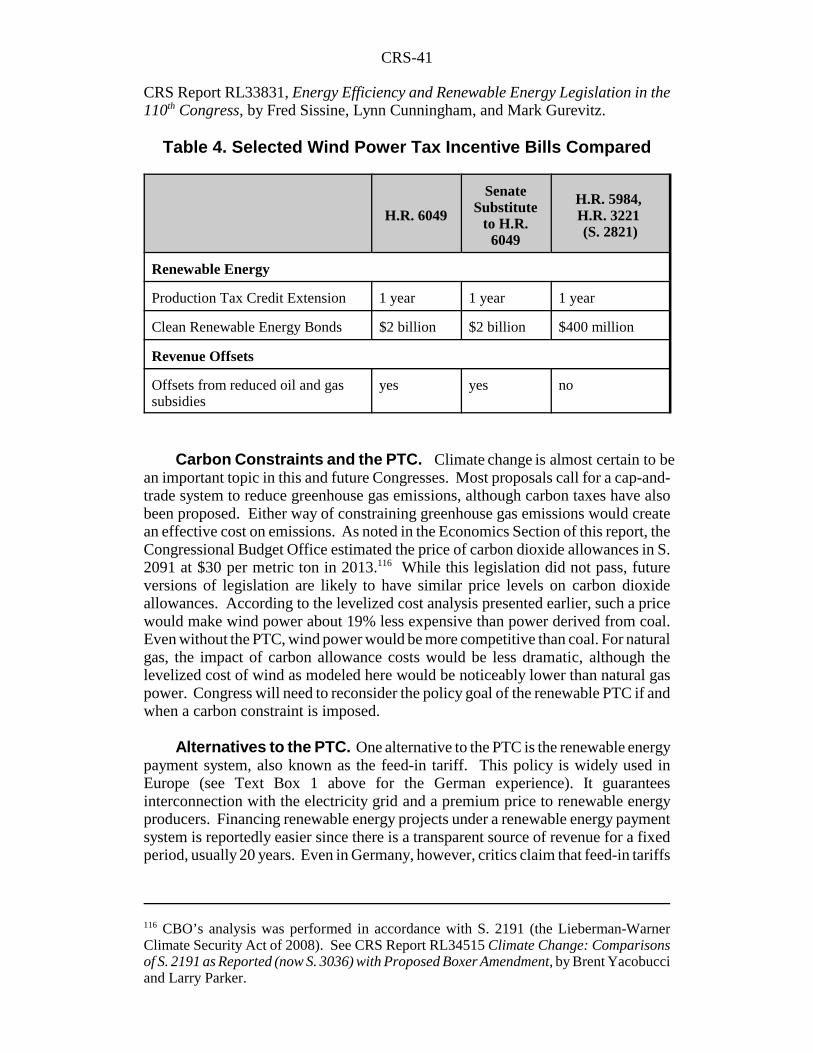
CRS-41
116 CBO’s analysis was performed in accordance with S. 2191 (the Lieberman-WarnerClimate Security Act of 2008). See CRS Report RL34515 Climate Change: Comparisonsof S. 2191 as Reported (now S. 3036) with Proposed Boxer Amendment, by Brent Yacobucciand Larry Parker.
CRS Report RL33831, Energy Efficiency and Renewable Energy Legislation in the110th Congress, by Fred Sissine, Lynn Cunningham, and Mark Gurevitz.
Table 4. Selected Wind Power Tax Incentive Bills Compared
H.R. 6049
SenateSubstitute
to H.R.6049
H.R. 5984, H.R. 3221 (S. 2821)
Renewable Energy
Production Tax Credit Extension 1 year 1 year 1 year
Clean Renewable Energy Bonds $2 billion $2 billion $400 million
Revenue Offsets
Offsets from reduced oil and gassubsidies
yes yes no
Carbon Constraints and the PTC. Climate change is almost certain to bean important topic in this and future Congresses. Most proposals call for a cap-and-trade system to reduce greenhouse gas emissions, although carbon taxes have alsobeen proposed. Either way of constraining greenhouse gas emissions would createan effective cost on emissions. As noted in the Economics Section of this report, theCongressional Budget Office estimated the price of carbon dioxide allowances in S.2091 at $30 per metric ton in 2013.116 While this legislation did not pass, futureversions of legislation are likely to have similar price levels on carbon dioxideallowances. According to the levelized cost analysis presented earlier, such a pricewould make wind power about 19% less expensive than power derived from coal.Even without the PTC, wind power would be more competitive than coal. For naturalgas, the impact of carbon allowance costs would be less dramatic, although thelevelized cost of wind as modeled here would be noticeably lower than natural gaspower. Congress will need to reconsider the policy goal of the renewable PTC if andwhen a carbon constraint is imposed.
Alternatives to the PTC. One alternative to the PTC is the renewable energypayment system, also known as the feed-in tariff. This policy is widely used inEurope (see Text Box 1 above for the German experience). It guaranteesinterconnection with the electricity grid and a premium price to renewable energyproducers. Financing renewable energy projects under a renewable energy paymentsystem is reportedly easier since there is a transparent source of revenue for a fixedperiod, usually 20 years. Even in Germany, however, critics claim that feed-in tariffs

CRS-42
117 The summary is available at [http://www.eesi.org/briefings/2008/061808_hboell_rep/Inslee_REJSA_061808.pdf].118 Section 210 of the Public Utility Regulatory Policies Act (PURPA) of 1978 hadguaranteed a market for the purchase of electric power produced from small renewableenergy facilities. PURPA let states determine the avoided cost pricing of the electricityproduction from renewable energy facilities. The effectiveness of this mechanism lessenedwith the advent of electric industry restructuring. Provided that certain conditions are metin any given state, Section 1253 of the Energy Policy Act of 2005 retrospectively terminatesthe PURPA mandatory purchase requirements.119 Federal Energy Regulatory Commission, Renewable Energy Portfolio Standards (RPS),DOE. For a map showing the status of state action on RPS, see [http://www.ferc.gov/market-oversight/mkt-electric/overview/elec-ovr-rps.pdf].120 Details about eligible resources and other provisions of state RPS programs are availablefrom the online Database of State Incentives for Renewable Energy and Energy Efficiency,[http://www.dsireusa.org/]. See also R. Wiser and G. Barbose, Renewables PortfolioStandards in the United States — A Status Report with Data Through 2007, LawrenceBerkeley National Laboratory, April 2008; and A. Selting, The Race for the Green: HowRenewable Portfolio Standards Could Affect U.S. Utility Credit Quality, Standard & Poors,March 2008.
can be expensive. A summary of the Renewable Energy Jobs and Security Act,which incorporates renewable energy payments, was circulated in mid-June 2008.117
Renewable Portfolio Standards
In the late 1990s, many states began to restructure their electric utility industriesto allow for increased competition. Some of these states established an RPS, in part,as a way to create a continuing role for renewable energy in power production.118 AnRPS requires utilities to provide a minimum percentage of their electricity fromapproved renewable energy sources. Some states without a restructured industry alsoadopted an RPS. The number of states with an RPS has grown steadily but withoutconsistency — RPS requirements vary from state to state. In April 2008, FERCreported that 26 states and the District of Columbia had an RPS in place, collectivelycovering about 54% of the national electric load.119 Mandatory state RPS targetsrange from a low of 2% to a high of 25% of electricity generation. However, mosttargets range from 10% to 20% and are scheduled to be reached between 2010 and2025.
Most states include wind energy as an eligible resource and allow some form oftrading between holders of the “renewable energy credits” that result from operatingwind projects.120 Non-compliance penalties imposed by states range from about 1.0to 5.5 cents per kilowatt-hour. Many states in the Southeast and Midwest regions donot have an RPS requirement. Several states have broadened their RPS provisionsto allow certain energy efficiency measures and technologies to help satisfy therequirement.
Federal RPS Debate. State RPS action has provided an experience base forthe design of a possible national requirement. Proponents of a federal RPS contendthat a national system of tradable credits would enable retail suppliers in states with

CRS-43
121 EIA, Impacts of a 15-Percent Renewable Portfolio Standard, DOE, June 2007. 24 p.
fewer resources to comply at the least cost by purchasing credits from organizationsin states with a surplus of low-cost production. Opponents counter that regionaldifferences in availability, amount, and types of renewable energy resources wouldmake a federal RPS costly and unfair.
Efforts to include a federal RPS in the Energy Independence and Security Act(P.L. 110-140) were unsuccessful. In June 2007, S.Amdt. 1537 to H.R. 6 proposeda 15% federal RPS. Senate floor action on the proposal triggered a lively debate, butthe amendment was ultimately ruled non-germane. In that debate, opponents arguedthat a national RPS would raise retail electricity prices and disadvantage Southeasternstates because they lack sufficient renewable energy resources to meet a 15% RPSrequirement. RPS proponents countered that an Energy Information Administration(EIA) report indicated that the South has sufficient biomass power potential fromexisting plants to meet a 15% RPS without becoming “unusually dependent” on otherregions.121 Further, EIA estimated that the 15% RPS would likely raise retail pricesby slightly less than 1% over the 2005 to 2030 period, but would also be likely tocause retail natural gas prices to fall slightly over that period. In December 2007, theHouse approved H.R. 6 with a 15% RPS, but the Senate dropped the provision underthreat of an Administration veto of the bill. The prospects for another federal RPSinitiative in the 110th Congress are unclear.
Conclusions
Wind power in the United States is growing rapidly. Although it currentlysupplies only about 1% of the country’s electricity needs, some states and regionshave a much higher level of wind penetration. Furthermore, the amount of proposednew wind plants either under construction or waiting to be built is significant, andcould soon make wind the largest source of new power supply at the national level.Continued expansion of wind power in the United States could be slowed by lack oftransmission capacity and expiration of the federal renewable production tax credit.On the other hand, federal policy on climate change, expected by many in the 111th
Congress, would likely put a value on carbon dioxide emissions and give wind poweradditional advantages compared to coal- and natural gas-based electricity. Congresswill need to carefully consider the interactive nature of energy and climate legislationwhen crafting future policy.

CRS-44
122 Converting a series of cash flows to a financially-equivalent uniform annual payment isa two-step process. First, the cash flows for the project are converted to a 2008 “presentvalue.” The present value is the total cost for the analysis period, adjusted (“discounted”using a “discount factor”) to account for the time value of money and the risk that projectedcosts will not occur as expected. This lump-sum 2008 present value is then converted to anequivalent annual payment using a uniform payments factor (the “capital recovery factor”).For a more detailed discussion of the levelization method see, for example, Chan Park,Fundamentals of Engineering Economics, 2004, Chapter 6; or Eugene Grant, et al.,Principles of Engineering Economy, 6th Ed., 1976, Chapter 7.123 For additional information on capital charge rates see Hoff Stauffer, “Beware CapitalCharge Rates,” The Electricity Journal, April 2006. The capital recovery factor isequivalent to the PMT function in the Excel spreadsheet program. For additionalinformation on the calculation of capital recovery factors see Chan Park, Fundamentals ofEngineering Economics, 2004, Chapter 2; or Eugene Grant, et al., Principles of EngineeringEconomy, 6th Ed., 1976, Chapter 4.
Appendix. Financial Analysis Methodology andAssumptions
The financial analysis of power plant costs in this report estimates the operatingcosts and required capital recovery of each generating technology for an analysisperiod through 2050. Plant operating costs will vary from year to year depending, forexample, on changes in fuel prices and the start or end of government incentiveprograms. To simplify the comparison of alternatives, these varying yearly expensesare converted to a uniform annual cost expressed as 2008 present value dollars.122
Similarly, the capital costs for the generating technologies are also converted tolevelized annual payments. An investor-owned utility or independent power projectdeveloper must recover the cost of the investment and a return on the investment,accounting for income taxes, tax law (depreciation rates), and the cost of money.These variables are encapsulated within an annualized capital cost for a projectcomputed using a “capital charge rate.” The financial model used for this studycomputes a project-specific capital charge rate that reflects, for example, the assumedcost of money and the applicable depreciation schedule.
In the case of publicly owned utilities the return on capital is a function of theinterest rate. A “capital recovery factor” reflecting each project’s cost of money iscomputed and used to calculate a mortgage-type levelized annual payment.123
Combining the annualized capital cost with the annualized cash flows yields thetotal estimated annualized cost of a project. This annualized cost is divided by theprojected yearly output of electricity to produce a cost per Mwh for each technology.By “annualizing” the costs in this manner it is possible to compare alternatives withdifferent year-to-year cost patterns on an apples-to-apples basis.
Inputs to the financial model include financing costs, forecasted fuel prices,non-fuel operations and maintenance expense, the efficiency with which fossil-fueledplants convert fuel to electricity, and typical utilization rates (see Tables A-1, A-2,and A-3, below). Most of these inputs are taken from published sources, such as the

CRS-45
124 See 10 CFR § 451.4.125 For a discussion of the credit see EIA, Annual Energy Outlook 2007, p. 21.
Energy Information Administration’s (EIA) assumptions used to produce its 2007and 2008 long-term energy forecasts. Overnight power plant capital costs — that is,the cost to construct a plant before financing expenses — are estimated by CRSbased on a review of public information on recent projects.
Government incentives are also an important part of the financial analysis.EPACT05 created or extended federal incentive programs for coal, nuclear, andrenewable technologies. This study assumes the following incentives:
! A renewable energy production tax credit of 2.0 cents per kWh, withthe value indexed to inflation. The credit applies to the first 10 yearsof a plant’s operation. The Base Case analysis assumes that the taxcredit, which is currently scheduled to expire at the end of 2008, willbe extended (as has happened in the past). The credit is availableonly to wind power production that is sold to an unaffiliated thirdparty. Under most circumstances this requirement effectively limitsthe production tax credit to independent power producers. A utilitythat owns a wind plant and uses the power to serve its own loadwould not qualify.124 The credit is currently available to new wind,geothermal, and several other renewable energy sources. New solarenergy systems do not qualify, and geothermal systems can take theproduction tax credit only if they do not use the renewableinvestment tax credit (discussed below).
! A nuclear energy production tax credit for new advanced nuclearplants of 1.8 cents per kWh. The credit applies to the first eightyears of operation. Unlike the renewable production tax creditdescribed above, the nuclear credit is not indexed to inflation andtherefore drops in real value over time. This credit is subject toseveral limitations:! It is available to plants that begin construction before January 1,
2014, and enter service before January 1, 2021.! For each project the annual credit is limited to $125 million per
thousand megawatts of generating capacity.! The full amount of the credit will be available to qualifying
facilities only if the total capacity of the qualifying facilities is6,000 megawatts or less. If the total qualifying capacity exceeds6,000 megawatts the amount of the credit available to each plantwill be prorated. For example, EIA assumes in its 2007 AnnualEnergy Outlook that 9,000 megawatts of new nuclear capacityqualifies; in this case the credit amount drops to 1.2 cents perkWh.125 The Base Case for this study follows EIA in using the 1.2cent per kWh assumption for the effective value of the credit.
! Loan guarantees for carbon-control technologies, including nuclearpower. Under final Department of Energy (DOE) rules the loan

CRS-46
126 DOE Announces Plans for Future Loan Guarantee Solicitations, Department of Energypress release, April 11, 2008. Loan guarantee authority of $18.5 billion for nuclear powerplants is provided by P.L. 110-161.127 Entities receiving loan guarantees must make a substantial equity contribution to theproject’s financing. Public power entities normally do not have the retained earnings neededto make such payments. The rules also preclude granting a loan guarantee if the federalguarantee would cause what would otherwise be tax exempt debt to become subject toincome taxes. Under current law this situation would arise if the federal government wereto guarantee public power debt. For further information on these and other aspects of theloan guarantee program see U.S. DOE, final rule, “Loan Guarantees for Projects thatEmploy Innovative Technologies,” 10 C.F.R. § 609 (RIN 1901-AB21), October 4, 2007[http://www.lgprogram.energy.gov/keydocs.html].128 For additional information see the discussion of the investment tax credit in the federalincentives section of the Database of State Incentives for Renewable Energy website,[http://www.dsireusa.org/].
guarantees can cover up to 80% of the cost of a project. Guaranteesare made available based on a case-by-case evaluation of applicantsand are dependent on congressional authority (in April 2008, theDepartment of Energy announced plans to solicit up to $18.5 billionin loan guarantee applications for nuclear projects126). Entitiesreceiving loan guarantees must make a “credit subsidy cost”payment to the federal treasury that reflects the net anticipated costof the guarantee to the government, including a probability ofdefault. The guarantees are, under current rules, unlikely to beavailable to public power entities.127
! Energy Investment Tax Credit. Tax credits under this program areavailable to certain renewable energy systems, including solar andgeothermal electricity generation, and some other innovative energytechnologies. Wind energy systems do not qualify. The credit is10% for systems installed after January 1, 2009. Geothermalprojects that take the investment tax credit cannot take the renewableproduction tax credit.128
The results of the analysis are shown in the main body of the report. Note thatthese estimates are approximations subject to a high degree of uncertainty over suchfactors as future fuel and capital costs. The rankings of the technologies by cost aretherefore also an approximation and should not be viewed as a definitive estimate ofthe relative cost-competitiveness of each option. Also note that site-specific factorswould influence an actual developer’s choice of generating technologies. Forexample, coal may be less costly if a plant is close to coal mines, and the economicsof wind depend in part on the strength and consistency of the wind in a given area.

CRS-47
Table A-1. Base Case Financial Factors
Item Value Sources and Notes
Representative Bond Interest Rates
Utility Aa 2010: 6.8% 2015: 7.0%2020: 7.0%
When available, interest rates forinvestment grade bonds with a rating ofBaa or higher (i.e., other than high yieldbonds) are Global Insight forecasts. When Global Insight does not forecastan interest rate for an investment gradebond the value is estimated based onhistorical relationships between bondinterest rates (the historical data for thisanalysis is from the Global Financewebsite). High yield interest rates areestimated based on the differentialbetween Merrill Lynch high yield bondindices and corporate Baa rates, asreported by WSJ.com (Wall StreetJournal website).
IPP High Yield 2010: 9.8% 2015: 10.0%2020: 10.0%
Public Power Aaa 2010: 5.1% 2015: 5.4%2020: 5.4%
Corporate Aaa 2010: 6.3% 2015: 6.5%2020: 6.5%
Cost of Equity — Utility 14.00% California Energy Commission,“Comparative Cost of California CentalStation Electricity GeneratingTechnologies,” December 2007, Table 8.
Cost of Equity — IPP 15.19%
Debt Percent of Capital Structure Utility: 50%IPP: 60%Utility or IPP withfederal loanguarantee: 80%POU: 100%
Northwest Power and ConservationCouncil, “The Fifth Northwest ElectricPower and Conservation Plan,” May2005, Table I-1.
Federal Loan Guarantees
Cost of equity premium for entitiesusing 80% financing.
1.75 percentagepoints
Congressional Budget Office, NuclearPower’s Role in Generating Electricity,May 2008, web supplement (“TheMethodology Behind the Levelized CostAnalysis”), Table A-5 and page 9.
Credit Subsidy Cost 12.5% of loan value
Long-Term Inflation Rate (changein the implicit price deflator)
1.9% Global Insight
Composite Federal/State IncomeTax Rate
38% EIA, National Energy Modeling SystemDocumentation, Electricity MarketModule, March 2006, p. 85.
Notes: EIA = Energy Information Administration; IOU = Investor Owned Utility; POU = Publicly Owned Utility; IPP= Independent Power Producer. For a summary of bond rating criteria see [http://www.bondsonline.com/Bond_Ratings_Definitions.php]. “High yield” refers to bonds with a rating below Baa.

CRS-48
Table A-2. Base Case Fuel and Allowance Price Forecasts
Delivered Fuel Prices, Constant 2008$ perMillion Btus
Air Emission AllowancePrice, 2008$ per Allowance
Coal Natural Gas Nuclear Fuel SulfurDioxide
NitrogenOxides
2010 $1.93 $7.51 $0.58 $249 $2,636
2020 $1.80 $6.41 $0.67 $1,074 $3,252
2030 $1.87 $7.48 $0.67 $479 $3,360
2040 $1.96 $9.17 $0.65 $158 $3,180
2050 $2.06 $11.24 $0.63 $52 $3,009
Sources: Forecasts are from the assumptions to the Energy Information Administration’s 2008 Annual Energy Outlook,which assumes implementation of current law and regulation. The original values in 2006 dollars were converted to 2008dollars using the Global Insight forecast of the change in the implicit price deflator. The EIA forecasts are to 2030; theforecasts are extended to 2050 using the 2025 to 2030 growth rates. The sulfur dioxide and nitrogen oxides allowanceforecasts are for the eastern region of the United States (allowance prices are expected to vary regionally under the CleanAir Interstate Rule).
Note: Btu = British thermal unit.

CRS-49
Table A-3. Power Plant Technology Assumptions
Energy Source Technology
OvernightConstruction Costfor Units Entering
Service in 2015,2008$ per kilowatt
Capacity(Megawatts)
Heat Rate for UnitsEntering Service in
2015 (Btus perkWh)
VariableO&M Cost,2008$ per
Mwh
Fixed O&M,2008$ perMegawatt
CapacityFactor
Wind Onshore $1,900 50 Not Applicable $0.00 $30,921 34%
Coal SupercriticalPulverized
Coal
$2,577 600 8,742 $4.46 $28,100 85%
Natural Gas CombinedCycle
$1,186 400 6,506 $1.95 $11,936 70%
Nuclear GenerationIII/III+
$3,682 1,350 10,400 $0.48 $69,279 90%
Sources: Heat rates, O&M costs, and nominal plant capacities are from the assumptions to EIA’s 2007 and 2008 Annual Energy Outlooks. Capital cost estimates are based on a CRSreview of public information on current projects. Capital costs and heat rates are adjusted based on the learning rates used by EIA in the Annual Energy Outlook. EIA costs are adjustedto 2008 dollars using Global Insight’s forecast of the implicit price deflator. Capacity factor for coal plants is from Massachusetts Institute of Technology, The Future of Coal, 2007,p. 128. Natural gas plants are assumed to operate as baseload units with a capacity factor of 70%. Capacity factor for wind from California Energy Commission, “Comparative Costsof California Central Station Electricity Generation Technologies,” December 2007, Appendix B, p. 67. Nuclear plant capacity factor reflects the recent industry average performanceas reported in EIA, Monthly Energy Review, Table 8.1.
Notes: kWh = kilowatt-hour; Mwh = megawatt-hour.