wind power myths debunked t - university of california
TRANSCRIPT

november/december 2009 IEEE power & energy magazine 89
Common Questions and Misconceptions
By Michael Milligan, Kevin Porter,Edgar DeMeo, Paul Denholm,
Hannele Holttinen, Brendan Kirby,Nicholas Miller, Andrew Mills,
Mark O’Malley, Matthew Schuerger,and Lennart Soder
Digital Object Identifi er 10.1109/MPE.2009.934268
1540-7977/09/$26.00©2009 IEEE
TTHE RAPID GROWTH OF WIND POWER IN THE UNITED STATES ANDworldwide has resulted in increasing media attention to—and public awareness of—wind-generation technology. Several misunderstandings and myths have arisen due to the char-acteristics of wind generation, particularly because wind-energy generation only occurs when the wind is blowing. Wind power is therefore not dispatchable like conventional energy sources and delivers a variable level of power depending on the wind speed. Wind is primarily an energy resource and not a capacity resource. Its primary value is to offset fuel consumption and the resulting emissions, including carbon. Only a relatively small fraction of wind energy is typically delivered during peak and high-risk time periods; therefore, wind generators have limited capacity value. This leads to concerns about the impacts of wind power on maintaining reliability and the balance between load and generation.
This article presents answers to commonly asked questions concerning wind power. It begins by addressing the variability of wind and then discusses whether wind has capacity credit. The article addresses whether wind can stop blowing everywhere at once, the uncertainty of predicting wind generation, whether it is expensive to integrate wind
© M
AS
TE
R S
ER
IES
Wind Power Myths
Debunked
Authorized licensed use limited to: Univ of Calif San Diego. Downloaded on December 12, 2009 at 00:42 from IEEE Xplore. Restrictions apply.

90 IEEE power & energy magazine november/december 2009
power, the need for new transmission, and whether wind generation requires backup generation or dedicated energy storage. Finally, we discuss whether there is suffi cient sys-tem fl exibility to incorporate wind generation, whether coal is better than wind because coal has greater capacity factors, and whether there is a limit to how much wind power can be incorporated into the grid.
Can Grid Operators Deal with the Continually Changing Output of Wind Generation? The power system—even before the development of wind-energy technologies—was designed to handle signifi cant variability in loads. Demand varies over timescales that range from seconds to years. System operational procedures are designed around this variability and, based on analysis and operational experience, much is known about how loads vary. Very short-term changes in load (seconds to minutes) are small relative to the system peak and consist primarily of many uncorrelated events that change demand in different directions. Over longer periods (several hours), changes in demand tend to be more correlated, such as during the morn-ing load pickup or evening load falloff.
The output of a wind power plant, or multiple wind power plants, is variable over time. Because the variability of wind is added to this already variable system, there will be some incre-mental variability that must be managed by the system operator. Each megawatt generated by wind reduces the required genera-tion of other units; therefore, the remaining nonwind generation units need only supply the load that is not supplied by wind. This remaining load is often called the net load (load net of
wind power). Therefore the non-wind portion of the power system is operated to the net load, which is the difference between load and wind. Figure 1 shows one week of the actual load and the net load in West Denmark. The difference between these traces is the wind generation. The load and wind can be compared more easily in Figure 2. From Figure 1 it is apparent that, at large penetration levels, wind can induce steeper ramps in both direc-tions and can require generators to operate at reduced output. At high penetration rates, it can be diffi cult to manage this incremental variabil-ity if existing generators do not have the required ramping capability.
Generally, the (relative) vari-ability of wind decreases as the gen-eration of more wind power plants is combined. Figure 3 is taken from the wind plant data-collection
4,000
3,500
3,000
2,500
2,000
1,500
1,000500
01 25 49 73 97 121 145
Hour
West Denmark 10–16 January 2005M
W
LoadNet Load
figure 1. West Denmark load and net load (load less wind), 10–16 January 2005 (source: Energinet.dk).
4,0003,5003,0002,5002,0001,5001,000
5000
1 25 49 73 97 121 145Hour
West Denmark 10–16 January 2005
MW
LoadWind
figure 2. West Denmark load and wind, 10–16 January 2005 (source: Energinet.dk).
1.6
1.4
1.2
1.0
0.8
0.6
1.6
Out
put N
orm
aliz
ed to
Mea
n
1.4
1.2
1.0
0.8
0.6
0 5 10 15Seconds
(a)
(b)
20 25 30 × 103
200 Turbines Stdev = 14.89, Stdev/Mean = 0.12615 Turbines Stdev = 1.21, Stdev/Mean = 0.184
figure 3. Comparison of second-to-second variability of wind production between (a) a wind plant with 200 wind turbines and (b) a wind plant with 15 wind turbines.
Authorized licensed use limited to: Univ of Calif San Diego. Downloaded on December 12, 2009 at 00:42 from IEEE Xplore. Restrictions apply.

november/december 2009 IEEE power & energy magazine 91
program of the National Renewable Energy Laboratory (NREL) and shows one-second data for approximately nine hours from a wind plant with several interconnection points. The data are from the same time period and are normalized to the mean output of each group of wind turbines. Figure 3(a) shows the normalized variability of 200 turbines. Figure 3(b) shows the considerable variability of a group of 15 turbines. From these data and the fi gure it can be concluded that the normalized wind variability is reduced with aggregation. This principle applies to small-scale and large-scale geographical aggregation and to all timescales of grid operation.
Grid operators in some countries are gaining experience with higher penetrations of wind and with the variability of wind power. Figure 4 shows the hourly wind penetration in Ireland from 7 May through 10 May 2009. Hourly wind penetration in Ireland ranges from a small percentage to as much as 40%. Similarly, Figure 1 (as noted) shows load and net load (load minus wind) in Denmark in January 2005. The fi gure shows that wind production increased and then decreased as wind turbines shut down because of high wind speeds. Higher wind production drove net load near zero in some hours. As is discussed later in this article, grid opera-tors handle wind variability using existing fl exible generation resources, wind forecasting, and subhourly scheduling; wind production is more predictable when evaluated closer to real time. Subhourly schedules also let grid operators access the fl exibility of other generating units. Additionally, large balancing areas (or utility control areas) help with wind variability, because wind variability is smoothed over larger geographic areas.
Does Wind Have Capacity Credit?The determination of whether there is suffi cient installed capac-ity to meet loads allows for the possibility that some generation will not be able to provide capac-ity when needed at some future date. Generally, although the exact amount and procedures differ, sys-tem planners require a 12–15% margin of extra capacity as com-pared to peak load. This is known as the planning reserve margin.
The term “planning reserve” refers to the installed capac-ity of the generation fl eet and is separate and distinct from various types of operating reserves that are based on system conditions during operations. A more rigorous approach to evaluating planning reserves is to model hourly loads, gen-eration capacity, and the forced outage rates of generators to determine the loss of load probability (LOLP) (i.e., the prob-ability that generation will be inadequate to serve load). The LOLP can be used to determine the loss of load expectation (LOLE) that defi nes how many hours per year, days per year, or days in ten years that load might not be served. A typical LOLE target is one day in ten years.
Wind can contribute to planning reserves based on its infl uence on system LOLE—the same way that conventional units contribute to planning reserves. In most cases, wind makes a modest contribution to planning reserves, as indi-cated by capacity credit in the United States that ranges from approximately 5% to 40% of wind rated capacity. The wide range of capacity credit percentages assigned to wind refl ects the differences in the timing of wind-energy delivery (when the wind blows) relative to system loads and periods of system risk. Once the capacity credit that may be assigned to a wind plant has been determined, it is the job of the system planner to determine the amount of additional capacity necessary to meet the system reliability criterion, regardless of the method used to procure the capacity.
Although wind is a variable resource, grid operators have experience with managing variability that comes from handling the variability of load.
45.0040.38%
00:00
01:0002
:0003
:0004
:0005
:0006
:0007
:0008
:0009
:0010
:00
Hour11
:0012
:0013
:0014
:0015
:0016
:0017
:0018
:0019
:0020
:0021
:0022
:0023
:00
40.00
Win
d P
ower
Pen
etra
tion
(%)
35.00
30.00
25.00
20.00
15.00
10.00
5.00
0.00
7 May 8 May9 May 10 May
figure 4. Hourly wind penetration in Ireland, 7–10 May 2009.
Authorized licensed use limited to: Univ of Calif San Diego. Downloaded on December 12, 2009 at 00:42 from IEEE Xplore. Restrictions apply.

92 IEEE power & energy magazine november/december 2009
How Often Does the Wind Stop Blowing Everywhere at the Same Time?Individual wind turbine production is highly variable and grid operators are concerned that 100,000 MW of wind could present a severe reliability challenge. As explained above, wind benefi ts inherently from aggregation; therefore 100,000 MW of wind power does not behave like a single wind turbine. Aggregating wind over larger geographic areas decreases the number of hours of zero output. One wind power plant can have zero output for more than 1,000 hours during a year, whereas the output of aggregated wind power in a very large area always—or nearly always—is greater than zero. The variability also decreases as the timescale decreases. The second and minute variability of large-scale wind power generally is small; over several hours, however, there can be great variability, even for dis-tributed wind power.
What about more signifi cant weather events that can increase wind speed and require wind turbines to shut down for safety reasons and to protect the wind project? These events are not frequent. In some areas they do not occur every year, and in other areas they happen one to two times per year. Large storm fronts take four to six hours to pass over several hundred kilometers so, again, aggregating wind over a geographically wide area helps overcome this challenge. For a single wind turbine, generation can decrease from full power to zero very rapidly. The aggregation of wind capac-ity, however, turns the sudden interruption of power into a multihour downward ramp. Texas experienced this type of wind event in February 2007. Figure 5 illustrates how the output from a single wind plant dropped by 170 MW over approximately 15 minutes. Over all wind projects, the aggre-gate wind capacity decrease was much greater, at 1,500 MW, but it took two hours to occur. In West Denmark, the most extreme storm event so far (January 2005) took six hours to shut down nearly 90% of the rated capacity (2,000 MW).
Big storms can typically be forecast before they become threats, and large wind power plants can be required to operate at partial loads to prevent sizable ramps in case the wind speeds exceed the cutoff speed of the turbines. Sys-tem operators can be notifi ed of the potential magnitude of these events and have an opportunity to put the system in a defensive position. Control systems can also be designed to prevent all turbines from shutting down during the same minute. Lastly, large wind events are not like large conven-tional generator contingencies in which 1,000 or 2,000 MW can be lost instantaneously. Signifi cant changes in wind out-put take hours rather than minutes, so there is time for con-ventional generators to ramp up. There is also time to start combustion turbines if not enough conventional generation is available.
Isn’t It Very Difficult to Predict Wind Power?Wind-energy forecasting can be used to predict wind-energy output in advance through a variety of methods based on numerical weather prediction models and statisti-cal approaches. Wind forecasting is a recently developed tool as compared with load forecasting, and the level of accuracy is not as great for wind forecasting as for load forecasting. The experience to date suggests that the over-all shape of wind production can be predicted most of the time, but signifi cant errors can occur in both the level and timing of wind production. Therefore, system operators will be interested in both the uncertainty around a par-ticular forecast and the overall accuracy of the forecasts in general. Wind forecasts for shorter time horizons tend to be more accurate than forecasts over longer time hori-zons. For a single wind power plant, forecasts that are one to two hours ahead can achieve an accuracy level of approximately 5–7% mean absolute error (MAE) relative to installed wind capacity; this increases to 20% for day-ahead forecasts.
250Individual Wind Plants Aggregate Wind Output
1,500 MW
2 h
~170 MW in~15 min
200
150
100
50
0
2,500
2,000
MW
MW
1,500
1,000
500
09:00 9:30 10:00 10:30 11:00
24 February 200711:30 12:00 9:00 9:30 10:00 10:30 11:00
24 February 200711:30 12:00
figure 5. Aggregation benefits large, rare events.
Authorized licensed use limited to: Univ of Calif San Diego. Downloaded on December 12, 2009 at 00:42 from IEEE Xplore. Restrictions apply.
november/december 2009 IEEE power & energy magazine 93
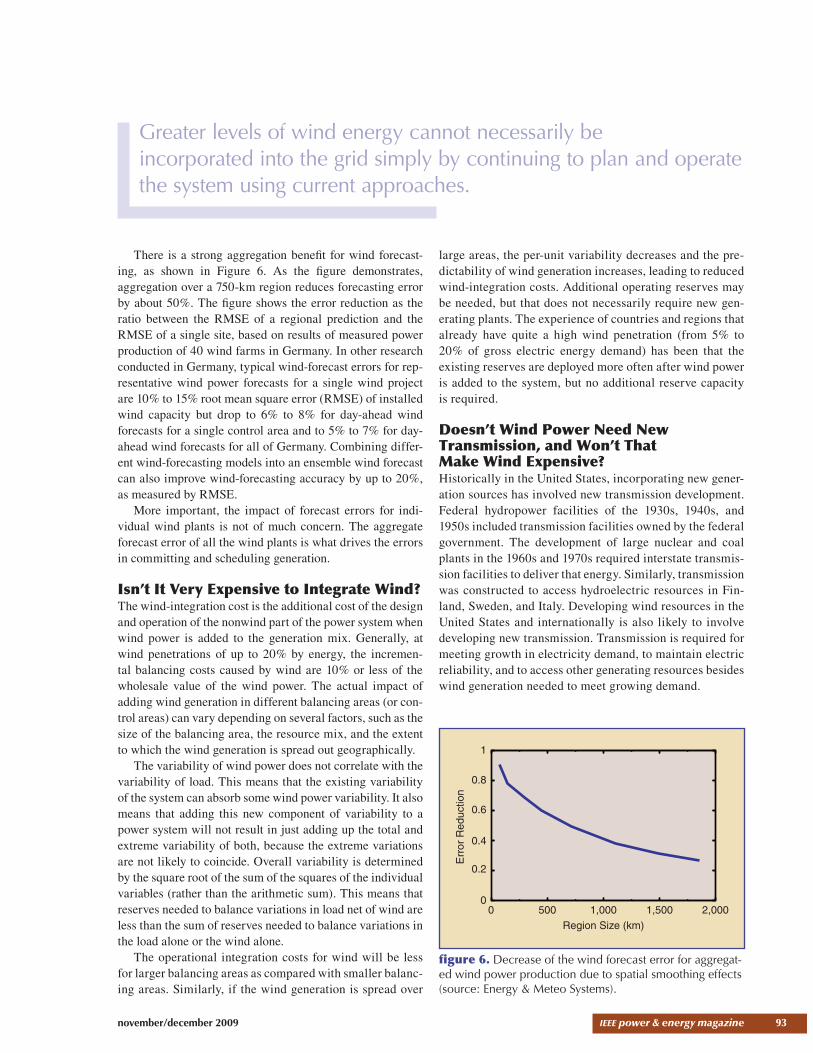
There is a strong aggregation benefi t for wind forecast-ing, as shown in Figure 6. As the fi gure demonstrates, aggregation over a 750-km region reduces forecasting error by about 50%. The fi gure shows the error reduction as the ratio between the RMSE of a regional prediction and the RMSE of a single site, based on results of measured power production of 40 wind farms in Germany. In other research conducted in Germany, typical wind-forecast errors for rep-resentative wind power forecasts for a single wind project are 10% to 15% root mean square error (RMSE) of installed wind capacity but drop to 6% to 8% for day-ahead wind forecasts for a single control area and to 5% to 7% for day-ahead wind forecasts for all of Germany. Combining differ-ent wind-forecasting models into an ensemble wind forecast can also improve wind-forecasting accuracy by up to 20%, as measured by RMSE.
More important, the impact of forecast errors for indi-vidual wind plants is not of much concern. The aggregate forecast error of all the wind plants is what drives the errors in committing and scheduling generation.
Isn’t It Very Expensive to Integrate Wind?The wind-integration cost is the additional cost of the design and operation of the nonwind part of the power system when wind power is added to the generation mix. Generally, at wind penetrations of up to 20% by energy, the incremen-tal balancing costs caused by wind are 10% or less of the wholesale value of the wind power. The actual impact of adding wind generation in different balancing areas (or con-trol areas) can vary depending on several factors, such as the size of the balancing area, the resource mix, and the extent to which the wind generation is spread out geographically.
The variability of wind power does not correlate with the variability of load. This means that the existing variability of the system can absorb some wind power variability. It also means that adding this new component of variability to a power system will not result in just adding up the total and extreme variability of both, because the extreme variations are not likely to coincide. Overall variability is determined by the square root of the sum of the squares of the individual variables (rather than the arithmetic sum). This means that reserves needed to balance variations in load net of wind are less than the sum of reserves needed to balance variations in the load alone or the wind alone.
The operational integration costs for wind will be less for larger balancing areas as compared with smaller balanc-ing areas. Similarly, if the wind generation is spread over
large areas, the per-unit variability decreases and the pre-dictability of wind generation increases, leading to reduced wind-integration costs. Additional operating reserves may be needed, but that does not necessarily require new gen-erating plants. The experience of countries and regions that already have quite a high wind penetration (from 5% to 20% of gross electric energy demand) has been that the existing reserves are deployed more often after wind power is added to the system, but no additional reserve capacity is required.
Doesn’t Wind Power Need New Transmission, and Won’t That Make Wind Expensive?Historically in the United States, incorporating new gener-ation sources has involved new transmission development. Federal hydropower facilities of the 1930s, 1940s, and 1950s included transmission facilities owned by the federal government. The development of large nuclear and coal plants in the 1960s and 1970s required interstate transmis-sion facilities to deliver that energy. Similarly, transmission was constructed to access hydroelectric resources in Fin-land, Sweden, and Italy. Developing wind resources in the United States and internationally is also likely to involve developing new transmission. Transmission is required for meeting growth in electricity demand, to maintain electric reliability, and to access other generating resources besides wind generation needed to meet growing demand.
1
0.8
0.6
0.4
0.2
00 500 1,000 1,500 2,000
Region Size (km)
Err
or R
educ
tion
figure 6. Decrease of the wind forecast error for aggregat-ed wind power production due to spatial smoothing effects (source: Energy & Meteo Systems).
Greater levels of wind energy cannot necessarily be incorporated into the grid simply by continuing to plan and operate the system using current approaches.
Authorized licensed use limited to: Univ of Calif San Diego. Downloaded on December 12, 2009 at 00:42 from IEEE Xplore. Restrictions apply.

94 IEEE power & energy magazine november/december 2009
Several studies have found that, although the costs of building transmission to access wind resources are signifi -cant, consumers benefi t from reduced energy-production costs as a result of wind generation displacing other energy resources. The Joint Coordinated System Plan (JCSP), a conceptual transmission and generation plan for the East-ern Interconnection in the United States, indicates that a 20% wind scenario by 2024 would result in a benefi t-to-cost ratio of 1.7 to 1. Additionally, transmission expenditures as a percentage of the overall costs of electricity to consumers are dwarfed by the costs of electricity production (e.g., fuel, operation, and maintenance) and the capital costs needed to develop the generation. For the JCSP study, incremental transmission costs comprise 2% of the projected total whole-sale energy costs for 2024.
Doesn’t Wind Power Need Backup Generation? Isn’t More Fossil Fuel Burned with Wind Than Without, Due to Backup Requirements?In a power system, it is necessary to maintain a continuous balance between production and consumption. System oper-ators deploy controllable generation to follow the change in total demand, not the variation from a single generator or customer load. When wind is added to the system, the vari-ability in the net load becomes the operating target for the system operator. It is not necessary and, indeed, it would be quite costly for grid operators to follow the variation in generation from a single generating plant or customer load. “Backup” generating plants dedicated to wind plants—or to any other generation plant or load for that matter—are not required, and would actually be a poor and unnecessarily costly use of power-generation resources.
Regarding whether the addition of wind generation results in more combustion of fossil fuels, a wind-generated kilowatthour displaces a kilowatthour that would have been generated by another source—usually one that burns a fos-sil fuel. The wind-generated kilowatthour therefore avoids the fuel consumption and emissions associated with that fossil-fuel kilowatthour. The incremental reserves (spinning or nonspinning) required by wind’s variability and uncer-tainty, however, themselves consume fuel and release emis-sions, so the net savings are somewhat reduced. But what quantity of reserves is required? Numerous studies conducted to date—many of which have been summarized in previ-ous wind-specifi c special issues of IEEE Power & Energy Magazine—have found that the reserves required by wind
are only a small fraction of the aggregate wind generation and vary with the level of wind output. Generally, some of these reserves are spinning and some are nonspinning. The regulating and load-following plants could be forced to oper-ate at a reduced level of effi ciency, resulting in increased fuel consumption and increased emissions per unit of output.
A conservative example serves to illustrate the fuel-consumption and emissions impacts stemming from wind’s regulation requirements. Compare three situations: 1) a block of energy is provided by fossil-fueled plants; 2) the same block of energy is provided by wind plants that require no incremental reserves; and 3) the same block of energy is provided by wind plants that do have incremental reserve requirements. It is assumed that the average fl eet fossil-fuel effi ciency is unchanged between situations one and two. This might not be precisely correct, but a sophisticated operational simulation is required to address this issue quantitatively. In fact, this has been done in several studies, which bear out the general conclusions reached in this simple example.
In situation one, an amount of fuel is burned to produce the block of energy. In situation two, all of that fuel is saved and all of the associated emissions are avoided. In situation three, it is assumed that 3% of the fossil generation is needed to provide reserves, all of these reserves are spinning, and that this generation incurs a 25% effi ciency penalty. The corresponding fuel consumption necessary to provide the needed reserves is then 4% of the fuel required to generate the entire block of energy. Hence, the actual fuel and emis-sions savings percentage in situation three relative to situ-ation one is 96% rather than 100%. The great majority of initially estimated fuel savings does in fact occur, however, and the notion that wind’s variations would actually increase system fuel consumption does not withstand scrutiny.
A study conducted by the United Kingdom Energy Research Center (UKERC) supports this example. UKERC reviewed four studies that directly addressed whether there are greater CO2 emissions from adding wind generation due to increasing operating reserves and operating fossil-fuel plants at a reduced effi ciency level. The UKERC determined that the “effi ciency penalty” was negligible to 7% for wind penetrations of up to 20%.
Does Wind Need Storage?The fact that “the wind doesn’t always blow” is often used to suggest the need for dedicated energy storage to handle fl uc-tuations in the generation of wind power. Such viewpoints, however, ignore the realities of both grid operation and the
Several studies have found that consumers benefit from reduced energy-production costs as a result of wind generation displacing other energy resources.
Authorized licensed use limited to: Univ of Calif San Diego. Downloaded on December 12, 2009 at 00:42 from IEEE Xplore. Restrictions apply.
november/december 2009 IEEE power & energy magazine 95
performance of a large, spatially diverse wind-generation resource. Historically, all other variation (for example, that due to system loads, generation-commitment and dis-patch changes, and network topol-ogy changes) has been handled systemically. This is because the diversity of need leads to much lower costs when variability is aggregated before being balanced. Storage is almost never “coupled” with any single energy source—it is most economic when operated to maximize the economic benefi t to an entire system. Storage is nearly always benefi cial to the grid, but this benefi t must be weighed against its cost. With more than 26 GW of wind power currently operating in the United States and more than 65 GW of wind energy operating in Europe (as of the date of this writing), no additional storage has been added to the systems to balance wind. Storage has value in a system without wind, which is the reason why about 20 GW of pumped hydro storage was built in the United States and 100 GW was built worldwide, decades before wind and solar energy were considered as viable electricity generation tech-nologies. Additional wind could increase the value of energy storage in the grid as a whole, but storage would continue to provide its services to the grid—storing energy from a mix of sources and responding to variations in the net demand, not just wind.
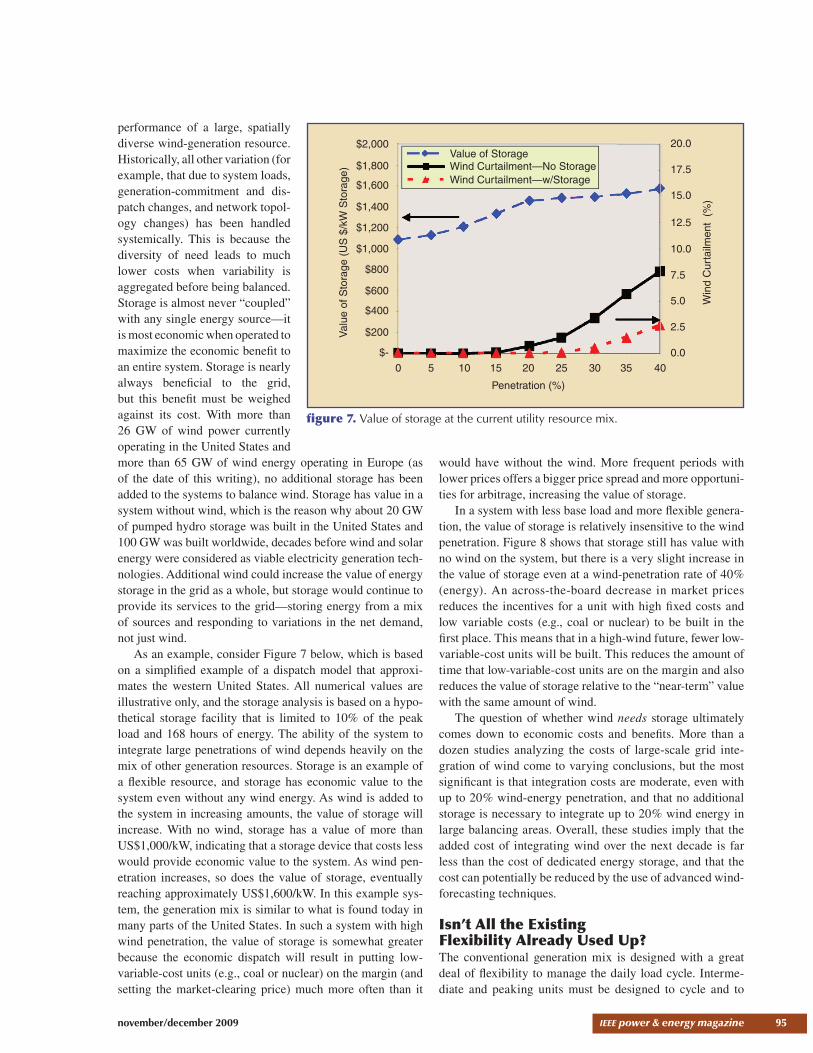
As an example, consider Figure 7 below, which is based on a simplifi ed example of a dispatch model that approxi-mates the western United States. All numerical values are illustrative only, and the storage analysis is based on a hypo-thetical storage facility that is limited to 10% of the peak load and 168 hours of energy. The ability of the system to integrate large penetrations of wind depends heavily on the mix of other generation resources. Storage is an example of a fl exible resource, and storage has economic value to the system even without any wind energy. As wind is added to the system in increasing amounts, the value of storage will increase. With no wind, storage has a value of more than US$1,000/kW, indicating that a storage device that costs less would provide economic value to the system. As wind pen-etration increases, so does the value of storage, eventually reaching approximately US$1,600/kW. In this example sys-tem, the generation mix is similar to what is found today in many parts of the United States. In such a system with high wind penetration, the value of storage is somewhat greater because the economic dispatch will result in putting low-variable-cost units (e.g., coal or nuclear) on the margin (and setting the market-clearing price) much more often than it
would have without the wind. More frequent periods with lower prices offers a bigger price spread and more opportuni-ties for arbitrage, increasing the value of storage.
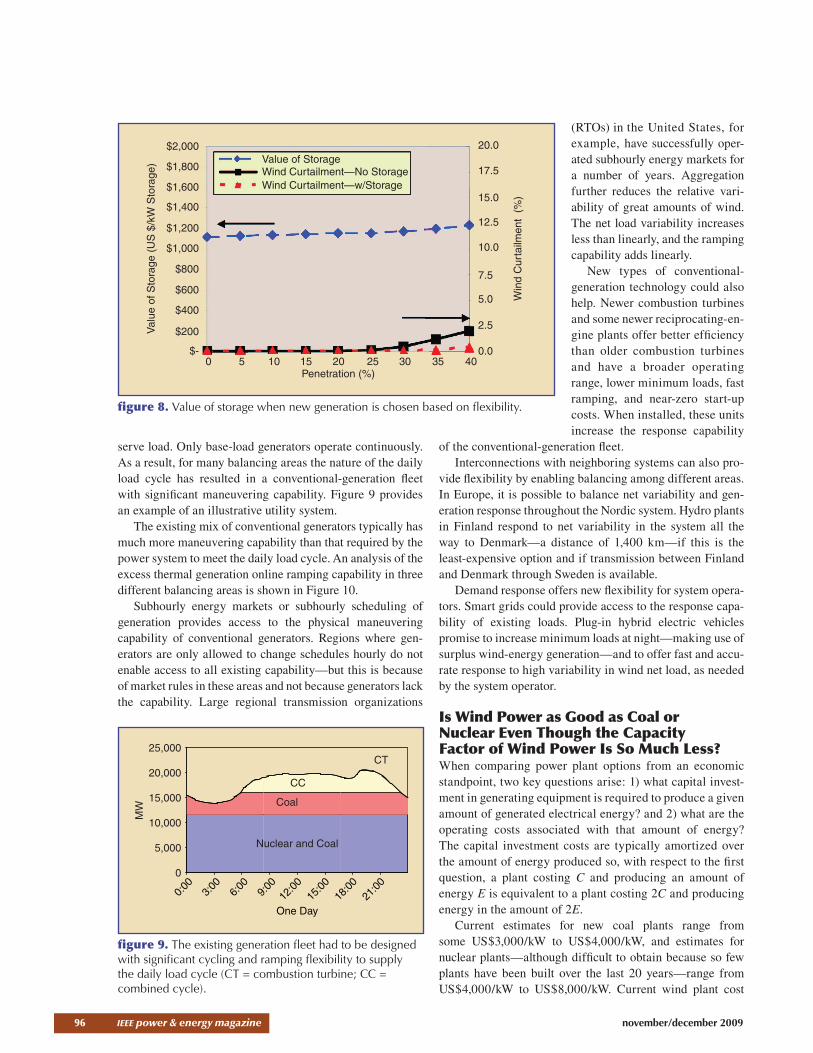
In a system with less base load and more fl exible genera-tion, the value of storage is relatively insensitive to the wind penetration. Figure 8 shows that storage still has value with no wind on the system, but there is a very slight increase in the value of storage even at a wind-penetration rate of 40% (energy). An across-the-board decrease in market prices reduces the incentives for a unit with high fi xed costs and low variable costs (e.g., coal or nuclear) to be built in the fi rst place. This means that in a high-wind future, fewer low-variable-cost units will be built. This reduces the amount of time that low-variable-cost units are on the margin and also reduces the value of storage relative to the “near-term” value with the same amount of wind.
The question of whether wind needs storage ultimately comes down to economic costs and benefi ts. More than a dozen studies analyzing the costs of large-scale grid inte-gration of wind come to varying conclusions, but the most signifi cant is that integration costs are moderate, even with up to 20% wind-energy penetration, and that no additional storage is necessary to integrate up to 20% wind energy in large balancing areas. Overall, these studies imply that the added cost of integrating wind over the next decade is far less than the cost of dedicated energy storage, and that the cost can potentially be reduced by the use of advanced wind-forecasting techniques.
Isn’t All the Existing Flexibility Already Used Up?The conventional generation mix is designed with a great deal of fl exibility to manage the daily load cycle. Interme-diate and peaking units must be designed to cycle and to
$2,000
$1,800
$1,600
$1,400
$1,200
$1,000
$800
$600
$400
$200Valu
e of
Sto
rage
(U
S $
/kW
Sto
rage
)$-
0 5 10 15 20
Penetration (%)
25 30 35 400.0
2.5
5.0
7.5
Win
d C
urta
ilmen
t (%
)
10.0
12.5
15.0
17.5
20.0Value of StorageWind Curtailment—No StorageWind Curtailment—w/Storage
figure 7. Value of storage at the current utility resource mix.
Authorized licensed use limited to: Univ of Calif San Diego. Downloaded on December 12, 2009 at 00:42 from IEEE Xplore. Restrictions apply.
96 IEEE power & energy magazine november/december 2009
serve load. Only base-load generators operate continuously. As a result, for many balancing areas the nature of the daily load cycle has resulted in a conventional-generation fl eet with signifi cant maneuvering capability. Figure 9 provides an example of an illustrative utility system.
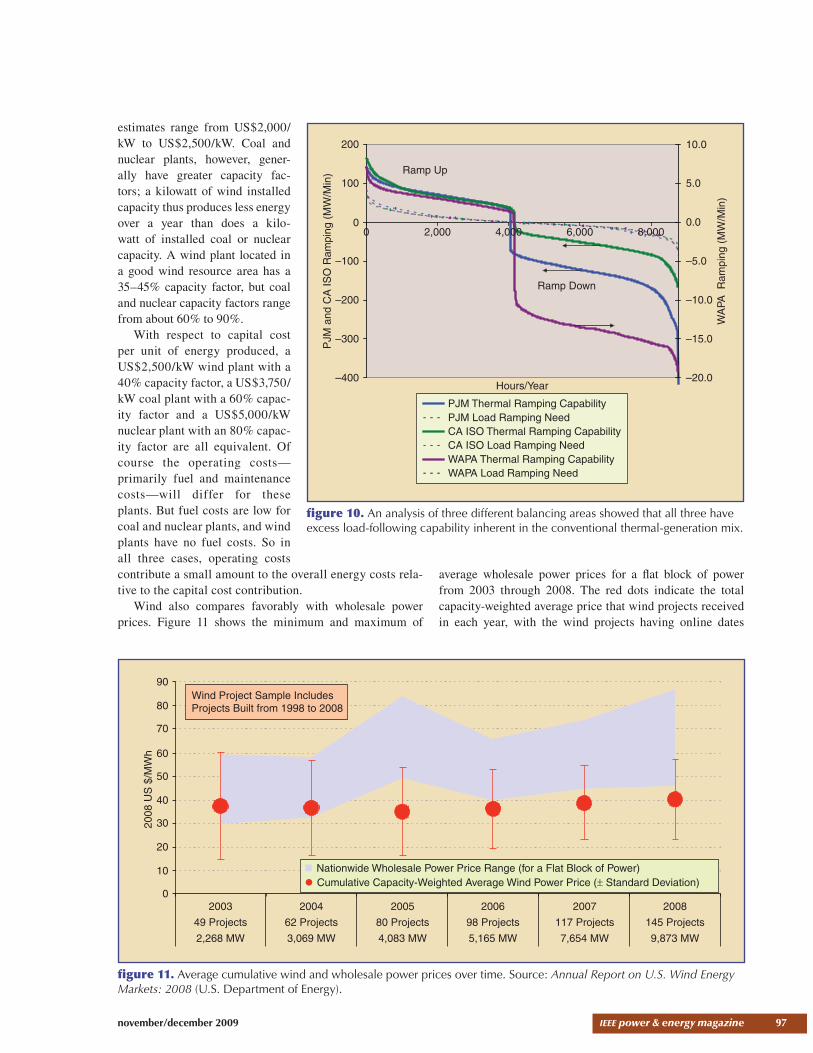
The existing mix of conventional generators typically has much more maneuvering capability than that required by the power system to meet the daily load cycle. An analysis of the excess thermal generation online ramping capability in three different balancing areas is shown in Figure 10.
Subhourly energy markets or subhourly scheduling of generation provides access to the physical maneuvering capability of conventional generators. Regions where gen-erators are only allowed to change schedules hourly do not enable access to all existing capability—but this is because of market rules in these areas and not because generators lack the capability. Large regional transmission organizations
(RTOs) in the United States, for example, have successfully oper-ated subhourly energy markets for a number of years. Aggregation further reduces the relative vari-ability of great amounts of wind. The net load variability increases less than linearly, and the ramping capability adds linearly.
New types of conventional-generation technology could also help. Newer combustion turbines and some newer reciprocating-en-gine plants offer better effi ciency than older combustion turbines and have a broader operating range, lower minimum loads, fast ramping, and near-zero start-up costs. When installed, these units increase the response capability
of the conventional-generation fl eet.Interconnections with neighboring systems can also pro-
vide fl exibility by enabling balancing among different areas. In Europe, it is possible to balance net variability and gen-eration response throughout the Nordic system. Hydro plants in Finland respond to net variability in the system all the way to Denmark—a distance of 1,400 km—if this is the least-expensive option and if transmission between Finland and Denmark through Sweden is available.
Demand response offers new fl exibility for system opera-tors. Smart grids could provide access to the response capa-bility of existing loads. Plug-in hybrid electric vehicles promise to increase minimum loads at night—making use of surplus wind-energy generation—and to offer fast and accu-rate response to high variability in wind net load, as needed by the system operator.
Is Wind Power as Good as Coal or Nuclear Even Though the Capacity Factor of Wind Power Is So Much Less?When comparing power plant options from an economic standpoint, two key questions arise: 1) what capital invest-ment in generating equipment is required to produce a given amount of generated electrical energy? and 2) what are the operating costs associated with that amount of energy? The capital investment costs are typically amortized over the amount of energy produced so, with respect to the fi rst question, a plant costing C and producing an amount of energy E is equivalent to a plant costing 2C and producing energy in the amount of 2E.
Current estimates for new coal plants range from some US$3,000/kW to US$4,000/kW, and estimates for nuclear plants—although diffi cult to obtain because so few plants have been built over the last 20 years—range from US$4,000/kW to US$8,000/kW. Current wind plant cost
$2,000
$1,800
$1,600
$1,400
$1,200
$1,000
$800
$600
$400
$200Valu
e of
Sto
rage
(U
S $
/kW
Sto
rage
)
$-0 5 10 15 20
Penetration (%)25 30 35 40
0.0
2.5
5.0
7.5
Win
d C
urta
ilmen
t (%
)
10.0
12.5
15.0
17.5
20.0Value of StorageWind Curtailment—No StorageWind Curtailment—w/Storage
Value of StorageWind Curtailment—No StorageWind Curtailment—w/Storage
figure 8. Value of storage when new generation is chosen based on flexibility.
0
5,000
10,000
15,000
20,000
25,000
0:00
3:00
6:00
9:00
12:00
15:00
18:00
21:00
One Day
MW
Nuclear and Coal
Coal
CC
CT
figure 9. The existing generation fleet had to be designed with significant cycling and ramping flexibility to supply the daily load cycle (CT = combustion turbine; CC = combined cycle).
Authorized licensed use limited to: Univ of Calif San Diego. Downloaded on December 12, 2009 at 00:42 from IEEE Xplore. Restrictions apply.
november/december 2009 IEEE power & energy magazine 97
estimates range from US$2,000/kW to US$2,500/kW. Coal and nuclear plants, however, gener-ally have greater capacity fac-tors; a kilowatt of wind installed capacity thus produces less energy over a year than does a kilo-watt of installed coal or nuclear capacity. A wind plant located in a good wind resource area has a 35–45% capacity factor, but coal and nuclear capacity factors range from about 60% to 90%.
With respect to capital cost per unit of energy produced, a US$2,500/kW wind plant with a 40% capacity factor, a US$3,750/kW coal plant with a 60% capac-ity factor and a US$5,000/kW nuclear plant with an 80% capac-ity factor are all equivalent. Of course the operating costs—primarily fuel and maintenance costs—will differ for these plants. But fuel costs are low for coal and nuclear plants, and wind plants have no fuel costs. So in all three cases, operating costs contribute a small amount to the overall energy costs rela-tive to the capital cost contribution.
Wind also compares favorably with wholesale power prices. Figure 11 shows the minimum and maximum of
average wholesale power prices for a fl at block of power from 2003 through 2008. The red dots indicate the total capacity-weighted average price that wind projects received in each year, with the wind projects having online dates
figure 10. An analysis of three different balancing areas showed that all three have excess load-following capability inherent in the conventional thermal-generation mix.
–400
–300
–200
–100
0
100
200
0 2,000 4,000 6,000 8,000
Hours/Year
PJM
and
CA
ISO
Ram
ping
(M
W/M
in)
–20.0
–15.0
–10.0
–5.0
0.0
5.0
10.0
WA
PA R
ampi
ng (
MW
/Min
)
PJM Thermal Ramping CapabilityPJM Load Ramping NeedCA ISO Thermal Ramping CapabilityCA ISO Load Ramping NeedWAPA Thermal Ramping CapabilityWAPA Load Ramping Need
Ramp Up
Ramp Down
figure 11. Average cumulative wind and wholesale power prices over time. Source: Annual Report on U.S. Wind Energy Markets: 2008 (U.S. Department of Energy).
0
10
20
30
40
50
60
70
80
90
200349 Projects2,268 MW
200462 Projects3,069 MW
200580 Projects4,083 MW
200698 Projects5,165 MW
2007117 Projects7,654 MW
2008145 Projects9,873 MW
2008
US
$/M
Wh
Wind Project Sample IncludesProjects Built from 1998 to 2008
Nationwide Wholesale Power Price Range (for a Flat Block of Power)Cumulative Capacity-Weighted Average Wind Power Price (± Standard Deviation)
Authorized licensed use limited to: Univ of Calif San Diego. Downloaded on December 12, 2009 at 00:42 from IEEE Xplore. Restrictions apply.

98 IEEE power & energy magazine november/december 2009
from 1998 through 2008. On a cumulative basis within the sample of projects in the fi gure, average wind power prices have been at or below the low end of the wholesale power price range.
Plant capacity factors also refl ect the functions that different power technologies perform. Generators have different capacity factors, depending on whether they are used as base-load, cycling, or peaking units. For example, nuclear and coal generators are primarily base-load units that have high capacity factors. Wind and hydro generate energy that is basically free; wind is taken when avail-able and hydro is scheduled to deliver the maximum value to the grid (when possible). Technologies having lower capacity factors (combined cycle, combustion turbines, oil- and gas-fi red steam boilers) operate as peaking and load-following plants and as capacity resources. The capacity factors of individual plants may be affected by environmental requirements, such as a limitation on the number of hours a peaking fossil-fuel unit may operate because of air quality regulations. In addition, market fac-tors may also reduce plant capacity factors. For example, high natural gas prices may reduce the operation of natural gas plants. Overall, many resources operate at less-than-rated capacity but play an important part in ensuring sys-tem reliability. This situation is illustrated by a snapshot
of one year of operating data from the MISO market, as shown in Figure 12.
Isn’t There a Limit to How Much Wind Can Be Accommodated by the Grid?Although wind is a variable resource, operating experience and detailed wind-integration studies have yet to fi nd a cred-ible and fi rm technical limit to the amount of wind energy that can be accommodated by electrical grids. Some countries already receive a signifi cant amount of electricity from wind power. Denmark receives about 20% of its electricity from wind power (43% of peak load), and Germany has reached the level of 7% wind-energy penetration (30% of peak load). Spain and Portugal have each reached wind-energy penetra-tion levels of 11% (30% of peak load), with a limited inter-connection to the rest of Europe. Ireland has an island system with 9% wind-energy penetration (11% of peak load). There is not a technical limit to increased penetration of wind energy, but there might be an economic limit—a point at which it is deemed too expensive to accommodate more energy from wind in comparison with the value that it adds to the system. Years of worldwide experience in operating power systems with signifi cant amounts of wind energy and detailed integra-tion studies have shown that the increase in costs to accom-modate wind can be modest, and that the value of additional
wind energy does not decline as precipitously as once expected. More directly, it has been shown that large interconnected power grids can accommodate variable generation (wind and solar) at lev-els of 25% of peak load. Studies examining even greater levels of wind penetration are under way for both the Eastern and Western inter-connections in the United States.
Greater levels of wind energy, however, cannot necessarily be incorporated into the grid simply by continuing to plan and operate the system using current approaches. Reaching these increased levels of wind penetration requires invest-ments in infrastructure such as new transmission, potential changes to market rules, and incentives or requirements to generation owners
figure 12. Midwest ISO plant capacity factor by fuel type (June 2005–May 2006). Adapted from U.S. Department of Energy report 20% Wind by 2030, July 2008.
0
Nuclea
r
Coal-S
team Tu
rbine
(≥ 30
0 MW
)
Coal-S
team Tu
rbine
(< 30
0 MW
)
Other S
team Tu
rbine
Wind
Hydro
Combin
ed C
ycle
Gas-S
team Tu
rbine
Oil-Stea
m Turb
ine
Oil-Com
busti
on Tu
rbine
Gas-C
ombu
stion
Turb
ine
10
20
30
40
50
60
70
80
Ann
ual C
apac
ity F
acto
r
Wind forecasts for shorter time horizons tend to be more accurate than forecasts over longer time horizons.
Authorized licensed use limited to: Univ of Calif San Diego. Downloaded on December 12, 2009 at 00:42 from IEEE Xplore. Restrictions apply.
november/december 2009 IEEE power & energy magazine 99
and transmission operators to better utilize technology and existing assets. Utility planners and those investing in new plants must consider fl exibility in procurement decisions to meet load growth or to replace retiring generators. More fl ex-ibility includes reduced minimum generation levels, greater ramp rates, quicker start times, and designs that allow fre-quent cycling without increasing material fatigue or reduc-ing component lifetimes. Markets and tariffs also need to be designed to reward increased fl exibility.
Wind plants can offer increased fl exibility through the provision of ancillary services. In some cases, the least-cost dispatch decision might be to curtail the output of a wind plant by limiting its ramp rate, back the wind plant down from its maximum potential production level for a short period, or have the wind plant provide active power regulation. As wind technology matures, wind plants could move toward provi-sion of reactive power, voltage control, and power frequency/governor droop (the decrease in frequency to which a gover-nor responds by causing a generator to go from no load to full load) functions.
SummaryThe natural variability of wind power makes it different from other generating technologies, which can give rise to questions about how wind power can be integrated into the grid successfully. This article aims to answer sev-eral important questions that can be raised with regard to wind power. Although wind is a variable resource, grid operators have experience with managing variability that comes from handling the variability of load. As a result, in many instances the power system is equipped to handle variability. Wind power is not expensive to integrate, nor does it require dedicated backup generation or storage. Developments in tools such as wind forecasting also aid in integrating wind power. Integrating wind can be aided by enlarging balancing areas and moving to subhourly sched-uling, which enable grid operators to access a deeper stack of generating resources and take advantage of the smooth-ing of wind output due to geographic diversity. Continued improvements in new conventional-generation technolo-gies and the emergence of demand response, smart grids, and new technologies such as plug-in hybrids will also help with wind integration.
For Further ReadingEuropean Wind Energy Association (EWEA). (2005). Large scale integration of wind energy in the European power sup-ply: Analysis, issues, and recommendations. European Wind Energy Association [Online]. Available: http://www.ewea.org/fileadmin/ewea_documents/documents/publications/grid/051215_Grid_report.pdf
B. Fox, L. Bryans, D. Flynn, N. Jenkins, D. Millborrow, M. O’Malley, R. Watson, and O. Anaya-Lara, Wind Power Integration: Connection and System Operational Aspects
(IET Power and Energy Series) London: The Institution of Engineering and Technology, 2007.
R. Gross, P. Heptonstall, D. Anderson, T. Green, M. Leach, and J. Skea. (2006). The Costs and Impacts of Inter-mittency. London, United Kingdom Energy Research Cen-ter [Online]. Available: http://www.ukerc.ac.uk/content/view/258/852
International Energy Association, Task 25. (2007). De-sign and operation of power systems with large amounts of wind power [Online]. Available: http://www.uwig.org/IEA_Annex25-State_of_the_Art_Report.pdf
M. Milligan and K. Porter. (2008). Determining the ca-pacity value of wind: An updated survey of methods and implementation. presented at Windpower 2008, Hous-ton, TX [Online]. Available: http://www.nrel.gov/docs/fy08osti/43433.pdf
L. Söder and M. Amelin, “A review of different method-ologies used for calculation of wind power capacity credit,” presented at the IEEE Power and Energy Society General Meeting—Conversion and Delivery of Electrical Energy in the 21st Century, July 20–24, 2008.
R. Wiser and M. Bolinger, “2008 wind technologies mar-ket report,” U.S. Dept. Energy, July 2009 [Online]. Available: http://eetd.lbl.gov/EA/EMP/reports/2008-wind-technolo-gies.pdf
Utility Wind Integration Group Web site. Wind integra-tion library [Online]. Available: http://www.uwig.org/opim-pactsdocs.html
BiographiesMichael Milligan is a principal analyst with NREL, in Golden, Colorado.
Kevin Porter is a senior analyst with Exeter Associates Inc., in Columbia, Maryland.
Edgar DeMeo is president of Renewable Energy Con-sulting Services, in Palo Alto, California.
Paul Denholm is a senior energy analyst with NREL, in Golden, Colorado.
Hannele Holttinen is a senior research scientist with VTT Technical Research Centre of Finland.
Brendan Kirby is a consultant for NREL, in Golden, Colorado.
Nicholas Miller is a director at General Electric, in Schenectady, New York.
Andrew Mills is a senior research associate with Law-rence Berkeley National Laboratory, in Berkeley, California.
Mark O’Malley is a professor, School of Electrical, Elec-tronic and Mechanical Engineering of University College Dublin, in Ireland.
Matthew Schuerger is a principal consultant with Energy Systems Consulting Services LLC, in St. Paul, Minnesota.
Lennart Soder is a professor of electric power systems at the Royal Institute of Technology, in Stockholm, Sweden. p&e
Authorized licensed use limited to: Univ of Calif San Diego. Downloaded on December 12, 2009 at 00:42 from IEEE Xplore. Restrictions apply.