wind power r&d seminar - deep sea offshore wind - sintef
TRANSCRIPT


2
12X650 TR A6920
TABLE OF CONTENTS Page
1 PROGRAMME .......................................................................................................................4
2 LIST OF PARTICIPANTS .....................................................................................................6 PRESENTASJONER Opening session – offshore wind opportunities
Norwegian hydro as the European energy battery – potential and challenges, Thomas Trötscher, SINTEF…………11
Development of offshore wind farms, Bjørn Drangsholt, Statkraft…………………………………………………... 14
HyWind experiences and potential for large-scale deployment, Sjur Bratland, Statoil……………………………….17
The need for a Norwegian test and demonstration programme on offshore wind, John Olav Giæver Tande, ……….20 SINTEF / NOWITECH New turbine technology
A quantitative comparison of three floating wind turbines, Jason Jonkman, NREL …………………………. 24
Long blades for offshore turbines, Jørg Høyland, PhD student NTNU…………………………………………….. 28
VAWT for offshore – pros and cons, Dr Olimpo Anaya-Lara and Prof Bill Leithead, University of Strathclyde… 33
HyWind modelling and validation, Bjørn Skaare, Statoil………………………………………………………….. 37
Floating wind turbine. Wave induced loads, Ivar Fylling, MARINTEK…………………………………………… 41
New generator technology
Direct-drive generator and converter system, Prof Robert Nilssen, NTNU………………………………………... 45
New gearbox technology, Lars Raunholt, Angle Wind AS………………………………………………………… 50
Potential top-mass reduction by hydraulic transmission, Prof Ole G Dahlhaug, NTNU…………………………... 52
Power system integration
Prospects for new cross-border connectors, Kjartan Hauglum, Statnett…………………………………………… 56
Optimal design of a North-Sea offshore grid, Thomas Trötscher, SINTEF……………………………………….. 58
Power market analysis of large-scale offshore wind, Magnus Korpås, SINTEF………………………………….. 60
Power fluctuations from offshore wind farms, Prof Poul Sørensen, Risø DTU…………………………………… 63
Cost of balancing large-scale wind generation, Prof Lennart Söder, KTH ………………………………………. 66
Grid connection
From power markets to voltages and currents, Prof Kjetil Uhlen, NTNU………………………………………… 71
Sub-stations for offshore wind farms, Steve Aughton, Siemens T&D Limited…………………………………… 76
New converter topologies for offshore wind farms, Prof Marta Molinas, NTNU………………………………… 79
Power quality measurements from wind farms, Trond Toftevaag and Tarjei Solvang, SINTEF………………… 83
3
12X650 TR A6920
Poster session – PhD students…………………………………………………………………………………… 86
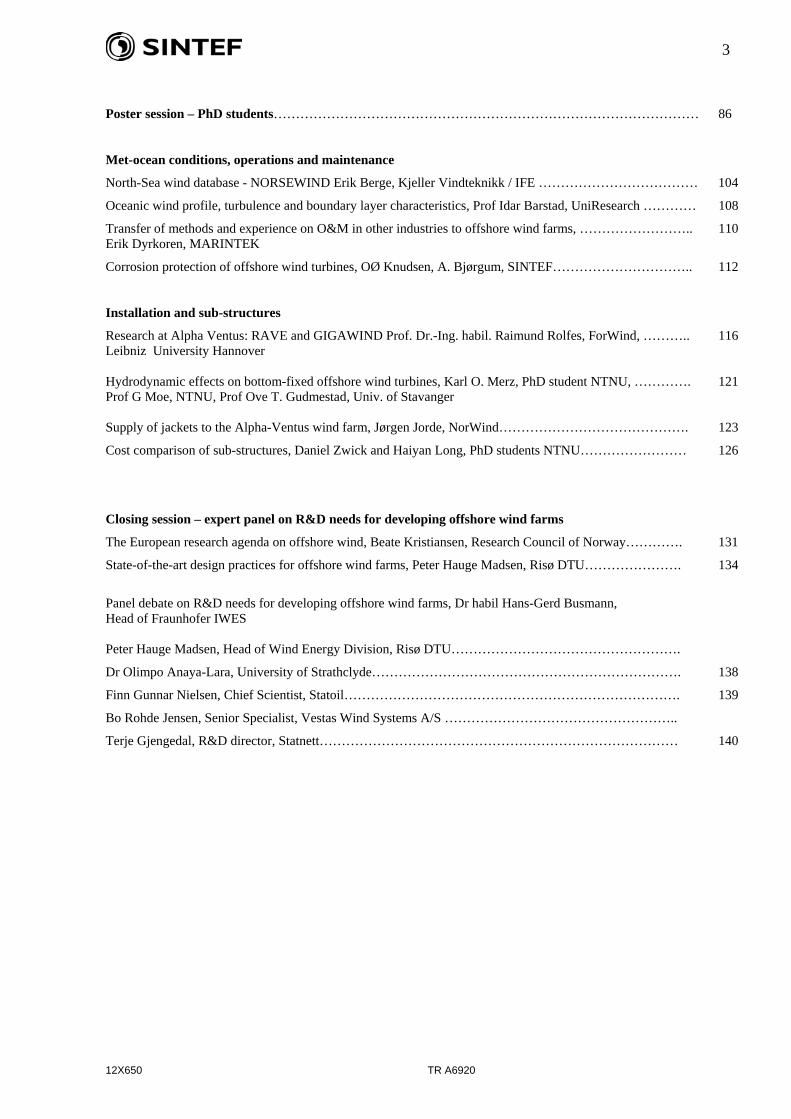
Met-ocean conditions, operations and maintenance
North-Sea wind database - NORSEWIND Erik Berge, Kjeller Vindteknikk / IFE ……………………………… 104
Oceanic wind profile, turbulence and boundary layer characteristics, Prof Idar Barstad, UniResearch ………… 108
Transfer of methods and experience on O&M in other industries to offshore wind farms, …………………….. 110 Erik Dyrkoren, MARINTEK
Corrosion protection of offshore wind turbines, OØ Knudsen, A. Bjørgum, SINTEF………………………….. 112
Installation and sub-structures
Research at Alpha Ventus: RAVE and GIGAWIND Prof. Dr.-Ing. habil. Raimund Rolfes, ForWind, ……….. 116 Leibniz University Hannover Hydrodynamic effects on bottom-fixed offshore wind turbines, Karl O. Merz, PhD student NTNU, …………. 121 Prof G Moe, NTNU, Prof Ove T. Gudmestad, Univ. of Stavanger Supply of jackets to the Alpha-Ventus wind farm, Jørgen Jorde, NorWind……………………………………. 123
Cost comparison of sub-structures, Daniel Zwick and Haiyan Long, PhD students NTNU…………………… 126
Closing session – expert panel on R&D needs for developing offshore wind farms
The European research agenda on offshore wind, Beate Kristiansen, Research Council of Norway…………. 131
State-of-the-art design practices for offshore wind farms, Peter Hauge Madsen, Risø DTU…………………. 134
Panel debate on R&D needs for developing offshore wind farms, Dr habil Hans-Gerd Busmann, Head of Fraunhofer IWES Peter Hauge Madsen, Head of Wind Energy Division, Risø DTU…………………………………………….
Dr Olimpo Anaya-Lara, University of Strathclyde……………………………………………………………. 138
Finn Gunnar Nielsen, Chief Scientist, Statoil…………………………………………………………………. 139
Bo Rohde Jensen, Senior Specialist, Vestas Wind Systems A/S ……………………………………………..
Terje Gjengedal, R&D director, Statnett……………………………………………………………………… 140

Wind Power R&D seminar – deep sea offshore wind 21-22 January 2010, Royal Garden Hotel, Kjøpmannsgata 73, Trondheim, NORWAY
Thursday 21 January 09.00 Registration & coffee Opening session – offshore wind opportunities
Chairs: John Olav Tande, SINTEF/NOWITECH and Kristin Guldbrandsen Frøysa, CMR/NORCOWE 09.30 Opening and welcome by chair 09.40 Offshore wind – a golden opportunity for Norwegian industry
Åslaug Haga, Federation of Norwegian Industries 10.10 Norwegian hydro as the European energy battery – potential and challenges
Thomas Trötscher, SINTEF 10.30 Development of offshore wind farms
Bjørn Drangsholt, Statkraft 11.00 HyWind experiences and potential for large-scale deployment
Sjur Bratland, Statoil 11.30 The need for a Norwegian test and demonstration programme on offshore wind
John Olav Giæver Tande, SINTEF / NOWITECH 11.50 Summary and discussions by chair 12.00 Lunch Parallel sessions A1) New turbine technology
Chairs: A Strand, CMR, BW Tveiten, SINTEF B1) Power system integration Chairs: Prof Tore Undeland, Prof K Uhlen, NTNU
13.00 Introduction by Chair Introduction by Chair 13.10 A quantitative comparison of three floating
wind turbines, Jason Jonkman, NREL Prospects for new cross-border connectors Kjartan Hauglum, Statnett
13.30 Long blades for offshore turbines Jørg Høyland, PhD student NTNU
Optimal design of a North-Sea offshore grid Thomas Trötscher, SINTEF
13.50 VAWT for offshore – pros and cons Dr Olimpo Anaya-Lara and Prof Bill Leithead, University of Strathclyde
Power market analysis of large-scale offshore wind Magnus Korpås, SINTEF
14.10 HyWind modelling and validation Bjørn Skaare, Statoil
Power fluctuations from offshore wind farms Prof Poul Sørensen, Risø DTU
14.30 Floating wind turbine. Wave induced loads. Ivar Fylling, MARINTEK
Cost of balancing large-scale wind generation Prof Lennart Söder, KTH
15.00 Refreshments A2) New generator technology
Chairs: A Strand, CMR, BW Tveiten, SINTEF B2) Grid connection Chairs: Prof Tore Undeland, Prof K Uhlen, NTNU
15.30 Introduction by Chair Introduction by Chair 15.35 Light-weight gear and generator technology
Bo Rohde Jensen, Senior Specialist, Vestas Wind Systems A/S
From power markets to voltages and currents Prof Kjetil Uhlen, NTNU
15.55 Direct-drive generator and converter system Prof Robert Nilssen, NTNU
Sub-stations for offshore wind farms Steve Aughton, Siemens T&D Limited
16.15 New gearbox technology Lars Raunholt, Angle Wind AS
New converter topologies for offshore wind farms Prof Marta Molinas, NTNU
16.35 Potential top-mass reduction by hydraulic transmission, Prof Ole G Dahlhaug, NTNU
Power quality measurements from wind farms Trond Toftevaag and Tarjei Solvang, SINTEF
16.55 Closing by Chair Closing by Chair 17.00 Poster Session with refreshments and presentation of PhD students on offshore wind
19.00 Dinner
4
Final programme
Wind Power R&D seminar – deep sea offshore wind 21-22 January 2010, Royal Garden Hotel, Kjøpmannsgata 73, Trondheim, NORWAY
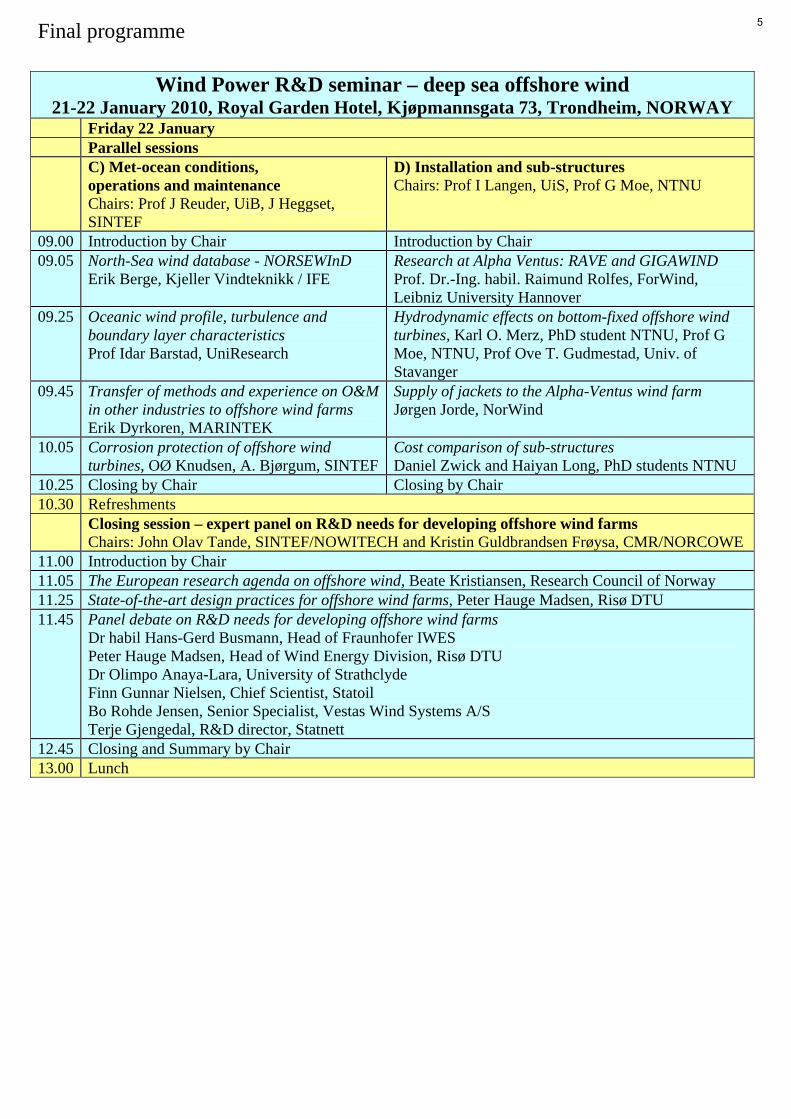
Friday 22 January Parallel sessions C) Met-ocean conditions,
operations and maintenance Chairs: Prof J Reuder, UiB, J Heggset, SINTEF
D) Installation and sub-structures Chairs: Prof I Langen, UiS, Prof G Moe, NTNU
09.00 Introduction by Chair Introduction by Chair 09.05 North-Sea wind database - NORSEWInD
Erik Berge, Kjeller Vindteknikk / IFE Research at Alpha Ventus: RAVE and GIGAWIND Prof. Dr.-Ing. habil. Raimund Rolfes, ForWind, Leibniz University Hannover
09.25 Oceanic wind profile, turbulence and boundary layer characteristics Prof Idar Barstad, UniResearch
Hydrodynamic effects on bottom-fixed offshore wind turbines, Karl O. Merz, PhD student NTNU, Prof G Moe, NTNU, Prof Ove T. Gudmestad, Univ. of Stavanger
09.45 Transfer of methods and experience on O&M in other industries to offshore wind farms Erik Dyrkoren, MARINTEK
Supply of jackets to the Alpha-Ventus wind farm Jørgen Jorde, NorWind
10.05 Corrosion protection of offshore wind turbines, OØ Knudsen, A. Bjørgum, SINTEF
Cost comparison of sub-structures Daniel Zwick and Haiyan Long, PhD students NTNU
10.25 Closing by Chair Closing by Chair 10.30 Refreshments Closing session – expert panel on R&D needs for developing offshore wind farms
Chairs: John Olav Tande, SINTEF/NOWITECH and Kristin Guldbrandsen Frøysa, CMR/NORCOWE 11.00 Introduction by Chair 11.05 The European research agenda on offshore wind, Beate Kristiansen, Research Council of Norway 11.25 State-of-the-art design practices for offshore wind farms, Peter Hauge Madsen, Risø DTU 11.45 Panel debate on R&D needs for developing offshore wind farms
Dr habil Hans-Gerd Busmann, Head of Fraunhofer IWES Peter Hauge Madsen, Head of Wind Energy Division, Risø DTU Dr Olimpo Anaya-Lara, University of Strathclyde Finn Gunnar Nielsen, Chief Scientist, Statoil Bo Rohde Jensen, Senior Specialist, Vestas Wind Systems A/S Terje Gjengedal, R&D director, Statnett
12.45 Closing and Summary by Chair 13.00 Lunch
5

List of participants Offshore Wind R&D Seminar, 21. – 22. January 2010
Name
Company
Aakervik, Anne-Lise Mediekompaniet I Ilsvika
Abrahamsen, Odd Henning Lyse Produksjon AS
Adaramola, Muyiwa NTNU
Aigner, Tobias NTNU (student)
Åkervik, Espen Kjeller Vindteknikk
Almås, Geir A. Teekay Shipping Norway Anders Arvesen NTNU (student)
Andersson, Janne Grete Endal Segel AS
Anthonippillai Antonarulrajah NTNU
Armendáriz, José Azcona CENER
Aughton, Steve Siemens T&D Limited
Barstad, Idar UNI – Bjerknes Centre for Climate Research
Berg, Bjørn Rolls-Royce Marine as, Foundry Bergen
Berg, Jon Trygve Sarsia Seed Management AS
Berge, Erik Kjeller Vindteknikk
Bergseth, Roger Segel AS
Berland, Jostein Vest Kran Wind Power
Berthelsen, Petter Andreas MARINTEK
Bjørgum, Astrid SINTEF Materials and Chemistry
Bjørlo, Alfred Måløy Vekst
Bøen, Endre Teekay Shipping
Bracchi, Tania NTNU
Bratland, Sjur Statoil
Bredmose, Henrik DTU Mechanical Engineering
Brovold, Heidi DNV
Bull-Berg, Heidi SINTEF Teknologi og Samfunn
Busmann, Hans-Gerd Fraunhofer IWES
Byrkjedal, Øyvind Kjeller Vindteknikk
Christophersen, Espen Borgir Enova SF
Dahl, Bergny Innovasjon Norge
Dahlhaug, Ole Gunnar NTNU Dong, Wenbin NTNU (student)
Drangsholt, Bjørn Statkraft
Dyrkoren, Erik MARINTEK
Echarri, Xabier Munduate CENER
Eek, Jarle SINTEF Energi AS
Eliassen, Lene University of Stavanger
Ertsgaard, Aage Det Norske Veritas
Fallan, Arild Enova SF
Finden, Per IFE
Flo, Randi Aardal SINTEF Energi AS
Frøyd, Lars NTNU (student)
Frøysa, Kristin Gulbrandsen NORCOWE / CMR Fuglseth, Thomas NTNU (student)
Fylling, Ivar MARINTEK Garces, Alejandro NTNU (student)
Gjengedal, Terje Statnett
Gjerde, Sverre NTNU (student)
Gjertdsen, Tor Lutelandet Offshore AS
Goldberg, Mats GE Energy Wind
6
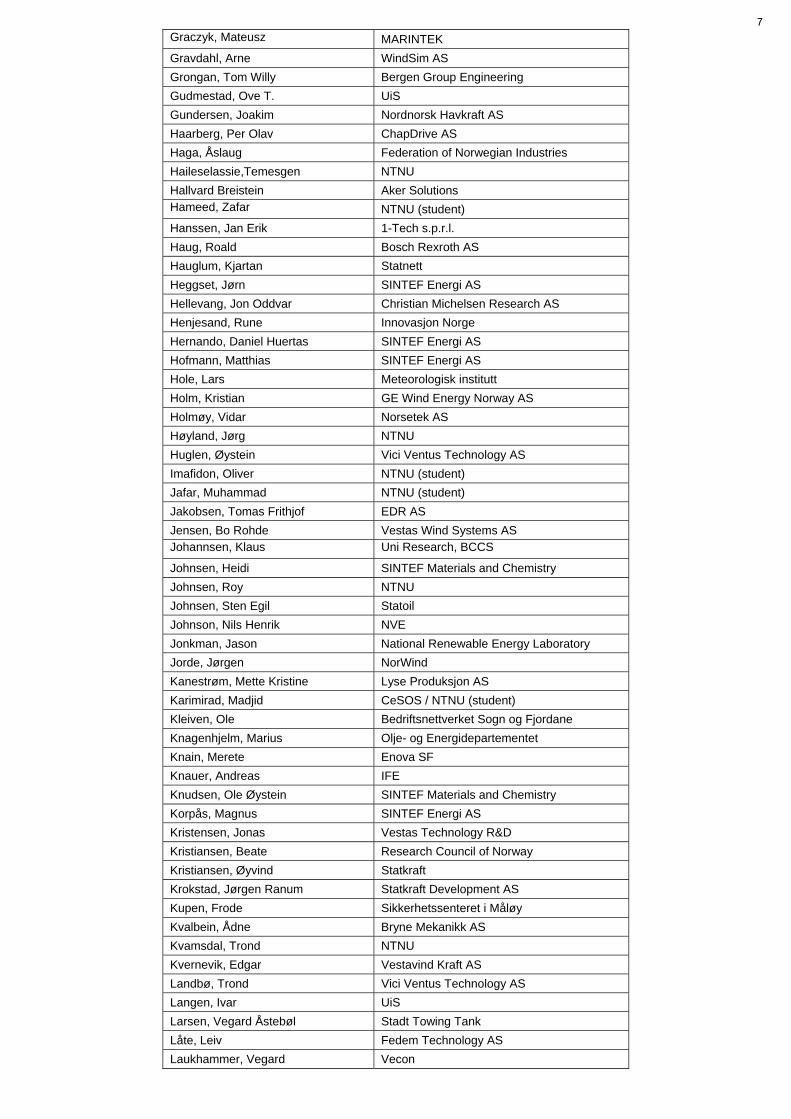
Graczyk, Mateusz MARINTEK
Gravdahl, Arne WindSim AS
Grongan, Tom Willy Bergen Group Engineering
Gudmestad, Ove T. UiS
Gundersen, Joakim Nordnorsk Havkraft AS
Haarberg, Per Olav ChapDrive AS
Haga, Åslaug Federation of Norwegian Industries
Haileselassie,Temesgen NTNU
Hallvard Breistein Aker Solutions Hameed, Zafar NTNU (student)
Hanssen, Jan Erik 1-Tech s.p.r.l.
Haug, Roald Bosch Rexroth AS
Hauglum, Kjartan Statnett
Heggset, Jørn SINTEF Energi AS
Hellevang, Jon Oddvar Christian Michelsen Research AS
Henjesand, Rune Innovasjon Norge
Hernando, Daniel Huertas SINTEF Energi AS
Hofmann, Matthias SINTEF Energi AS
Hole, Lars Meteorologisk institutt
Holm, Kristian GE Wind Energy Norway AS
Holmøy, Vidar Norsetek AS
Høyland, Jørg NTNU
Huglen, Øystein Vici Ventus Technology AS
Imafidon, Oliver NTNU (student)
Jafar, Muhammad NTNU (student)
Jakobsen, Tomas Frithjof EDR AS
Jensen, Bo Rohde Vestas Wind Systems AS Johannsen, Klaus Uni Research, BCCS
Johnsen, Heidi SINTEF Materials and Chemistry
Johnsen, Roy NTNU
Johnsen, Sten Egil Statoil
Johnson, Nils Henrik NVE
Jonkman, Jason National Renewable Energy Laboratory
Jorde, Jørgen NorWind
Kanestrøm, Mette Kristine Lyse Produksjon AS
Karimirad, Madjid CeSOS / NTNU (student)
Kleiven, Ole Bedriftsnettverket Sogn og Fjordane
Knagenhjelm, Marius Olje- og Energidepartementet
Knain, Merete Enova SF
Knauer, Andreas IFE
Knudsen, Ole Øystein SINTEF Materials and Chemistry
Korpås, Magnus SINTEF Energi AS
Kristensen, Jonas Vestas Technology R&D
Kristiansen, Beate Research Council of Norway
Kristiansen, Øyvind Statkraft
Krokstad, Jørgen Ranum Statkraft Development AS
Kupen, Frode Sikkerhetssenteret i Måløy
Kvalbein, Ådne Bryne Mekanikk AS
Kvamsdal, Trond NTNU
Kvernevik, Edgar Vestavind Kraft AS
Landbø, Trond Vici Ventus Technology AS
Langen, Ivar UiS
Larsen, Vegard Åstebøl Stadt Towing Tank
Låte, Leiv Fedem Technology AS
Laukhammer, Vegard Vecon
7

Lijuan Dai NTNU (student)
Liland, Tommy Andre Depro AS
Long, Haiyan NTNU
Lundteigen, Tor Einar Sogn og Fjordane Fylkeskommune
Madsen, Petter Hauge Risø DTU
Malvik, Inger Marie Fugro OCEANOR
Mathisen, Jan-Petter Fugro OCEANOR
Maurstad, Kristin Måløy Vekst
Melhus, Bjørn Aker Solutions
Merz, Karl O. NTNU
Mikkelsen, Hans Jørgen FORCE Technology Norway AS
Mindeberg, Sigrun Kavli NVE
Moan, Torgeir NTNU /CeSOS
Moe, Geir NTNU
Molinas, Molinas NTNU
Muskulus, Michael NTNU
Myhr, Anders University of Life Sciences (UMB)
Myrvang, Helge UiS
Nakken, Torgeir Statoil
Naustdal, Ainor Fristad Lutelandet Utvikling AS
Nedrebø, Øyvind DNV
Niedzwecki, John Texas A&M University
Nielsen, Finn Gunnar Statoil
Nilssen, Robert NTNU
Nonås, Lars Magne MARINTEK
Nordborg, Styrk Sway AS
Nygaard, Tor Anders IFE
Nysveen, Arne NTNU
Olimpo Anaya-Lara University of Strathclyde
Omholt, Siri NTNU (student)
Onarheim, Jan NTNU
Ottesen, Stein-Arne Lutelandet Utvikling AS
Øyen, Rune Depro AS
Peddie, David Christian Michelsen Research AS
Pedersen, Morten Dinhoff NTNU (student)
Pellet, Laure EDF R&D
Pettersson, Hans Teknova
Pleym, Anngjerd SINTEF Energi AS
Pramayon, Pierre EDF R&D
Quesnel, Louis Fraunhofer IWES
Radan, Damir IRIS - International Research Institute of St
Rådberg, Carolin GE Wind Energy
Raunholt, Lars Angle Wind AS
Reiso, Marit NTNU (student)
Reuder, Joachim University of Bergen
Ringheim, Nils Arild SINTEF Energi AS
Rolfes, Raimund Leibniz Universität Hannover
Røset, Einar Siemens AS
Rui, Øyvind Statnett
Sætern, Arnt Inge TrønderEnergi Kraft AS
Sætrevik, Torleif Statkraft Development
Sandquist, Fredrik NTNU (student)
Sandvik, Håkon Vestavind Kraft AS
Sarkar, Arunjyoti University of Stavanger
Schmid, Bernd SINTEF Materials and Chemistry
8
Skaare, Bjørn Statoil
Skånøy, Thomas Siemens AS
Skare, Eirik SmartMotor AS
Skipenes, Anders Sparebanken Sogn og Fjordane
Skjølsvik, Kjell Olav Enova SF
Söder, Lennart KTH Soloot, Amir Hayati NTNU (student)
Solvang, Tarjei SINTEF Energi AS
Sørensen, Poul Risoe DTU
Sørheim, Hans-Roar Christian Michelsen Research AS
Steen, Hans Chr. TrønderEnergi Invest AS
Stenbro, Roy IFE
Stickler, Morten Statkraft
Støa, Petter SINTEF Energi AS
Strand, A. CMR
Stranden, Øystein Fedem Technology AS
Straume, Harald Bergen Group Rosenberg AS
Sung-Woo Im RIST
Svendgård, Ole VIVA Testsenter
Svendsen, Harald SINTEF Energi AS
Svendsen, Trine SWECO
Tande, John Olav SINTEF Energi AS / NOWITECH
Tande, Jørgen NTNU (student)
Tasar, Gursu NTNU (student)
Thomassen, Paul NTNU
Thomsen, Knud Erik ChapDrive AS
Toftevaag, Trond SINTEF Energi AS Torres Olguin, Raymundo NTNU (student)
Tørset, John Hägglunds Drives AS
Trötscher, Thomas SINTEF Energi AS
Tveiten, Bård Wathne SINTEF Materials and Chemistry
Uhlen, Kjetil NTNU
Undeland, Tore NTNU
Undem, Linn Silje Norwegian Water Resources and Energy Di t t
Utne, Ingrid Bouwer NTNU Valibeigloo, Mahmoud NTNU (student)
van Buren, Eric NTNU (student)
van Wingerde, Arno Fraunhofer IWES
Vrana, Til Kristian NTNU (student)
Weider, Pia Lyse Produksjon AS
Welde, Håkon TrønderEnergi Invest AS
Wik, Fredrik WindSim AS
Wold, Erik NTNU Technology Transfer as
Zhen Gao NTNU / CeSOS
Zwick, Daniel NTNU
9
Opening session – offshore wind opportunities
Offshore wind – a golden opportunity for Norwegian industry (no presentation available), Åslaug Haga, Federation of Norwegian Industries Norwegian hydro as the European energy battery – potential and challenges, Thomas Trötscher, SINTEF Development of offshore wind farms, Bjørn Drangsholt, Statkraft HyWind experiences and potential for large-scale deployment, Sjur Bratland, Statoil The need for a Norwegian test and demonstration programme on offshore wind John Olav Giæver Tande, SINTEF / NOWITECH
10
1
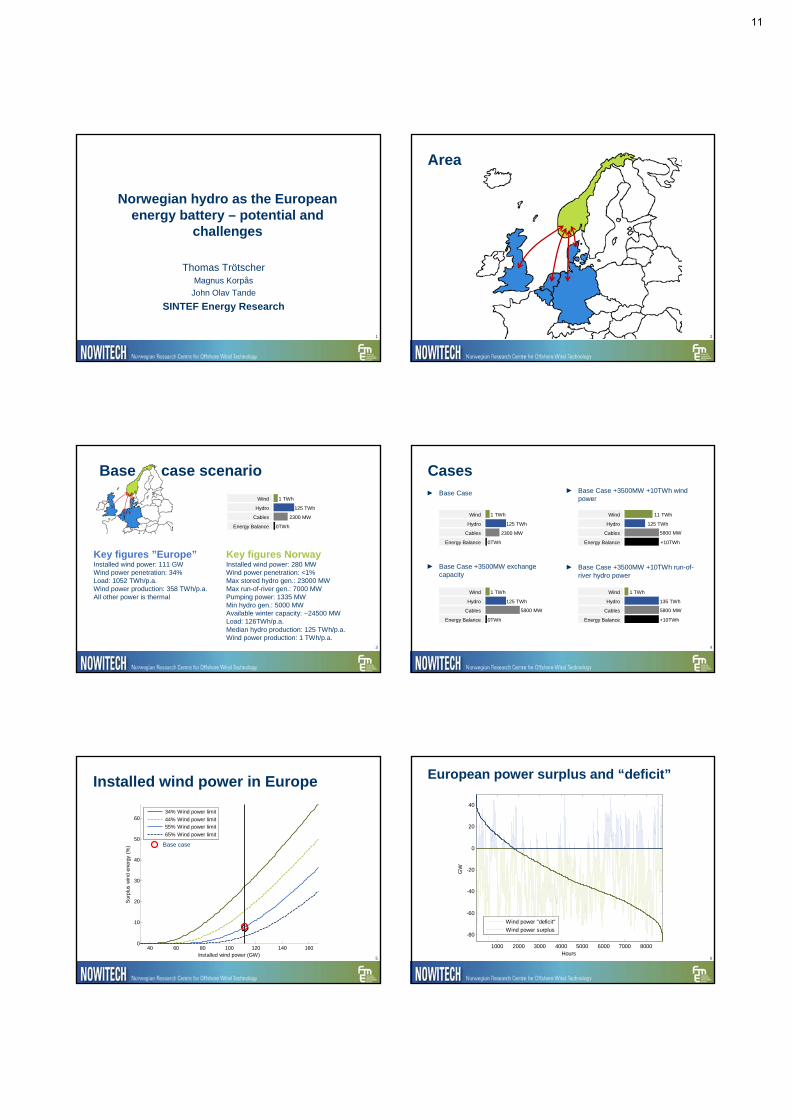
Norwegian hydro as the European energy battery – potential and
challenges
Thomas TrötscherMagnus Korpås
John Olav Tande
SINTEF Energy Research
2
Area
3
Base case scenario
Key figures ”Europe”Installed wind power: 111 GWWind power penetration: 34%Load: 1052 TWh/p.a.Wind power production: 358 TWh/p.a.All other power is thermal
Key figures NorwayInstalled wind power: 280 MWWind power penetration: <1%Max stored hydro gen.: 23000 MWMax run-of-river gen.: 7000 MWPumping power: 1335 MWMin hydro gen.: 5000 MWAvailable winter capacity: ~24500 MWLoad: 126TWh/p.a.Median hydro production: 125 TWh/p.a.Wind power production: 1 TWh/p.a.
Wind
Hydro
Cables
Energy Balance
1 TWh
125 TWh
2300 MW
0TWh
► Base Case +3500MW +10TWh wind power
► Base Case +3500MW +10TWh run-of-river hydro power
Cases► Base Case
► Base Case +3500MW exchange capacity
4
Wind
Hydro
Cables
Energy Balance
1 TWh
125 TWh
5800 MW
0TWh
Wind
Hydro
Cables
Energy Balance
11 TWh
125 TWh
5800 MW
+10TWh
Wind
Hydro
Cables
Energy Balance
1 TWh
135 TWh
5800 MW
+10TWh
Wind
Hydro
Cables
Energy Balance
1 TWh
125 TWh
2300 MW
0TWh
40 60 80 100 120 140 1600
10
20
30
40
50
60
Installed wind power (GW)
Sur
plus
win
d en
ergy
(%
)
34% Wind power limit
44% Wind power limit55% Wind power limit
65% Wind power limit
Installed wind power in Europe
5
Base case
6
European power surplus and “deficit”
1000 2000 3000 4000 5000 6000 7000 8000
-80
-60
-40
-20
0
20
40
GW
Hours
Wind power "deficit"
Wind power surplus
11
7
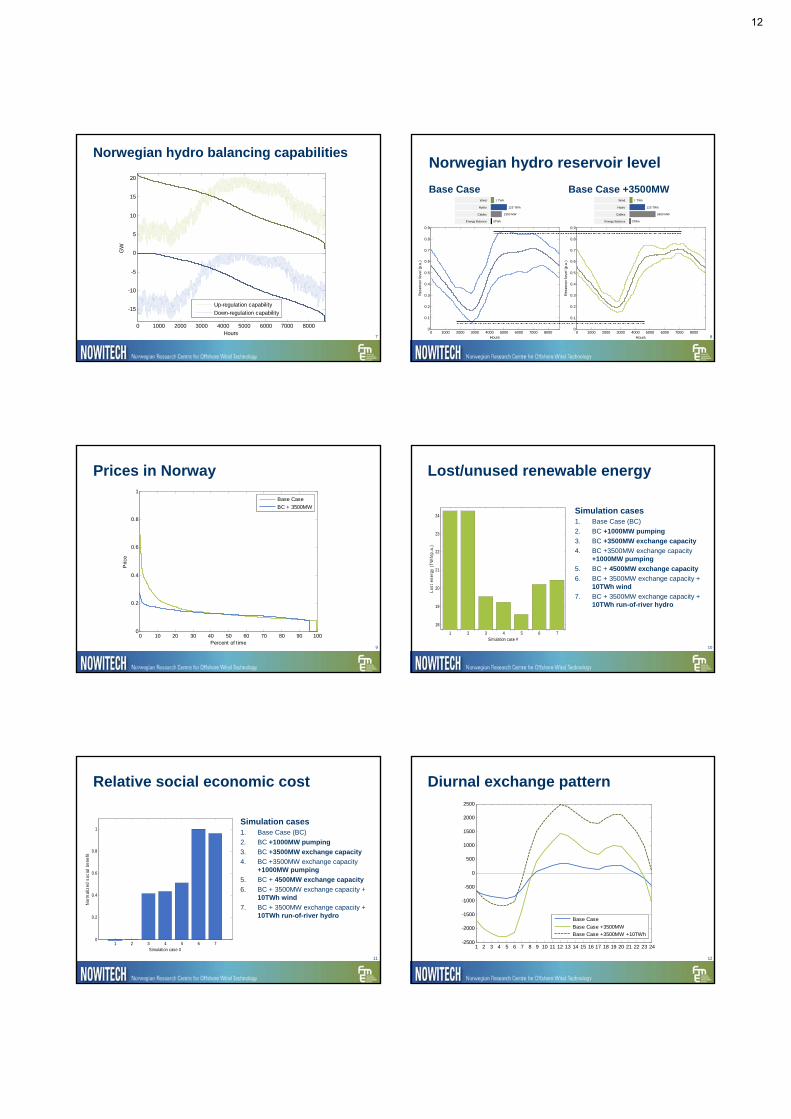
Norwegian hydro balancing capabilities
0 1000 2000 3000 4000 5000 6000 7000 8000
-15
-10
-5
0
5
10
15
20
GW
Hours
Up-regulation capability
Down-regulation capability
Norwegian hydro reservoir level
8
Wind
Hydro
Cables
Energy Balance
1 TWh
125 TWh
5800 MW
0TWh
Wind
Hydro
Cables
Energy Balance
1 TWh
125 TWh
2300 MW
0TWh
0 1000 2000 3000 4000 5000 6000 7000 80000
0.1
0.2
0.3
0.4
0.5
0.6
0.7
0.8
0.9
Hours
Res
ervo
ir le
vel (
p.u.
)
0 1000 2000 3000 4000 5000 6000 7000 80000
0.1
0.2
0.3
0.4
0.5
0.6
0.7
0.8
0.9
Hours
Res
ervo
ir le
vel (
p.u.
)
Base Case Base Case +3500MW
Prices in Norway
9
0 10 20 30 40 50 60 70 80 90 1000
0.2
0.4
0.6
0.8
1
Percent of time
Pric
e
Base Case
BC + 3500MW
Lost/unused renewable energy
10
1 2 3 4 5 6 7
18
19
20
21
22
23
24
Simulation case #
Lost
ene
rgy
(TW
h/p.
a.)
Simulation cases1. Base Case (BC)
2. BC +1000MW pumping
3. BC +3500MW exchange capacity
4. BC +3500MW exchange capacity +1000MW pumping
5. BC + 4500MW exchange capacity
6. BC + 3500MW exchange capacity + 10TWh wind
7. BC + 3500MW exchange capacity + 10TWh run-of-river hydro
Relative social economic cost
Simulation cases1. Base Case (BC)
2. BC +1000MW pumping
3. BC +3500MW exchange capacity
4. BC +3500MW exchange capacity +1000MW pumping
5. BC + 4500MW exchange capacity
6. BC + 3500MW exchange capacity + 10TWh wind
7. BC + 3500MW exchange capacity + 10TWh run-of-river hydro
11
1 2 3 4 5 6 70
0.2
0.4
0.6
0.8
1
Simulation case #
Nor
mal
ized
soc
ial b
enef
it
Diurnal exchange pattern
12
1 2 3 4 5 6 7 8 9 10 11 12 13 14 15 16 17 18 19 20 21 22 23 24-2500
-2000
-1500
-1000
-500
0
500
1000
1500
2000
2500
Base Case
Base Case +3500MWBase Case +3500MW +10TWh
12

Utilization of exchange capacity
13
98% utilization
90% utilization
1000 2000 3000 4000 5000 6000 7000 8000-6000
-4000
-2000
0
2000
4000
6000
Exc
hang
e N
O->
EU
(M
W)
Hours
Base Case
Base Case +3500MWBase Case +3500MW +10TWh
Hour-to-hour change in export
14
1000 2000 3000 4000 5000 6000 7000 8000
-10
-8
-6
-4
-2
0
2
4
6
8
10
E
xcha
nge
(GW
)
Hours
Discussion
► Internal grid bottlenecks
►Limitations on water flow
►Capacity upgrade and reserve requirements
15
Conclusions
► Norway can act both as a net exporter of renewable electricity and as a ”battery” for Europe Provided the exchange capacity is suitably expanded
► Norway can help Europe meet its balancing needs► Norwegian hydro reservoirs have sufficient capacity
Down-regulation capability is limited by little pumping capacity during the spring thaw
Up-regulation capability is less of an issue, but is somewhat limited in the winter time
► We should not fear to ”import” European prices As long as the planned amount of wind power is built in the North Sea
region, prices in Norway will likely fall slightly and stabilize Prices will be less influenced by the annual changes in inflow
16
13

Development of Offshore Wind Farms
Bjørn Drangsholt, Vice PresidentWind Power R&D SeminarRoyal Garden, Trondheim, 21st January 2010
CONTENT
Statkraft in brief
Round 3 – UK
Offshore wind in Statkraft
Challenges
Expectations
R&D
Opportunities
PURE ENERGY TO THE WORLD
3200EMPLOYEES..
90%264 POWER STATIONS
AND DISTRICT HEATING PLANTS
35% OF NORWEGIAN POWER PRODUCTION
RENEWABLEENERGY
...IN OVER 20COUNTRIES
IN RENEWABLESIN EUROPENR. 1
3
STATKRAFT’S WIND POWER STRATEGY
side 4
Geography
Value chain
Technology
Continue onshore development and expand into offshore Wind power
Geographic focus on the North Sea Area
Full value chain participation, with main focus on securing sites and projects in early stage developments
ROUND 3 – PREFERED BIDDER ANNOUNCED
Announcement of the successful bidders by Prime Minister Gordon Brown 8th January 2010
Page 6
ROUND 3 UK - AIMS AT DELIVERING A QUARTER OF UK’s TOTAL CONSORTIUM TARGETS 32.2 GW
1. Moray Firth - 1300 MWMoray Offshore Renewables Ltd – EDP Renovàeis (75%) and Sea Energy Renewable (25%)
2. Firth of Forth - 3500 MWSeaGreen Wind Energy Ltd – SSE Renewables and Flour (50% each)
3. Dogger Bank - 9000 MWForewind Ltd - SSE Renewables, RWE /npower Renewables, Statoil, Statkraft (25% each)
4. Hornsea - 4000 MWMainstream Renewable Power and Siemens Project Ventures (50% each), involving Hochtief
5. Norfolk Bank – 7200 MWEast Anglia Offshore Wind Ltd - Vattenfall Vindkraft and Scottish Power Renewables (50%)
6. Hastings - 600 MWEon Climate and Renewables UK (100%)
7. West of Isle of Wight - 900 MWEneco New Energy (100%)
8. Bristol Channel - 1500 MWRWE /npower Renewables (100%)
9. Irish Sea - 4200 MWCentrica Renewable Energy, involving RES
Forewind(RWE, SSE, Statoil, &Statkraft)
Dogger Bank9000MW
Mainstream & SPV 1)
Hornsea4000MW
East Anglia Offshore Wind Ltd(Scottish Power & Vattenfall)
Norfolk72000MW
Moray Offshore Renewables Ltd(EDP & Sea Energy)
Moray Firth1300MW
SeaGreen Wind Energy (SSE Renewables & Fluor)
Firthe of Forth3500MW
RWEHastings600MW
Eneco New EnergyWest of Isle of Wight
900MW
SSE Renewables & FlourBristol Channel
1500MW
CentricaIrish Sea5000MW
1) Siemens Project Ventures
3
2
1
4
5
6
7
8
9
14
7
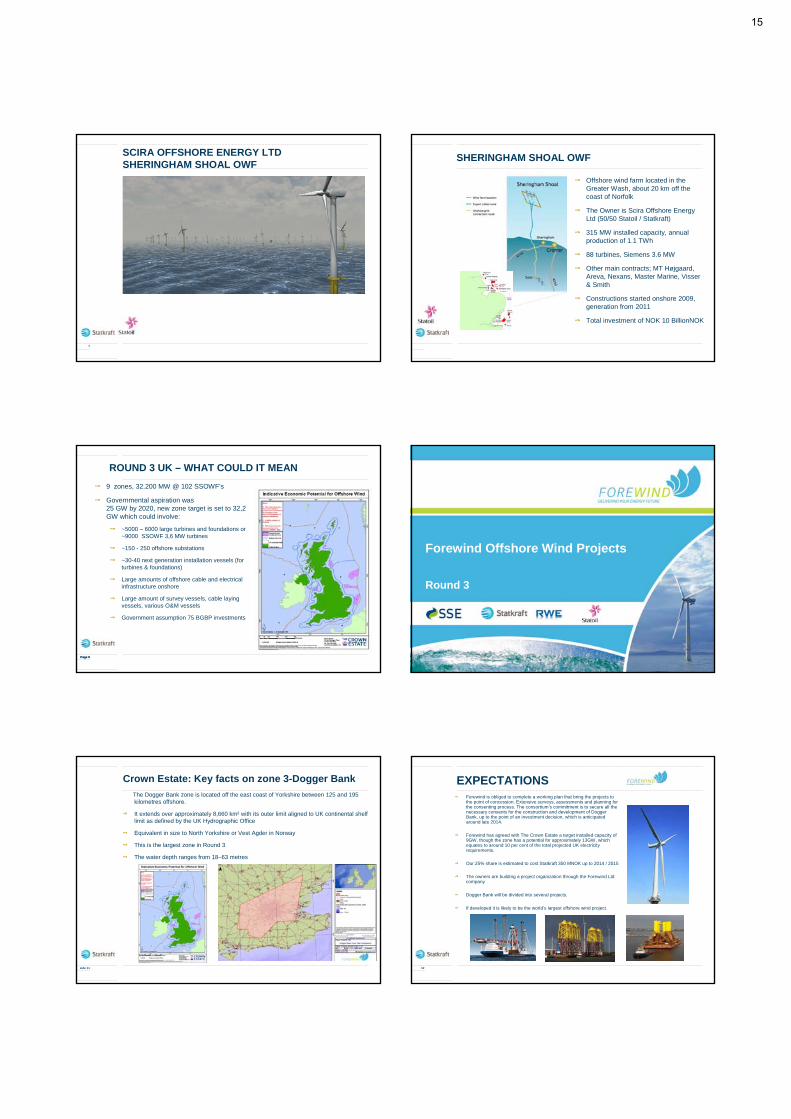
SCIRA OFFSHORE ENERGY LTDSHERINGHAM SHOAL OWF
SHERINGHAM SHOAL OWF
Offshore wind farm located in the Greater Wash, about 20 km off the coast of Norfolk
The Owner is Scira Offshore Energy Ltd (50/50 Statoil / Statkraft)
315 MW installed capacity, annual production of 1.1 TWh
88 turbines, Siemens 3.6 MW
Other main contracts; MT Højgaard, Areva, Nexans, Master Marine, Visser & Smith
Constructions started onshore 2009, generation from 2011
Total investment of NOK 10 BillionNOK
Page 9Page 9
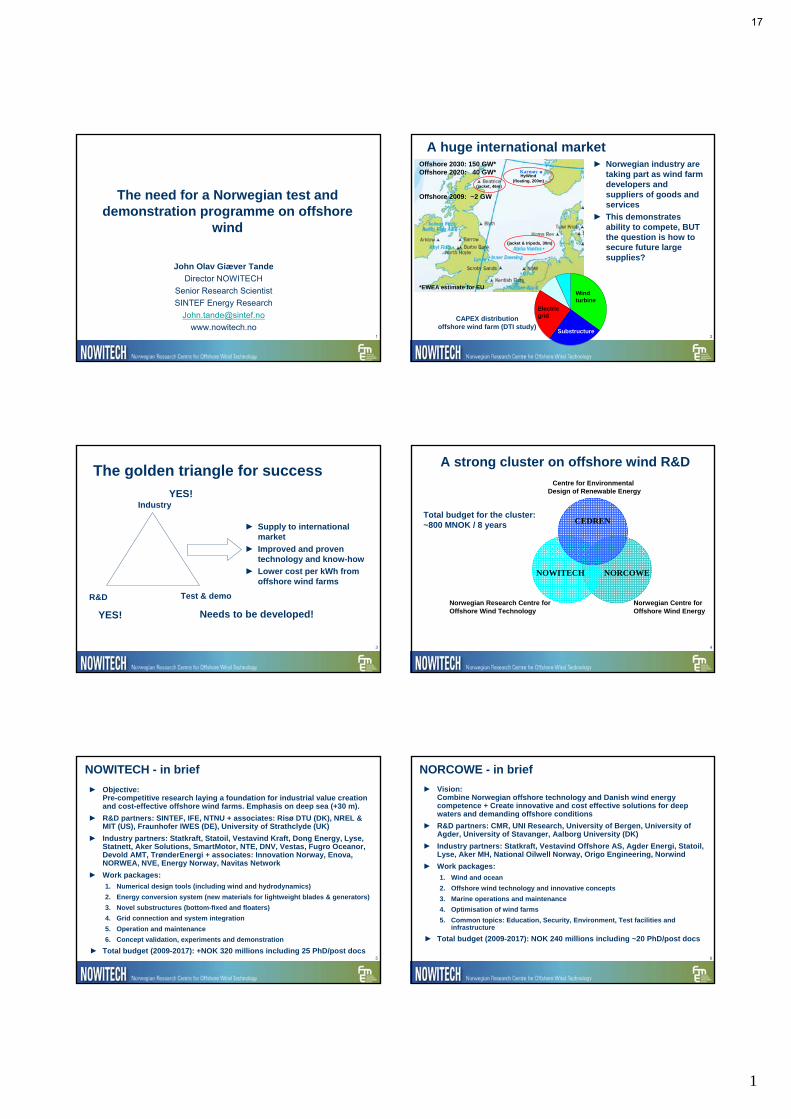
ROUND 3 UK – WHAT COULD IT MEAN
9 zones, 32.200 MW @ 102 SSOWF’s
Governmental aspiration was 25 GW by 2020, new zone target is set to 32,2 GW which could involve:
~5000 – 6000 large turbines and foundations or ~9000 SSOWF 3,6 MW turbines
~150 - 250 offshore substations
~30-40 next generation installation vessels (for turbines & foundations)
Large amounts of offshore cable and electrical infrastructure onshore
Large amount of survey vessels, cable laying vessels, various O&M vessels
Government assumption 75 BGBP investments
Forewind Offshore Wind Projects
Round 3
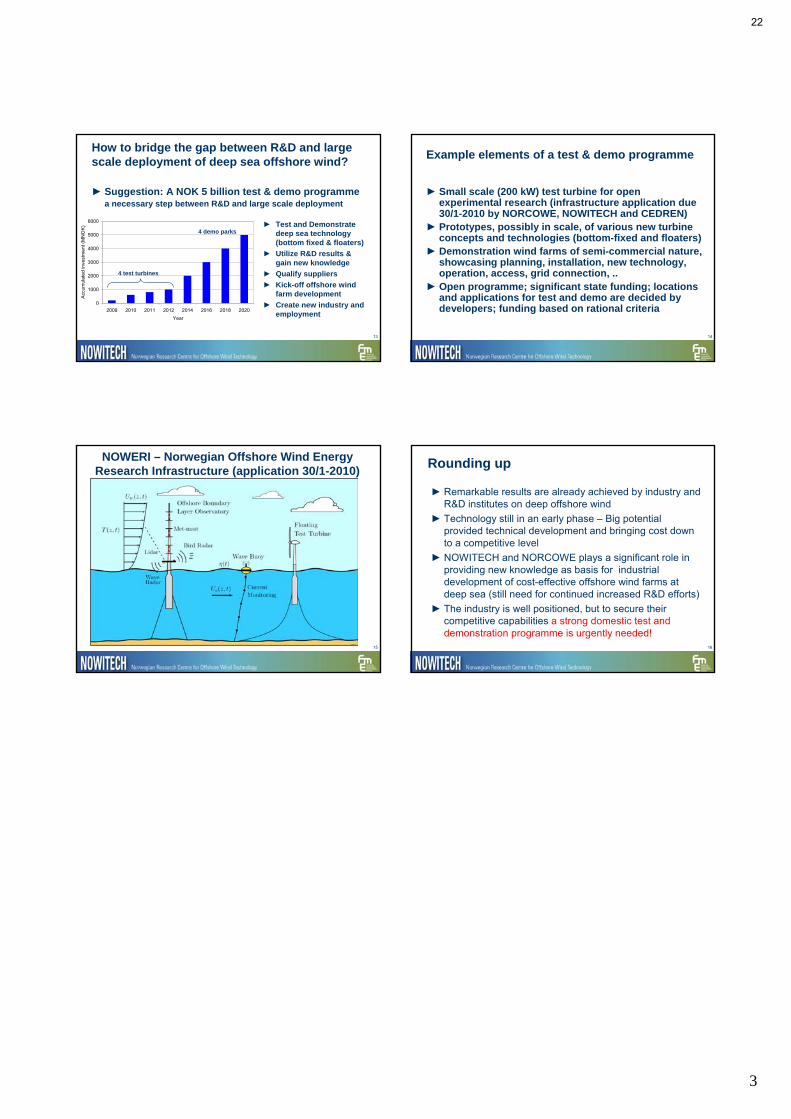
Crown Estate: Key facts on zone 3-Dogger Bank
The Dogger Bank zone is located off the east coast of Yorkshire between 125 and 195 kilometres offshore.
It extends over approximately 8,660 km² with its outer limit aligned to UK continental shelf limit as defined by the UK Hydrographic Office
Equivalent in size to North Yorkshire or Vest Agder in Norway
This is the largest zone in Round 3
The water depth ranges from 18–63 metres
side 11 12
EXPECTATIONS Forewind is obliged to complete a working plan that bring the projects to the point of concession. Extensive surveys, assessments and planning for the consenting process. The consortium’s commitment is to secure all the necessary consents for the construction and development of Dogger Bank, up to the point of an investment decision, which is anticipated around late 2014.
Forewind has agreed with The Crown Estate a target installed capacity of 9GW, though the zone has a potential for approximately 13GW, which equates to around 10 per cent of the total projected UK electricity requirements.
Our 25% share is estimated to cost Statkraft 350 MNOK up to 2014 / 2015
The owners are building a project organization through the Forewind Ltd company
Dogger Bank will be divided into several projects.
If developed it is likely to be the world’s largest offshore wind project.
15

DOGGER BANK DEVELOPMENT
Tentative development plan:
Joint organisation being established in Reading, UK
Environmental Impact Assessment (EIA)
Supply chain development
Page 14Page 14
DOGGER BANK – SOME OF THE CHALLENGES
Economy (capex, opex, ROC’s)
Distance from shore
Water depth
Wave climate
Limiting installation
Limiting access for maintenance
Grid connection, grid capacity, OFTO regime
Capacity limitation throughout the supply chain
Availability of competent personnel
New consenting Process (IPC)
New O&M Philosophy
Page 15Page 15
DOGGER BANK – SOME EXPECTATIONS
Larger turbines, 5-6MW +
Focus on simplicity and reliability (minimum intervention), condition monitoring
Offshore accommodation and installation in the operational phase (fixed or floating)
Improved means of access
Economy of scale (serial production/ installation)
More optimized design
New vessels and installation methods – larger capacities and less weather sensitive
HVDC transmission
New development of harbour facilities
KeppelFels design
STATKRAFT SUPPORTS R&D WITHIN OFFSHORE WIND
Statkraft Is industrial partner in the two CEERs (FME) on offshore wind: NOWITECH and NORCOWEInitiated the Ocean Energy Research Programme: contains many projects within offshore wind, wave- and tidal power at NTNU, DTU and University of Uppsala Supports individual R&D projects which are also supported by theNorwegian Research Council
For Statkraft, R&D is a tool for reaching our targets, i.e. developing, constructing and operating profitable offshore wind farms.
To ensure this, good cooperation is neededBetween national and international R&D initiativesBetween industry and research institutions
Page 17
The future offshore wind business will be a challenge not only for the developer, but also for the supply- and contractor industry.
Page 17
Aker Verdal AS
Huge opportunities for the International Wind Industry, As well as for the Norwegian Industry – But it won’t come easy
• It will demand new and smart solutions • Equipment needs to be improved • Risks needs to be understood and managed • Ability to handle large scale and complex projects a prerequisite• A long list of Stakeholders will have conflicting interests • Cost needs to get down to make Round 3 happen
Examples of “Norwegian” Companies that can supply services
Competition with Global Players
side 18 STATKRAFT 2008
16
1
1
The need for a Norwegian test and demonstration programme on offshore
wind
John Olav Giæver Tande
Director NOWITECH
Senior Research Scientist
SINTEF Energy Research
www.nowitech.no2
A huge international market► Norwegian industry are
taking part as wind farm developers and suppliers of goods and services
► This demonstrates ability to compete, BUT the question is how to secure future large supplies?
CAPEX distributionoffshore wind farm (DTI study)
KarmøyKarmøyKarmøyOffshore 2030: 150 GW*Offshore 2020: 40 GW*
Offshore 2009: ~2 GW
*EWEA estimate for EU
HyWind(floating, 200m)
(jacket, 46m)
(jacket & tripods, 30m)
Windturbine
Electric grid
Substructure
3
The golden triangle for success
R&D
Industry
Test & demo
► Supply to international market
► Improved and proven technology and know-how
► Lower cost per kWh from offshore wind farms
YES!
YES!
Needs to be developed!
4
A strong cluster on offshore wind R&D
Centre for Environmental Design of Renewable Energy
NORCOWE
Norwegian Centre forOffshore Wind Energy
NOWITECH
Norwegian Research Centre forOffshore Wind Technology
CEDRENTotal budget for the cluster: ~800 MNOK / 8 years
5
NOWITECH - in brief
► Objective: Pre-competitive research laying a foundation for industrial value creation and cost-effective offshore wind farms. Emphasis on deep sea (+30 m).
► R&D partners: SINTEF, IFE, NTNU + associates: Risø DTU (DK), NREL & MIT (US), Fraunhofer IWES (DE), University of Strathclyde (UK)
► Industry partners: Statkraft, Statoil, Vestavind Kraft, Dong Energy, Lyse, Statnett, Aker Solutions, SmartMotor, NTE, DNV, Vestas, Fugro Oceanor, Devold AMT, TrønderEnergi + associates: Innovation Norway, Enova, NORWEA, NVE, Energy Norway, Navitas Network
► Work packages:
1. Numerical design tools (including wind and hydrodynamics)
2. Energy conversion system (new materials for lightweight blades & generators)
3. Novel substructures (bottom-fixed and floaters)
4. Grid connection and system integration
5. Operation and maintenance
6. Concept validation, experiments and demonstration
► Total budget (2009-2017): +NOK 320 millions including 25 PhD/post docs6
NORCOWE - in brief
► Vision: Combine Norwegian offshore technology and Danish wind energy competence + Create innovative and cost effective solutions for deep waters and demanding offshore conditions
► R&D partners: CMR, UNI Research, University of Bergen, University of Agder, University of Stavanger, Aalborg University (DK)
► Industry partners: Statkraft, Vestavind Offshore AS, Agder Energi, Statoil, Lyse, Aker MH, National Oilwell Norway, Origo Engineering, Norwind
► Work packages:
1. Wind and ocean
2. Offshore wind technology and innovative concepts
3. Marine operations and maintenance
4. Optimisation of wind farms
5. Common topics: Education, Security, Environment, Test facilities and infrastructure
► Total budget (2009-2017): NOK 240 millions including ~20 PhD/post docs
17

2
7
Relevant labs and field facilities
Test station for wind turbines – VIVA ASAverage wind speed 8.4 m/s @ 50 m agl
Photo / Visualisation: InterPares AS
0.2 MW
0.9 MW 2.3 MW
Re. Energy Sys Lab
Wind tunnel 11x3x2 mOcean basin 80x50x10 m
Material testing
2x45 m + 2x100 m masts
HyWind 2,3 MWfloating wind turbine(owned & operated by Statoil)
Met-ocean buoys,lidars, etc (to be procured & operated jointly with NORCOWE)
8
Norway is developing offshore wind technology
GE(ScanWind)
9
…
Arena - Wind energy (Mid-Norway)”Building Norway’s Bremerhaven”
10
Arena NOW – Bergen/StavangerDevelopment mgt
11
Rationale for test & demo programme
► One of the main goals for the Norwegian offshore wind industry is to establish demonstration areas for:
1. Demonstrating new and existing technologies and products in order to acquire references for Norwegian suppliers
2. Testing new technologies for R&D purpose3. Building competency and track record
► with the ultimate aim to strengthen Norwegian offshore wind competitive capabilities.
► Arena NOW, Arena Vindenergi, Norcowe, and Nowitech have agreed to take a common approach as to define a national plan for an offshore wind demonstration programme.
12
Business case
There is a need for the Norwegian offshore wind industry to:1. Have domestic facilities for testing of new Norwegian offshore
wind related technologies and products2. Build Norwegian competency and partnerships in order to
strengthen competitive capabilities towards foreign competitors in commercial markets
3. Create Norwegian reference projects that can be used to win projects and contracts externally/commercially
4. Create show-cases on various offshore wind technologies to the Norwegian government
► The above will be achieved through the realisation of a coordinated national offshore wind test and demonstration programme.
18

3
13
0
1000
2000
3000
4000
5000
6000
2009 2010 2011 2012 2014 2016 2018 2020
Year
Acc
umul
ate
d in
vest
men
t (M
NO
K) ► Test and Demonstrate
deep sea technology(bottom fixed & floaters)
► Utilize R&D results & gain new knowledge
► Qualify suppliers
► Kick-off offshore wind farm development
► Create new industry and employment
4 test turbines
4 demo parks
►Suggestion: A NOK 5 billion test & demo programmea necessary step between R&D and large scale deployment
How to bridge the gap between R&D and large scale deployment of deep sea offshore wind?
14
►Small scale (200 kW) test turbine for open experimental research (infrastructure application due 30/1-2010 by NORCOWE, NOWITECH and CEDREN)
►Prototypes, possibly in scale, of various new turbine concepts and technologies (bottom-fixed and floaters)
►Demonstration wind farms of semi-commercial nature, showcasing planning, installation, new technology, operation, access, grid connection, ..
►Open programme; significant state funding; locations and applications for test and demo are decided by developers; funding based on rational criteria
Example elements of a test & demo programme
15
NOWERI – Norwegian Offshore Wind Energy Research Infrastructure (application 30/1-2010)
16
Rounding up
►Remarkable results are already achieved by industry and R&D institutes on deep offshore wind
►Technology still in an early phase – Big potential provided technical development and bringing cost down to a competitive level
►NOWITECH and NORCOWE plays a significant role in providing new knowledge as basis for industrial development of cost-effective offshore wind farms at deep sea (still need for continued increased R&D efforts)
►The industry is well positioned, but to secure their competitive capabilities a strong domestic test and demonstration programme is urgently needed!
19

1
1
The need for a Norwegian test and demonstration programme on offshore
wind
John Olav Giæver Tande
Director NOWITECH
Senior Research Scientist
SINTEF Energy Research
www.nowitech.no2
A huge international market► Norwegian industry are
taking part as wind farm developers and suppliers of goods and services
► This demonstrates ability to compete, BUT the question is how to secure future large supplies?
CAPEX distributionoffshore wind farm (DTI study)
KarmøyKarmøyKarmøyOffshore 2030: 150 GW*Offshore 2020: 40 GW*
Offshore 2009: ~2 GW
*EWEA estimate for EU
HyWind(floating, 200m)
(jacket, 46m)
(jacket & tripods, 30m)
Windturbine
Electric grid
Substructure
3
The golden triangle for success
R&D
Industry
Test & demo
► Supply to international market
► Improved and proven technology and know-how
► Lower cost per kWh from offshore wind farms
YES!
YES!
Needs to be developed!
4
A strong cluster on offshore wind R&D
Centre for Environmental Design of Renewable Energy
NORCOWE
Norwegian Centre forOffshore Wind Energy
NOWITECH
Norwegian Research Centre forOffshore Wind Technology
CEDRENTotal budget for the cluster: ~800 MNOK / 8 years
5
NOWITECH - in brief
► Objective: Pre-competitive research laying a foundation for industrial value creation and cost-effective offshore wind farms. Emphasis on deep sea (+30 m).
► R&D partners: SINTEF, IFE, NTNU + associates: Risø DTU (DK), NREL & MIT (US), Fraunhofer IWES (DE), University of Strathclyde (UK)
► Industry partners: Statkraft, Statoil, Vestavind Kraft, Dong Energy, Lyse, Statnett, Aker Solutions, SmartMotor, NTE, DNV, Vestas, Fugro Oceanor, Devold AMT, TrønderEnergi + associates: Innovation Norway, Enova, NORWEA, NVE, Energy Norway, Navitas Network
► Work packages:
1. Numerical design tools (including wind and hydrodynamics)
2. Energy conversion system (new materials for lightweight blades & generators)
3. Novel substructures (bottom-fixed and floaters)
4. Grid connection and system integration
5. Operation and maintenance
6. Concept validation, experiments and demonstration
► Total budget (2009-2017): +NOK 320 millions including 25 PhD/post docs6
NORCOWE - in brief
► Vision: Combine Norwegian offshore technology and Danish wind energy competence + Create innovative and cost effective solutions for deep waters and demanding offshore conditions
► R&D partners: CMR, UNI Research, University of Bergen, University of Agder, University of Stavanger, Aalborg University (DK)
► Industry partners: Statkraft, Vestavind Offshore AS, Agder Energi, Statoil, Lyse, Aker MH, National Oilwell Norway, Origo Engineering, Norwind
► Work packages:
1. Wind and ocean
2. Offshore wind technology and innovative concepts
3. Marine operations and maintenance
4. Optimisation of wind farms
5. Common topics: Education, Security, Environment, Test facilities and infrastructure
► Total budget (2009-2017): NOK 240 millions including ~20 PhD/post docs
20

2
7
Relevant labs and field facilities
Test station for wind turbines – VIVA ASAverage wind speed 8.4 m/s @ 50 m agl
Photo / Visualisation: InterPares AS
0.2 MW
0.9 MW 2.3 MW
Re. Energy Sys Lab
Wind tunnel 11x3x2 mOcean basin 80x50x10 m
Material testing
2x45 m + 2x100 m masts
HyWind 2,3 MWfloating wind turbine(owned & operated by Statoil)
Met-ocean buoys,lidars, etc (to be procured & operated jointly with NORCOWE)
8
Norway is developing offshore wind technology
GE(ScanWind)
9
…
Arena - Wind energy (Mid-Norway)”Building Norway’s Bremerhaven”
10
Arena NOW – Bergen/StavangerDevelopment mgt
11
Rationale for test & demo programme
► One of the main goals for the Norwegian offshore wind industry is to establish demonstration areas for:
1. Demonstrating new and existing technologies and products in order to acquire references for Norwegian suppliers
2. Testing new technologies for R&D purpose3. Building competency and track record
► with the ultimate aim to strengthen Norwegian offshore wind competitive capabilities.
► Arena NOW, Arena Vindenergi, Norcowe, and Nowitech have agreed to take a common approach as to define a national plan for an offshore wind demonstration programme.
12
Business case
There is a need for the Norwegian offshore wind industry to:1. Have domestic facilities for testing of new Norwegian offshore
wind related technologies and products2. Build Norwegian competency and partnerships in order to
strengthen competitive capabilities towards foreign competitors in commercial markets
3. Create Norwegian reference projects that can be used to win projects and contracts externally/commercially
4. Create show-cases on various offshore wind technologies to the Norwegian government
► The above will be achieved through the realisation of a coordinated national offshore wind test and demonstration programme.
21
3
13
0
1000
2000
3000
4000
5000
6000
2009 2010 2011 2012 2014 2016 2018 2020
Year
Acc
umul
ate
d in
vest
men
t (M
NO
K) ► Test and Demonstrate
deep sea technology(bottom fixed & floaters)
► Utilize R&D results & gain new knowledge
► Qualify suppliers
► Kick-off offshore wind farm development
► Create new industry and employment
4 test turbines
4 demo parks
►Suggestion: A NOK 5 billion test & demo programmea necessary step between R&D and large scale deployment
How to bridge the gap between R&D and large scale deployment of deep sea offshore wind?
14
►Small scale (200 kW) test turbine for open experimental research (infrastructure application due 30/1-2010 by NORCOWE, NOWITECH and CEDREN)
►Prototypes, possibly in scale, of various new turbine concepts and technologies (bottom-fixed and floaters)
►Demonstration wind farms of semi-commercial nature, showcasing planning, installation, new technology, operation, access, grid connection, ..
►Open programme; significant state funding; locations and applications for test and demo are decided by developers; funding based on rational criteria
Example elements of a test & demo programme
15
NOWERI – Norwegian Offshore Wind Energy Research Infrastructure (application 30/1-2010)
16
Rounding up
►Remarkable results are already achieved by industry and R&D institutes on deep offshore wind
►Technology still in an early phase – Big potential provided technical development and bringing cost down to a competitive level
►NOWITECH and NORCOWE plays a significant role in providing new knowledge as basis for industrial development of cost-effective offshore wind farms at deep sea (still need for continued increased R&D efforts)
►The industry is well positioned, but to secure their competitive capabilities a strong domestic test and demonstration programme is urgently needed!
22

A1 New turbine technology
A quantitative comparison of three floating wind turbines, Jason Jonkman, NREL Long blades for offshore turbines, Jørg Høyland, PhD student NTNU VAWT for offshore – pros and cons, Dr Olimpo Anaya-Lara and Prof Bill Leithead, University of Strathclyde HyWind modelling and validation, Bjørn Skaare, Statoil Floating wind turbine. Wave induced loads, Ivar Fylling, MARINTEK
23
A Quantitative Comparisonof Three Floating Wind Turbines
Operated for the U.S. Department of Energy Office of Energy Efficiency and Renewable Energy by Midwest Research Institute • Battelle
NOWITECH Deep Sea Offshore Wind Power Seminar
January 21-22, 2009
Jason Jonkman, Ph.D.
NOWITECH Deep Sea Offshore Wind Power Seminar 2 National Renewable Energy Laboratory
ShallowWater
0m-30m TransitionalDepth
30m-60m Deepwater60m+
Onshore
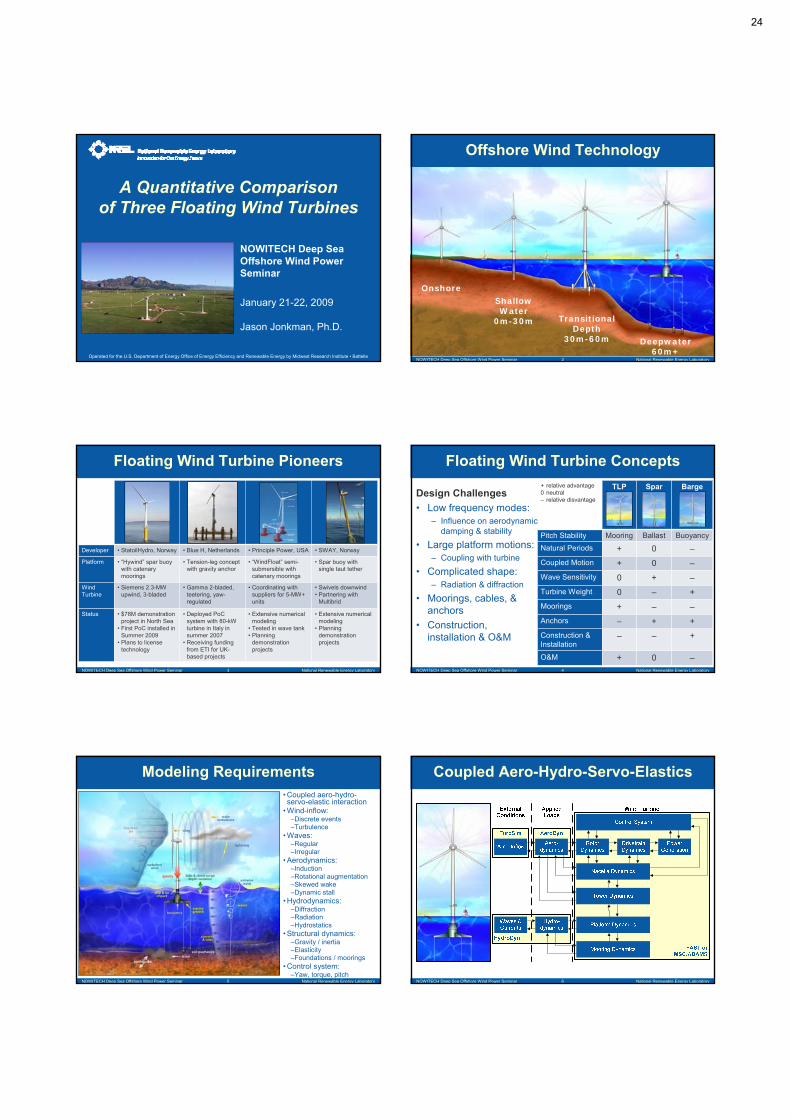
Offshore Wind Technology
NOWITECH Deep Sea Offshore Wind Power Seminar 3 National Renewable Energy Laboratory
Developer • StatoilHydro, Norway • Blue H, Netherlands • Principle Power, USA • SWAY, Norway
Platform • “Hywind” spar buoy with catenary moorings
• Tension-leg concept with gravity anchor
• “WindFloat” semi-submersible with catenary moorings
• Spar buoy with single taut tether
Wind Turbine
• Siemens 2.3-MW upwind, 3-bladed
• Gamma 2-bladed, teetering, yaw-regulated
• Coordinating with suppliers for 5-MW+ units
• Swivels downwind• Partnering with
Multibrid
Status • $78M demonstration project in North Sea
• First PoC installed in Summer 2009
• Plans to license technology
• Deployed PoC system with 80-kW turbine in Italy in summer 2007
• Receiving funding from ETI for UK-based projects
• Extensive numerical modeling
• Tested in wave tank• Planning
demonstration projects
• Extensive numerical modeling
• Planning demonstration projects
Floating Wind Turbine Pioneers
NOWITECH Deep Sea Offshore Wind Power Seminar 4 National Renewable Energy Laboratory
+ relative advantage0 neutral– relative disvantage
TLP Spar Barge
Pitch Stability Mooring Ballast Buoyancy
Natural Periods + 0 –
Coupled Motion + 0 –
Wave Sensitivity 0 + –
Turbine Weight 0 – +
Moorings + – –
Anchors – + +
Construction & Installation
– – +
O&M + 0 –
Design Challenges
• Low frequency modes:– Influence on aerodynamic
damping & stability
• Large platform motions:– Coupling with turbine
• Complicated shape:– Radiation & diffraction
• Moorings, cables, & anchors
• Construction, installation & O&M
Floating Wind Turbine Concepts
NOWITECH Deep Sea Offshore Wind Power Seminar 5 National Renewable Energy Laboratory
• Coupled aero-hydro-servo-elastic interaction
• Wind-inflow:–Discrete events–Turbulence
• Waves:–Regular–Irregular
• Aerodynamics:–Induction–Rotational augmentation–Skewed wake–Dynamic stall
• Hydrodynamics:–Diffraction–Radiation–Hydrostatics
• Structural dynamics:–Gravity / inertia–Elasticity–Foundations / moorings
• Control system:–Yaw, torque, pitch
Modeling Requirements
NOWITECH Deep Sea Offshore Wind Power Seminar 6 National Renewable Energy Laboratory
Coupled Aero-Hydro-Servo-Elastics
24
NOWITECH Deep Sea Offshore Wind Power Seminar 7 National Renewable Energy Laboratory
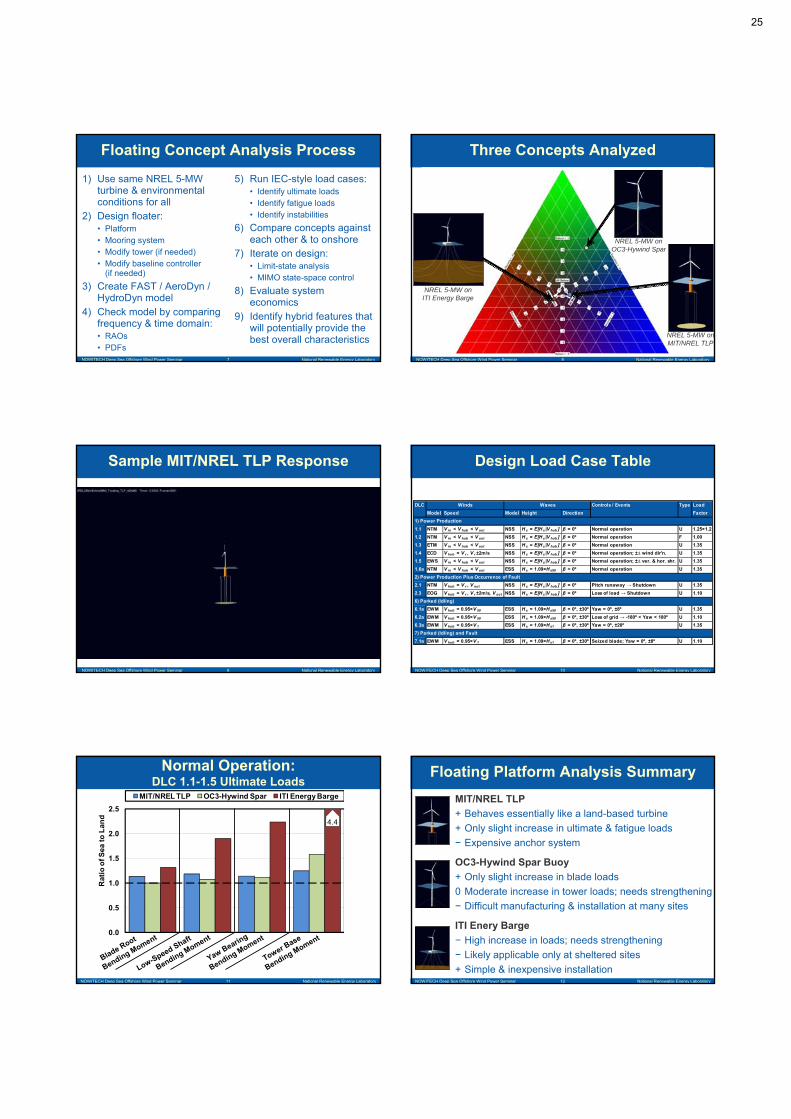
1) Use same NREL 5-MW turbine & environmental conditions for all
2) Design floater:• Platform• Mooring system• Modify tower (if needed)• Modify baseline controller
(if needed)
3) Create FAST / AeroDyn / HydroDyn model
4) Check model by comparing frequency & time domain:• RAOs• PDFs
5) Run IEC-style load cases:• Identify ultimate loads• Identify fatigue loads• Identify instabilities
6) Compare concepts against each other & to onshore
7) Iterate on design:• Limit-state analysis• MIMO state-space control
8) Evaluate system economics
9) Identify hybrid features that will potentially provide the best overall characteristics
Floating Concept Analysis Process
NOWITECH Deep Sea Offshore Wind Power Seminar 8 National Renewable Energy Laboratory
NREL 5-MW onOC3-Hywind Spar
NREL 5-MW onMIT/NREL TLP
NREL 5-MW onITI Energy Barge
Three Concepts Analyzed
NOWITECH Deep Sea Offshore Wind Power Seminar 9 National Renewable Energy Laboratory
Sample MIT/NREL TLP Response
NOWITECH Deep Sea Offshore Wind Power Seminar 10 National Renewable Energy Laboratory
Summary of Selected Design Load Cases from IEC61400-1 & -3
Design Load Case Table
DLC Controls / Events Type Load
Model Speed Model Height Direction Factor
1.1 NTM V in < V hub < V out NSS H s = E[H s |V hub ] β = 0º Normal operation U 1.25×1.2
1.2 NTM V in < V hub < V out NSS H s = E[H s |V hub ] β = 0º Normal operation F 1.00
1.3 ETM V in < V hub < V out NSS H s = E[H s |V hub ] β = 0º Normal operation U 1.35
1.4 ECD V hub = V r , V r ±2m/s NSS H s = E[H s |V hub ] β = 0º Normal operation; ±∆ wind dir'n. U 1.35
1.5 EWS V in < V hub < V out NSS H s = E[H s |V hub ] β = 0º Normal operation; ±∆ ver. & hor. shr. U 1.35
1.6a NTM V in < V hub < V out ESS H s = 1.09×H s50 β = 0º Normal operation U 1.35
2.1 NTM V hub = V r , V out NSS H s = E[H s |V hub ] β = 0º Pitch runaway → Shutdown U 1.35
2.3 EOG V hub = V r , V r ±2m/s, V out NSS H s = E[H s |V hub ] β = 0º Loss of load → Shutdown U 1.10
6.1a EWM V hub = 0.95×V 50 ESS H s = 1.09×H s50 β = 0º, ±30º Yaw = 0º, ±8º U 1.35
6.2a EWM V hub = 0.95×V 50 ESS H s = 1.09×H s50 β = 0º, ±30º Loss of grid → -180º < Yaw < 180º U 1.10
6.3a EWM V hub = 0.95×V 1 ESS H s = 1.09×H s1 β = 0º, ±30º Yaw = 0º, ±20º U 1.35
7.1a EWM V hub = 0.95×V 1 ESS H s = 1.09×H s1 β = 0º, ±30º Seized blade; Yaw = 0º, ±8º U 1.10
6) Parked (Idling)
7) Parked (Idling) and Fault
Winds Waves
1) Power Production
2) Power Production Plus Occurrence of Fault
NOWITECH Deep Sea Offshore Wind Power Seminar 11 National Renewable Energy Laboratory
0.0
0.5
1.0
1.5
2.0
2.5
Rat
io o
f Sea
to
Lan
d
MIT/NREL TLP OC3-Hywind Spar ITI Energy Barge
4.4
Normal Operation:DLC 1.1-1.5 Ultimate Loads
Yaw Bearing
Bending Moment
Blade Root
Bending Moment
Tower Base
Bending Moment
Low-Speed Shaft
Bending Moment
NOWITECH Deep Sea Offshore Wind Power Seminar 12 National Renewable Energy Laboratory
MIT/NREL TLP
+ Behaves essentially like a land-based turbine
+ Only slight increase in ultimate & fatigue loads
− Expensive anchor system
OC3-Hywind Spar Buoy
+ Only slight increase in blade loads
0 Moderate increase in tower loads; needs strengthening
− Difficult manufacturing & installation at many sites
ITI Enery Barge
− High increase in loads; needs strengthening
− Likely applicable only at sheltered sites
+ Simple & inexpensive installation
Floating Platform Analysis Summary
25

NOWITECH Deep Sea Offshore Wind Power Seminar 13 National Renewable Energy Laboratory
• Assess role of advanced control
• Resolve system instabilities
• Optimize system designs
• Evaluate system economics
• Analyze other floating concepts:– Platform configuration
– Vary turbine size, weight, & configuration
• Verify under IEA OC3
• Validate simulations with test data
• Improve simulation capabilities
• Develop design guidelines / standards Spar Concept by SWAYSemi-Submersible Concept
Ongoing Work & Future Plans
NOWITECH Deep Sea Offshore Wind Power Seminar 14 National Renewable Energy Laboratory
• The IEA “Offshore Code Comparison Collaboration” (OC3) is as an international forum for OWT dynamics model verification
• OC3 ran from 2005 to 2009:– Phase I – Monopile + Rigid Foundation– Phase II – Monopile + Flexible Foundation– Phase III – Tripod– Phase IV – Floating Spar Buoy
• Follow-on project to be started in April, 2010:– Phase V – Jacket– Phase VI – Floating semi submersible
Model Verification through IEA OC3
NOWITECH Deep Sea Offshore Wind Power Seminar 15 National Renewable Energy Laboratory
• Discussing modeling strategies
• Developing a suite of benchmark models & simulations
• Running the simulations & processing the results
• Comparing & discussing the results
• Assessing the accuracy & reliability of simulations to establish confidence in their predictive capabilities
• Training new analysts how to run & apply codes correctly
• Investigating the capabilities / limitations of implemented theories
• Refining applied analysis methodologies
• Identifying further R&D needs
OC3 Activities & Objectives
Ac
tivi
tie
sO
bje
ctiv
es
Thank You for Your Attention
Operated for the U.S. Department of Energy Office of Energy Efficiency and Renewable Energy by Midwest Research Institute • Battelle
Jason Jonkman, Ph.D.+1 (303) 384 – [email protected]
NOWITECH Deep Sea Offshore Wind Power Seminar 17 National Renewable Energy Laboratory
Normal Operation:DLC 1.2 Fatigue Loads
0.0
0.5
1.0
1.5
2.0
2.5
Rat
io o
f Se
a to
La
nd
m=8/3 m=10/4 m=12/5m=8/3 m=10/4 m=12/5m=8/3 m=10/4 m=12/5
MIT/NREL TLP:OC3-Hywind:ITI Energy Barge:
4-5 7-8
m=Composite
/Steel
Low-Speed Shaft
Bending Moments
Yaw Bearing
Bending Moments
Blade Root
Bending Moments
Tower Base
Bending Moments
Out-of-Plane
In-Plane 0° 90°
Side-to-Side
Fore-Aft
Side-to-Side
Fore-Aft
NOWITECH Deep Sea Offshore Wind Power Seminar 18 National Renewable Energy Laboratory
-4
-2
0
2
4
0 100 200 300 400 500 600
Time, s
S-S
T-T
De
fl,
m
No BrakeBrake
Brake Engaged
• Aero-elastic interaction causes negative damping in a coupled blade-edge, tower-S-S, & platform-roll & -yaw mode
• Conditions:– 50-yr wind event for TLP, spar, & land-based turbine– Idling + loss of grid; all blades = 90º; nacelle yaw error = ±(20º to 40º)– Instability diminished in barge by wave radiation
• Possible solutions:– Modify airfoils to reduce energy absorption– Allow slip of yaw drive– Apply brake to keep rotor away from critical azimuths
Idling:DLC 6.2a Side-to-Side Instability
26

NOWITECH Deep Sea Offshore Wind Power Seminar 19 National Renewable Energy Laboratory
• Aero-elastic interaction causes negative damping in a mode that couples rotor azimuth with platform yaw
• Conditions:– Normal or 1-yr wind & wave events– Idling + fault; blade pitch = 0º (seized), 90º, 90º– Instability in TLP & barge, not in spar or land-based turbine
• Possible solutions:– Reduce fully feathered pitch to allow slow roll while idling– Apply brake to stop rotor
-180
-90
0
90
180
0 100 200 300 400 500 600
Time, s
Pla
tfo
rm Y
aw,
de
g
No BrakeBrake
Brake Engaged
Idling:DLC 2.1 & 7.1a Yaw Instability
27
Wind Power R&D seminar 2010
PhD-stud
Jörg Höyland
Mobile: +47 971 52 477
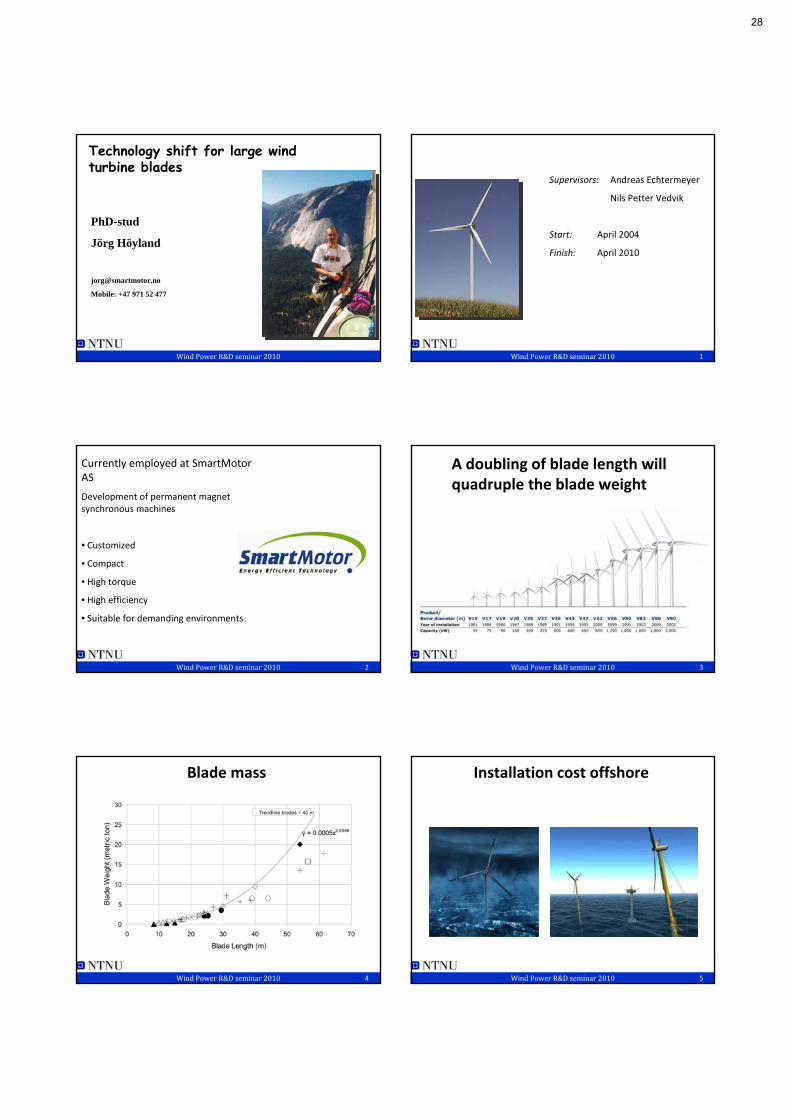
Technology shift for large windturbine blades
Wind Power R&D seminar 2010 1
Supervisors: Andreas Echtermeyer
Nils Petter Vedvik
Start: April 2004
Finish: April 2010
Wind Power R&D seminar 2010 2
Currently employed at SmartMotor AS
Development of permanent magnet synchronous machines
• Customized
• Compact
• High torque
• High efficiency
• Suitable for demanding environments
Wind Power R&D seminar 2010 3
A doubling of blade length willquadruple the blade weight
Wind Power R&D seminar 2010 4
Blade mass
Wind Power R&D seminar 2010 5
Installation cost offshore
28
Wind Power R&D seminar 2010 6
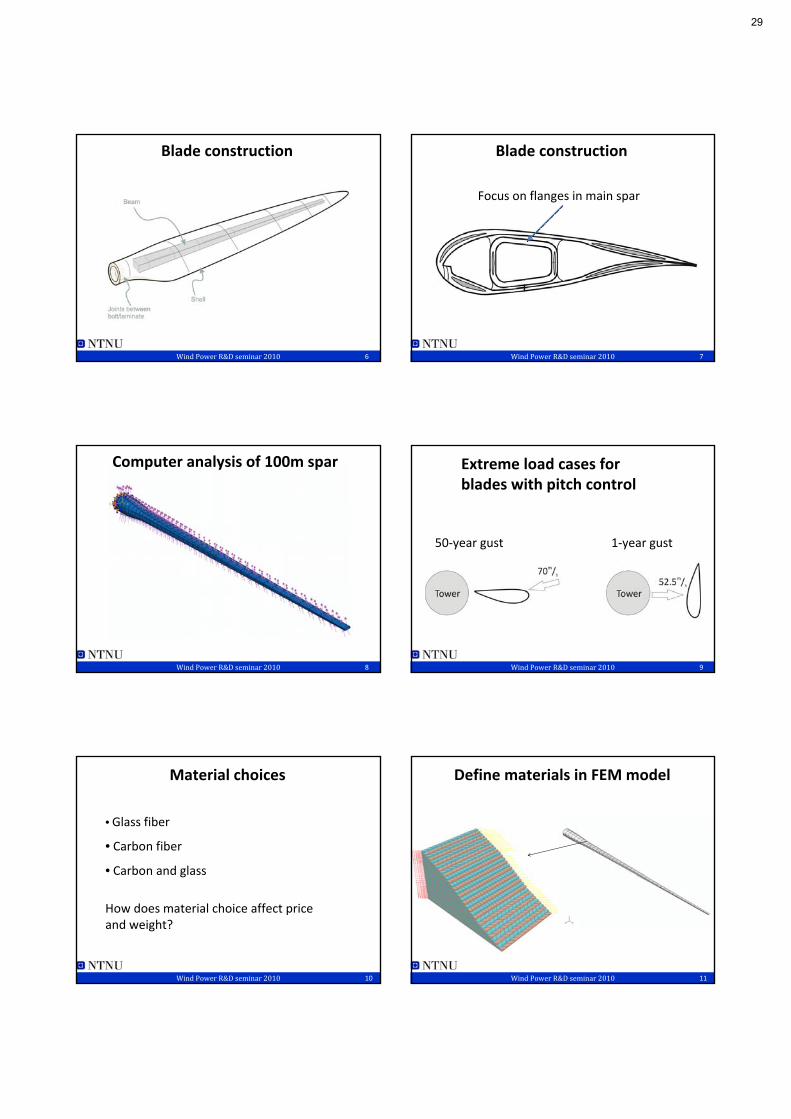
Blade construction
Wind Power R&D seminar 2010 7
Blade construction
Focus on flanges in main spar
Wind Power R&D seminar 2010 8
Computer analysis of 100m spar
Wind Power R&D seminar 2010 9
Extreme load cases for blades with pitch control
50‐year gust 1‐year gust
Wind Power R&D seminar 2010 10
• Glass fiber
• Carbon fiber
• Carbon and glass
How does material choice affect price and weight?
Material choices
Wind Power R&D seminar 2010 11
Define materials in FEM model
29

Wind Power R&D seminar 2010 12
Stress/strain analyses
Wind Power R&D seminar 2010 13
Buckling
Non‐linearmethod
Linearmethod
Wind Power R&D seminar 2010 14
Material Weight [tonn]
Price[Euro]
Carbon 40.2 932 000
Carbon/glass 65.5 476 000
Glass 75.6 171 000
100m spar results
Wind Power R&D seminar 2010 15
FEM model
=
Reality?
Wind Power R&D seminar 2010 16
6m glass fiber spar manufactured at NTNU
Wind Power R&D seminar 2010 17
Cross section of 6m spar
30
Wind Power R&D seminar 2010 18
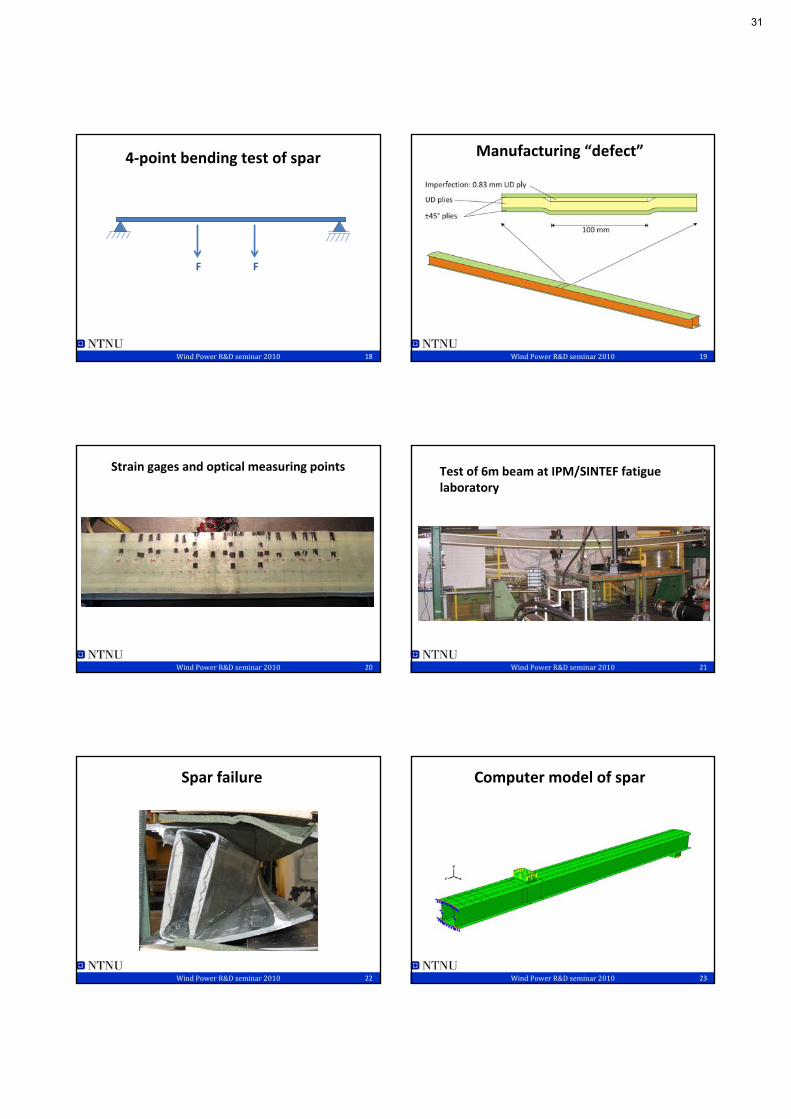
4‐point bending test of spar
FF
Wind Power R&D seminar 2010 19
Manufacturing “defect”
Wind Power R&D seminar 2010 20
Strain gages and optical measuring points
Wind Power R&D seminar 2010 21
Test of 6m beam at IPM/SINTEF fatigue laboratory
Wind Power R&D seminar 2010 22
Spar failure
Wind Power R&D seminar 2010 23
Computer model of spar
31

Wind Power R&D seminar 2010 24
Include imperfection in FEM model
Wind Power R&D seminar 2010 25
FEM analysis results
• Spar deflections are accurately predicted
• Strains measured during testing are reproduced in FEM analysis.
The FEM model can be used as a tool for optimization of the composite materials in the spar.
Wind Power R&D seminar 2010 26
Thank you for your attention
Questions?
32
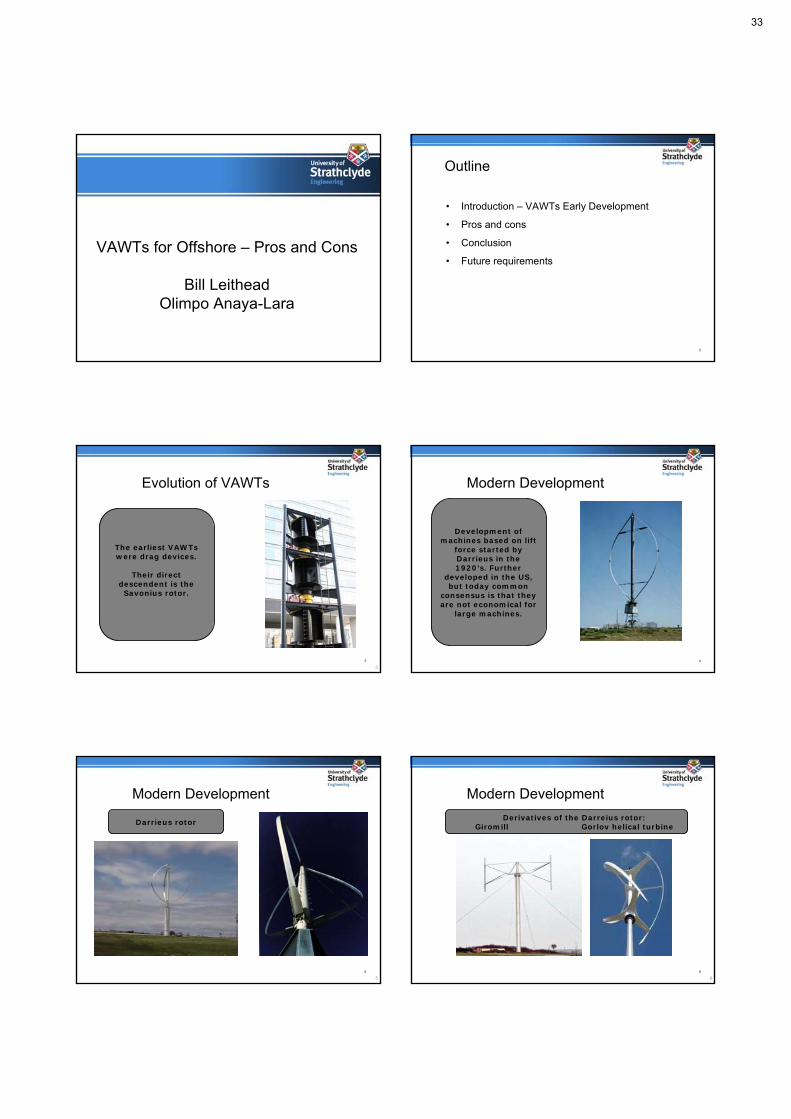
VAWTs for Offshore – Pros and Cons
Bill LeitheadOlimpo Anaya-Lara
2
Outline
• Introduction – VAWTs Early Development
• Pros and cons
• Conclusion
• Future requirements
3
3
The earliest VAWTs were drag devices.
Their direct descendent is the Savonius rotor.
Evolution of VAWTs
4
27/01/2010 4
Development of machines based on lift
force started by Darrieus in the 1920’s. Further
developed in the US, but today common
consensus is that they are not economical for
large machines.
Modern Development
5
5
Darrieus rotor
Modern Development
6
6
Derivatives of the Darreius rotor:Giromill Gorlov helical turbine
Modern Development
33
7
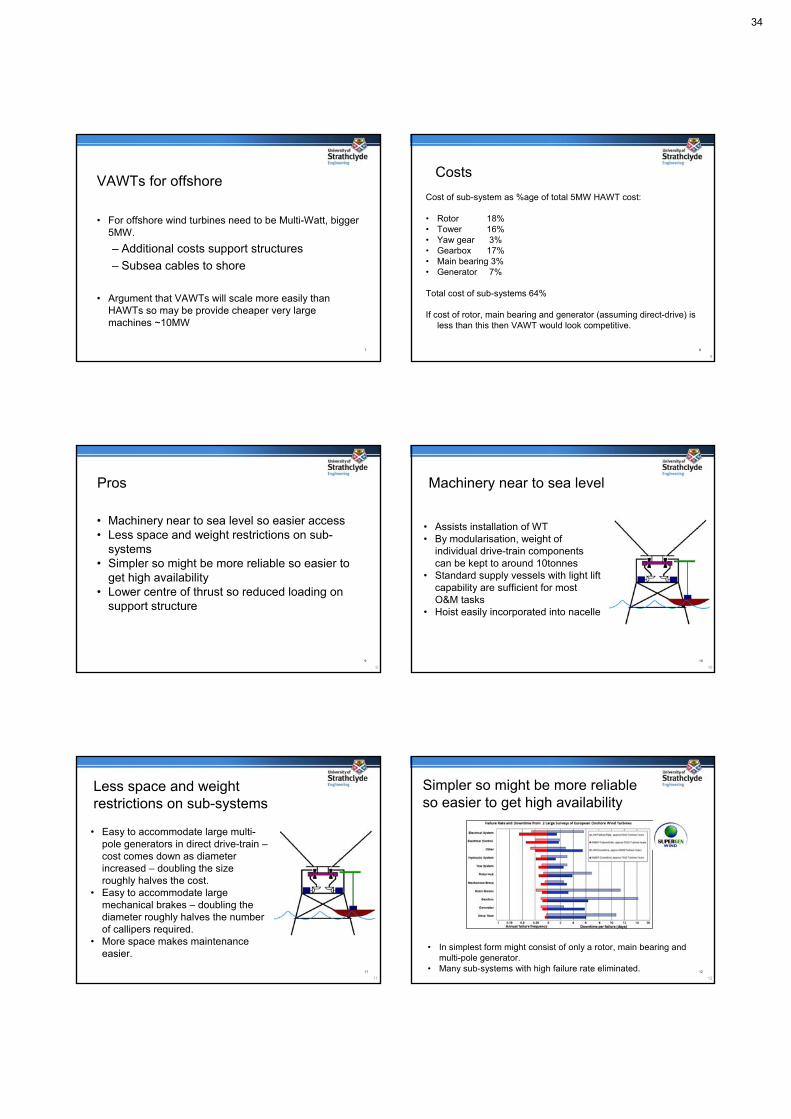
VAWTs for offshore
• For offshore wind turbines need to be Multi-Watt, bigger 5MW.
– Additional costs support structures
– Subsea cables to shore
• Argument that VAWTs will scale more easily than HAWTs so may be provide cheaper very large machines ~10MW
8
8
Costs
Cost of sub-system as %age of total 5MW HAWT cost:
• Rotor 18%• Tower 16%• Yaw gear 3%• Gearbox 17%• Main bearing 3%• Generator 7%
Total cost of sub-systems 64%
If cost of rotor, main bearing and generator (assuming direct-drive) is less than this then VAWT would look competitive.
9
9
Pros
• Machinery near to sea level so easier access• Less space and weight restrictions on sub-
systems• Simpler so might be more reliable so easier to
get high availability• Lower centre of thrust so reduced loading on
support structure
10
10
Machinery near to sea level
• Assists installation of WT• By modularisation, weight of
individual drive-train components can be kept to around 10tonnes
• Standard supply vessels with light lift capability are sufficient for most O&M tasks
• Hoist easily incorporated into nacelle
11
11
Less space and weight restrictions on sub-systems
• Easy to accommodate large multi-pole generators in direct drive-train –cost comes down as diameter increased – doubling the size roughly halves the cost.
• Easy to accommodate large mechanical brakes – doubling the diameter roughly halves the number of callipers required.
• More space makes maintenance easier.
12
12
Simpler so might be more reliable so easier to get high availability
• In simplest form might consist of only a rotor, main bearing andmulti-pole generator.
• Many sub-systems with high failure rate eliminated.
34
13
13
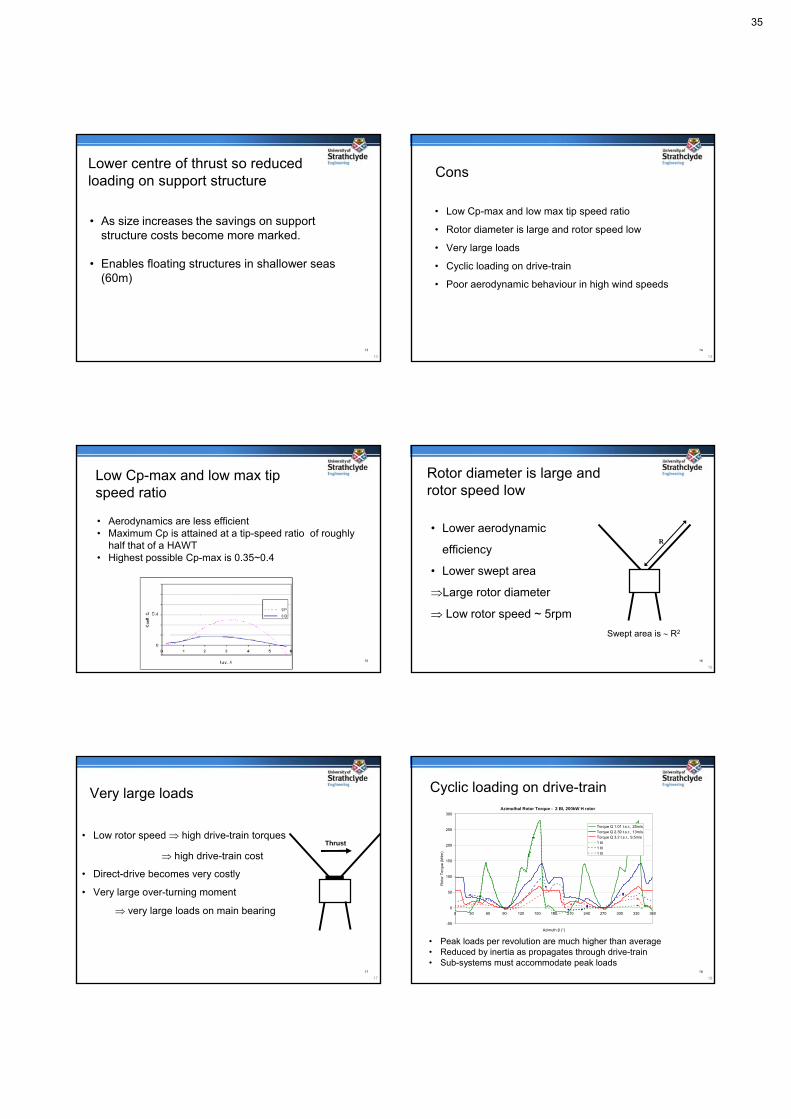
Lower centre of thrust so reduced loading on support structure
• As size increases the savings on support structure costs become more marked.
• Enables floating structures in shallower seas (60m)
14
14
Cons
• Low Cp-max and low max tip speed ratio
• Rotor diameter is large and rotor speed low
• Very large loads
• Cyclic loading on drive-train
• Poor aerodynamic behaviour in high wind speeds
15
Low Cp-max and low max tip speed ratio
• Aerodynamics are less efficient• Maximum Cp is attained at a tip-speed ratio of roughly
half that of a HAWT• Highest possible Cp-max is 0.35~0.4
16
16
Rotor diameter is large and rotor speed low
• Lower aerodynamic
efficiency
• Lower swept area
Large rotor diameter
Low rotor speed ~ 5rpm
Swept area is R2
R
17
17
Very large loads
• Low rotor speed high drive-train torques
high drive-train cost
• Direct-drive becomes very costly
• Very large over-turning moment
very large loads on main bearing
Thrust
18
18
Cyclic loading on drive-trainAzimuthal Rotor Torque - 2 Bl, 200kW H rotor
-50
0
50
100
150
200
250
300
0 30 60 90 120 150 180 210 240 270 300 330 360
Azimuth β (°)
Rot
or
To
rqu
e (k
Nm
)
Torque Q 1.01 t.s.r., 25m/sTorque Q 2.39 t.s.r., 13m/sTorque Q 3.2 t.s.r., 9.5m/s1 bl1 bl1 bl
• Peak loads per revolution are much higher than average• Reduced by inertia as propagates through drive-train• Sub-systems must accommodate peak loads
35
19
19
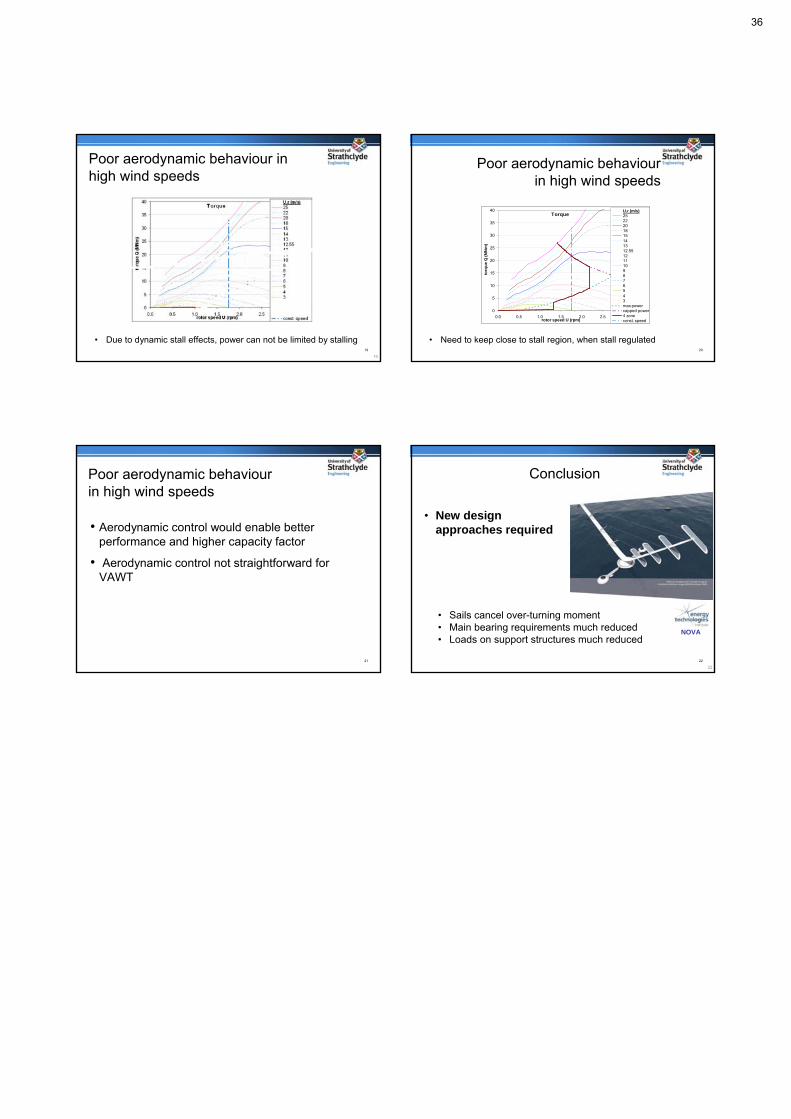
Poor aerodynamic behaviour in high wind speeds
• Due to dynamic stall effects, power can not be limited by stalling20
Poor aerodynamic behaviour in high wind speeds
Torque
0
5
10
15
20
25
30
35
40
0.0 0.5 1.0 1.5 2.0 2.5 3.0rotor speed U (rpm)
torq
ue
Q (
MN
m)
U.r (m/s)2522201815141312.551211109876543max powercapped power4 zoneconst. speed
• Need to keep close to stall region, when stall regulated
21
Poor aerodynamic behaviour in high wind speeds
• Aerodynamic control would enable better performance and higher capacity factor
• Aerodynamic control not straightforward for VAWT
22
22
Conclusion
NOVA
• Sails cancel over-turning moment• Main bearing requirements much reduced• Loads on support structures much reduced
• New design approaches required
36
1
Classification: Internal Status: Draft
HYWINDCONCEPT, INSTALLATION, AND SAMPLE FULL SCALE RESULTS
Classification: Internal Status: Draft
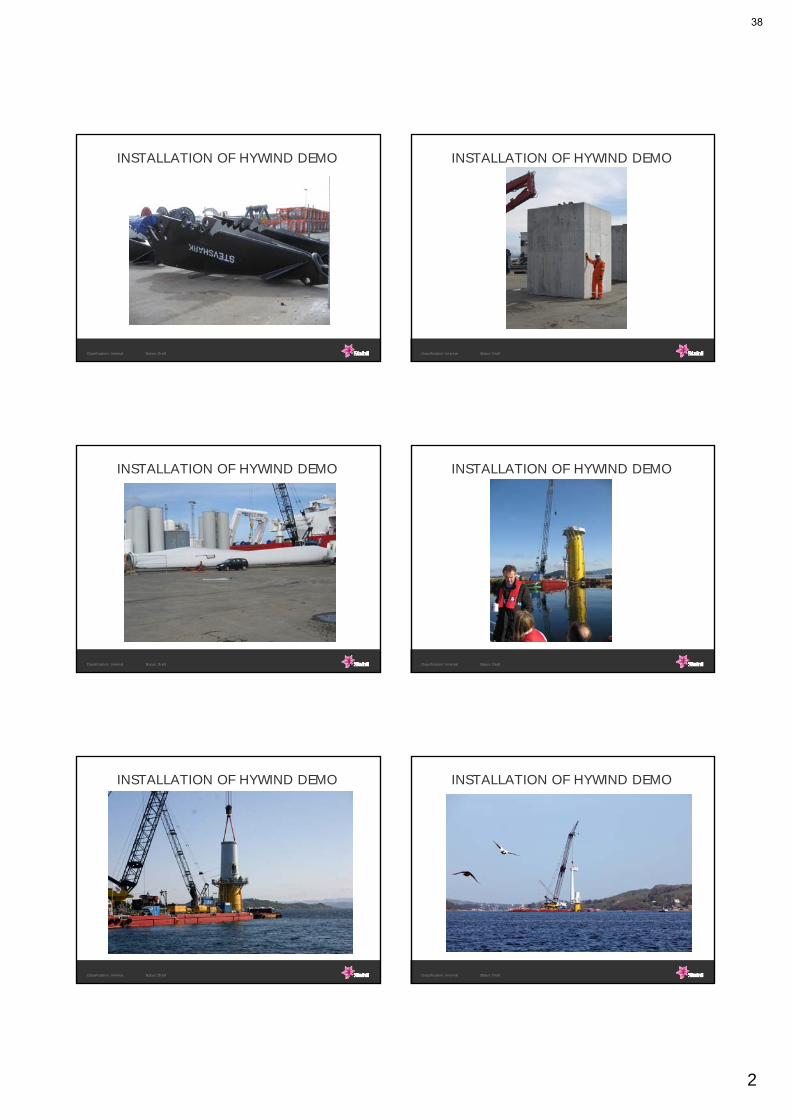
THE HYWIND CONCEPT
Main particulars for HYWIND Demo
Turbine power : 2.3 MWTurbine weight : 138 tonsDraft hull : 100 mNacelle height : 65 mRotor diameter : 82.4 mWater depth : 150–700 mDisplacement : 5300 tMooring : 3 linesDiameter at water line: 6 mDiam. submerged body: 8,3 m
Classification: Internal Status: Draft
DYNAMIC CHALLENGESDYNAMIC CHALLENGES
Classification: Internal Status: Draft
ANALYSIS TOOLS
- Simo-Riflex-Hawc2 (Marintek / Risø)
- Hawc2 Offshore (Risø)
- Bhawc (Siemens Wind Power)
- Flex5 (Stig Øye / Statoil)
- Simo-Riflex-TDHMill (Marintek / Statoil)
Classification: Internal Status: Draft
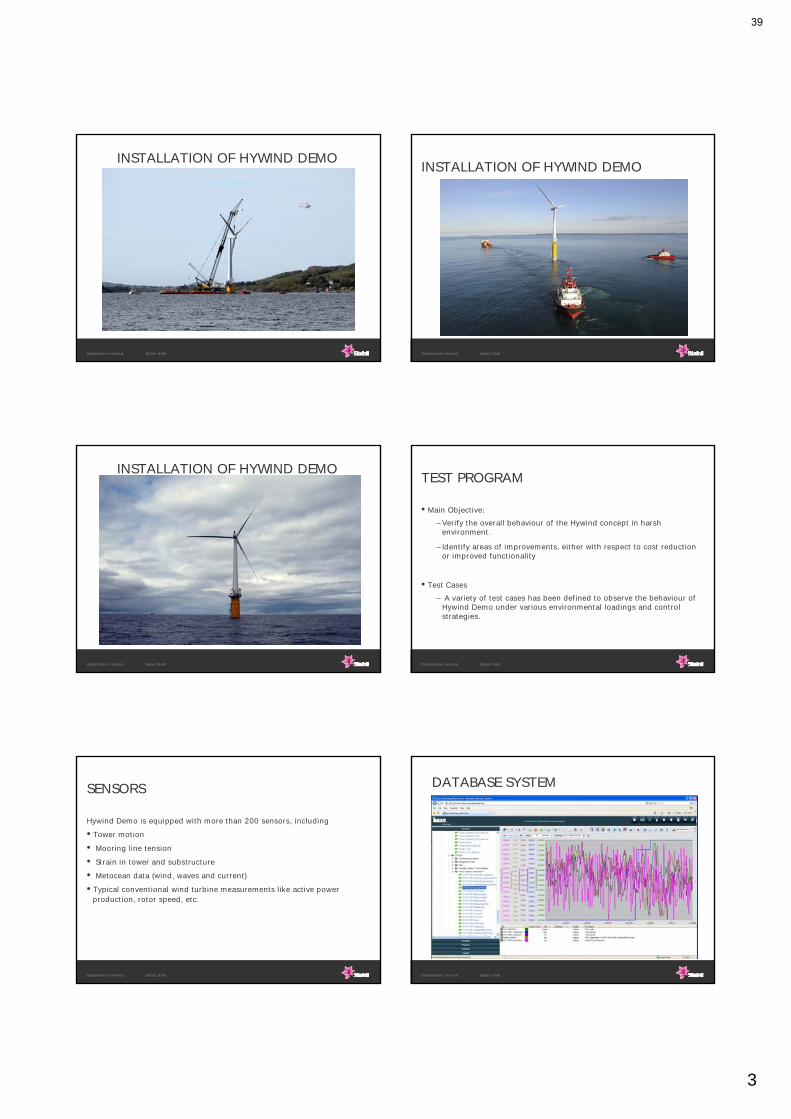
SIMULATION EXAMPLE
0 100 200 300 400 500 6000
5
10
15
20
25
30Case 6 vs case 7
time [s]
nace
lle m
otio
n [m
]
conventional
estimator based
Hs = 5m, Tp = 12 s, Wsp = 17 m/s, Tint = 12 %
2,4Estimator Based Control
Strategy
16,7Conventional Control Strategy
1Reference Case: Waves
Only
Relative Damage on Tower
Classification: Internal Status: Draft
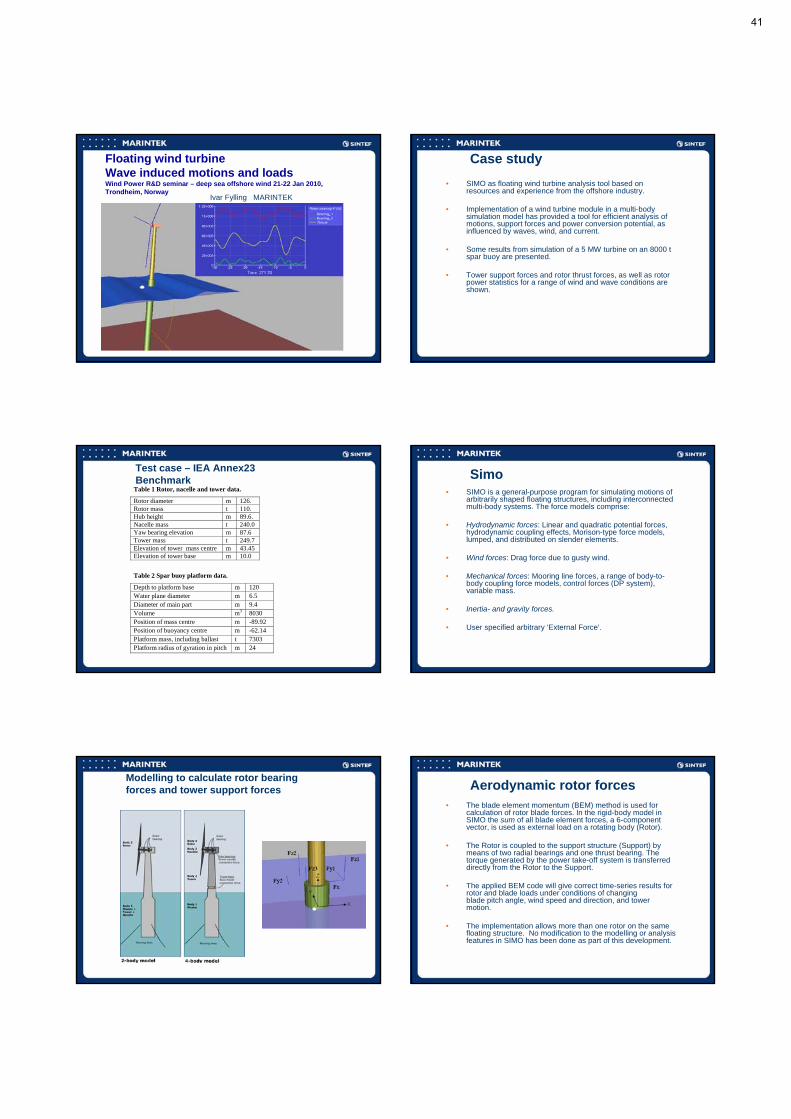
INSTALLATION OF HYWIND DEMO
37
2
Classification: Internal Status: Draft
INSTALLATION OF HYWIND DEMO
Classification: Internal Status: Draft
INSTALLATION OF HYWIND DEMO
Classification: Internal Status: Draft
INSTALLATION OF HYWIND DEMO
Classification: Internal Status: Draft
INSTALLATION OF HYWIND DEMO
Classification: Internal Status: Draft
INSTALLATION OF HYWIND DEMO
Classification: Internal Status: Draft
INSTALLATION OF HYWIND DEMO
38
3
Classification: Internal Status: Draft
INSTALLATION OF HYWIND DEMO
Classification: Internal Status: Draft
INSTALLATION OF HYWIND DEMO
Classification: Internal Status: Draft
INSTALLATION OF HYWIND DEMO
Classification: Internal Status: Draft
TEST PROGRAM
•Main Objective:
– Verify the overall behaviour of the Hywind concept in harsh environment.
– Identify areas of improvements, either with respect to cost reduction or improved functionality
•Test Cases
– A variety of test cases has been defined to observe the behaviour of Hywind Demo under various environmental loadings and control strategies.
Classification: Internal Status: Draft
SENSORS
Hywind Demo is equipped with more than 200 sensors, including
•Tower motion
• Mooring line tension
• Strain in tower and substructure
• Metocean data (wind, waves and current)
•Typical conventional wind turbine measurements like active powerproduction, rotor speed, etc.
Classification: Internal Status: Draft
DATABASE SYSTEM
39

4
Classification: Internal Status: Draft
OPERATIONS
•The first 2-3 months of operation can be considered as a start-up phasewhere the turbine has been through a type testing procedure
•The turbine has only been operated during online monitoring from theHywind Operations Rooom during this start-up phase .
•Since December 23rd 2009, Hywind Demo has been on automatic operating mode at its rated power (2.3 MW) for average wind speeds up to 18 m/s.
•Since January 15th 2010, Hywind Demo has been on automatic operating mode for all wind speeds.
Classification: Internal Status: Draft
SAMPLE FULL SCALE MEASUREMENTS
•Tower Motions & Power Production
0 200 400 600 800 1000 1200 1400 1600 18000.94
0.95
0.96
0.97
0.98
0.99
1
1.01
1.02
1.03
1.04
time [s]
pow
er /
mea
n(po
wer
) [-
]
ACTIVE POWER PRODUCTION
0 200 400 600 800 1000 1200 1400 1600 1800-1
-0.5
0
0.5
1
1.5
2
2.5
3
time [s]
tow
er p
itch
angl
e /
mea
n(to
wer
pitc
h an
gle)
[-]
TOWER PITCH ANGLE
controller tuned
controller not tuned
Classification: Internal Status: Draft
SAMPLE FULL SCALE MEASUREMENTS
•Rotor Speed & Blade Pitch Angle
0 200 400 600 800 1000 1200 1400 1600 18000.96
0.97
0.98
0.99
1
1.01
1.02
1.03
1.04
1.05
time [s]
roto
r sp
eed
/ m
ean(
roto
r sp
eed)
[-]
ROTOR SPEED
0 200 400 600 800 1000 1200 1400 1600 18000
0.5
1
1.5
time [s]
blad
e pi
tch
angl
e /
mea
n(bl
ade
pitc
h an
gle)
[-]
BLADE PITCH ANGLE
Classification: Internal Status: Draft
FURTHER WORK
•The test program continues until October 2011.
•Systematic and detailed analysis of measurements with comparisons to corresponding dynamic simulations.
•Testing and analysis of different floater motion controllers.
• Optimization of the Hywind substructure.
Classification: Internal Status: Draft
Thank you !
Contributors: Bjørn Skaare, Tor David Hanson, Rune Yttervik, Finn Gunnar Nielsen, and Andreas Knauer.
40
Floating wind turbineWave induced motions and loadsWind Power R&D seminar – deep sea offshore wind 21-22 Jan 2010, Trondheim, Norway
Ivar Fylling MARINTEK
Case study
• SIMO as floating wind turbine analysis tool based on resources and experience from the offshore industry.
• Implementation of a wind turbine module in a multi-body simulation model has provided a tool for efficient analysis of motions, support forces and power conversion potential, as influenced by waves, wind, and current.
• Some results from simulation of a 5 MW turbine on an 8000 t spar buoy are presented.
• Tower support forces and rotor thrust forces, as well as rotor power statistics for a range of wind and wave conditions are shown.
Test case – IEA Annex23 Benchmark
Table 1 Rotor, nacelle and tower data.
Rotor diameter m 126. Rotor mass t 110. Hub height m 89.6. Nacelle mass t 240.0 Yaw bearing elevation m 87.6 Tower mass t 249.7 Elevation of tower mass centre m 43.45 Elevation of tower base m 10.0
Table 2 Spar buoy platform data.
Depth to platform base m 120 Water plane diameter m 6.5 Diameter of main part m 9.4 Volume m3 8030 Position of mass centre m -89.92 Position of buoyancy centre m -62.14 Platform mass, including ballast t 7303 Platform radius of gyration in pitch m 24
Simo• SIMO is a general-purpose program for simulating motions of
arbitrarily shaped floating structures, including interconnectedmulti-body systems. The force models comprise:
• Hydrodynamic forces: Linear and quadratic potential forces, hydrodynamic coupling effects, Morison-type force models, lumped, and distributed on slender elements.
• Wind forces: Drag force due to gusty wind.
• Mechanical forces: Mooring line forces, a range of body-to-body coupling force models, control forces (DP system), variable mass.
• Inertia- and gravity forces.
• User specified arbitrary ‘External Force’.
Modelling to calculate rotor bearingforces and tower support forces Aerodynamic rotor forces
• The blade element momentum (BEM) method is used for calculation of rotor blade forces. In the rigid-body model in SIMO the sum of all blade element forces, a 6-component vector, is used as external load on a rotating body (Rotor).
• The Rotor is coupled to the support structure (Support) by means of two radial bearings and one thrust bearing. The torque generated by the power take-off system is transferred directly from the Rotor to the Support.
• The applied BEM code will give correct time-series results for rotor and blade loads under conditions of changing blade pitch angle, wind speed and direction, and tower motion.
• The implementation allows more than one rotor on the same floating structure. No modification to the modelling or analysis features in SIMO has been done as part of this development.
41

Hydrodynamic forces
1. The hydrodynamic loads comprise:2. Linear potential forces. Frequency dependent
excitation, added mass, and damping.3. Slow drift, 2nd order potential forces, as
frequency dependent drift force coefficients.4. Viscous drag forces on the spar buoy,
proportional with relative velocity squared.5. Linear damping coefficients in surge, sway,
heave, and yaw.6. The two first items were calculated by the
panel program WAMIT
Platform pitch -Time domain and frequency domain analysis
0
2
4
6
8
10
5 7 9 11 13 15 17Significant wave height, m
Pitc
h, 3
h m
ax,
deg
SIMO
MIMOSA
Rotor X-accelerations, 8 m/s wind
0
1
2
3
4
5
0 5 10 15
Significant wave height, m
X-acceleration, m/s^2 2B-Max 4B-Max 2B-St. dev.4B-St. dev.
Simulation model testing
-1.2
-0.8
-0.4
0.0
1000 s9008007006005004003002001000Time
Spar heave (m)
65
43
21
0
1000 s9008007006005004003002001000Time
Spar pitch (deg)
50
00
0
1000 s9008007006005004003002001000Time
Rotor power (kW)
Sample of time series of power and motion
Rotor power vs wave heightMean wind 8 m/s
0
1000
2000
3000
4000
5000
6000
4 6 8 10 12 14
Significant wave height, m
Rot
or p
ower
, kW
Max Mean Min St.Dev.
Rotor axial force vs wind speed6 m Hs waves
-200
300
800
1300
1800
5 10 15 20 25
Mean wind speed, m/s
Thr
ust
kN
Max Mean Min St.Dev.
Power vs wind speed6 m Hs waves
0
1000
2000
3000
4000
5000
6000
5 10 15 20
Mean wind speed, m/s
Po
we
r, k
W
Max Mean Min St.Dev.
Rotor axial force vs wave heightMean wind 8 m/s
-500
0
500
1000
1500
4 6 8 10 12 14
Significant wave height, m
Fo
rce
, kN
Max Mean Min St.Dev.
Tower base moment vs seastateMean wind 8 m/s
-150-100
-500
50100150200250
4 6 8 10 12 14
Significant wave height
Mo
me
nt,
MN
m
Max Mean Min St.Dev.
Tower base moment vs wind6 m Hs waves
-100-50
050
100150200250
5 10 15 20 25
Mean wind speed, m/s
Mo
men
t, M
Nm
Max Mean Min St.Dev.
Conclusions
Parameter variation analysis results for the test case indicate that
• The power production is weakly dependent on the seastate, except that power fluctuation increases with increasing wave height.
• The maximum bearing forces and tower support forces are mainly governed by wave induced pitch motions of the tower.
• The wave induced motions will have a dominating effect on rotor bearing forces and on tower support forces, but relatively small effect on the wind power absorption performance.
• It is the pitch motion of the spar buoy that appears to be the greatest challenge to the turbine bearing- and support structure design in this case. Accelerations in the range 0.3 -0.4 g, angles up to 8 deg in extreme waves.
42
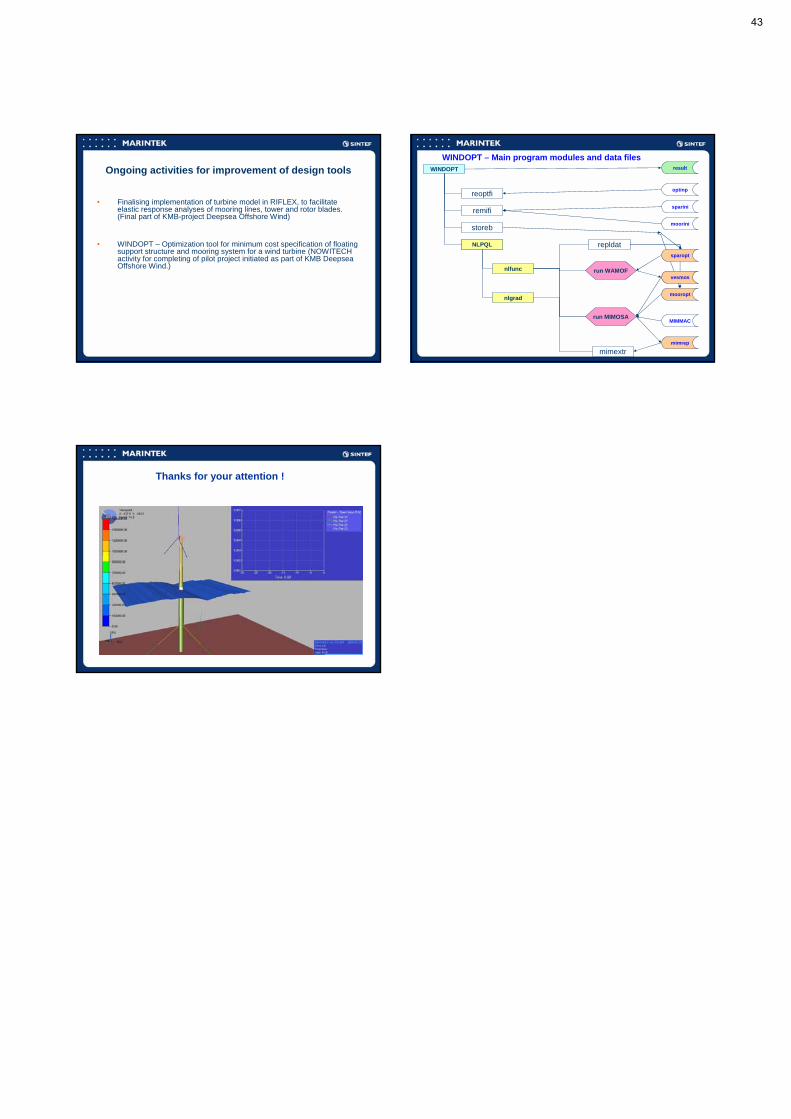
Ongoing activities for improvement of design tools
• Finalising implementation of turbine model in RIFLEX, to facilitate elastic response analyses of mooring lines, tower and rotor blades. (Final part of KMB-project Deepsea Offshore Wind)
• WINDOPT – Optimization tool for minimum cost specification of floating support structure and mooring system for a wind turbine (NOWITECH activity for completing of pilot project initiated as part of KMB DeepseaOffshore Wind.)
result
optinp
sparini
mooropt
mimrep
MIMMAC
vesmosrun WAMOF
run MIMOSA
reoptfi
remifi
storeb
WINDOPT
nlfunc
nlgrad
NLPQL
moorini
sparopt
mimextr
repldat
WINDOPT – Main program modules and data files
Thanks for your attention !
43

A2 New generator technology
Light-weight gear and generator technology (no presentation available). Bo Rohde Jensen, Senior Specialist, Vestas Wind Systems A/S Direct-drive generator and converter system, Prof Robert Nilssen, NTNU New gearbox technology, Lars Raunholt, Angle Wind AS Potential top-mass reduction by hydraulic transmission, Prof Ole G Dahlhaug, NTNU
44

1
Some generator alternatives forSome generator alternatives fordeep see offshore winddeep see offshore wind
Wind Power R&D seminar Wind Power R&D seminar –– deep sea offshore wind deep sea offshore wind
2121‐‐22 January 201022 January 2010Prof. Robert Nilssen, NTNU ElkraftProf. Robert Nilssen, NTNU Elkraft
2
Plan for this presentation
• PM-machines vs Induction machines in general
• Direct driven vs Geared systems
• Converters close to the generator
• Functional requrements important for choises
• Drives for research
3
Why focus on new PM-machine technology?
• Lower PM costs @
• Higher temperatures T >> 160
• Powerful magnetization
• For high efficiency
• High compactness– kW/m3
• Design flexibility – high pole numbers, low speed, large air gaps, lower tolerances
• Induction machines are more costly to produce than PM machines!
4
Induction machines more expansive than PM-machines??
• For the same speed and power
• PM cost 63% of Induction machines– Not proven claim
– For volume production
– Not in the marked today
– Based on material and labor cost evaluation
– Ref: Among several, ABB-designers focusing PM machines in the paper mill industry.
5
Is this reasonabel: Look at low cost pump applications
6
NTNU research Use half the length to get the same performance
45
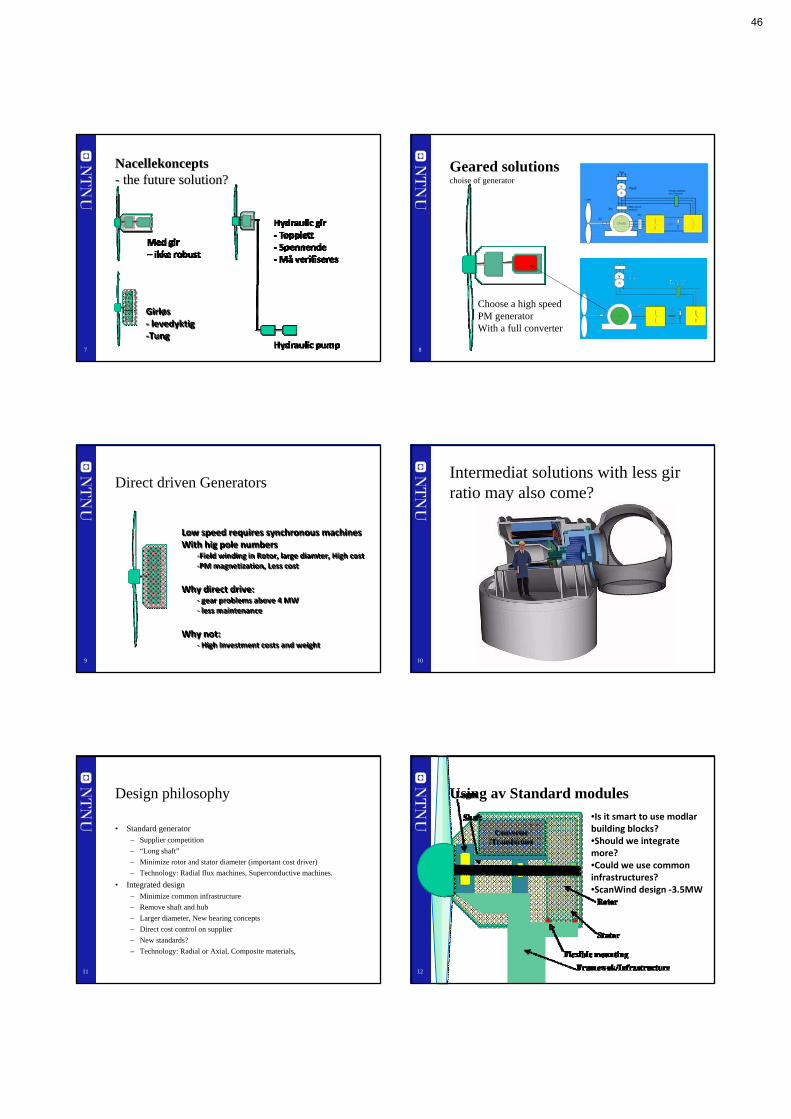
7
NacellekonceptsNacellekoncepts-- the future solution?the future solution?
Girløs ‐ levedyktig‐Tung
Girløs ‐ levedyktig‐Tung
8
Geared solutionschoise of generator
Choose a high speedPM generator With a full converter
9
Direct driven Generators
Low speed requires synchronous machines With hig pole numbers
‐Field winding in Rotor, large diamter, High cost‐PM magnetization, Less cost
Why direct drive:‐ gear problems above 4 MW‐ less maintenance
Why not: ‐ High Investment costs and weight
Low speed requires synchronous machines With hig pole numbers
‐Field winding in Rotor, large diamter, High cost‐PM magnetization, Less cost
Why direct drive:‐ gear problems above 4 MW‐ less maintenance
Why not: ‐ High Investment costs and weight
10
Intermediat solutions with less gir ratio may also come?
11
Design philosophy
• Standard generator– Supplier competition
– “Long shaft”
– Minimize rotor and stator diameter (important cost driver)
– Technology: Radial flux machines, Superconductive machines.
• Integrated design– Minimize common infrastructure
– Remove shaft and hub
– Larger diameter, New bearing concepts
– Direct cost control on supplier
– New standards?
– Technology: Radial or Axial, Composite materials,
12
Using av Standard modules
Converter /Transformer
Converter /Transformer
•Is it smart to use modlar building blocks?•Should we integrate more?•Could we use common infrastructures?•ScanWind design ‐3.5MW
46

13
More integration
Converter/Shaft
Converter/Shaft
Fixed shaftLess bearingsSimple frameEnercon – design
14
More integration
Con-verterTrafo
Con-verterTrafo
Inner statorSimple frames Large diameters
15
Expectations for new Expectations for new technologiestechnologies
16
Multidisc machines – the future high torque motor??!!
Fra NTNUs verksted
17
Compactness – weight reductio
Aktivt volum
3MW
Active volume
9MW
Stator
RotorShaft
”Old” solutionsRadial magn.PM‐generator
Radial magnetization
Axial magnetiszation
3MW
Stator
Rotor
New solutions Radial magn.PM‐generator
18
Expensive distributed windings for high pole number machines
Unique mobility
47
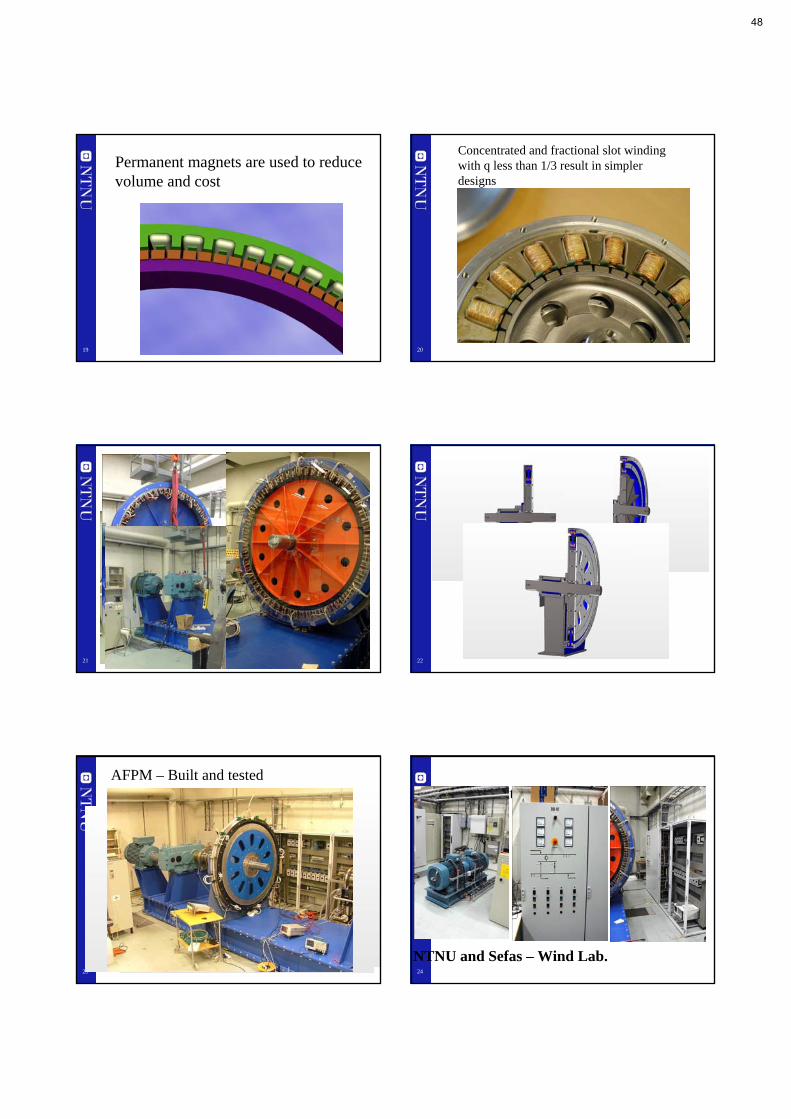
19
Permanent magnets are used to reduce volume and cost
20
Concentrated and fractional slot winding with q less than 1/3 result in simpler designs
21 22
23
Bygget!
AFPM – Built and tested
24
Infrastruktur
NTNU and Sefas – Wind Lab.
48
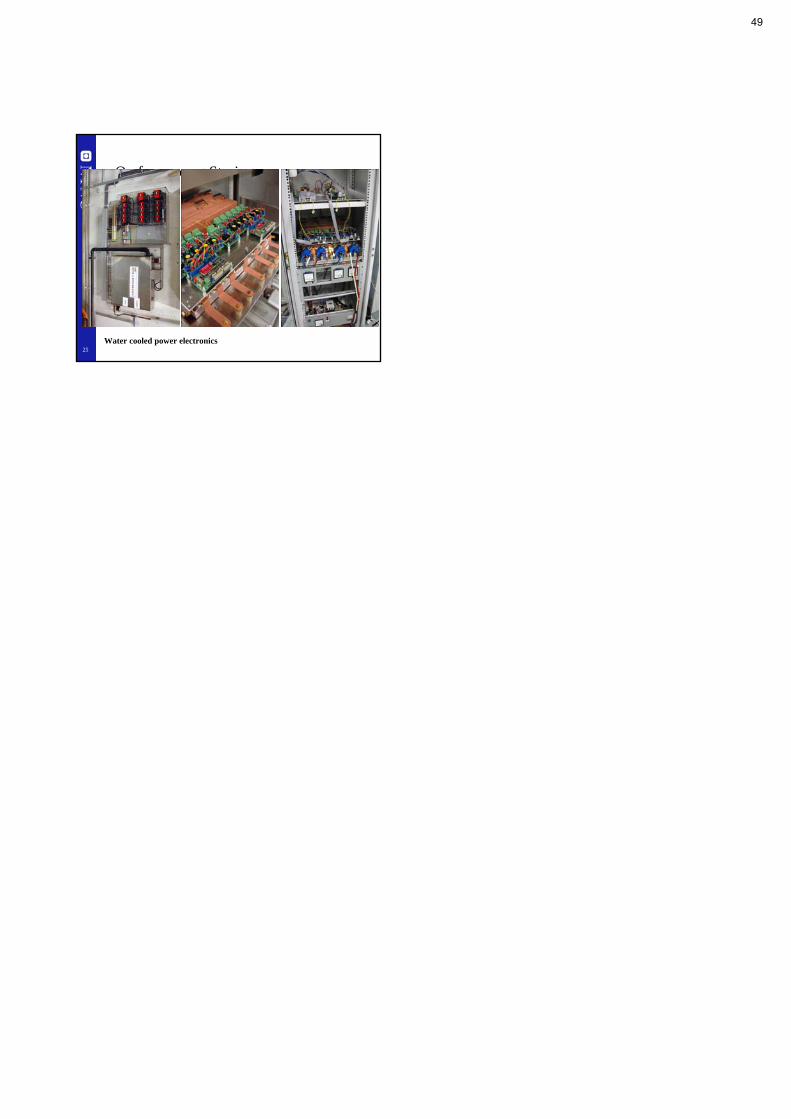
25
Omformere og Styring
Water cooled power electronics
49
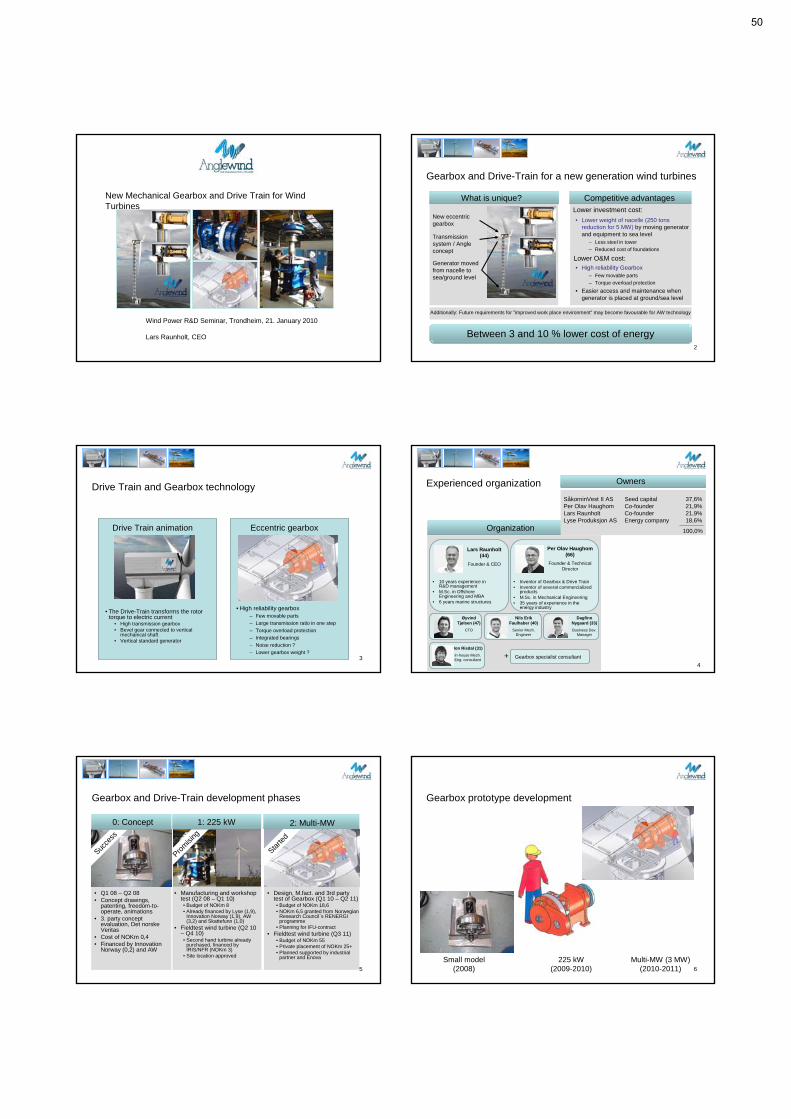
Wind Power R&D Seminar, Trondheim, 21. January 2010
Lars Raunholt, CEO
New Mechanical Gearbox and Drive Train for Wind Turbines
2
Gearbox and Drive-Train for a new generation wind turbines
New eccentric gearbox
Generator moved from nacelle to sea/ground level
What is unique? Competitive advantages
Transmission system / Angle concept
Lower investment cost:
Between 3 and 10 % lower cost of energy
Lower O&M cost:
Additionally: Future requirements for ”improved work place environment” may become favourable for AW technology
• Lower weight of nacelle (250 tons reduction for 5 MW) by moving generator and equipment to sea level
– Less steel in tower
– Reduced cost of foundations
• High reliability Gearbox – Few movable parts
– Torque overload protection
• Easier access and maintenance when generator is placed at ground/sea level
Drive Train and Gearbox technology
3
Drive Train animation Eccentric gearbox technology
• High reliability gearbox – Few movable parts
– Large transmission ratio in one step
– Torque overload protection
– Integrated bearings
– Noise reduction ?
– Lower gearbox weight ?
• The Drive-Train transforms the rotor torque to electric current
• High transmission gearbox• Bevel gear connected to vertical
mechanical shaft• Vertical standard generator
4
Experienced organization
Nils Erik Faulhaber (40)
Senior Mech. Engineer
Dagfinn Nygaard (33)
Business Dev. Manager
Lars Raunholt (44)
Founder & CEO
Per Olav Haughom (66)
Founder & Technical Director
• 10 years experience in R&D management
• M.Sc. in Offshore Engineering and MBA
• 6 years marine structures
• Inventor of Gearbox & Drive Train• Inventor of several commercialized
products• M.Sc. in Mechanical Engineering• 35 years of experience in the
energy industry
Øyvind Tjølsen (47)
CTO
Gearbox specialist consultant+
Organization
Jon Risdal (31)
In-house Mech. Eng. consultant
Owners
SåkorninVest II AS Seed capital 37,6%Per Olav Haughom Co-founder 21,9%Lars Raunholt Co-founder 21,9%Lyse Produksjon AS Energy company 18,6%
100,0%
Gearbox and Drive-Train development phases
5
• Q1 08 – Q2 08• Concept drawings,
patenting, freedom-to-operate, animations
• 3. party concept evaluation, Det norske Veritas
• Cost of NOKm 0,4• Financed by Innovation
Norway (0,2) and AW
Starte
d
• Design, M.fact. and 3rd party test of Gearbox (Q1 10 – Q2 11)• Budget of NOKm 18,6• NOKm 6,5 granted from Norwegian
Research Council`s RENERGI programme
• Planning for IFU-contract• Fieldtest wind turbine (Q3 11)
• Budget of NOKm 55• Private placement of NOKm 25+• Planned supported by industrial
partner and Enova
2: Multi-MW
Prom
ising
Succe
ss
1: 225 kW0: Concept
• Manufacturing and workshop test (Q2 08 – Q1 10)• Budget of NOKm 8• Already financed by Lyse (1,9),
Innovation Norway (1,9), AW (3,2) and Skattefunn (1,0)
• Fieldtest wind turbine (Q2 10 – Q4 10)• Second hand turbine already
purchased, financed by IRIS/NFR (NOKm 3)
• Site location approved
Gearbox prototype development
6
Small model(2008)
225 kW(2009-2010)
Multi-MW (3 MW)(2010-2011)
50

AW 225 kW Gearbox in‐house test setup
Frame similar to 225 kW turbine
225 kW generatorAW 225 kW gearbox
Motor/gear simulating rotor
Flange for rotor
Phase 1: 225 kW gearbox (IFU), Results
• Objective:– FAT test of 225 kW eccentric gearbox before
field test in wind turbine
• Test results– ”Torsional Vibrations Measurements” by DnV,
performed in order to determine the torsional natural frequencies of the gear, and to tune DnV’s torsional calculations model.
– ”Field balancing of the gear” by DNV, to verify calculations regarding eccentric weights.
– Temparature rise logged to verify efficiency estimations.
– Vibrations logged with SKF Windcon.
– Low noise levels observed
– All tests performed with good and promising results.
– One third party test to be performed before installation in 225 kW turbine
8
Field test of gearbox in IRIS 225 kW turbine
9
Phase 2: Multi-MW gearbox (RENERGI)
• Upscale study 3, 6 and 8 MW
• Optimization, simulations, FMECA
• Manufacture, assembly and workshop function test of 3 MW gearbox (Norway)
• 3. party 2-week full-power test (International)
• Supported by the Norwegian Research Councils RENERGI programme
10
3 MW demonstration with strategic industrial partner
• Energy company in Rogaland– Revenue 2008, NOKm 4 395
– Operating profit 2008, NOKm 2 445
• Planned wind projects:– Kvitsøy, Utsira and other demo sites
– Partner in Skinansfjellet (90 MW) and Bjerkreim (150 MW)
– Utsira, 280 MW deep offshore
– South North-Sea, 1000 MW, offshore
11
Lyse Energy
3 MW turbine demo
• Lyse Energy is applying NVE
• AW to submit application to Enova
• 3 MW gearbox field test planned for Q3 11
Kvitsøy demo site
Bjerkreim, 150 MW
South North-Sea, 1000 MW
Skinansfjellet, 90 MW
Utsira demo site
Animation of eccentric gearbox in 225 kW turbine
12www.anglewind.no
51

1
Potential top-mass reduction by hydraulic transmission
By Ole Gunnar Dahlhaug
The Norwegian University of Science and Technology
Wind Power R&D seminarTrondheim, 21st – 22nd January 2010
2
SPEED n 20 17 13 5 – 15 3 – 10 rpm
3
Ref: Wind Turbine Market 2008Todays Energy Sollutions (tes.texterity.com)
0
100
200
300
400
500
600
0 1 2 3 4 5 6
Wind turbine rated power output [MW]
Top‐m
ass [ton]
Gearbox
Gearless
Wind Turbine Top-Mass Development
4
Wind Turbine Technology is changing
High top weight Low top weightInduction Generator Synchronous generator
Mechanical Gearbox Gearless
Standard Gearbox
Direct drive
Hybrid1:10 gear
+“Direct drive”
HybridGearbox
+Hydraulic
Hydraulic transmission
Commercial Yes Yes Yes Yes No
Market share 84 % 15% < 1% < 1 % -
Top weight, 5MW > 350 ton > 500 ton 310 ton - < 200 ton
Eliminates gearbox No Yes Partly No Yes
Generator Induction Synchronous Synchronous Synchronous Synchronous
Leading Suppliers
Vestas, GE, Gamesa, Suzlon, Siemen
Enercon Multibrid DeWind ChapDrive
5
Hydraulic TransmissionHydraulic pump
Hydraulic motor
Hydraulic oil
Synchronous Generator
Transformer
6
Boost pump
Accumulator
Cooler
Generator
Hydraulic Transmission Features
• Low top-mass weight
• Variable speed on the Turbine shaft
• Constant speed on the Generator shaft
• Dampened torque fluctuation on the generator shaft
• Hydraulic brake
• Control system
52
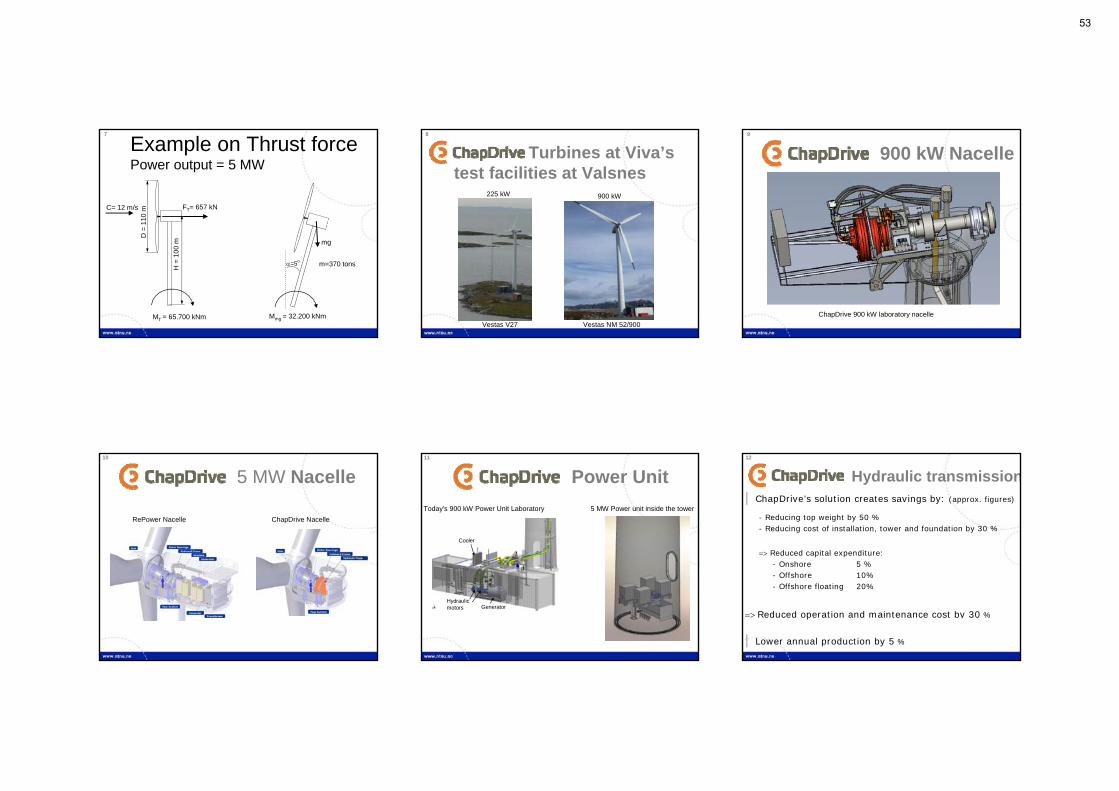
7
Example on Thrust forcePower output = 5 MW
C= 12 m/s FT= 657 kN
D =
11
0 m
H =
10
0 m
MT = 65.700 kNm
=5o
mg
Mmg = 32.200 kNm
m=370 tons
8
Turbines at Viva’s test facilities at Valsnes
225 kW 900 kW
Vestas V27 Vestas NM 52/900
9
900 kW Nacelle
ChapDrive 900 kW laboratory nacelle
10
5 MW Nacelle
RePower Nacelle ChapDrive Nacelle
11
Power Unit
GeneratorHydraulic motors
Cooler
Today's 900 kW Power Unit Laboratory 5 MW Power unit inside the tower
12
Hydraulic transmission| ChapDrive’s solution creates savings by: (approx. figures)
- Reducing top weight by 50 %- Reducing cost of installation, tower and foundation by 30 %
Reduced capital expenditure:- Onshore 5 %- Offshore 10%- Offshore floating 20%
Reduced operation and maintenance cost by 30 %
| Lower annual production by 5 %
53
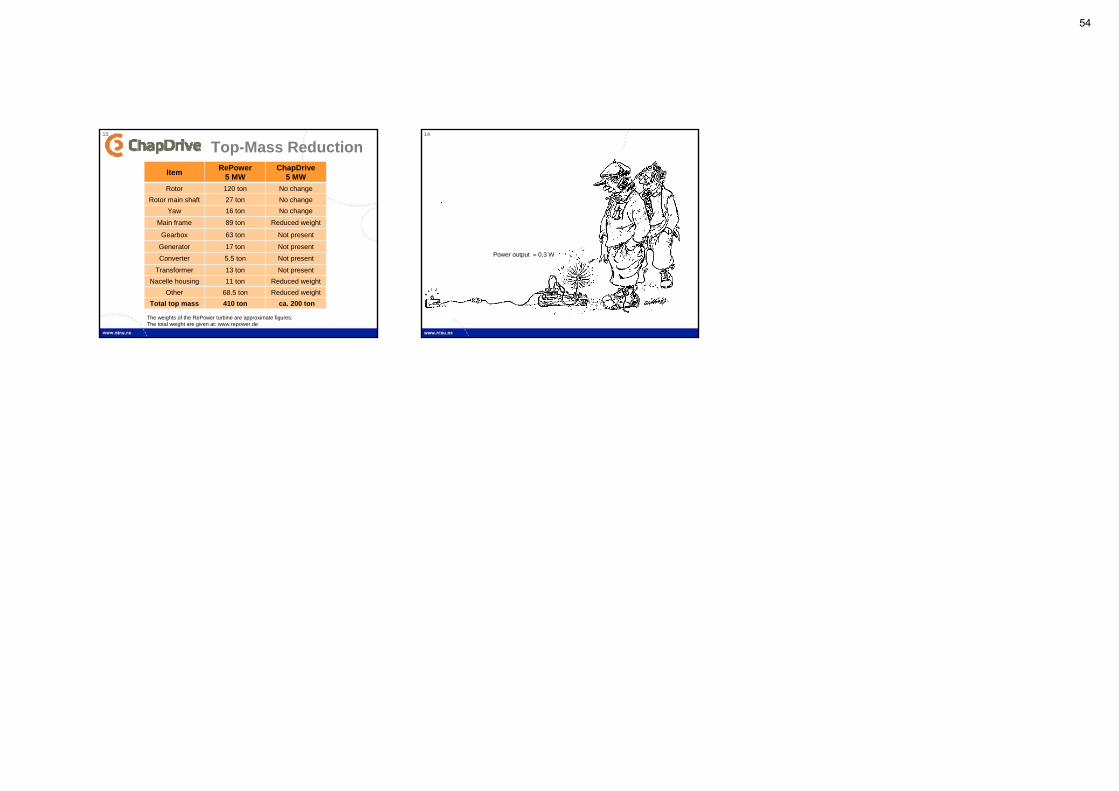
13
Top-Mass Reduction
ItemRePower
5 MWChapDrive
5 MW
Rotor 120 ton No change
Rotor main shaft 27 ton No change
Yaw 16 ton No change
Main frame 89 ton Reduced weight
Gearbox 63 ton Not present
Generator 17 ton Not present
Converter 5.5 ton Not present
Transformer 13 ton Not present
Nacelle housing 11 ton Reduced weight
Other 68.5 ton Reduced weight
Total top mass 410 ton ca. 200 ton
The weights of the RePower turbine are approximate figures.The total weight are given at: www.repower.de
14
Power output 0,3 W
54

B1 Power System integration Prospects for new cross-border connectors, Kjartan Hauglum, Statnett Optimal design of a North-Sea offshore grid, Thomas Trötscher, SINTEF Power market analysis of large-scale offshore wind, Magnus Korpås, SINTEF Power fluctuations from offshore wind farms, Prof Poul Sørensen, Risø DTU Cost of balancing large-scale wind generation, Prof Lennart Söder, KTH
55
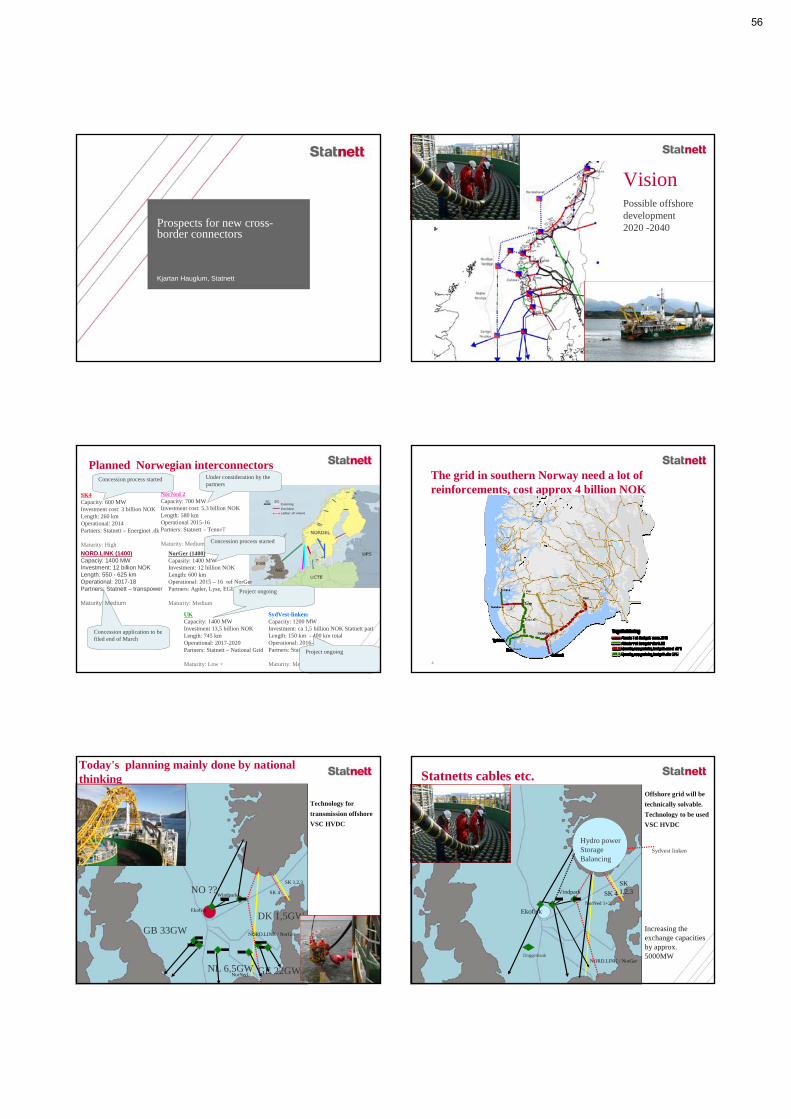
Prospects for new cross-border connectors
Kjartan Hauglum, Statnett
27. januar 2010 2
VisionPossible offshore development 2020 -2040
AAa
Concession process started
Concession application to be filed end of March
SK4Capacity: 600 MWInvestment cost: 3 billion NOKLength: 260 kmOperational: 2014Partners: Statnett – Energinet .dk
Maturity: High
Planned Norwegian interconnectors
UKCapacity: 1400 MWInvestment 13,5 billion NOKLength: 745 kmOperational: 2017-2020Partners: Statnett – National Grid
Maturity: Low +
NorNed 2Capacity: 700 MWInvestment cost: 5,3 billion NOKLength: 580 kmOperational 2015-16Partners: Statnett – TenneT
Maturity: Medium +
NORD.LINK (1400)Capaciy: 1400 MWInvestment: 12 billion NOKLength: 550 - 625 kmOperational: 2017-18Partners: Statnett – transpower
Maturity: Medium
NorGer (1400)Capasity: 1400 MWInvestment: 12 billion NOKLength: 600 kmOperational: 2015 – 16 ref NorGerPartners: Agder, Lyse, EGL
Maturity: Medium
SydVest-linken:Capacity: 1200 MWInvestment: ca 1,5 billion NOK Statnett partLength: 150 km - 400 km totalOperational: 2016-2020Partners: Statnett – Svenska Kraftnett
Maturity: Medium
Under consideration by the partners
Project ongoing
Project ongoing
Concession process started
The grid in southern Norway need a lot of reinforcements, cost approx 4 billion NOK
4
SK 1,2,3
NorNed
SK 4
NORD.LINK / NorGer
Ekofisk
Windpark
Today's planning mainly done by national thinking
Technology for
transmission offshore
VSC HVDC
GB 33GW
NL 6,5GW
NO ??
GE 22GW
DK 1,5GW
SK 1,2,3
NorNed 1+2
SK 4
NORD.LINK / NorGer
Ekofisk
Vindpark
Statnetts cables etc.Offshore grid will be
technically solvable.
Technology to be used
VSC HVDC
Increasing the exchange capacities by approx. 5000MW
Hydro powerStorage Balancing
Doggerbank
Sydvest linken
56

2010-01-27 7
What offshore grid/”supergrid”?
Sources: DG-TREN,3E/Greenpeace, TradeWind & Office of Metropolitan Architects (OMA), Imera, Mainstream Renewable Power, Adamowitsch, Supersmartgrid.net, Desertec 2010-01-27 8
Statnetts R&D on a possible offshore node
A
Development of interconnectors and a possible future grid
• TSO cooperation thru ENTSO-E, flexible regulators and political willingness• A possible grid will emerge as modules from national wind clusters and or new
interconnectors
• Interconnector technology
• VSC HVDC, recommended solution, supplier interface needed
• Voltage level, to be agreed
• CIGRE to develop standards
• R&D development needed
• Multi-terminals, DC breakers
• Increased capacity and reduced losses
• Trading and balancing
• European trading with renewables
• European balancing and storage
27. januar 2010 10
Offshore development in Norway as seen from the TSO
• Legal framework for offshore wind not yet approved, seems promising• Dedicated areas to be selected for wind production offshore
• Interconnector routing may be located close to selected areas
• Stepwise development
• Technology and standards need development
• Offshore wind, very limited development before 2020 in Norwegian sector
• Electrification of offshore oil and gas installations may be a driver
• Norway have not yet nominated an offshore TSO• May hamper overall planning and development offshore and coordination with onshore
Main message• Statnett has knowledge and experience to take an active role in
development of interconnectors and a possible future offshore grid in the North Sea
• VSC HVDC gives flexibility for the future, but more R&D is needed
• Offshore wind is not a driving force for a grid in Norwegian sector
• The value of flexible Norwegian hydropower for balancing and storage will increase with more interconnectors
• Norway has a large potential for onshore and offshore renewables if the market is willing to pay the cost, subsidies included
• Develop wind and small hydro onshore first
Statnett will by 2020 have the 5 planned interconnectors in operation
27. januar 2010 11 27. januar 2010 12
VisionOffshore 2020 -2040
AAa
Thanks for listening
57

SINTEF Energy Research 1
T. Trötscher, M. Korpås
SINTEF Energy Research AS
Optimal design of a subsea power grid in
the North Sea
SINTEF Energy Research 22
General problem description
~
~
~
? How to connect nodes with transmission lines to achieve optimal social benefit?
Problem: Connect off-shore wind farms to the on-shore grid and build interconnectors between countries
Objective: Maximize social economic benefit
Exogenous variables:
Capacity and location of offshore wind power clusters, possible land connection points, statistical description of wind and power prices, onshore grid equivalent, cost scenarios for grid infrastructure.
Unknowns: Where to build cables and with what power rating
Problem type:
This is a mixed integer problem which can be solved with a branch and bound algorithm
SINTEF Energy Research 3
Node configuration
DC-nodes AC-nodes
~
~=
~
~=
AC-side
DC-side
Connections to landand other nodes
~=
~=
~=
~=
~=
Connections to landand other nodes
SINTEF Energy Research 4
Example
~~
SINTEF Energy Research 5
Input data assumptions
Land connection nodes in relevant countries as latitude-longitude pairs Selected relevant connection points from the TradeWind project
Marginal cost of generation, generation capacities and time series of load. Official ENTSO-E scenarios, same as in TradeWind
Capacity and location of offshore wind power clusters Selected a few large clusters as identified in the TradeWind project
Existing exchange capacity between nodes Used the net transfer capacities as published by ENTSO-E
Cost scenarios for cables, converter stations, switchgear, and offshore platforms Adapted from the EU-IEE project WindSpeed. Work in progress.
Wind data Interpolated reanalysis data with added variations
Sources TradeWind http://www.trade-wind.eu/ WindSpeed http://www.windspeed.eu/
SINTEF Energy Research 6
0 20 40 60 80 1000
0.2
0.4
0.6
0.8
1
No
rmal
ize
d w
ind
far
m p
ow
er o
utp
ut
Percent of time
Sum wind power generation
0 5 10 15 20 25 30 350
0.2
0.4
0.6
0.8
1
Wind velocity [m/s]
Po
we
r [p
.u.]
0 20 40 60 80 100
5
10
15
20
25
30
Win
d v
elo
cit
y [m
/s]
Percent of time
Reanalysis wind velocity is used as basis Adjustment factors as described in the
TradeWind project are applied to better represent onshore and offshore wind conditions
A sample is drawn using empirical latin hypercube sampling Correlation in velocity is captured The sample size can be kept relatively small
Wind velocity is converted to power generation by applying a power curve Power curves are made to represent large
clusters Individual power curves are used for onshore
and offshore wind turbines
58
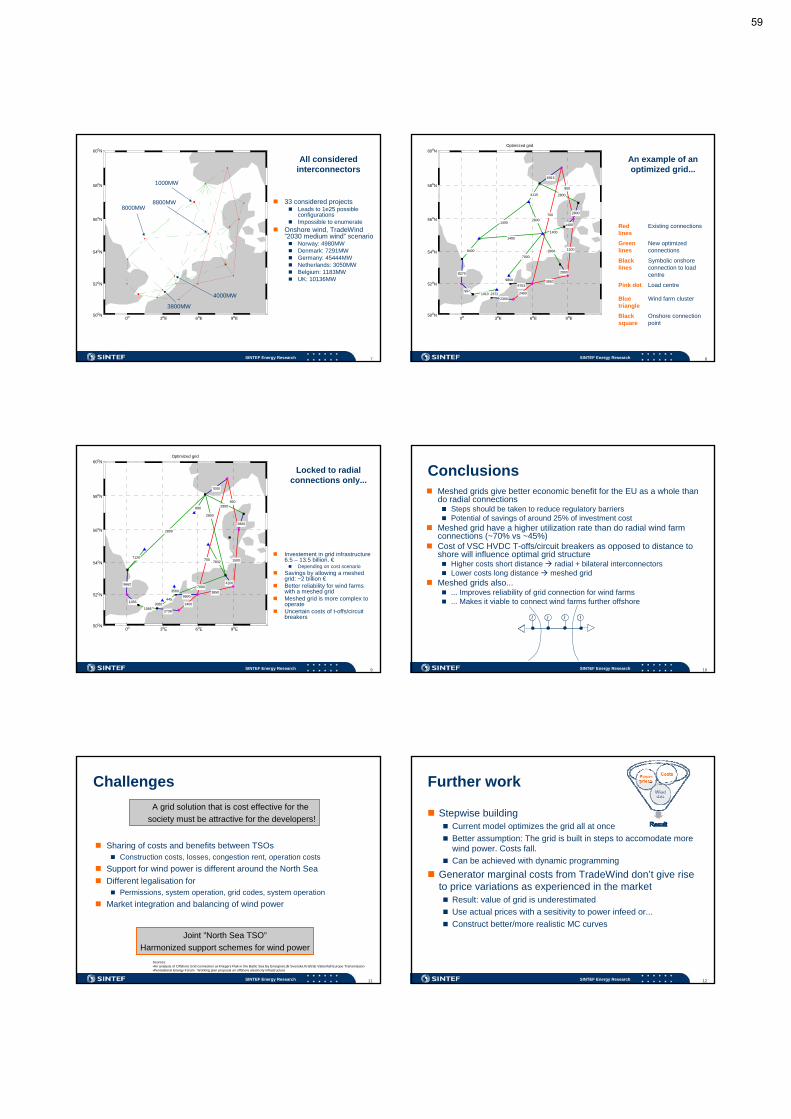
SINTEF Energy Research 7
All considered interconnectors
0o 3oE 6oE 9oE 50oN
52oN
54oN
56oN
58oN
60oN
33 considered projects Leads to 1e25 possible
configurations Impossible to enumerate
Onshore wind, TradeWind ”2030 medium wind” scenario Norway: 4980MW Denmark: 7291MW Germany: 45444MW Netherlands: 3050MW Belgium: 1183MW UK: 10136MW
1000MW
8000MW
4000MW
3800MW
8800MW
SINTEF Energy Research 8
Red lines
Existing connections
Green lines
New optimized connections
Black lines
Symbolic onshore connection to load centre
Pink dot Load centre
Blue triangle
Wind farm cluster
Black square
Onshore connection point
An example of anoptimized grid...
0o 3oE 6oE 9oE 50oN
52oN
54oN
56oN
58oN
60oN
1500
3850
2400
6915
2800
1400
2800
9753
8279
997
4115
14002800
1400
2800
7000
1400
1010
8400
Optimized grid
950
700
2360
2800
9800
2372
SINTEF Energy Research 9
0o 3oE 6oE 9oE 50oN
52oN
54oN
56oN
58oN
60oN
1500
3850
2400
7000
2800
4200
9800
2738
9662
1056
2800
7832
1066
7000
Optimized grid
950
700
2800
2800
890
3560
3382
7120
445
Locked to radial connections only...
Investement in grid infrastructure 6.5 – 13.5 billion. € Depending on cost scenario
Savings by allowing a meshed grid: ~2 billion €
Better reliability for wind farms with a meshed grid
Meshed grid is more complex to operate
Uncertain costs of t-offs/circuit breakers
SINTEF Energy Research 10
Conclusions Meshed grids give better economic benefit for the EU as a whole than
do radial connections Steps should be taken to reduce regulatory barriers Potential of savings of around 25% of investment cost
Meshed grid have a higher utilization rate than do radial wind farm connections (~70% vs ~45%)
Cost of VSC HVDC T-offs/circuit breakers as opposed to distance to shore will influence optimal grid structure Higher costs short distance radial + bilateral interconnectors Lower costs long distance meshed grid
Meshed grids also... ... Improves reliability of grid connection for wind farms ... Makes it viable to connect wind farms further offshore
~~ ~ ~
SINTEF Energy Research 11
Challenges
Sharing of costs and benefits between TSOs Construction costs, losses, congestion rent, operation costs
Support for wind power is different around the North Sea
Different legalisation for Permissions, system operation, grid codes, system operation
Market integration and balancing of wind power
A grid solution that is cost effective for the
society must be attractive for the developers!
Joint ”North Sea TSO”
Harmonized support schemes for wind power
Sources: •An analysis of Offshore Grid connection at Kriegers Flak in the Baltic Sea By Energinet.dk Svenska Kraftnät Vattenfall Europe Transmission•Pentalateral Energy Forum : Working plan proposal on offshore electricity infrastructure
SINTEF Energy Research 12
Further work
Stepwise building Current model optimizes the grid all at once
Better assumption: The grid is built in steps to accomodate morewind power. Costs fall.
Can be achieved with dynamic programming
Generator marginal costs from TradeWind don’t give rise to price variations as experienced in the market Result: value of grid is underestimated
Use actual prices with a sesitivity to power infeed or...
Construct better/more realistic MC curves
59
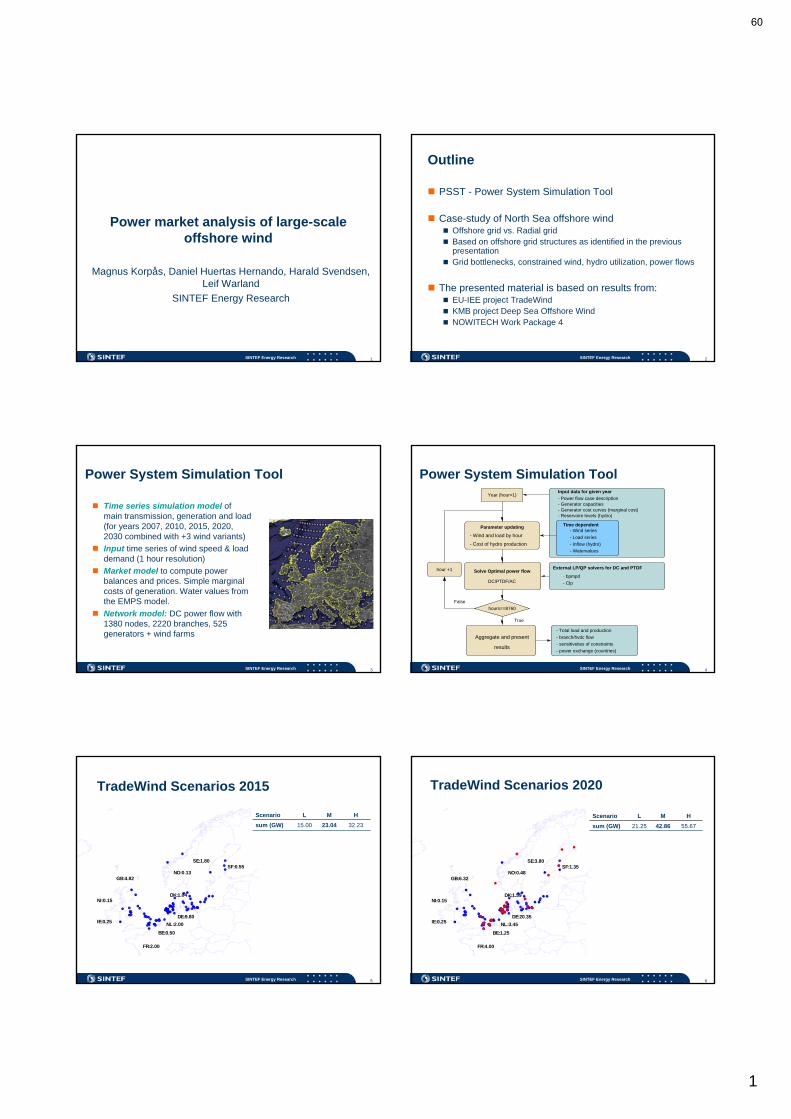
1
1SINTEF Energy Research
Power market analysis of large-scaleoffshore wind
Magnus Korpås, Daniel Huertas Hernando, Harald Svendsen, Leif Warland
SINTEF Energy Research
2SINTEF Energy Research
Outline
PSST - Power System Simulation Tool
Case-study of North Sea offshore wind Offshore grid vs. Radial grid Based on offshore grid structures as identified in the previous
presentation Grid bottlenecks, constrained wind, hydro utilization, power flows
The presented material is based on results from: EU-IEE project TradeWind KMB project Deep Sea Offshore Wind NOWITECH Work Package 4
3SINTEF Energy Research
Power System Simulation Tool
Time series simulation model of main transmission, generation and load (for years 2007, 2010, 2015, 2020, 2030 combined with +3 wind variants)
Input time series of wind speed & load demand (1 hour resolution)
Market model to compute power balances and prices. Simple marginal costs of generation. Water values from the EMPS model.
Network model: DC power flow with 1380 nodes, 2220 branches, 525 generators + wind farms
4SINTEF Energy Research
Power System Simulation Tool
results
Aggregate and present
- Cost of hydro production
- Wind and load by hour
hour +1
Year (hour=1)
DC/PTDF/AC
Solve Optimal power flow
Parameter updating
hours==8760
True
False
- Power flow case description
- Reservoire levels (hydro)
- Clp
- bpmpd
- Watervalues
- Load series
- Inflow (hydro)
- Generator capacities
Input data for given year
Time dependent
External LP/QP solvers for DC and PTDF
- sensitiveties of constraints
- Total load and production
- branch/hvdc flow
- power exchange (countries)
- Wind series
- Generator cost curves (marginal cost)
5SINTEF Energy Research
TradeWind Scenarios 2015
BE:0.50
DK:1.04
FR:2.00
DE:9.80
GB:4.82
NL:2.00
NO:0.13
SE:1.80SF:0.55
IE:0.25
NI:0.15
32.2323.0415.00sum (GW)
HMLScenario
6SINTEF Energy Research
TradeWind Scenarios 2020
BE:1.25
DK:1.59
FR:4.00
DE:20.35
GB:6.32
NL:3.45
NO:0.48
SE:3.80SF:1.35
IE:0.25
NI:0.15
55.6742.8621.25sum (GW)
HMLScenario
60
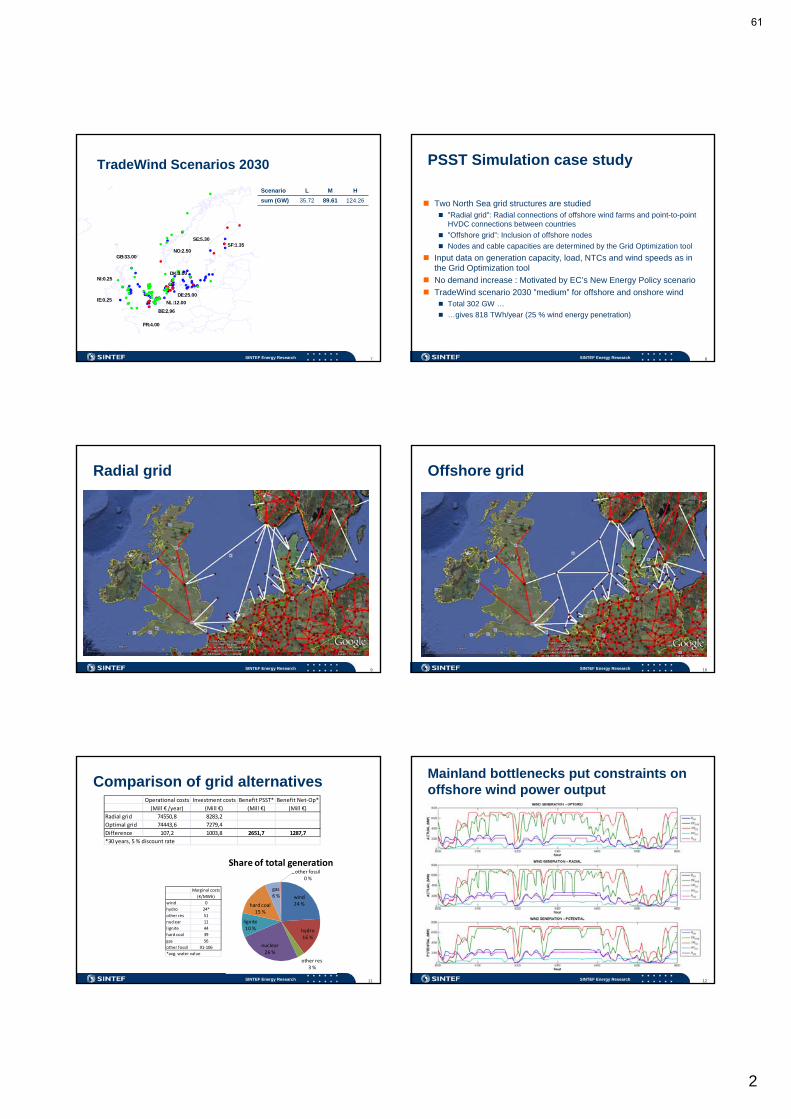
2
7SINTEF Energy Research
BE:2.96
DK:3.00
FR:4.00
DE:25.00
GB:33.00
NL:12.00
NO:2.50
SE:5.30SF:1.35
IE:0.25
NI:0.25
124.2689.6135.72sum (GW)
HMLScenario
TradeWind Scenarios 2030
8SINTEF Energy Research
PSST Simulation case study
Two North Sea grid structures are studied ”Radial grid”: Radial connections of offshore wind farms and point-to-point
HVDC connections between countries
”Offshore grid”: Inclusion of offshore nodes
Nodes and cable capacities are determined by the Grid Optimization tool
Input data on generation capacity, load, NTCs and wind speeds as in the Grid Optimization tool
No demand increase : Motivated by EC’s New Energy Policy scenario
TradeWind scenario 2030 ”medium” for offshore and onshore wind Total 302 GW …
…gives 818 TWh/year (25 % wind energy penetration)
9SINTEF Energy Research
Radial grid
10SINTEF Energy Research
Offshore grid
11SINTEF Energy Research
Comparison of grid alternativesOperational costs Investment costs Benefit PSST* Benefit Net‐Op*
(Mill € /year) (Mill €) (Mill €) (Mill €)
Radial grid 74550,8 8283,2
Optimal grid 74443,6 7279,4
Difference 107,2 1003,8 2651,7 1287,7
*30 years, 5 % discount rate
wind24 %
hydro16 %
other res3 %
nuclear26 %
lignite10 %
hard coal15 %
gas6 %
other fossil0 %
Share of total generation
Marginal costs
(€/MWh)
wind 0
hydro 24*
other res 51
nuclear 11
lignite 44
hard coal 39
gas 56
other fossil 91‐106
*avg. water value
12SINTEF Energy Research
Mainland bottlenecks put constraints onoffshore wind power output
61
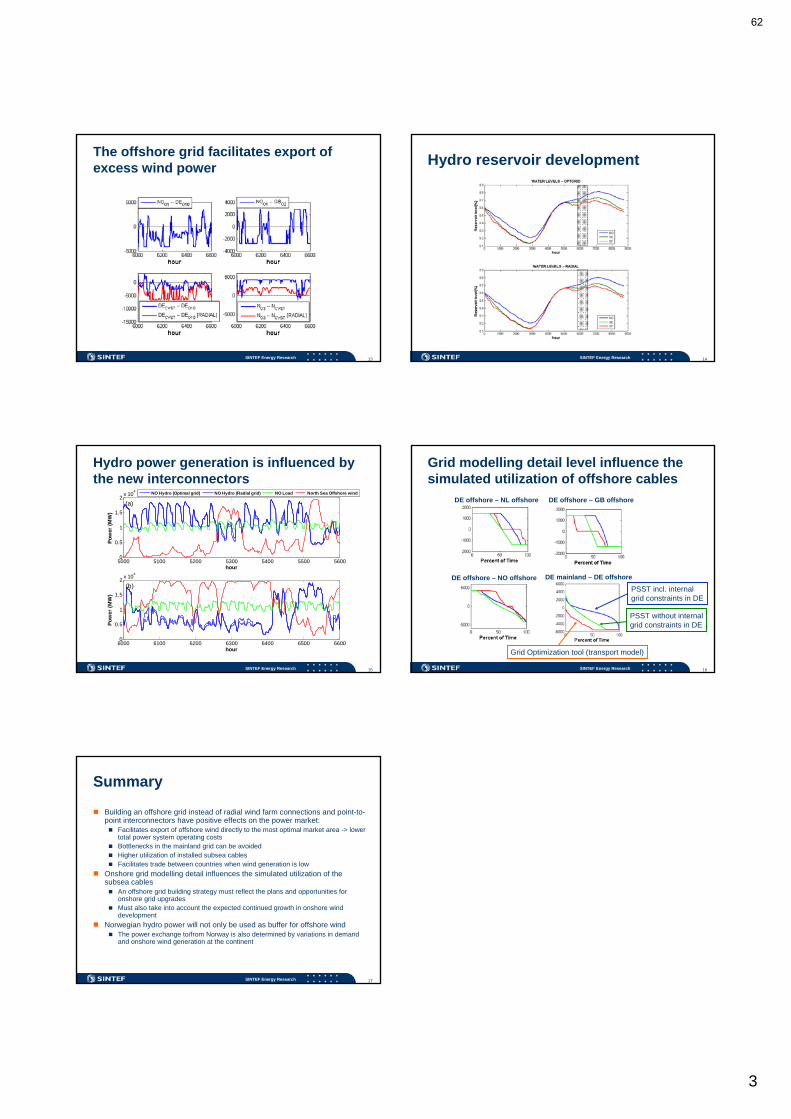
3
13SINTEF Energy Research
The offshore grid facilitates export ofexcess wind power
14SINTEF Energy Research
Hydro reservoir development
15SINTEF Energy Research
Hydro power generation is influenced by the new interconnectors
5000 5100 5200 5300 5400 5500 56000
0.5
1
1.5
2x 10
4
hour
Po
wer
(M
W)
6000 6100 6200 6300 6400 6500 66000
0.5
1
1.5
2x 10
4
hour
Po
wer
(M
W)
NO Hydro (Optimal grid) NO Hydro (Radial grid) NO Load North Sea Offshore wind
(a)
(b)
16SINTEF Energy Research
Grid modelling detail level influence thesimulated utilization of offshore cables
DE offshore – NL offshore DE offshore – GB offshore
DE offshore – NO offshore DE mainland – DE offshore
PSST incl. internalgrid constraints in DE
PSST without internalgrid constraints in DE
Grid Optimization tool (transport model)
17SINTEF Energy Research
Summary
Building an offshore grid instead of radial wind farm connections and point-to-point interconnectors have positive effects on the power market: Facilitates export of offshore wind directly to the most optimal market area -> lower
total power system operating costs Bottlenecks in the mainland grid can be avoided Higher utilization of installed subsea cables Facilitates trade between countries when wind generation is low
Onshore grid modelling detail influences the simulated utilization of thesubsea cables An offshore grid building strategy must reflect the plans and opportunities for
onshore grid upgrades Must also take into account the expected continued growth in onshore wind
development
Norwegian hydro power will not only be used as buffer for offshore wind The power exchange to/from Norway is also determined by variations in demand
and onshore wind generation at the continent
62

Power Fluctuations from Offshore Wind Farms
Poul SørensenNicolaos CutululisSøren LarsenRisø DTU - Wind Energy Division
Risø DTU, Technical University of Denmark
Wind power fluctuation models
Trondheim 21-22 January 2010Wind Power R&D seminar2
2002 2007 2009
Wind turbine(s) Wind farm Power system area
Risø DTU, Technical University of Denmark
Time scales and space scales
Trondheim 21-22 January 2010Wind Power R&D seminar3 Risø DTU, Technical University of Denmark
Rotor wind variability
Trondheim 21-22 January 2010Wind Power R&D seminar4
-1.5
-1.0
-0.5
0.0
0.5
1.0
1.5
0 5 10 15 20
Time
Eq
uiv
ale
nt
win
d s
pe
ed
amp
-amp
harmonic
Risø DTU, Technical University of Denmark
Single wind turbine power fluctuations
Trondheim 21-22 January 2010Wind Power R&D seminar5
P,Q
0 10 20 30 40 50 60−1
−0.5
0
0.5
1
Time (s)
Pow
er (
p.u.
)
P
Q
startup
0 10 20 30 40 50 60−1
−0.5
0
0.5
1
Time (s)
Pow
er (
p.u.
)
P
Q
continuous
0 10 20 30 40 50 600.95
1
1.05
Time (s)
Vol
tage
(p.
u.)
U1
U2
U3
0 10 20 30 40 50 600.95
1
1.05
Time (s)
Vol
tage
(p.
u.)
U1
U2
U3
U
Risø DTU, Technical University of Denmark
Power fluctuation offshore – on land
Trondheim 21-22 January 2010
6 Wind Power R&D seminar
63
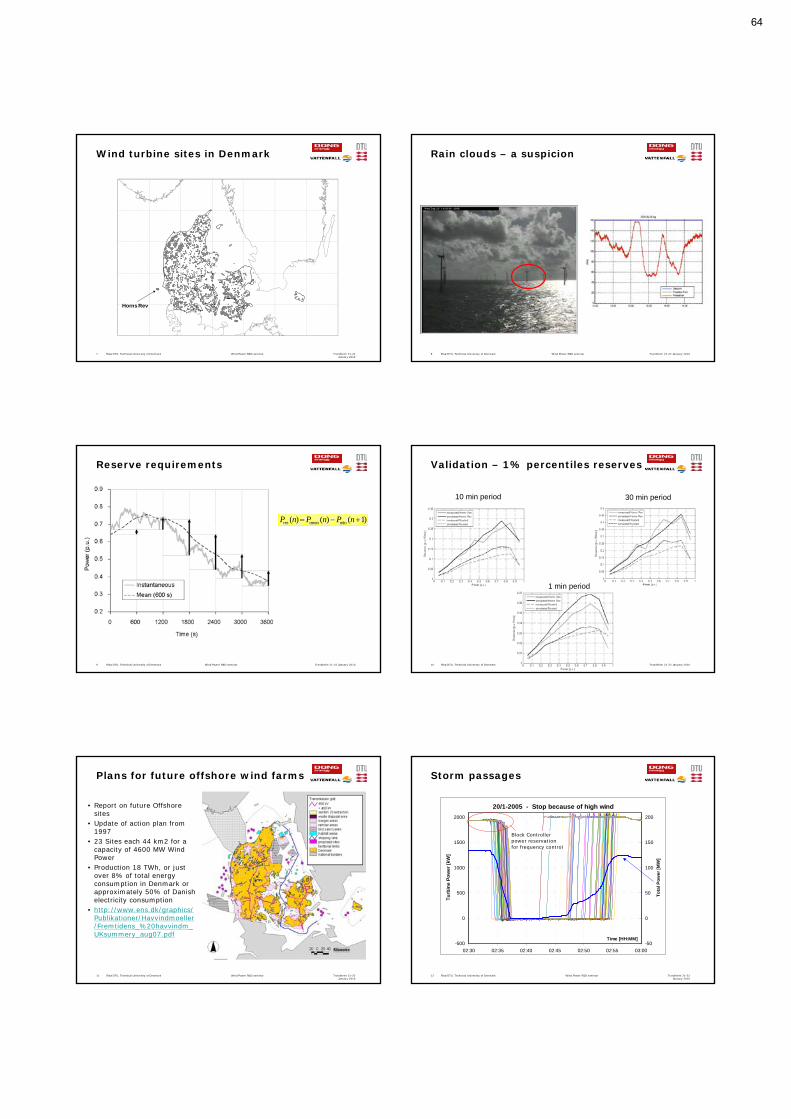
Risø DTU, Technical University of Denmark
Wind turbine sites in Denmark
Trondheim 21-22 January 2010
Wind Power R&D seminar7
Horns Rev
Risø DTU, Technical University of Denmark
Rain clouds – a suspicion
Trondheim 21-22 January 2010Wind Power R&D seminar8
Risø DTU, Technical University of Denmark Trondheim 21-22 January 2010Wind Power R&D seminar9
Reserve requirements
)()1()( meanmeanramp nPnPnP
res mean min( ) ( ) ( 1)P n P n P n
Risø DTU, Technical University of Denmark Trondheim 21-22 January 2010Wind Power R&D seminar10
Validation – 1% percentiles reserves
10 min period 30 min period
1 min period
Risø DTU, Technical University of Denmark
Plans for future offshore wind farms
Wind Power R&D seminar11
• Report on future Offshore sites
• Update of action plan from 1997
• 23 Sites each 44 km2 for a capacity of 4600 MW Wind Power
• Production 18 TWh, or just over 8% of total energy consumption in Denmark or approximately 50% of Danish electricity consumption
• http://www.ens.dk/graphics/Publikationer/Havvindmoeller/Fremtidens_%20havvindm_UKsummery_aug07.pdf
Trondheim 21-22 January 2010
Risø DTU, Technical University of Denmark
Storm passages
Trondheim 21-22 January 2010
Wind Power R&D seminar12
20/1-2005 - Stop because of high wind
-500
0
500
1000
1500
2000
02:30 02:35 02:40 02:45 02:50 02:55 03:00
Time [HH:MM]
Tu
rbin
e P
ow
er [
kW]
-50
0
50
100
150
200
To
tal P
ow
er [
MW
]
Block Controllerpower reservationfor frequency control
64
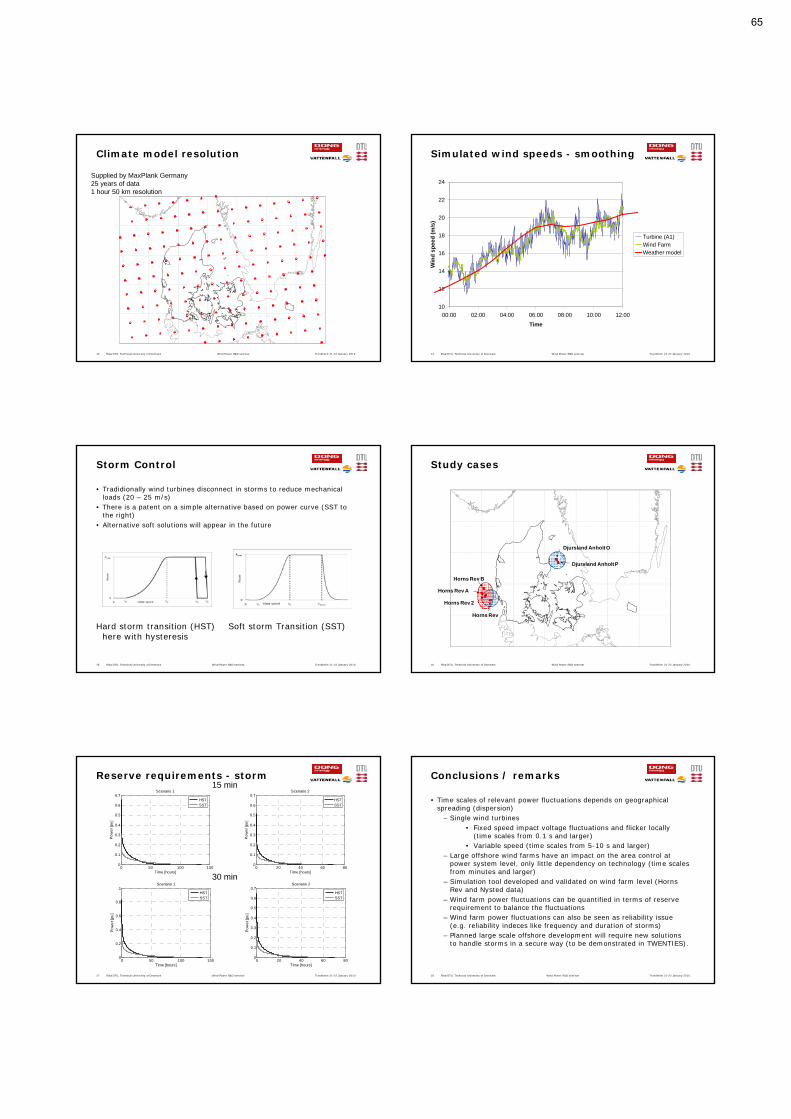
Risø DTU, Technical University of Denmark Trondheim 21-22 January 2010Wind Power R&D seminar13
Climate model resolution
Supplied by MaxPlank Germany25 years of data1 hour 50 km resolution
Risø DTU, Technical University of Denmark Trondheim 21-22 January 2010Wind Power R&D seminar14
Simulated wind speeds - smoothing
10
12
14
16
18
20
22
24
00:00 02:00 04:00 06:00 08:00 10:00 12:00
Time
Win
d s
pe
ed
(m
/s)
Turbine (A1)Wind FarmWeather model
Risø DTU, Technical University of Denmark
Storm Control
• Tradidionally wind turbines disconnect in storms to reduce mechanical loads (20 – 25 m/s)
• There is a patent on a simple alternative based on power curve (SST to the right)
• Alternative soft solutions will appear in the future
Trondheim 21-22 January 2010Wind Power R&D seminar15
Hard storm transition (HST) here with hysteresis
Soft storm Transition (SST)
Risø DTU, Technical University of Denmark Trondheim 21-22 January 2010Wind Power R&D seminar16
Study cases
Horns Rev
Horns Rev 2
Horns Rev B
Horns Rev A
Djursland Anholt O
Djursland Anholt P
Risø DTU, Technical University of Denmark17
Reserve requirements - storm15 min
30 min0 50 100 150
0
0.1
0.2
0.3
0.4
0.5
0.6
0.7
Time [hours]
Po
we
r [p
u]
Scenario 1
HSTSST
0 20 40 60 800
0.1
0.2
0.3
0.4
0.5
0.6
0.7
Time [hours]
Po
we
r [p
u]
Scenario 2
HSTSST
0 50 100 1500
0.2
0.4
0.6
0.8
1
Time [hours]
Po
we
r [p
u]
Scenario 1
HSTSST
0 20 40 60 800
0.1
0.2
0.3
0.4
0.5
0.6
0.7
Time [hours]
Po
we
r [p
u]
Scenario 2
HSTSST
Trondheim 21-22 January 2010Wind Power R&D seminar Risø DTU, Technical University of Denmark
Conclusions / remarks
• Time scales of relevant power fluctuations depends on geographical spreading (dispersion)
– Single wind turbines • Fixed speed impact voltage fluctuations and flicker locally
(time scales from 0.1 s and larger)• Variable speed (time scales from 5-10 s and larger)
– Large offshore wind farms have an impact on the area control at power system level, only little dependency on technology (time scales from minutes and larger)
– Simulation tool developed and validated on wind farm level (Horns Rev and Nysted data)
– Wind farm power fluctuations can be quantified in terms of reserve requirement to balance the fluctuations
– Wind farm power fluctuations can also be seen as reliability issue (e.g. reliability indeces like frequency and duration of storms)
– Planned large scale offshore development will require new solutions to handle storms in a secure way (to be demonstrated in TWENTIES).
Trondheim 21-22 January 2010Wind Power R&D seminar18
65
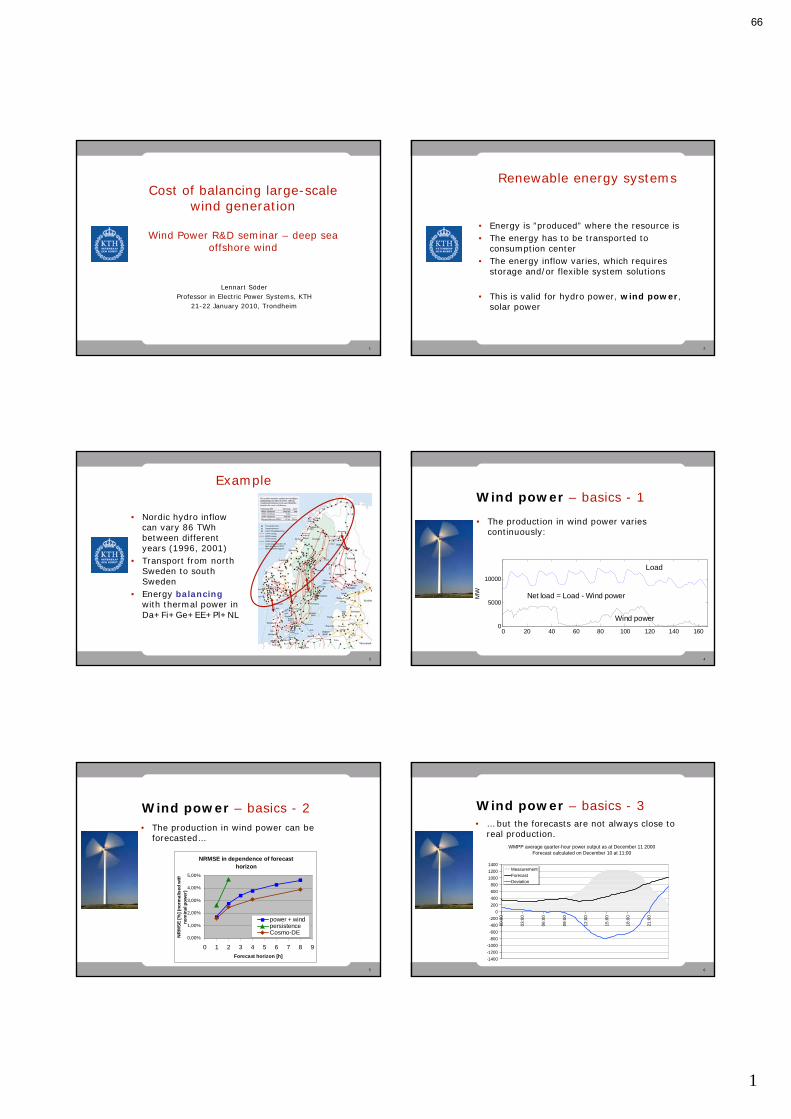
1
1
Cost of balancing large-scale wind generation
Wind Power R&D seminar – deep sea offshore wind
Lennart SöderProfessor in Electric Power Systems, KTH
21-22 January 2010, Trondheim
2
Renewable energy systems
• Energy is ”produced” where the resource is• The energy has to be transported to
consumption center• The energy inflow varies, which requires
storage and/or flexible system solutions
• This is valid for hydro power, wind power, solar power
3
Example
• Nordic hydro inflow can vary 86 TWhbetween different years (1996, 2001)
• Transport from north Sweden to south Sweden
• Energy balancingwith thermal power in Da+Fi+Ge+EE+Pl+NL
4
Wind power – basics - 1
• The production in wind power varies continuously:
0 20 40 60 80 100 120 140 1600
5000
10000
Wind power
Load
Net load = Load - Wind powerMW
5
Wind power – basics - 2• The production in wind power can be
forecasted…
NRMSE in dependence of forecast horizon
0,00%
1,00%
2,00%
3,00%
4,00%
5,00%
0 1 2 3 4 5 6 7 8 9
Forecast horizon [h]
NR
MS
E [
%]
(no
rma
lise
d w
ith
no
min
al p
ow
er)
power + windpersistenceCosmo-DE
6
Wind power – basics - 3• … but the forecasts are not always close to
real production.WMPP average quarter-hour power output as at December 11 2000
Forecast calculated on December 10 at 11:00
-1400
-1200
-1000
-800
-600
-400
-200
0
200
400
600
800
1000
1200
1400
00:0
0
03:0
0
06:0
0
09:0
0
12:0
0
15:0
0
18:0
0
21:0
0
MeasurementForecastDeviation
66
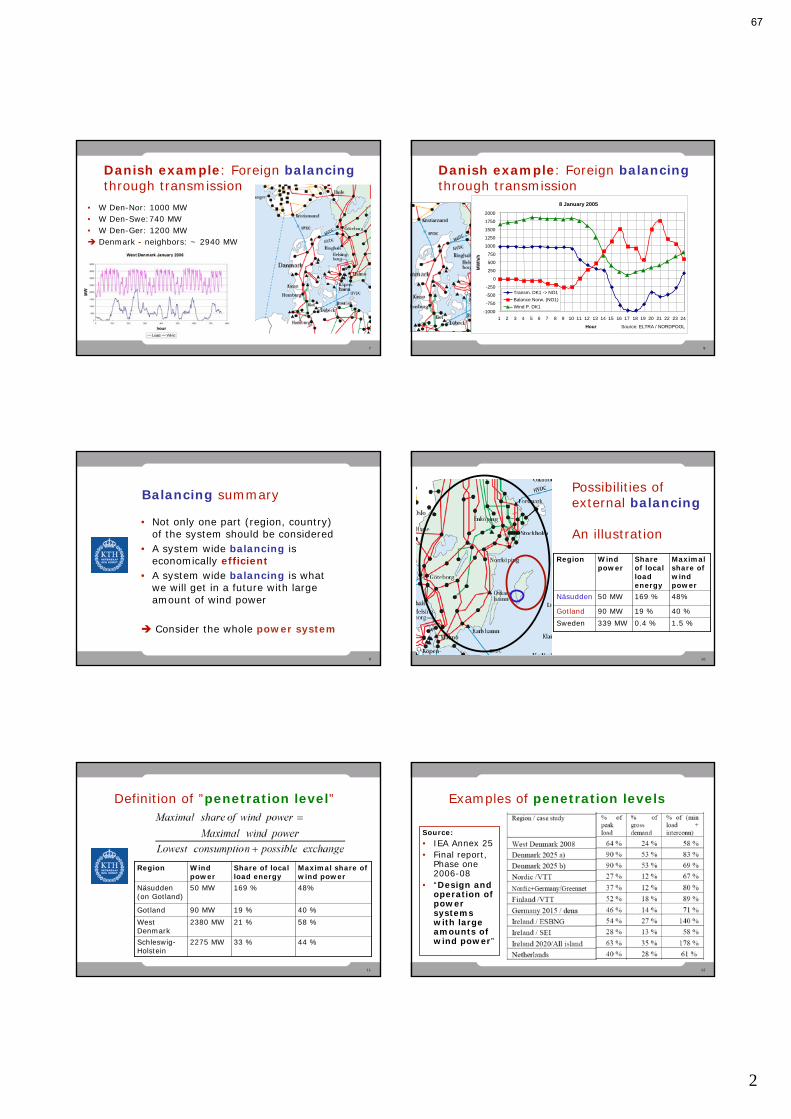
2
7
Danish example: Foreign balancingthrough transmission
• W Den-Nor: 1000 MW• W Den-Swe:740 MW• W Den-Ger: 1200 MW Denmark - neighbors: ~ 2940 MW
8
8 January 2005
-1000
-750
-500
-250
0
250
500
750
1000
1250
1500
1750
2000
1 2 3 4 5 6 7 8 9 10 11 12 13 14 15 16 17 18 19 20 21 22 23 24
Hour
MW
h/h
Transm. DK1 -> NO1
Balance Norw. (NO1)
Wind P. DK1
Source: ELTRA / NORDPOOL
Danish example: Foreign balancingthrough transmission
9
Balancing summary
• Not only one part (region, country) of the system should be considered
• A system wide balancing is economically efficient
• A system wide balancing is what we will get in a future with large amount of wind power
Consider the whole power system
10
Possibilities of external balancing
An illustration
Maximal share of windpower
Shareof localloadenergy
Windpower
Region
339 MW
90 MW
50 MW
1.5 %0.4 %Sweden
40 %19 %Gotland
48%169 %Näsudden
11
Definition of ”penetration level”
Maximal share of wind power
Share of localload energy
Windpower
Region
2275 MW
2380 MW
90 MW
50 MW
44 %33 %Schleswig-Holstein
58 %21 %West Denmark
40 %19 %Gotland
48%169 %Näsudden (on Gotland)
12
Examples of penetration levels
Source:
• IEA Annex 25• Final report,
Phase one 2006-08
• “Design and operation of power systems with large amounts of wind power”
67
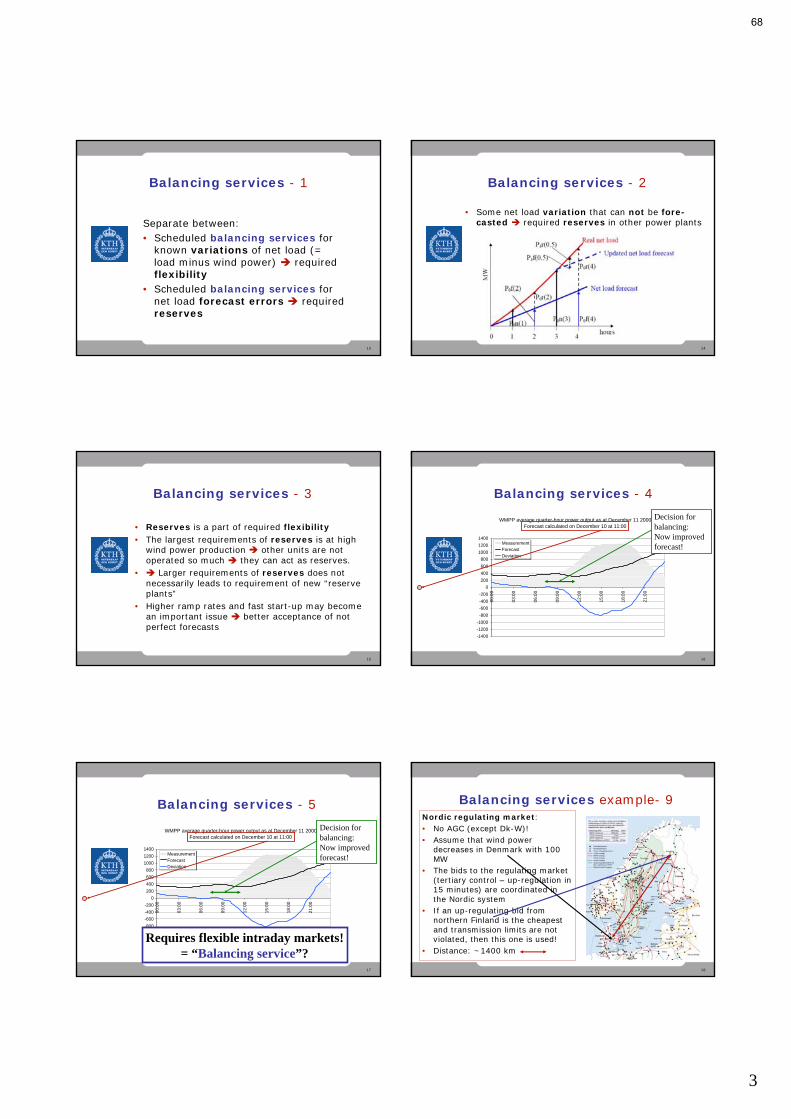
3
13
Balancing services - 1
Separate between:• Scheduled balancing services for
known variations of net load (= load minus wind power) required flexibility
• Scheduled balancing services for net load forecast errors required reserves
14
Balancing services - 2
• Some net load variation that can not be fore-casted required reserves in other power plants
15
• Reserves is a part of required flexibility• The largest requirements of reserves is at high
wind power production other units are not operated so much they can act as reserves.
• Larger requirements of reserves does not necessarily leads to requirement of new “reserve plants”
• Higher ramp rates and fast start-up may become an important issue better acceptance of not perfect forecasts
Balancing services - 3
16
Balancing services - 4
WMPP average quarter-hour power output as at December 11 2000Forecast calculated on December 10 at 11:00
-1400
-1200
-1000
-800
-600
-400
-200
0
200
400
600
800
1000
1200
1400
00:
00
03:
00
06:
00
09:
00
12:
00
15:
00
18:
00
21:
00
MeasurementForecastDeviation
Decision forbalancing:Now improvedforecast!
17
Balancing services - 5
WMPP average quarter-hour power output as at December 11 2000Forecast calculated on December 10 at 11:00
-1400
-1200
-1000
-800
-600
-400
-200
0
200
400
600
800
1000
1200
1400
00:
00
03:
00
06:
00
09:
00
12:
00
15:
00
18:
00
21:
00
MeasurementForecastDeviation
Decision forbalancing:Now improvedforecast!
Requires flexible intraday markets!= “Balancing service”?
18
Balancing services example- 9Nordic regulating market:• No AGC (except Dk-W)!• Assume that wind power
decreases in Denmark with 100 MW
• The bids to the regulating market (tertiary control – up-regulation in 15 minutes) are coordinated in the Nordic system
• If an up-regulating bid from northern Finland is the cheapest and transmission limits are not violated, then this one is used!
• Distance: ~1400 km
68
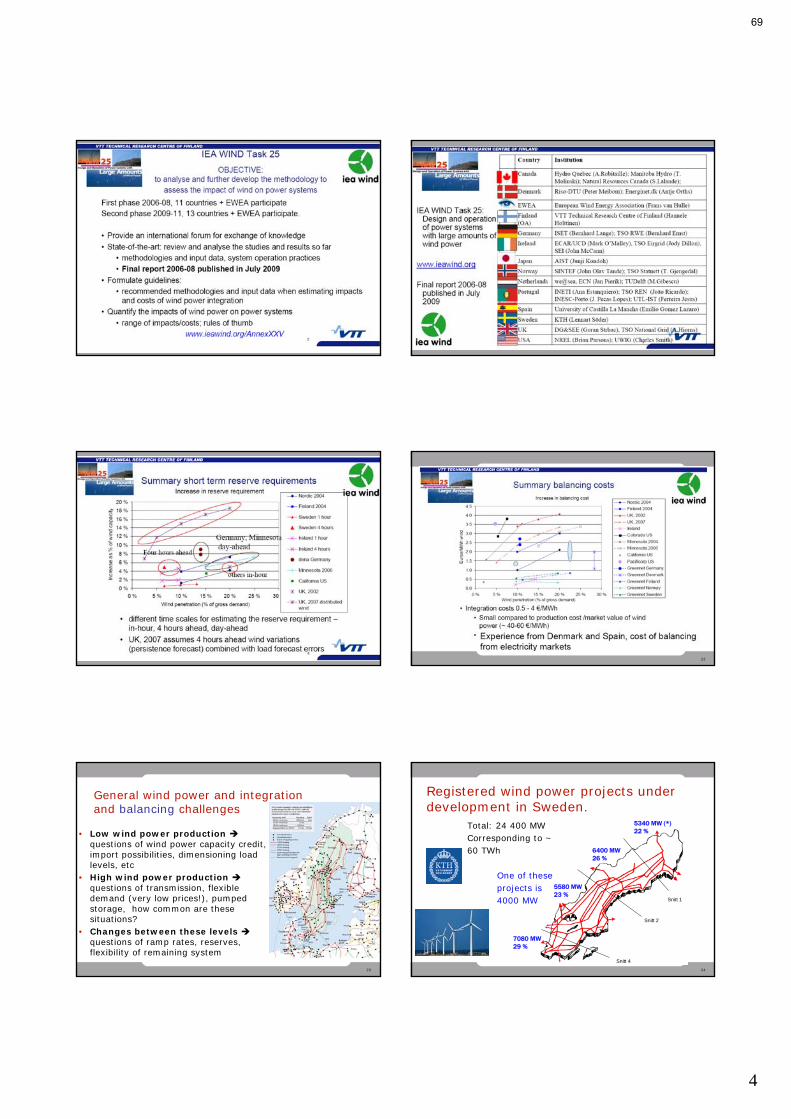
4
19 20
21 22
23
General wind power and integration and balancing challenges
• Low wind power production questions of wind power capacity credit, import possibilities, dimensioning load levels, etc
• High wind power production questions of transmission, flexible demand (very low prices!), pumped storage, how common are these situations?
• Changes between these levels questions of ramp rates, reserves, flexibility of remaining system
24
Snitt 2
Snitt 1
Snitt 4
Total: 24 400 MWCorresponding to ~ 60 TWh
One of these projects is 4000 MW
Registered wind power projects under development in Sweden.
5340 MW (*)22 %
6400 MW26 %
5580 MW23 %
7080 MW29 %
69

B2 Grid connection
From power markets to voltages and currents, Prof Kjetil Uhlen, NTNU Sub-stations for offshore wind farms, Steve Aughton, Siemens T&D Limited New converter topologies for offshore wind farms, Prof Marta Molinas, NTNU Power quality measurements from wind farms, Trond Toftevaag and Tarjei Solvang, SINTEF
70

1
Grid connection of offshore wind
From power markets to voltages
and currents
Kjetil Uhlen
Temesgen Haileselassie
Electrical Power Engineering Department
NTNU
Wind Power R&D seminar – deep sea offshore wind21-22 January 2010, Royal Garden Hotel, Trondheim, NORWAY
2
Outline
• The system integration and power market challenges
• Operation: The various control stages.
• New possibilities and challenges with an offshore HVDC grid.
• Example from ongoing research:
– Primary Control of Multi-terminal HVDC Transmission for Offshore Wind Energy
3
Power markets• Purpose:
– Establish a planned power balance – Optimal use of resources (mainly generation)– Price and scheduled exchanges– Congestion management
• Challenges with an offshore grid and large amounts of offshore wind:– Variable generation More power flow variations and faster
ramp rates– More interconnections Stronger coupling between market
areas
• How should the markets be adapted?– To deal with the changes– To make optimal use of the new possibilities
4
Power market integration
5
Power market integration
6
Power market integration
71

7
Control stages in power system operation
The power system must be in balance at any time:
Long-term balance (hours and beyond):
– Power markets (day-ahead and intra-day markets)
Short-term balance and management of deviations from plans/forecasts:
– Primary control - Automatic control
– Secondary control - LFC/AGC (market based?)
– Tertiary control - Manually activated (balancing markets)
8
Control stages in power system operation
50.0
Rf
50.1
0.0
49.9
Frequency [Hz]
Reserves activated [MW]
Time0 1 min. 15 min. 1 hour
System frequency response: R = [MW/Hz]Pf
f
P
Primary Secondary Tertiary
9
Main challenges in operation and control
• Primary control:
Less primary reserves if new generation provide less frequency response
• Secondary control:
More need for secondary reserves with more variable generation
• Tertiary control:
Benefits with larger control areas and exchange of reserves.
New possibilities with an offshore Multi-terminal HVDC grid!
10
New possibilities and challenges with an offshore HVDC grid.
• Increased controllability:
– More complex control systems
– New possibilities
• Fast fault detection and protection needed
– IGBT control and AC breakers usedQ1
V1,I1,f1
P Q2
V2,I2,f2
11
Two-level AC/DC ”Voltage Source Converter” (2L-VSC)
Q
P
V,I,f
Properties: Fast dynamic control of active and reactive power Fast dynamic control of current, voltage and
frequency Very fast (close to instantaneous) current limitations
during faults
Tr D
DTr
Tr
DTr
Tr D
DTr
V
W
U
D
2
1
DC-link
V
Source: SINTEF Energy Research12
Control of Multiterminal HVDC Transmission for Offshore Wind
Energy
72
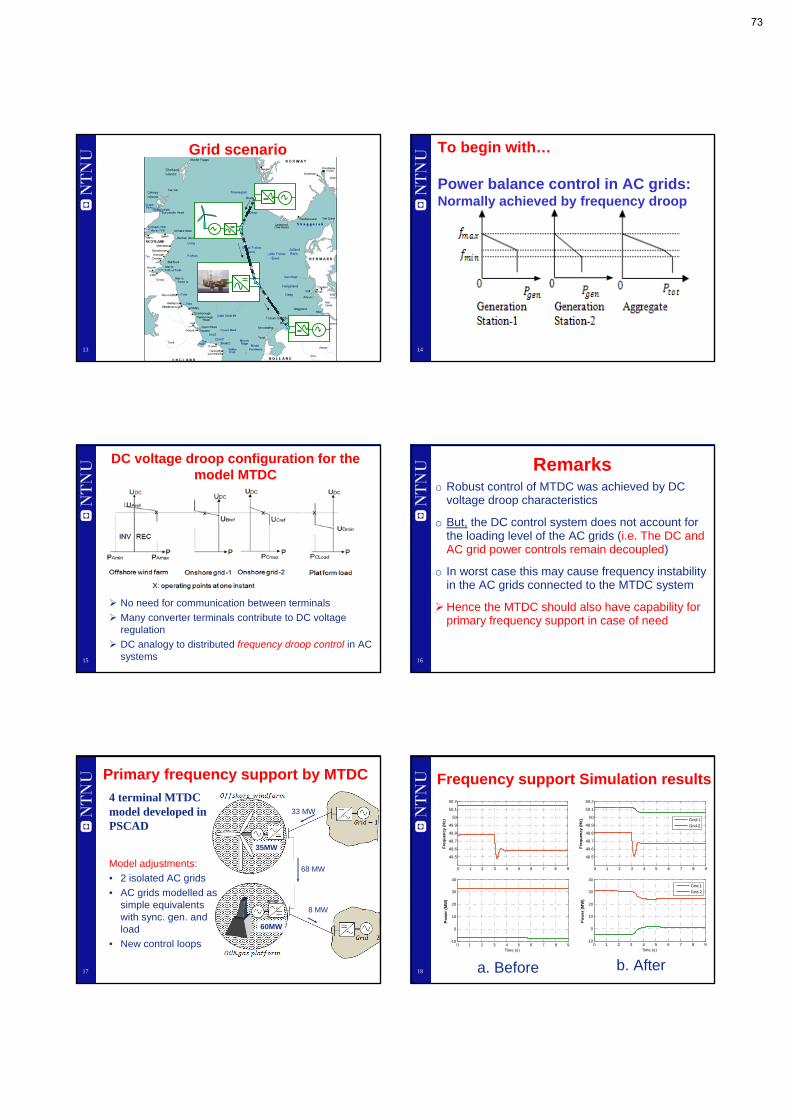
13
Grid scenario
14
To begin with…
Power balance control in AC grids: Normally achieved by frequency droop
15
DC voltage droop configuration for the model MTDC
No need for communication between terminals
Many converter terminals contribute to DC voltage regulation
DC analogy to distributed frequency droop control in AC systems 16
Remarkso Robust control of MTDC was achieved by DC
voltage droop characteristics
o But, the DC control system does not account for the loading level of the AC grids (i.e. The DC and AC grid power controls remain decoupled)
o In worst case this may cause frequency instability in the AC grids connected to the MTDC system
Hence the MTDC should also have capability for primary frequency support in case of need
17
Primary frequency support by MTDC
Model adjustments:
• 2 isolated AC grids
• AC grids modelled as simple equivalents with sync. gen. and load
• New control loops
33 MW
68 MW
8 MW
60MW
35MW
4 terminal MTDC model developed in PSCAD
18
0 1 2 3 4 5 6 7 8 9
49.5
49.6
49.7
49.8
49.9
50
50.1
50.2
Fre
qu
ency
(H
z)
0 1 2 3 4 5 6 7 8 9-10
0
10
20
30
40
Time (s)
Po
wer
(M
W)
Grid-1
Grid-2
Grid-1
Grid-2
0 1 2 3 4 5 6 7 8 9
49.5
49.6
49.7
49.8
49.9
50
50.1
50.2
Fre
qu
ency
(H
z)
0 1 2 3 4 5 6 7 8 9-10
0
10
20
30
40
Time (s)
Po
wer
(M
W)
Frequency support Simulation results
a. Before b. After
73

19
Control strategy attributes
o Robust control of MTDC was achieved by DC voltage droop characteristics
o No need for fast communication between terminals
o The system can also contribute to primary frequency support
20
Concluding remarkso Great possibilities and challenges with an offshore
transmission grid based on VSC HVDC
o Market solutions must be adapted to the new possibilities(to make optimal use of the controllability of HVDC and the increased complexity of the grid)
o Technical and market based solutions must be developed to realise the potential for exchanging balancing power(in particular to utilise the flexibility of Norwegian hydro power)
o Technical solutions can be developed for exchanging primary reserves between different synchronous systems(and contribute to primary frequency support)
21
Thank you.
22
Generalized VSC Control Structure
23
Frequency control implementation at generator station
24
DC droop control implementation at converter station
74

25
Control scheme for frequency support by MTDC
• Add frequency control feedback of a constant DC voltage droop on the converter controller
75
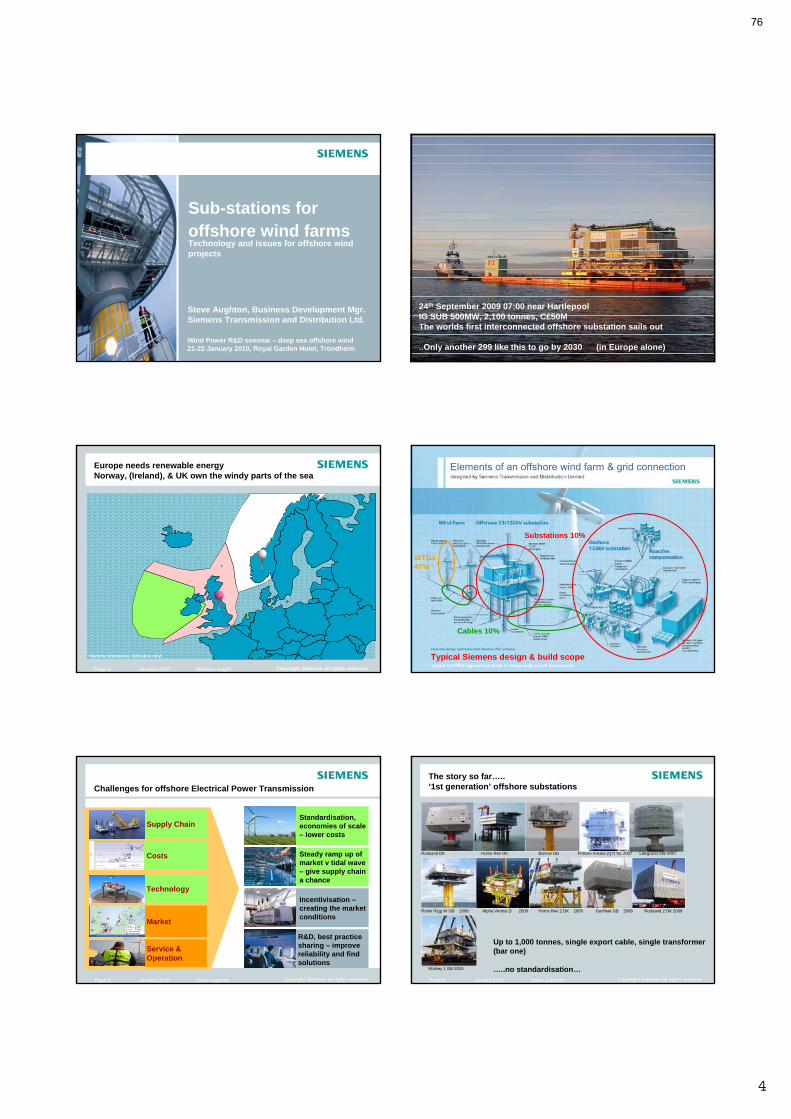
1
Page 1 January 2010 Copyright Siemens all rights reservedSteve Aughton
Wind Power R&D seminar – deep sea offshore wind 21-22 January 2010, Royal Garden Hotel, Trondheim
Sub-stations for offshore wind farmsTechnology and issues for offshore wind projects
Steve Aughton, Business Development Mgr.Siemens Transmission and Distribution Ltd.
Page 2 January 2010 Copyright Siemens all rights reservedSteve Aughton
24th September 2009 07:00 near HartlepoolIG SUB 500MW, 2,100 tonnes, C£50MThe worlds first interconnected offshore substation sails out
..Only another 299 like this to go by 2030 (in Europe alone)
Page 3 January 2010 Copyright Siemens all rights reservedSteve Aughton
Europe needs renewable energyNorway, (Ireland), & UK own the windy parts of the sea
Copyright Siemens all rights reservedMatthew Knight
Maritime boundaries indicative only!
Page 4 January 2010 Copyright Siemens all rights reservedSteve Aughton
WTGs47%
Cables 10%
Substations 10%
Elements of an offshore wind farm & grid connection
Typical %CAPEX figures from Ernst & Young study for UK Government
Typical Siemens design & build scope
Page 5 January 2010 Copyright Siemens all rights reservedSteve Aughton
Challenges for offshore Electrical Power Transmission
Costs
Technology
Market
Supply Chain
Service & Operation
Steady ramp up of market v tidal wave – give supply chain a chance
Standardisation,economies of scale – lower costs
Incentivisation –creating the market conditions
R&D, best practicesharing – improve reliability and find solutions
Page 6 January 2010 Copyright Siemens all rights reservedSteve Aughton
The story so far…..‘1st generation’ offshore substations
Rodsand DK Horns Rev DK Barrow GB Princes Amalia (Q7) NL 2007 Lillegrund SW 2007
Robin Rigg W GB 2008 Alpha Ventus D 2008 Horns Rev 2 DK 2008 Gunfleet GB 2008 Rodsand 2 DK 2009
Walney 1 GB 2010
Up to 1,000 tonnes, single export cable, single transformer (bar one)
…..no standardisation…
76
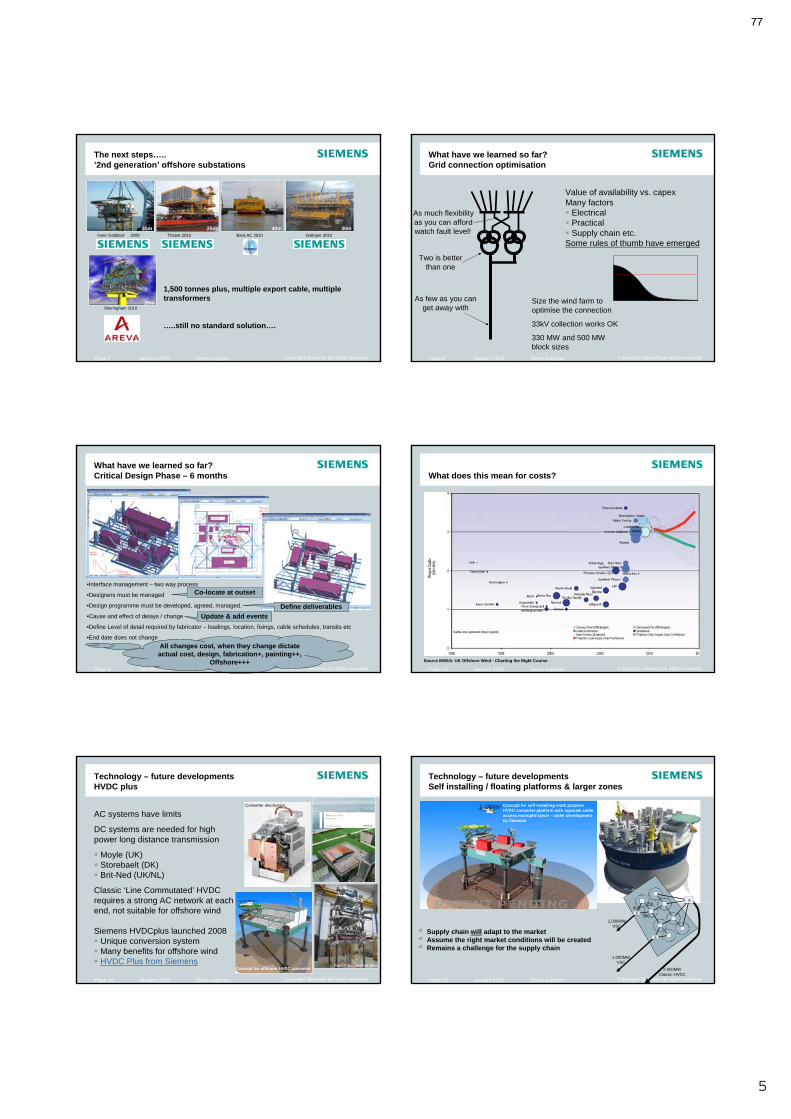
2
Page 7 January 2010 Copyright Siemens all rights reservedSteve Aughton
The next steps…..’2nd generation’ offshore substations
Inner Gabbard 2009 Thanet 2010 Bard AC 2010 Galloper 2010
Sheringham 2010
40m 30m25m30m
20m
1,500 tonnes plus, multiple export cable, multipletransformers
…..still no standard solution….
Page 8 January 2010 Copyright Siemens all rights reservedSteve Aughton
What have we learned so far?Grid connection optimisation
Value of availability vs. capexMany factors Electrical Practical Supply chain etc.Some rules of thumb have emerged
As few as you canget away with
watch fault level!
Two is betterthan one
As much flexibilityas you can afford
Size the wind farm to optimise the connection
33kV collection works OK
330 MW and 500 MW block sizes
Page 9 January 2010 Copyright Siemens all rights reservedSteve Aughton
What have we learned so far?Critical Design Phase – 6 months
•Interface management – two way process
•Designers must be managed
•Design programme must be developed, agreed, managed.
•Cause and effect of delays / change
•Define Level of detail required by fabricator – loadings, location, fixings, cable schedules, transits etc
•End date does not change
Co-locate at outset
Update & add events
All changes cost, when they change dictate actual cost, design, fabrication+, painting++,
Offshore+++
Define deliverables
Page 10 January 2010 Copyright Siemens all rights reservedSteve Aughton
What does this mean for costs?
Source BWEA: UK Offshore Wind - Charting the Right Course
Page 11 January 2010 Copyright Siemens all rights reservedSteve Aughton
Technology – future developmentsHVDC plus
AC systems have limits
DC systems are needed for high power long distance transmission
Moyle (UK) Storebaelt (DK) Brit-Ned (UK/NL)
Classic ‘Line Commutated’ HVDC requires a strong AC network at each end, not suitable for offshore wind
Siemens HVDCplus launched 2008 Unique conversion system Many benefits for offshore wind HVDC Plus from Siemens
Part of a converter arm
Converter electronics
Concept for offshore HVDC converter
Page 12 January 2010 Copyright Siemens all rights reservedSteve Aughton
Technology – future developmentsSelf installing / floating platforms & larger zones
Concept for self installing multi purpose HVDC converter platform with separate cable access monopile tower - under development by Siemens
Supply chain will adapt to the market Assume the right market conditions will be created Remains a challenge for the supply chain
DCAC
2,000MWClassic HVDC
1,000MWVSC
ACDC
1,000MWVSC
ACDC
500
500
250
77
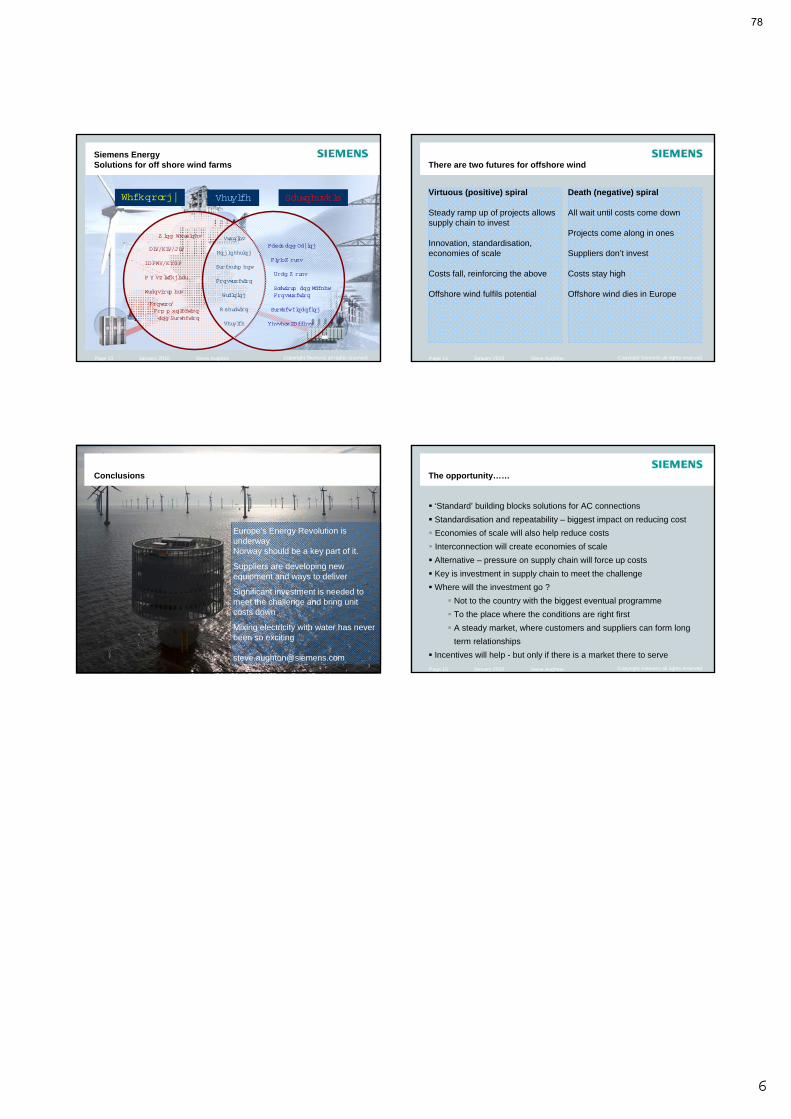
�
Page 13 January 2010 Copyright Siemens all rights reservedSteve Aughton
Siemens EnergySolutions for off shore wind farms
S������
E�����
P�� ���� ��
C����� ���
T����
O�������
S���� �
C���� �� L���
C���� � ����
R��� � ����
P������� �� J� ���C����� ���
P���� � F�� �
������� / A ���
AIS, HIS, GIS
FACTS, H�DC
M � S� �� ����
T������� ���
C�����, C�� � �� ���� �� P���� ���
T� ����� S���� � P���������
� �� T������
Page 14 January 2010 Copyright Siemens all rights reservedSteve Aughton
There are two futures for offshore wind
Virtuous (positive) spiral
Steady ramp up of projects allows supply chain to invest
Innovation, standardisation, economies of scale
Costs fall, reinforcing the above
Offshore wind fulfils potential
Death (negative) spiral
All wait until costs come down
Projects come along in ones
Suppliers don’t invest
Costs stay high
Offshore wind dies in Europe
Page 15 January 2010 Copyright Siemens all rights reservedSteve Aughton
Conclusions
Europe’s Energy Revolution is underwayNorway should be a key part of it.
Suppliers are developing new equipment and ways to deliver
Significant investment is needed to meet the challenge and bring unit costs down
Mixing electricity with water has never been so exciting
[email protected] Page 16 January 2010 Copyright Siemens all rights reservedSteve Aughton
The opportunity……
‘Standard’ building blocks solutions for AC connections
Standardisation and repeatability – biggest impact on reducing cost
Economies of scale will also help reduce costs
Interconnection will create economies of scale
Alternative – pressure on supply chain will force up costs
Key is investment in supply chain to meet the challenge
Where will the investment go ?
Not to the country with the biggest eventual programme
To the place where the conditions are right first
A steady market, where customers and suppliers can form long
term relationships
Incentives will help - but only if there is a market there to serve
78
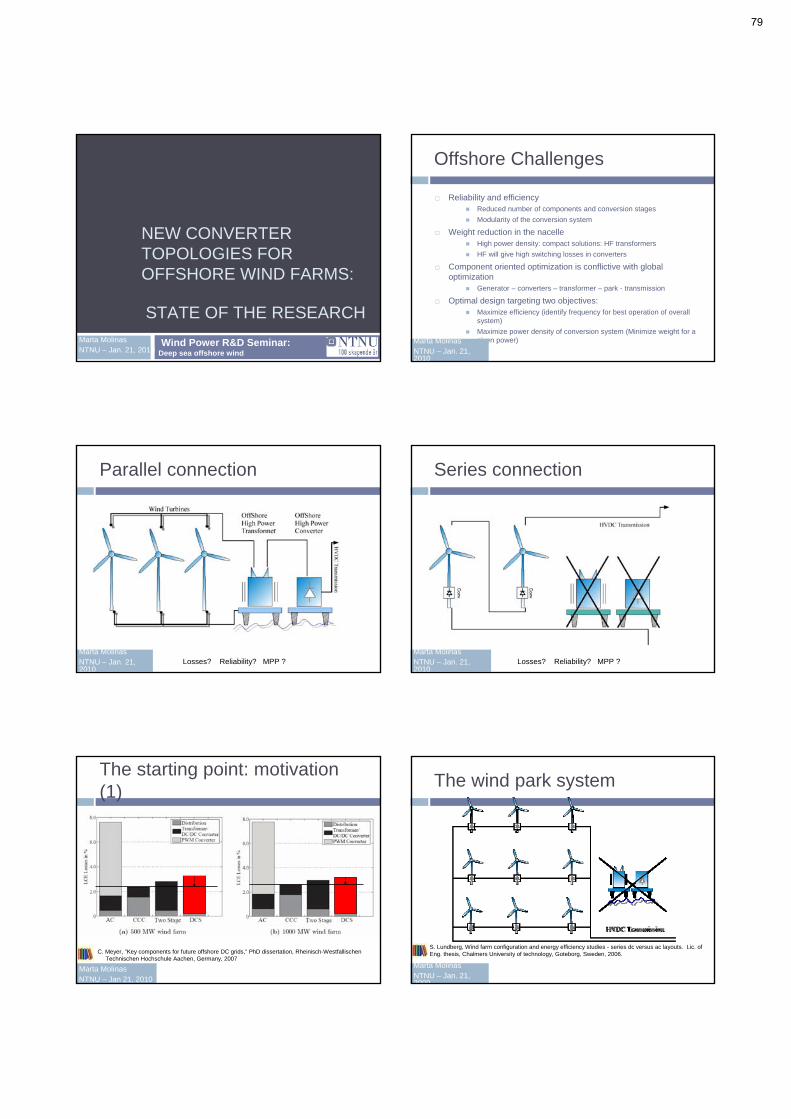
NEW CONVERTER TOPOLOGIES FOR OFFSHORE WIND FARMS:
STATE OF THE RESEARCH
Marta MolinasNTNU – Jan. 21, 2010
Wind Power R&D Seminar:Deep sea offshore wind
Offshore Challenges
Reliability and efficiency Reduced number of components and conversion stages
Modularity of the conversion system
Weight reduction in the nacelle High power density: compact solutions: HF transformers
HF will give high switching losses in converters
Component oriented optimization is conflictive with global optimization
Generator – converters – transformer – park - transmission
Optimal design targeting two objectives: Maximize efficiency (identify frequency for best operation of overall
system)
Maximize power density of conversion system (Minimize weight for a given power)Marta Molinas
NTNU – Jan. 21, 2010
Parallel connection
Marta MolinasNTNU – Jan. 21, 2010
Losses? Reliability? MPP ?
Series connection
Marta MolinasNTNU – Jan. 21, 2010
Losses? Reliability? MPP ?
The starting point: motivation(1)
Marta MolinasNTNU – Jan 21, 2010
C. Meyer, ”Key components for future offshore DC grids,” PhD dissertation, Rheinisch-WestfallischenTechnischen Hochschule Aachen, Germany, 2007
The wind park system
Marta MolinasNTNU – Jan. 21, 2009
S. Lundberg, Wind farm configuration and energy efficiency studies - series dc versus ac layouts. Lic. of Eng. thesis, Chalmers University of technology, Goteborg, Sweden, 2006.
79
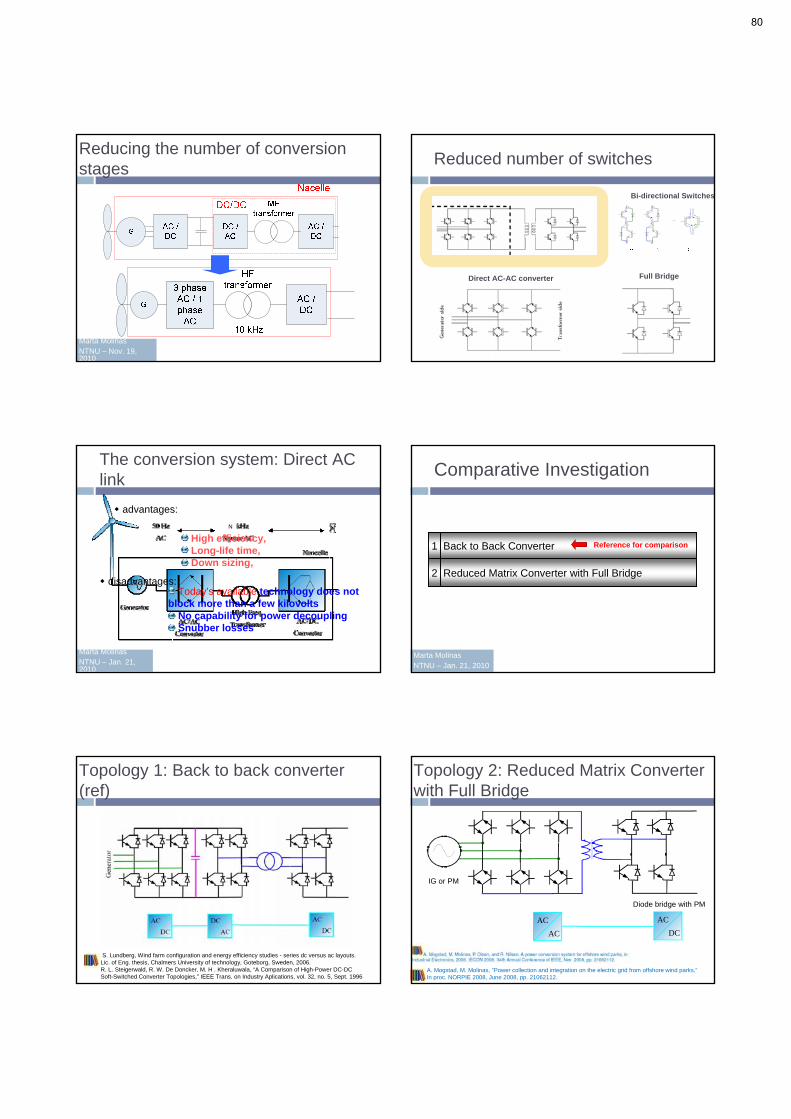
Marta MolinasNTNU – Nov. 19, 2010
Reducing the number of conversionstages
Bi-directional Switches
Full Bridge Direct AC-AC converter
Reduced number of switches
The conversion system: Direct AC link
Marta MolinasNTNU – Jan. 21, 2010
High efficiency, Long-life time,Down sizing,
disadvantages:Today’s available technology does not
block more than a few kilovolts No capability for power decouplingSnubber losses
advantages:
NN
Comparative Investigation
Marta MolinasNTNU – Jan. 21, 2010
2
1
Reduced Matrix Converter with Full Bridge
Back to Back Converter Reference for comparison
Topology 1: Back to back converter(ref)
S. Lundberg, Wind farm configuration and energy efficiency studies - series dc versus ac layouts. Lic. of Eng. thesis, Chalmers University of technology, Goteborg, Sweden, 2006.R. L. Steigerwald, R. W. De Doncker, M. H . Kheraluwala, “A Comparison of High-Power DC-DCSoft-Switched Converter Topologies,” IEEE Trans. on Industry Aplications, vol. 32, no. 5, Sept. 1996
Topology 2: Reduced Matrix Converterwith Full Bridge
A. Mogstad, M. Molinas, ”Power collection and integration on the electric grid from offshore wind parks,”In proc. NORPIE 2008, June 2008, pp. 21062112.
AC
AC
AC
DC
IG or PM
Diode bridge with PM
80
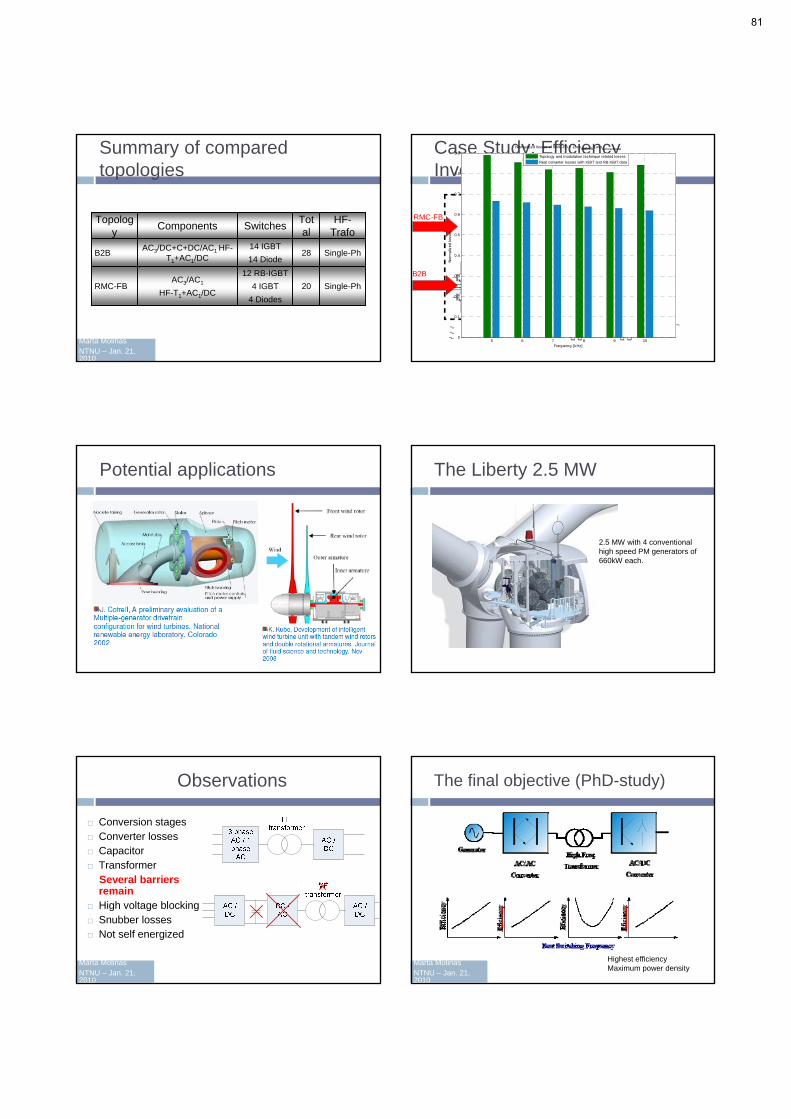
Summary of comparedtopologies
Marta MolinasNTNU – Jan. 21, 2010
20
28
Total
12 RB-IGBT
4 IGBT
4 Diodes
14 IGBT
14 Diode
Switches
AC3/AC1
HF-T1+AC1/DC
AC3/DC+C+DC/AC1 HF-T1+AC1/DC
Components
Single-PhB2B
RMC-FB
Topology
Single-Ph
HF-Trafo
Case Study: EfficiencyInvestigation
B2B
RMC-FB
5 6 7 8 9 100
0.1
0.2
0.3
0.4
0.5
0.6
0.7
0.8
0.9
Nor
mal
ized
loss
es
Frequency [kHz]
Normalized losses of RMC-FB = LossRMC-FB/LossConventional
Topology and modulation technique related losses
Real converter losses with IGBT and RB-IGBT data
Potential applications The Liberty 2.5 MW
2.5 MW with 4 conventionalhigh speed PM generators of660kW each.
Observations
Conversion stages Converter losses Capacitor Transformer
Several barriers remain
High voltage blocking Snubber losses Not self energized
Marta MolinasNTNU – Jan. 21, 2010
The final objective (PhD-study)
Marta MolinasNTNU – Jan. 21, 2010
Highest efficiencyMaximum power density
81
Next Steps in this Research
Losses comparison in the studied topologiesimpact of modulation and operation principleloss model extraction
Transient studies:On-shore three phase fault: use of kinetic energy in the turbineLoss of one wind turbine (by pass, reconfiguration)HVDC line faultOperation at reduced AC voltage
Implementation of Bi-directional switches with higher voltage blockingcapability for MW units or multi-generator turbine (modular approach)
Multi-domain design approach for high power density and high efficiency
Laboratory tests of RMCMarta MolinasNTNU – Jan. 21, 2010
Challenges today!
Protective devices (DC circuit breaker, bypass, insulation)
Electronic transformers
Collection and conversion plaforms
High frequency transformers
MW scale converters
Common denominator: Utilization of power electronics…
Concluding Remarks
Wind power encompasses several disciplineswithin electrical engineering
In each of them the challenges related to integration are different…..and can be conflictive
It is necessary to take distance and look at thechallenges from a system perspective
For further details
http://www.elkraft.ntnu.no/eno/
Follow the link to “Publications”
Speak to me for more recent work…
Marta MolinasDepartment of Electrical Power Engineering, Energy Conversion Group
Norwegian University of Science and Technology
Trondheim, Norway
82
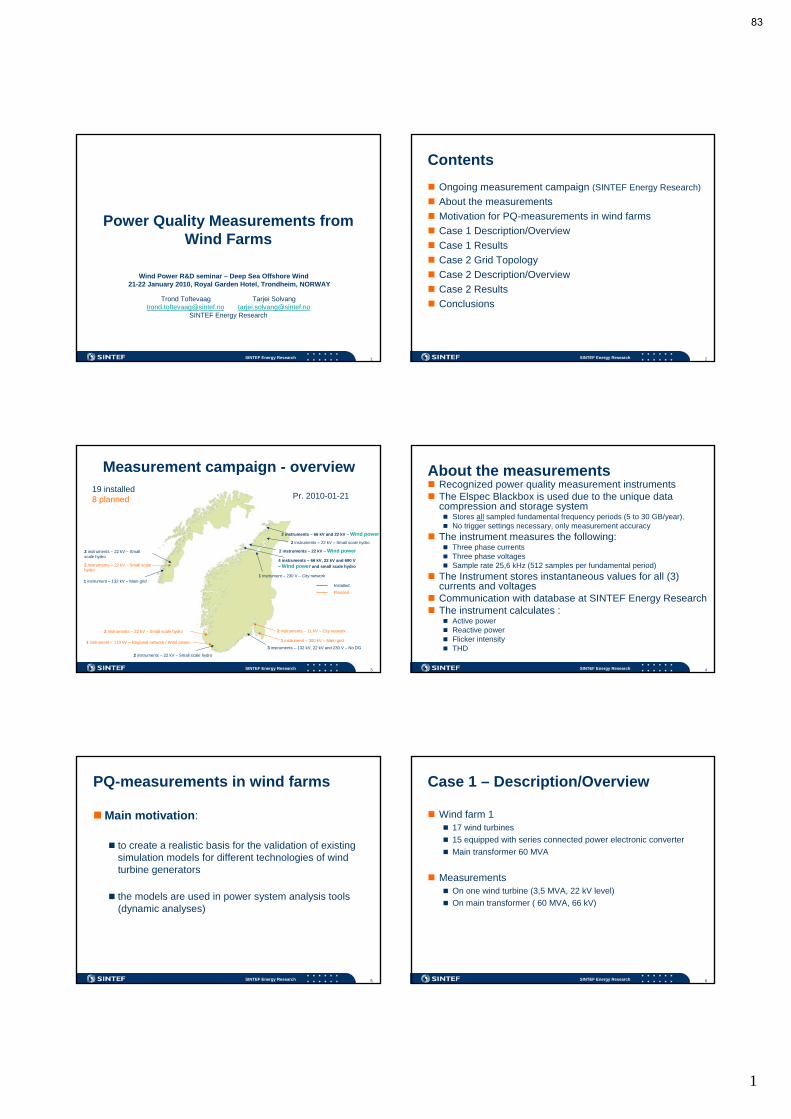
1
1SINTEF Energy Research
Power Quality Measurements from Wind Farms
Wind Power R&D seminar – Deep Sea Offshore Wind 21-22 January 2010, Royal Garden Hotel, Trondheim, NORWAY
Trond Toftevaag Tarjei [email protected] [email protected]
SINTEF Energy Research
2SINTEF Energy Research
Contents
Ongoing measurement campaign (SINTEF Energy Research)
About the measurements
Motivation for PQ-measurements in wind farms
Case 1 Description/Overview
Case 1 Results
Case 2 Grid Topology
Case 2 Description/Overview
Case 2 Results
Conclusions
3SINTEF Energy Research
Measurement campaign - overview
1 instrument – 230 V – City network
2 instruments – 22 kV – Small scale hydro
2 instruments – 66 kV and 22 kV – Wind power
1 instrument – 300 kV – Main grid
3 instruments – 132 kV, 22 kV and 230 V – No DG
2 instruments – 22 kV – Small scale hydro
2 instruments – 22 kV – Small scale hydro
2 instruments – 22 kV – Small scale hydro
1 instrument – 132 kV – Main grid
2 instruments – 22 kV – Wind power
4 instruments – 66 kV, 22 kV and 690 V
– Wind power and small scale hydro
Planned
Installed
2 instruments – 11 kV – City network
19 installed8 planned Pr. 2010-01-21
2 instruments – 22 kV – Small scale hydro
1 instrument – 110 kV – Regional network / Wind power
4SINTEF Energy Research
About the measurements Recognized power quality measurement instruments The Elspec Blackbox is used due to the unique data
compression and storage system Stores all sampled fundamental frequency periods (5 to 30 GB/year). No trigger settings necessary, only measurement accuracy
The instrument measures the following: Three phase currents Three phase voltages Sample rate 25,6 kHz (512 samples per fundamental period)
The Instrument stores instantaneous values for all (3) currents and voltages
Communication with database at SINTEF Energy Research The instrument calculates :
Active power Reactive power Flicker intensity THD
5SINTEF Energy Research
PQ-measurements in wind farms
Main motivation:
to create a realistic basis for the validation of existing simulation models for different technologies of wind turbine generators
the models are used in power system analysis tools (dynamic analyses)
6SINTEF Energy Research
Case 1 – Description/Overview
Wind farm 1 17 wind turbines
15 equipped with series connected power electronic converter
Main transformer 60 MVA
Measurements On one wind turbine (3,5 MVA, 22 kV level)
On main transformer ( 60 MVA, 66 kV)
83
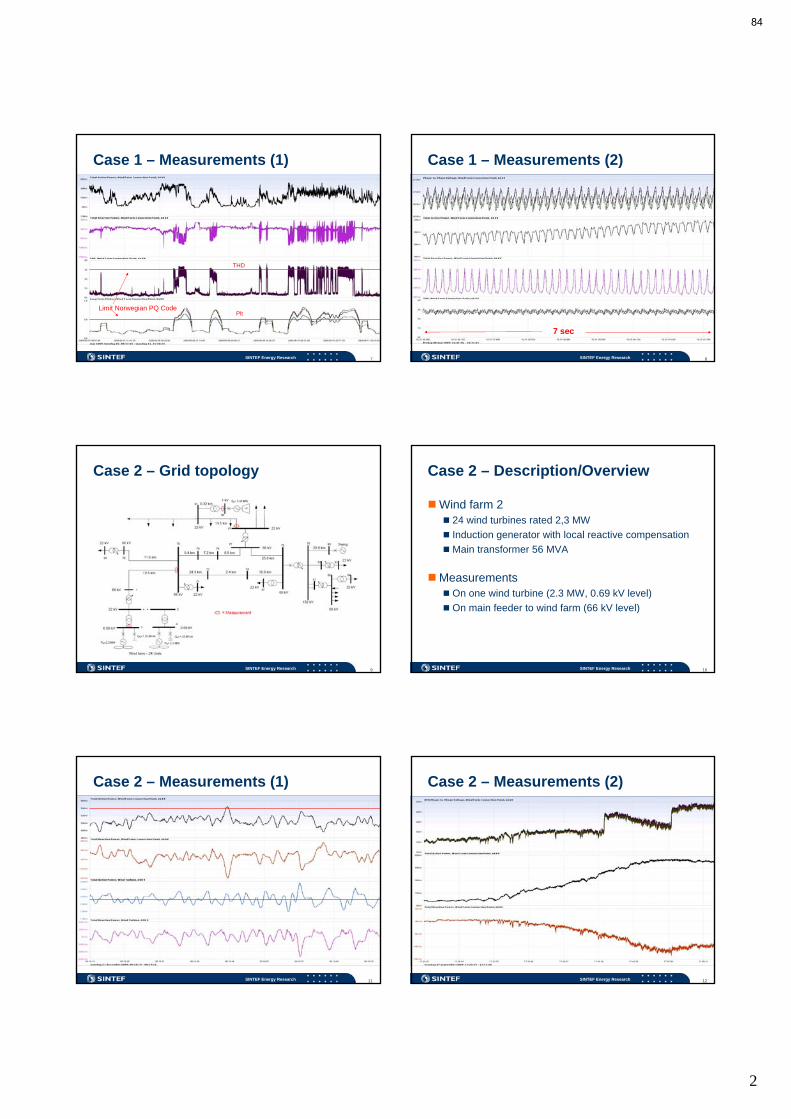
2
7SINTEF Energy Research
Case 1 – Measurements (1)
Limit Norwegian PQ Code
THD
Plt
8SINTEF Energy Research
Case 1 – Measurements (2)
7 sec
9SINTEF Energy Research
Case 2 – Grid topology
10SINTEF Energy Research
Case 2 – Description/Overview
Wind farm 2 24 wind turbines rated 2,3 MW
Induction generator with local reactive compensation
Main transformer 56 MVA
Measurements On one wind turbine (2.3 MW, 0.69 kV level)
On main feeder to wind farm (66 kV level)
11SINTEF Energy Research
Case 2 – Measurements (1)
12SINTEF Energy Research
Case 2 – Measurements (2)
84

3
13SINTEF Energy Research
Case 2 – Measurements (3)
4,5 minutes
14SINTEF Energy Research
Conclusions/status – so far
The measurement results (so far) have given valuable information to the owners of the wind farms, windmill manufacturers and grid owners
Observed phenomena Considerable voltage variations
Stability problems (related to controllers)
Increased rate of operation for transformer tap-changers
The measurements will continue in 2010
Validation of simulation models in progress, with main focus on dynamic behaviour of wind farms during grid faults
85

Poster session PhD students on offshore wind Hybrid HVDC for Offshore Wind Applications, Raymundo Torres Oleguin Maintenance Optimization of Offshore Wind Farms from Design to Operation, Zafar Hameed Fatigue Reliability Analysis of Jacket-type Offshore Wind Turbine Considering Inspection and Repair, Wenbin Dong Experimental Study of Two Model Horizontal-Axis Wind Turbines in Tandem Arrangement, Muyiwa Adaramola Reduced Matric Converter for Off-shore Wind Farm Applications, Alejandro Garces Industrial Ecology Perspective of Offshore Wind Power Industry, Anders Arvesen Full Scale Wind Measurements Relevant for Offshore Wind Power, Gursu Tasar Evaluation of the Dimensioning Dynamic Forces on Large Floating Wind Turbines, Lars Frøyd RAMS Engineering in the Development of Offshore Wind Power Production System, Lijuan Dai Dynamic Response of Spar Type Floating Wind Turbine in Extreme Environmental Conditions, Madjid Karimirad A Simplified Approach to Wave Loading for Fatigue Damage Analysis of Monotowers, Paul Thomassen Grid Integration of Offshore Wind Farms and Offshore Loads using Multiterminal HVDC, Temesgen Haileselassie Modelling and Control of Floating Wind turbines, Thomas Fuglseth Condition Monitoring and Maintenance Optimization of Offshore Wind Farms, Mahmoud Valibeigloo Individual Pitch Control for Horizontal Axis Wind Turbines, Fredrik Sandquist Analysis of Switching Transients in Wind Park with Focus on Prevention of Destructive Effects, Amir Hayati Soloot
86

Hybrid HVDC using in a Offshore Wind Farm ApplicationsRaymundo E. Torres-Olguin*, M. Molinas, T. Undeland
Faculty of Information Technology, Mathematics and Electrical EngineeringDepartment of Electric Power Engineering
Introduction
There are two different HVDC transmission technologies, i.e. VoltageSource Converter (VSC), using controllable switches like Insulated-gatebipolar transistors (IGBT), and Current Source Converter (CSC) orLine-Commutated Converter (LCC), using controllable switches likethyristors.The Hybrid HVDC option is aimed at combining advantages of both HVDCtechnologies and compensating their drawbacks.
Figure 1: Hybrid HVDC for Offshore Wind Farms Applications
VSC1
VSCn
LCC
ACGRID
VSCs, connected at the wind turbine, regulate the active and reactive powerusing a d-q synchronous reference frame controller while the LCC,connectedto the main grid, maintains the DC voltage using a PI controller.(In Figure3 and Figure 4 is shown the proposed controller)
LCC, VSC and Hybrid HVDC
HVDC Advantages Disavantages
LCC � Feasibility for very high power levels � Some difficulties to�Less power losses operate with weak grids
VSC � Active and reactive power exchange �More losses comparedcan be controlled independently with LCC� No commutation failure problem �Defenseless against� No communications required DC faultsbetween two stations
Hybrid �Combining advantages � Power flow in
of both HVDC one direction
Figure 2: Equivalent Scheme of the Hybrid HVDC
n vC1
+_
C
R1
L
L
L
VSC1
v S1
1 2 3
1 2 3
v S2
v S3
i S3
i S2
i S1
i DC1
L1 R2 L2
C2
i DC2
i C2i C1
VC2
+
_
+_
Rcr
V dirco
sE1 E2E3
System Description of the Hybrid HVDC
According Figure 2, the dynamic of the VSC can be represent by thefollowing model
Ld
dtiSdq = ϑdq − vSdq − ωLJiSdq (1)
CvC1d
dtvC1 = vC1iDC1 − ϑdq
�iSdq (2)
where iSdq = [iSd , iSq]�, vSdq = [vSd , vSq]
�, ϑdq = [ϑd , ϑq]� represent the
line current, AC voltage and duty vector in dq coordinates. vC1 is the DCvoltage in the DC link and iDC1 is the DC current in the DC link. Thedynamic of the LCC can be expressed by the following model
vC2 =3√
2
πvLLcosβ − iDC2
3
πωLc (3)
where vC2 is the DC voltage in the DC link, β is the ignition advance angle,iDC2 is the DC current in the DC link, vLL represents the line-to-line voltagein the AC side, Lc is the inductance in the AC side and ω is the angularfrequency in the AC side.
Figure 3: Block diagram of the proposed controller for the VSC
vSd
ski1 kp1+
rr
iSd
rr
iSq
iSd
L
L
vSq
Togates
123dq
Modulationscheme
u
ski2 kp2+
p1 q1
d
q
vC1
rrski1 kp1+
*
iSq*
*
ski2 kp2+ iSq
*iRd*
p1 q1*
Figure 4: Block diagram of the proposed controller for the LCC
C2vski kp+
dV
rr
Figure 5: Simulation Results
0 0.5 1 1.5 2 2.5 3-2
0
2(a) AC Voltage LCC
V [p
u]
0 0.5 1 1.5 2 2.5 3-1
0
1
2(b) Active and Reactive Power LCC
VA
[pu] Active power
Reactive power
0 0.5 1 1.5 2 2.5 3
0
1
2(c) DC current
A [p
u]
0 0.5 1 1.5 2 2.5 3
0
1
2(d) DC Voltages
V [p
u]
0 0.5 1 1.5 2 2.5 3-2
0
2(e) AC voltage VSC
V [p
u]
0 0.5 1 1.5 2 2.5 3
0
1
2(f) Active and Reactive Power in the VSC
time [s]
VA
[pu] Active power
Reactive power
(a)Start up hybrid HVDC
2 2.05 2.1 2.15 2.2 2.25 2.3-2
0
2(a) AC Voltage LCC
V [p
u]
2 2.05 2.1 2.15 2.2 2.25 2.3-1
0
1
2(b) Active and Reactive Power LCC
VA
[pu]
2 2.05 2.1 2.15 2.2 2.25 2.3
0
1
2(c) DC current
A [p
u]
2 2.05 2.1 2.15 2.2 2.25 2.3
0
1
2(d) DC Voltages
V [p
u]
2 2.05 2.1 2.15 2.2 2.25 2.3-2
0
2(e) AC voltage VSC
V [p
u]
2 2.05 2.1 2.15 2.2 2.25 2.3
0
1
2(f) Active and Reactive Power in the VSC
time [s]
VA
[pu]
(b)Steady State up hybrid HVDC(From top to bottom) AC voltage in the rectifier, Active and reactivepower in the rectifier, DC current, DC voltage, AC voltage in the inverter,
Active and Reactive power in the inverter.
http://www.ntnu.no/elkraft/energiomforming/ [email protected]
87
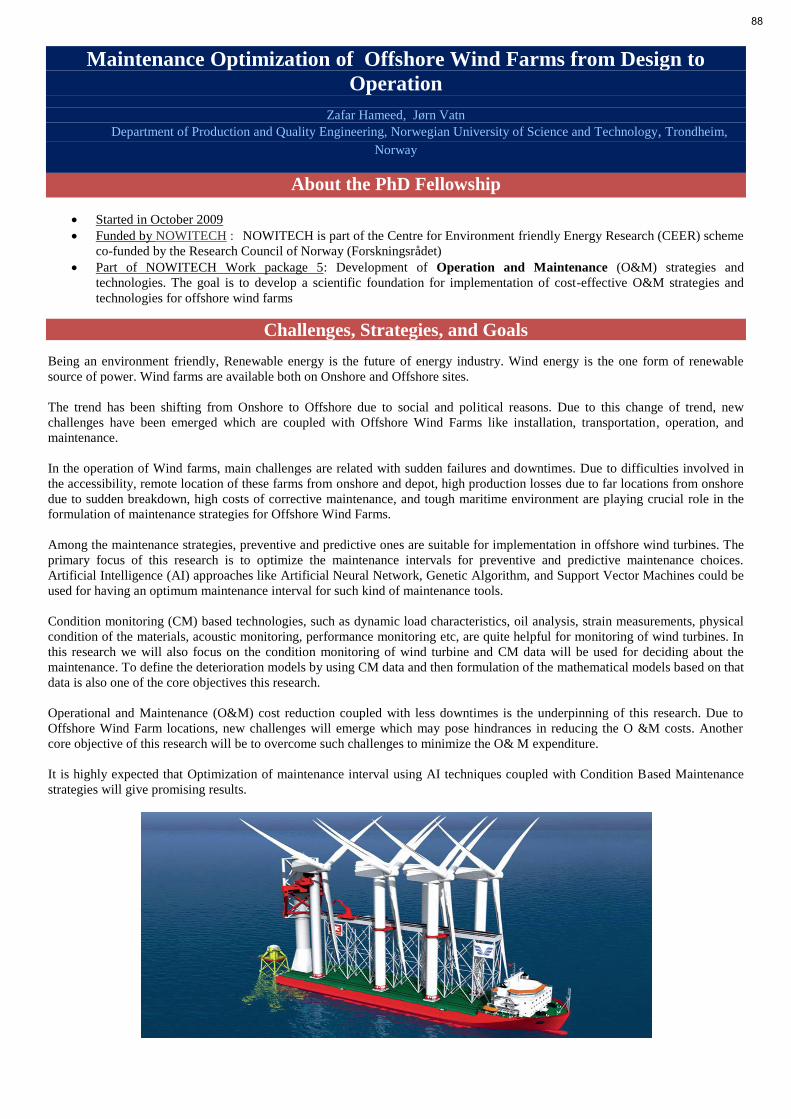
Maintenance Optimization of Offshore Wind Farms from Design to
Operation
Zafar Hameed, Jørn Vatn Department of Production and Quality Engineering, Norwegian University of Science and Technology, Trondheim,
Norway
About the PhD Fellowship
Started in October 2009
Funded by NOWITECH : NOWITECH is part of the Centre for Environment friendly Energy Research (CEER) scheme
co-funded by the Research Council of Norway (Forskningsrådet)
Part of NOWITECH Work package 5: Development of Operation and Maintenance (O&M) strategies and
technologies. The goal is to develop a scientific foundation for implementation of cost-effective O&M strategies and
technologies for offshore wind farms
Challenges, Strategies, and Goals
Being an environment friendly, Renewable energy is the future of energy industry. Wind energy is the one form of renewable
source of power. Wind farms are available both on Onshore and Offshore sites.
The trend has been shifting from Onshore to Offshore due to social and political reasons. Due to this change of trend, new
challenges have been emerged which are coupled with Offshore Wind Farms like installation, transportation, operation, and
maintenance.
In the operation of Wind farms, main challenges are related with sudden failures and downtimes. Due to difficulties involved in
the accessibility, remote location of these farms from onshore and depot, high production losses due to far locations from onshore
due to sudden breakdown, high costs of corrective maintenance, and tough maritime environment are playing crucial role in the
formulation of maintenance strategies for Offshore Wind Farms.
Among the maintenance strategies, preventive and predictive ones are suitable for implementation in offshore wind turbines. The
primary focus of this research is to optimize the maintenance intervals for preventive and predictive maintenance choices.
Artificial Intelligence (AI) approaches like Artificial Neural Network, Genetic Algorithm, and Support Vector Machines could be
used for having an optimum maintenance interval for such kind of maintenance tools.
Condition monitoring (CM) based technologies, such as dynamic load characteristics, oil analysis, strain measurements, physical
condition of the materials, acoustic monitoring, performance monitoring etc, are quite helpful for monitoring of wind turbines. In
this research we will also focus on the condition monitoring of wind turbine and CM data will be used for deciding about the
maintenance. To define the deterioration models by using CM data and then formulation of the mathematical models based on that
data is also one of the core objectives this research.
Operational and Maintenance (O&M) cost reduction coupled with less downtimes is the underpinning of this research. Due to
Offshore Wind Farm locations, new challenges will emerge which may pose hindrances in reducing the O &M costs. Another
core objective of this research will be to overcome such challenges to minimize the O& M expenditure.
It is highly expected that Optimization of maintenance interval using AI techniques coupled with Condition Based Maintenance
strategies will give promising results.
88

Determine
the
fatigue
reliability
of
tubular
joints at the
design stage based
on
design information
Quantify
the
effect
of
inspection
for a given inspection
strategy
at the
design
stage
Optimize
the
inspection
scheme
for tubular
joints at the
design stage
Decide
on
the
allowable
cumulative
damage
Δd
(Δd
is the
design Miner’s
sum
at failure) depending
upon
the
inspection
scheme
AbstractAbstract
Fatigue reliability analysis of Jacket-type offshore wind turbine considering inspection and repair
Wenbin
Dong , Zhen Gao
, Torgeir
MoanCentre
for Ships
and Ocean
Structures
(CeSOS), NTNU, Norway
ResultsResults
ObjectivesObjectives
ConclusionsConclusionsMethodsMethods
ReferencesReferences
www.cesos.ntnu.no CeSOS – Centre for Ships and Ocean Structures
MKCd
Cm
Jacket structure
Equivalent
monopile
structure
HAWC2 analysis
USFOS analysis
Design information
• Jacket structure
(partly
based
on
information
from Aker Solution)
– Water depth: 70 m
– Jacket height: 92 m
– Soil
data (Ekofisk)
• Wind
turbine
– 5MW NREL wind
turbine
– Tower
height:67 m; Weight:210 tonnes
– Nacelle
weight: 295 tonnes
– Blade
weight: 115 tonnes; Diameter: 126 m
– V: rated=12m/s, cutin=5m/s, cutout=25m/s
– Automatic
controller: Risø
Nat. Lab.
Simplified
method
to model
the
Jacket-type
offshore wind
turbine
• HAWC2
– Beam, simple structure
(monopile)
– Wind
force
(dominating)
– Operational
/ parked
conditions
• USFOS
– Imported nodal force from HAWC2
– Wave
and current
forces
– More complicated
response
analysis
(jacket)
Dynamic
response
analysis
• Excited
second
global mode contributes
to fatigue
damage
most
• Long-term
response
analysis
: wind
response
+ wave
response
• Long-term
statistical
distribution
of
stress ranges of
turbular
joints fits
weibull
distribution
Wind-induced quasi-static response
Wave-induced quasi-static response
Wind-induced dynamic response of the first global mode
Wind-induced dynamic response of thesecond global mode
Overturning moment in the
operational
condition
t T1 T2 T3 T41
1
0
1
0
00
1
1
1
01
01
1
01
10
0
1
0
1
0
1
0
1
0
1 = repair0 = no
repair
0
0
Inspection
scheme
– Reliability
calculation
:
Fatigue
reliability
calculation
considering
the
effect
of
inspection
and repair
• Safety
margin for failure
before
time t
0
0 0 (1 )ca
mm
a Y
da mM t C t T A
BY a
M(t) > 0, safety; M(t) < 0, failure
• Event
margin for inspection
0
0 1 0 1Da
mm
a Y
da mH C T T A
BY a
H > 0, crack
is not detected,no
repair; H < 0, crack
is detected, repair
• Fatigue
reliability
calculation
0 | 0 0fP P M H o rH
• Method
– FORM method
(First Order Reliability
Method)
– software: DNV Proban
– Failure
probability
considering
inspection
and repair
:
1 fP
[1].Mathisen Jan, O.Ronold
Knut, Sigurdssion
Gudfinnur. “PROBABILISTIC MODELLING FOR RELIABILITY ANALYSIS OF JACKETS”. Proc. the 23th OMAE Conference,Vancouver, Canada,1 January,2004
[2].Tong,K.C. “Technical and economic aspects of a floating offshore wind farm”, Journal of Wind Engineering and Industrial Aerodynamics,74-76(1998),399-410[3].Moan, T. 2005. “Reliability-based management of inspection, maintenance and repair of offshore structures”. Journal of Structure and Infrastructure engineering
1(1): 33-62[4].Vårdal, O.T. & Moan, T. 1997. ”Predicted versus Observed fatigue Crack Growth. Validation of Probabilistic Fracture Mechanics Analysis of Fatigue in North Sea
Jackets”. Proc. 16th OMAE Conference, Yokohama, 13-18 April 1997[5].Moan,T.& Hovde,G.O. Jiao, G.Y. 1994. “Fatigue reliability analysis of offshore structures considering the effect of inspection and repair”. Proc. the 6th ICOSSAR
Conference, Innsbruck, Austria. 9-13 August 1993[6].Newman,J.C. and I.S. Raju
1981. “An empirical stress-intensity factor equation for the surface crack”. Engineering Fracture Mechanics: Vol. 15, No. 1-2, 185-192[7].Marine Technology Directorate Limited 1992. Probability-based fatigue inspection planning. MTD Ltd Publication 92/100, London, England[8].Vosikovsky et al. 1985. “Fracture mechanics Assessment of Fatigue Life of Welded Plate T-Joints Including Thickness Effect”. Proc. of 4th BOSS:453-464.
Amsterdam: Elsevier, Amsterdam[9].Moan T.,G.O. Hovde
and A.M. Blanker 1993. “Reliability-Based Fatigue Design Criteria for Offshore Structures Considering the Effect of Inspection and Repair”. Proc. 25th
OTC:Vol.�,591-599, OTC 7189. Houston: Offshore Technology Conference[10].Burns, D.J., S.B.Lambert
and U.H.Mohaupt
1987. “Crack Growth Behaviour and Fracture Mechanics Approach”. Proc. of Conference on Steel in Marine Structures: Paper PS 6. Delft: Delft University of Technology
[11].Madsen, H.O. and J.D.Sorensen
1990. “Probability-based optimization of fatigue design, inspection and maintenance”. Proc. 4th Integrity of Offshore Structures: 421-438. London: Elsevier Applied Science
[12].Olesen, R. 1992. PROBAN General Purpose Probabilistic Analysis Program User’s Manual. Veritas
Sesam
Systems, Report No. 92-7049,Høvik, Norway[13].Almar-Næss, A.(Ed.), Fatigue Handbook for Offshore Steel Structures,1985 (Tapir Publisher Trondheim)[14].TSCF, Guidance Manual for Tankers Structures. Tanker Structure Cooperative Forum and IACS,1997 (Whitherby
Publishers: London)[15].Olufsen A.,Leira
B.J. ,Moan
T. etal. “UNCERTAINTY AND RELIABILITY ANALYSIS OF JACKET PLATFORM”, Journal of Structural Engineering, Vol. 118, No. 10. 1992
[16].Heredia-Zavoni,E; Silva-Gonzalez, F; Montes-Iturrizaga, R: “Reliability Analysis of Marine Platforms Subject to Fatigue Damage for Risk Based Inspection Planning”, Journal of Offshore Mechanics and Arctic Engineering, Vol.130,
2008[17].Jonkman J.M. “Development of Fully Coupled Aeroelastic
and Hydrodynamic Models for Offshore Wind Turbines”, proceeding of 2006 ASME Wind Energy Symposium, 2006
[18].Madhavan Pillai,T.M. Meher
Prasad, A. “Fatigue reliability analysis in time domain for inspection strategy of fixed offshore structures”, Ocean Engineering, 27(2000) 167-186
Fig.1 Reliability
index
for welded
joints in jackets as a function
of
time. No inspection
and repair
Fig. 2 Reliability
index
for welded
joints in jackets as a function
of
time. The
target level
is given by Δd = 0.2 and no
use
of
inspection
and repair, corresponding
to a0
=0.11 mm.The
inspection
and repair
scheme
is characterized
by 4 inspections, aD
=2.0 mm and aR
=0.11 mm.
Fig. 3 Reliability
index
for welded
joints in jackets as a function
of
time. The
target level
is given by Δd = 0.3 and no
use
of
inspection
and repair, corresponding
to a0
=0.11 mm.The
inspection
and repair
scheme
is characterized
by 4 inspections, aD
=2.0 mm and aR
=0.11 mm.
Fig. 4 Reliability
index
for welded
joints in jackets as a function
of
time. The
target level
is given by Δd = 0.4 and no
use
of
inspection
and repair, corresponding
to a0
=0.11 mm.The
inspection
and repair
scheme
is characterized
by 3 inspections
for Δd
= 0.5 and 4 inspections
for Δd = 0.6, aD
=2.0 mm and aR
=0.11 mm.
Fig. 6 Reliability
index
for welded
joints in jackets as a function
of
time. The
target level
is given by Δd = 0.7 and no
use
of
inspection
and repair, corresponding
to a0
=0.11 mm.The
inspection
and repair
scheme
is characterized
by 2 inspections, aD
=2.0 mm and aR
=0.11 mm.
Fig. 5 Reliability
index
for welded
joints in jackets as a function
of
time. The
target level
is given by Δd = 0.5 and no
use
of
inspection
and repair, corresponding
to a0
=0.11 mm.The
inspection
and repair
scheme
is characterized
by 3 inspections
for Δd
= 0.6 and 4 inspections
for Δd = 0.7, aD
=2.0 mm and aR
=0.11 mm.
( Note: β
is reliability
index
( , Φ
is standard normal probability
distribution
function) ; a0
is the
initial crack
size; aD
is the
detectable
crack
size
which
is assumed
given by the
POD curve; aR
is the
initial crack
size
after
repair; a/c is the
crack
aspect
ratio ; Mred
is a parameter representing
effects
due to local
weld
toe smoothing, which
is used in the
local
stress intensity
magnification
factor. )
1 ( )Ft P t
Wenbin Dong
PhD candidate ,
CeSOS, NTNU,
Norway. Research topic: Reliability of offshore wind turbines .
Zhen Gao
Post. Doc , CeSOS, NTNU, Norway.
Torgeir Moan
Supervisor and director , CeSOS, NTNU, Norway.
In present paper
the
effect
of
inspection
depending
upon
its
quality
for a given inspection
strategy
for welded
tubular
joints in jacket-type
offshore wind
turbine
structures
has been
quantified
by using
probabilistic
methods. The
conclusions
are
taken
from the
following
assumptions: welded
joints in North Sea
structures, 4year
inspection
interval, mean
crack
size
after
repair
mm and mean
detectable
crack
sizemm .
0.11Ra 2.0
Da
Based
on
the
OWTS model
used in present paper, for tubular
joints, loaded
by bending and tensile
stresses with
a bending-tension
stress ratio of
4.0, the
allowable
cumulative
damage
,when
no
inspection
and repair
is implemented, is assumed
to be 0.2,0.3,0.4,0.5 and 0.7 respectively. For the
case of
Δd
=0.2, it may
not be relaxed, when
inspection
scheme
as described
above
is considered, as shown
in Fig. 2 ; for the
case of
Δd
=0.3, it may
be relaxed
to 0.4, as shown
in Fig. 3; for the
case of
Δd
=0.4, it may
be relaxed
to 0.5-0.6,as shown
in Fig. 4; for the
case of
Δd
=0.5, it may
be relaxed
to 0.6-0.7, as shown
in Fig. 5; for the
case of
Δd
=0.7, it may
be relaxed
to 0.8, and only
2 inspections
may
be implemented, as shown
in Fig. 6 .
Based
on
the
experience
in offshore oil
and gas industry
in North sea, the
inspection
reliability
is rather
ambitious, especially
for tubular
joints in jackets, therefore, the
relaxation
in design criteria
shown
representsa maximum
effect
of
inspection
on
design criteria.
The present paper focuses on fatigue reliability prediction analysis of tubular joints of a fixed jacket offshore wind turbine designed for a North Sea site in a water depth of 70 m. For fatigue analysis, one of the most important parts is the calculation of long term statistical response of structures. The response analysis of OWTS must take account for the dynamic coupling between the support structure platform motions and turbine motions, and this is a challenge now. The present paper uses a simplified method to model the Jacket-type offshore wind turbine and calculates the load effect. Wind load is obtained in
HAWC2 well known software for simulation of wind turbine response in time domain, and dynamic response of whole structure is obtained in USFOS well known software for dynamic response analysis of space frame structures.
In order to quantify the effect fo
inspection depending upon its quality for a given inspection strategy and optimize the inspection scheme at the design stage,
a reliability based fracture mechanics (FM) which depends on the quality of inspection in terms of probability of crack detection curves is presented in this paper . The long term statistical distribution of stress ranges of tubular joints is obtained by combination of time domain simulation for representative sea states and SN-Miner-Palmgren
approach. Target safety levels are taken from SN-Miner-Palmgren
approach with no effect of inspection.
Offshore wind turbines (OWTS) are subjected to the severe environmental loads and are less in accessible than land-based turbines. Generally, the operation of OWTS is above five to ten times more expensive than work on land. Considering these issues, reliability of OWTS iscrucial. Methods for reliability of OWTS are therefore needed.
89

INTRODUCTION AND OBJECTIVES
In a wind farm, space and economic constraints make it impossible to locate turbines sufficiently apart to prevent interactions between them. The effect of these interactions may have severe implications on the downstream turbines which are located in the wake of the upstream turbine. The power losses from the downstream turbine due to velocity deficit depends, among other factors, on the performance characteristics of the upstream turbine and distance between the turbines. Despite the practical importance of this flow, experimental information on the performance of a turbine under the effect of wake interference are difficult to come by in open literature. This poster presents the performance characteristics of a model wind turbine operating in the wake of another turbine. The effects of distance of separation between the turbines and the operating condition of the upstream turbine on performance of the downstream turbine were investigated.
EXPERIMENTAL SET-UP
Experimental Study of Two Model Wind Turbines in Experimental Study of Two Model Wind Turbines in Tandem ArrangementTandem Arrangement
M. S. AdaramolaM. S. Adaramola** and Pand P--ÅÅ KrogstadKrogstadDepartment of Energy and Process Engineering, Norwegian University of Science and Technology,
N-7491 Trondheim, Norway
*E-mail: [email protected]; Tel: +47-97690282
RESULTS
0.0 2.0 4.0 6.0 8.0 10.0 12.00.00
0.10
0.20
0.30
0.40
0.50(a)
CP
Low Optimum High
0.0 2.0 4.0 6.0 8.0 10.0 12.00.00
0.20
0.40
0.60
0.80
1.00
1.20
1.40
1.60
1.80
(b) Low Optimum High
CT
Figure 2: Wake interference effect on the downstream model turbine performance at different S/D locations (a) power coefficient and (b) thrust coefficient.
Single turbine Low Optimum High0.00
0.20
0.40
0.60
0.80
1.00
1.20
(b)
Rel
ativ
e m
axim
um C
P
Figure 3: Wake interference effect on the downstream turbine performance at different upstream operating condition (a) power coefficient and (b) thrust coefficient.
Figure 4: The relative maximum power coefficient (a) downstream distance effect and (b) upstream turbine operating at different tip speed ratios.
ConclusionsThe results presented in this poster shows that the power losses for a turbine operating in the wake of another is significant. In this study, it was observed that the loss in maximum power coefficient varies between about 29 and 45% depending on the distance between the turbines and the operating tip speed ratio of the upstream turbine. Compared with the unobstructed turbine, the thrust of the downstream turbine is generally lower. The reduction in power coefficient and thrust coefficient from the downstream turbine is as a result of the velocity deficit in the wake so that the downstream turbine sees a considerably lower freestream velocity than the upstream turbine and thus, less energy is available in the air stream.
However, by adjusting the operating condition of the upstream turbine, the power output from the downstream turbine can be substantially enhanced. When the upstream turbine was operating at different tip speed ratios, the highest and lowest loss in maximum power coefficient occured when the upstream turbine was operating at low tip speed and optimum tip speed ratios, respectively. This is because at low and high tip speed ratios, less energy is extracted from the air stream by the upstream turbine compared with when it is operating at optimum tip speed ratio and this leads to relatively higher wind speed in the wake of the upstream turbine. This results in increased power and thrust coeffcients of the downstream turbine.
0.00
0.20
0.40
0.60
0.80
1.00
1.20
(a)
Single turbine S/D = 3 S/D = 6 S/D = 9
Re
lativ
e m
axi
mu
m C
P
0.0 2.0 4.0 6.0 8.0 10.0 12.00.00
0.10
0.20
0.30
0.40
0.50
(a)
CP
Single turbine S/D = 3 S/D = 6 S/D = 9
0.0 2.0 4.0 6.0 8.0 10.0 12.00.00
0.20
0.40
0.60
0.80
1.00
1.20
1.40
1.60
1.80
Single turbine S/D = 3 S/D = 3 S/D = 3
(b)
CT
PRESENTED AT: WIND POWER R&D SEMINAR – DEEP SEA OFFSHORE WIND POWER, 21-22 JANUARY 2010, TRONDHEIM, NORWAY
Figure 1: Schematic diagram of the experimental set-up.
90
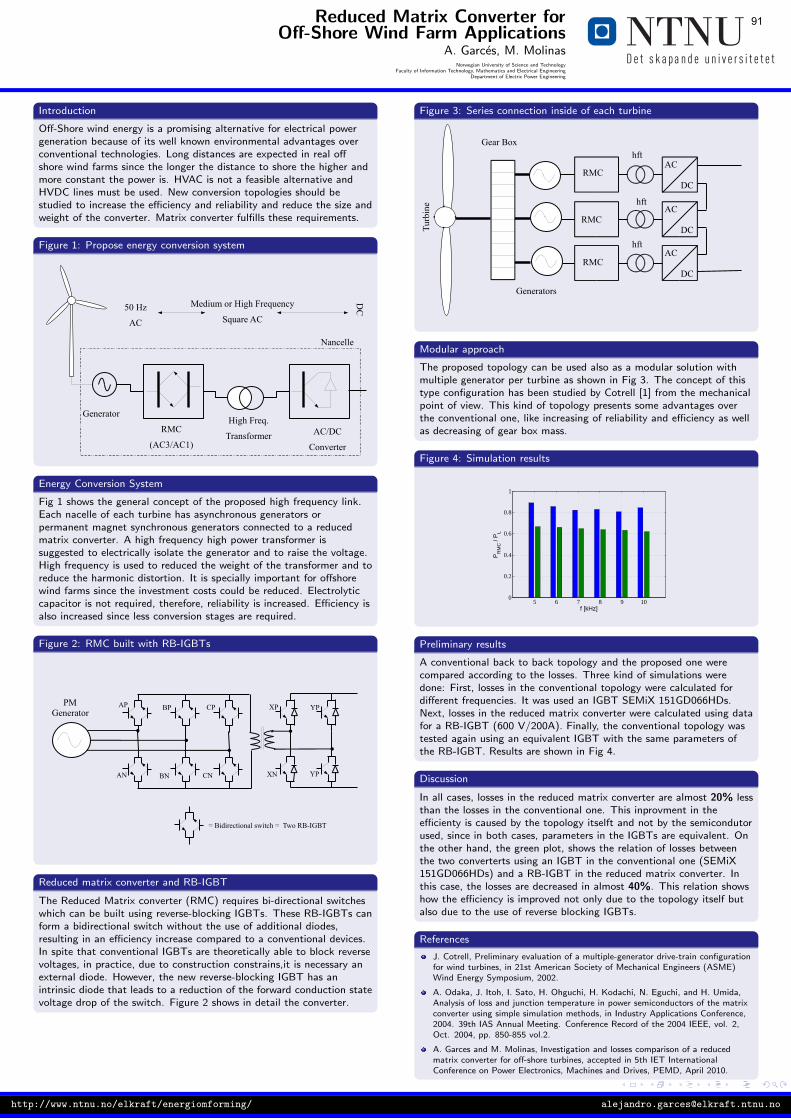
Reduced Matrix Converter forOff-Shore Wind Farm Applications
A. Garces, M. MolinasNorwegian University of Science and Technology
Faculty of Information Technology, Mathematics and Electrical EngineeringDepartment of Electric Power Engineering
Introduction
Off-Shore wind energy is a promising alternative for electrical powergeneration because of its well known environmental advantages overconventional technologies. Long distances are expected in real offshore wind farms since the longer the distance to shore the higher andmore constant the power is. HVAC is not a feasible alternative andHVDC lines must be used. New conversion topologies should bestudied to increase the efficiency and reliability and reduce the size andweight of the converter. Matrix converter fulfills these requirements.
Figure 1: Propose energy conversion system
Generator
RMC
(AC3/AC1)
High Freq.
Transformer AC/DC
Converter
DC50 Hz
AC
Medium or High Frequency
Square AC
Nancelle
Energy Conversion System
Fig 1 shows the general concept of the proposed high frequency link.Each nacelle of each turbine has asynchronous generators orpermanent magnet synchronous generators connected to a reducedmatrix converter. A high frequency high power transformer issuggested to electrically isolate the generator and to raise the voltage.High frequency is used to reduced the weight of the transformer and toreduce the harmonic distortion. It is specially important for offshorewind farms since the investment costs could be reduced. Electrolyticcapacitor is not required, therefore, reliability is increased. Efficiency isalso increased since less conversion stages are required.
Figure 2: RMC built with RB-IGBTs
PMGenerator
AP BP CP
AN BN CN
= Bidirectional switch = Two RB-IGBT
XP
XN
YP
YP
Reduced matrix converter and RB-IGBT
The Reduced Matrix converter (RMC) requires bi-directional switcheswhich can be built using reverse-blocking IGBTs. These RB-IGBTs canform a bidirectional switch without the use of additional diodes,resulting in an efficiency increase compared to a conventional devices.In spite that conventional IGBTs are theoretically able to block reversevoltages, in practice, due to construction constrains,it is necessary anexternal diode. However, the new reverse-blocking IGBT has anintrinsic diode that leads to a reduction of the forward conduction statevoltage drop of the switch. Figure 2 shows in detail the converter.
Figure 3: Series connection inside of each turbine
RMCAC DC
hft
Turb
ine
Generators
Gear Box
RMCAC DC
hft
RMCAC DC
hft
Modular approach
The proposed topology can be used also as a modular solution withmultiple generator per turbine as shown in Fig 3. The concept of thistype configuration has been studied by Cotrell [1] from the mechanicalpoint of view. This kind of topology presents some advantages overthe conventional one, like increasing of reliability and efficiency as wellas decreasing of gear box mass.
Figure 4: Simulation results
5 6 7 8 9 100
0.2
0.4
0.6
0.8
1P
RM
C /
PL
f [kHz]
Preliminary results
A conventional back to back topology and the proposed one werecompared according to the losses. Three kind of simulations weredone: First, losses in the conventional topology were calculated fordifferent frequencies. It was used an IGBT SEMiX 151GD066HDs.Next, losses in the reduced matrix converter were calculated using datafor a RB-IGBT (600 V/200A). Finally, the conventional topology wastested again using an equivalent IGBT with the same parameters ofthe RB-IGBT. Results are shown in Fig 4.
Discussion
In all cases, losses in the reduced matrix converter are almost 20% lessthan the losses in the conventional one. This inprovment in theefficienty is caused by the topology itselft and not by the semicondutorused, since in both cases, parameters in the IGBTs are equivalent. Onthe other hand, the green plot, shows the relation of losses betweenthe two converterts using an IGBT in the conventional one (SEMiX151GD066HDs) and a RB-IGBT in the reduced matrix converter. Inthis case, the losses are decreased in almost 40%. This relation showshow the efficiency is improved not only due to the topology itself butalso due to the use of reverse blocking IGBTs.
References
J. Cotrell, Preliminary evaluation of a multiple-generator drive-train configurationfor wind turbines, in 21st American Society of Mechanical Engineers (ASME)Wind Energy Symposium, 2002.
A. Odaka, J. Itoh, I. Sato, H. Ohguchi, H. Kodachi, N. Eguchi, and H. Umida,Analysis of loss and junction temperature in power semiconductors of the matrixconverter using simple simulation methods, in Industry Applications Conference,2004. 39th IAS Annual Meeting. Conference Record of the 2004 IEEE, vol. 2,Oct. 2004, pp. 850-855 vol.2.
A. Garces and M. Molinas, Investigation and losses comparison of a reducedmatrix converter for off-shore turbines, accepted in 5th IET InternationalConference on Power Electronics, Machines and Drives, PEMD, April 2010.
http://www.ntnu.no/elkraft/energiomforming/ [email protected]
91
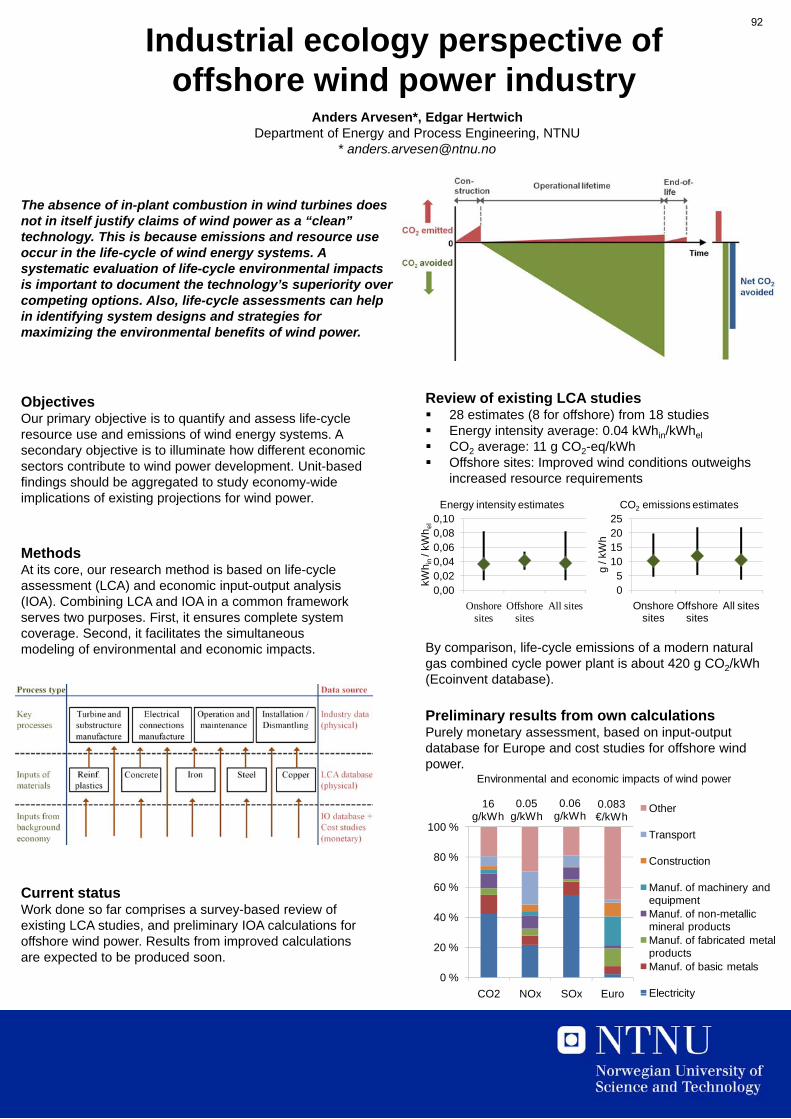
Industrial ecology perspective of offshore wind power industry
Anders Arvesen*, Edgar Hertwich
The absence of in-plant combustion in wind turbines does not in itself justify claims of wind power as a “clean” technology. This is because emissions and resource use
i th lif l f i d t A
gDepartment of Energy and Process Engineering, NTNU
occur in the life-cycle of wind energy systems. A systematic evaluation of life-cycle environmental impacts is important to document the technology’s superiority over competing options. Also, life-cycle assessments can help in identifying system designs and strategies for maximizing the environmental benefits of wind power.
ObjectivesOur primary objective is to quantify and assess life-cycle resource use and emissions of wind energy systems. A secondary objective is to illuminate how different economic sectors contribute to wind power development. Unit-based findings should be aggregated to study economy-wide implications of existing projections for wind power
Review of existing LCA studies 28 estimates (8 for offshore) from 18 studies Energy intensity average: 0.04 kWhin/kWhel
CO2 average: 11 g CO2-eq/kWh Offshore sites: Improved wind conditions outweighs
increased resource requirements
implications of existing projections for wind power.
MethodsAt its core, our research method is based on life-cycle assessment (LCA) and economic input-output analysis (IOA). Combining LCA and IOA in a common framework serves two purposes. First, it ensures complete system
0,000,020,040,060,080,10
Onshore sites
Offshore sites
All sites
kWh
in/
kWh
el
Energy intensity estimates
05
10152025
Onshore sites
Offshore sites
All sitesg
/ kW
h
CO2 emissions estimates
serves two purposes. First, it ensures complete system coverage. Second, it facilitates the simultaneous modeling of environmental and economic impacts.
Preliminary results from own calculationsPurely monetary assessment, based on input-output d t b f E d t t di f ff h i d
sites sites sites sites
By comparison, life-cycle emissions of a modern natural gas combined cycle power plant is about 420 g CO2/kWh (Ecoinvent database).
database for Europe and cost studies for offshore wind power.
80 %
100 %
Environmental and economic impacts of wind power
Other
Transport
Construction
16g/kWh
0.06g/kWh
0.083€/kWh
0.05g/kWh
Current statusWork done so far comprises a survey-based review of existing LCA studies, and preliminary IOA calculations for offshore wind power. Results from improved calculations are expected to be produced soon.
0 %
20 %
40 %
60 %
CO2 NOx SOx Euro
Manuf. of machinery and equipmentManuf. of non-metallic mineral productsManuf. of fabricated metal productsManuf. of basic metals
ElectricityCO2 NOx SOx Euro Electricity
92
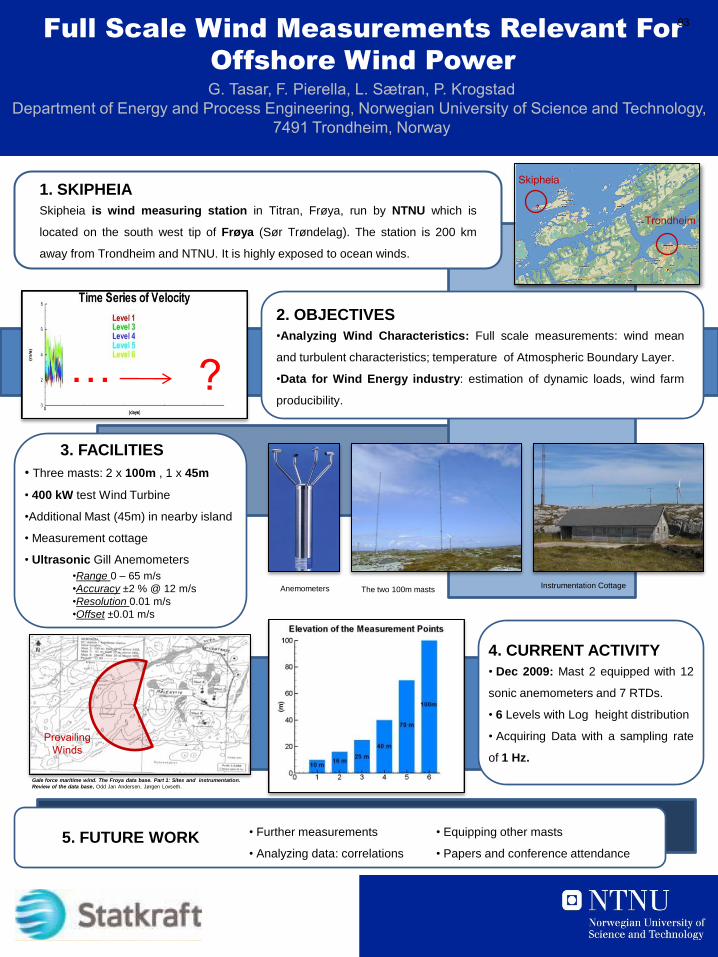
3. FACILITIES
• Three masts: 2 x 100m , 1 x 45m
• 400 kW test Wind Turbine
•Additional Mast (45m) in nearby island
• Measurement cottage
• Ultrasonic Gill Anemometers
•Range 0 – 65 m/s
•Accuracy ±2 % @ 12 m/s
•Resolution 0.01 m/s
•Offset ±0.01 m/s
Full Scale Wind Measurements Relevant For
Offshore Wind Power
G. Tasar, F. Pierella, L. Sætran, P. KrogstadDepartment of Energy and Process Engineering, Norwegian University of Science and Technology,
7491 Trondheim, Norway
1. SKIPHEIA
Skipheia is wind measuring station in Titran, Frøya, run by NTNU which is
located on the south west tip of Frøya (Sør Trøndelag). The station is 200 km
away from Trondheim and NTNU. It is highly exposed to ocean winds.
PrevailingWinds
Skipheia
Trondheim
2. OBJECTIVES
•Analyzing Wind Characteristics: Full scale measurements: wind mean
and turbulent characteristics; temperature of Atmospheric Boundary Layer.
•Data for Wind Energy industry: estimation of dynamic loads, wind farm
producibility.
4. CURRENT ACTIVITY
• Dec 2009: Mast 2 equipped with 12
sonic anemometers and 7 RTDs.
• 6 Levels with Log height distribution
• Acquiring Data with a sampling rate
of 1 Hz.
The two 100m mastsInstrumentation CottageAnemometers
… ?
5. FUTURE WORK • Equipping other masts
• Papers and conference attendance
• Further measurements
• Analyzing data: correlations
Gale force maritime wind. The Froya data base. Part 1: Sites and instrumentation.
Review of the data base, Odd Jan Andersen, Jørgen Lovseth.
93

Wave Period
Wave heigth
Win
d sp
eed
Figure 3: Illustration of joint wind and wave spectra
Evaluation of the Dimensioning Dynamic Forces on Large Floating Wind Turbines
PhD programme: NOWITECH (NTNU/SINTEF/IFE) Candidate: Lars Frøyd
• Startup: August 2009• Duration: 3 years• Advisor: Professor Ole Gunnar Dahlhaug• Co-advisors: None. Suggestions are welcome!
• Funded by NOWITECH. NOWITECH is part of the Centre for Environment-friendly Energy Research (CEER) scheme co-funded by the Research Council of Norway (Forskningsrådet).
• Part of NOWITECH Work Package 1: Development of integrated numerical design tools for novel o�shore wind energy concepts. The goal of WP1 is estab-lishment of a set of proven tools for integrated design of deep-sea wind tur-bines, hereunder characterization and interaction of wind, wave and current
About the PhD fellowship
Background
Possible research areas of interest
Figure 1: Spar buoy type �oating wind turbine in severe sea state
To facilitate safe and economic design of floating wind turbines (FWT) it is necessary to have a good description of the physical environment that the wind turbine is subject to. This includes knowledge of which loads and load combinations are relevant for design of the di�erent components of the wind turbine.
For land based and bottom fixed wind turbines there exist standards that define these load cases, but none exist at the present for floating wind tur-bines. It is believed that the existing standards are not sufficient, as the in-fluence of waves and current will have relatively larger influence on the floating turbine.
For calculations of the fatigue loading, it is customary to use aero-elastic simulation codes. For wind turbines, the averaging time is 10 min, whereas the mean sea-state period usually is 1-3 hours. Is there a need for different approaches to keep calculation cost at a reasonable level?• Investigation of relevant load cases (LC’s) for FWT:
Onshore wind fatigue LC’s use 600 s turbulent simulations. Still they are quite time consuming. For FWT’s, the number of possibly relevant LC’s are much larger: Combined wind, wave height, wave frequency and current. What about wind, wave and current directions? Can you always be sure that aligned loads are more severe than misaligned loads? To reduce the numbers of LC’s one needs to find out which are the relevant load combinations.
• Measurement of o�shore wind conditions (Frøya or o�shore location)Possibly joint wind and wave measurements if there exist facilities to do so.
• Veri�cation of aero-elastic software for �oating turbines:The aero-elastic software used today was created for onshore turbines. To check the compatibility with FWT, the IEA OC3 Phase IV has done benchmark tests, comparing the different codes. Comparison with a prototype floating turbine, i.e. Hywind test data, would be even more valuable.
• Investigation of control methods to reduce fatigue loading:Large FWT’s might need state-of-the-art control methods for load reduction and to achieve good performance vs. fatigue characteristics.
• Investigation of novel turbine concepts to reduce fatigue loading or top weight: High speed downwind rotors can be made very lightweight and flex-ible to reduce the weight. With a strong flap/twist coupling it could be possi-ble to reduce the loads even further.
• Does every turbine have to be an advanced multi MW power plant?Maybe simpler and smaller (1-3 MW) turbines with inherent load reducing ca-pabilities, two-blade tethering or flapping hubs can prove more economic?
• Do you have suggestions of FWT related areas that need research? Please tell me, I am very open for suggestions and discussions!
About me
2 4 6 8 10 12 14 16 18 20 22
2
4
6
8
10
12
14
16
18
Wave period T (s)
Sign
ifica
nt w
ave h
eigh
t H1/
3 (m
)
Figure 2: Joint frequency wave power spectrum. Haltenbanken
0
0.2
0.4
0.6
0.8
1
• Name: Lars Frøyd• Age: 25• Nationality: Norwegian• MSc in Energy and Environment from NTNU. Graduated 2009• Master thesis: Evaluation of Control Strategies for Wind Turbine with Hydrau-lic Drive train by Means of Aero-Elastic Analysis.• Contact information: work: [email protected] private: [email protected]
94
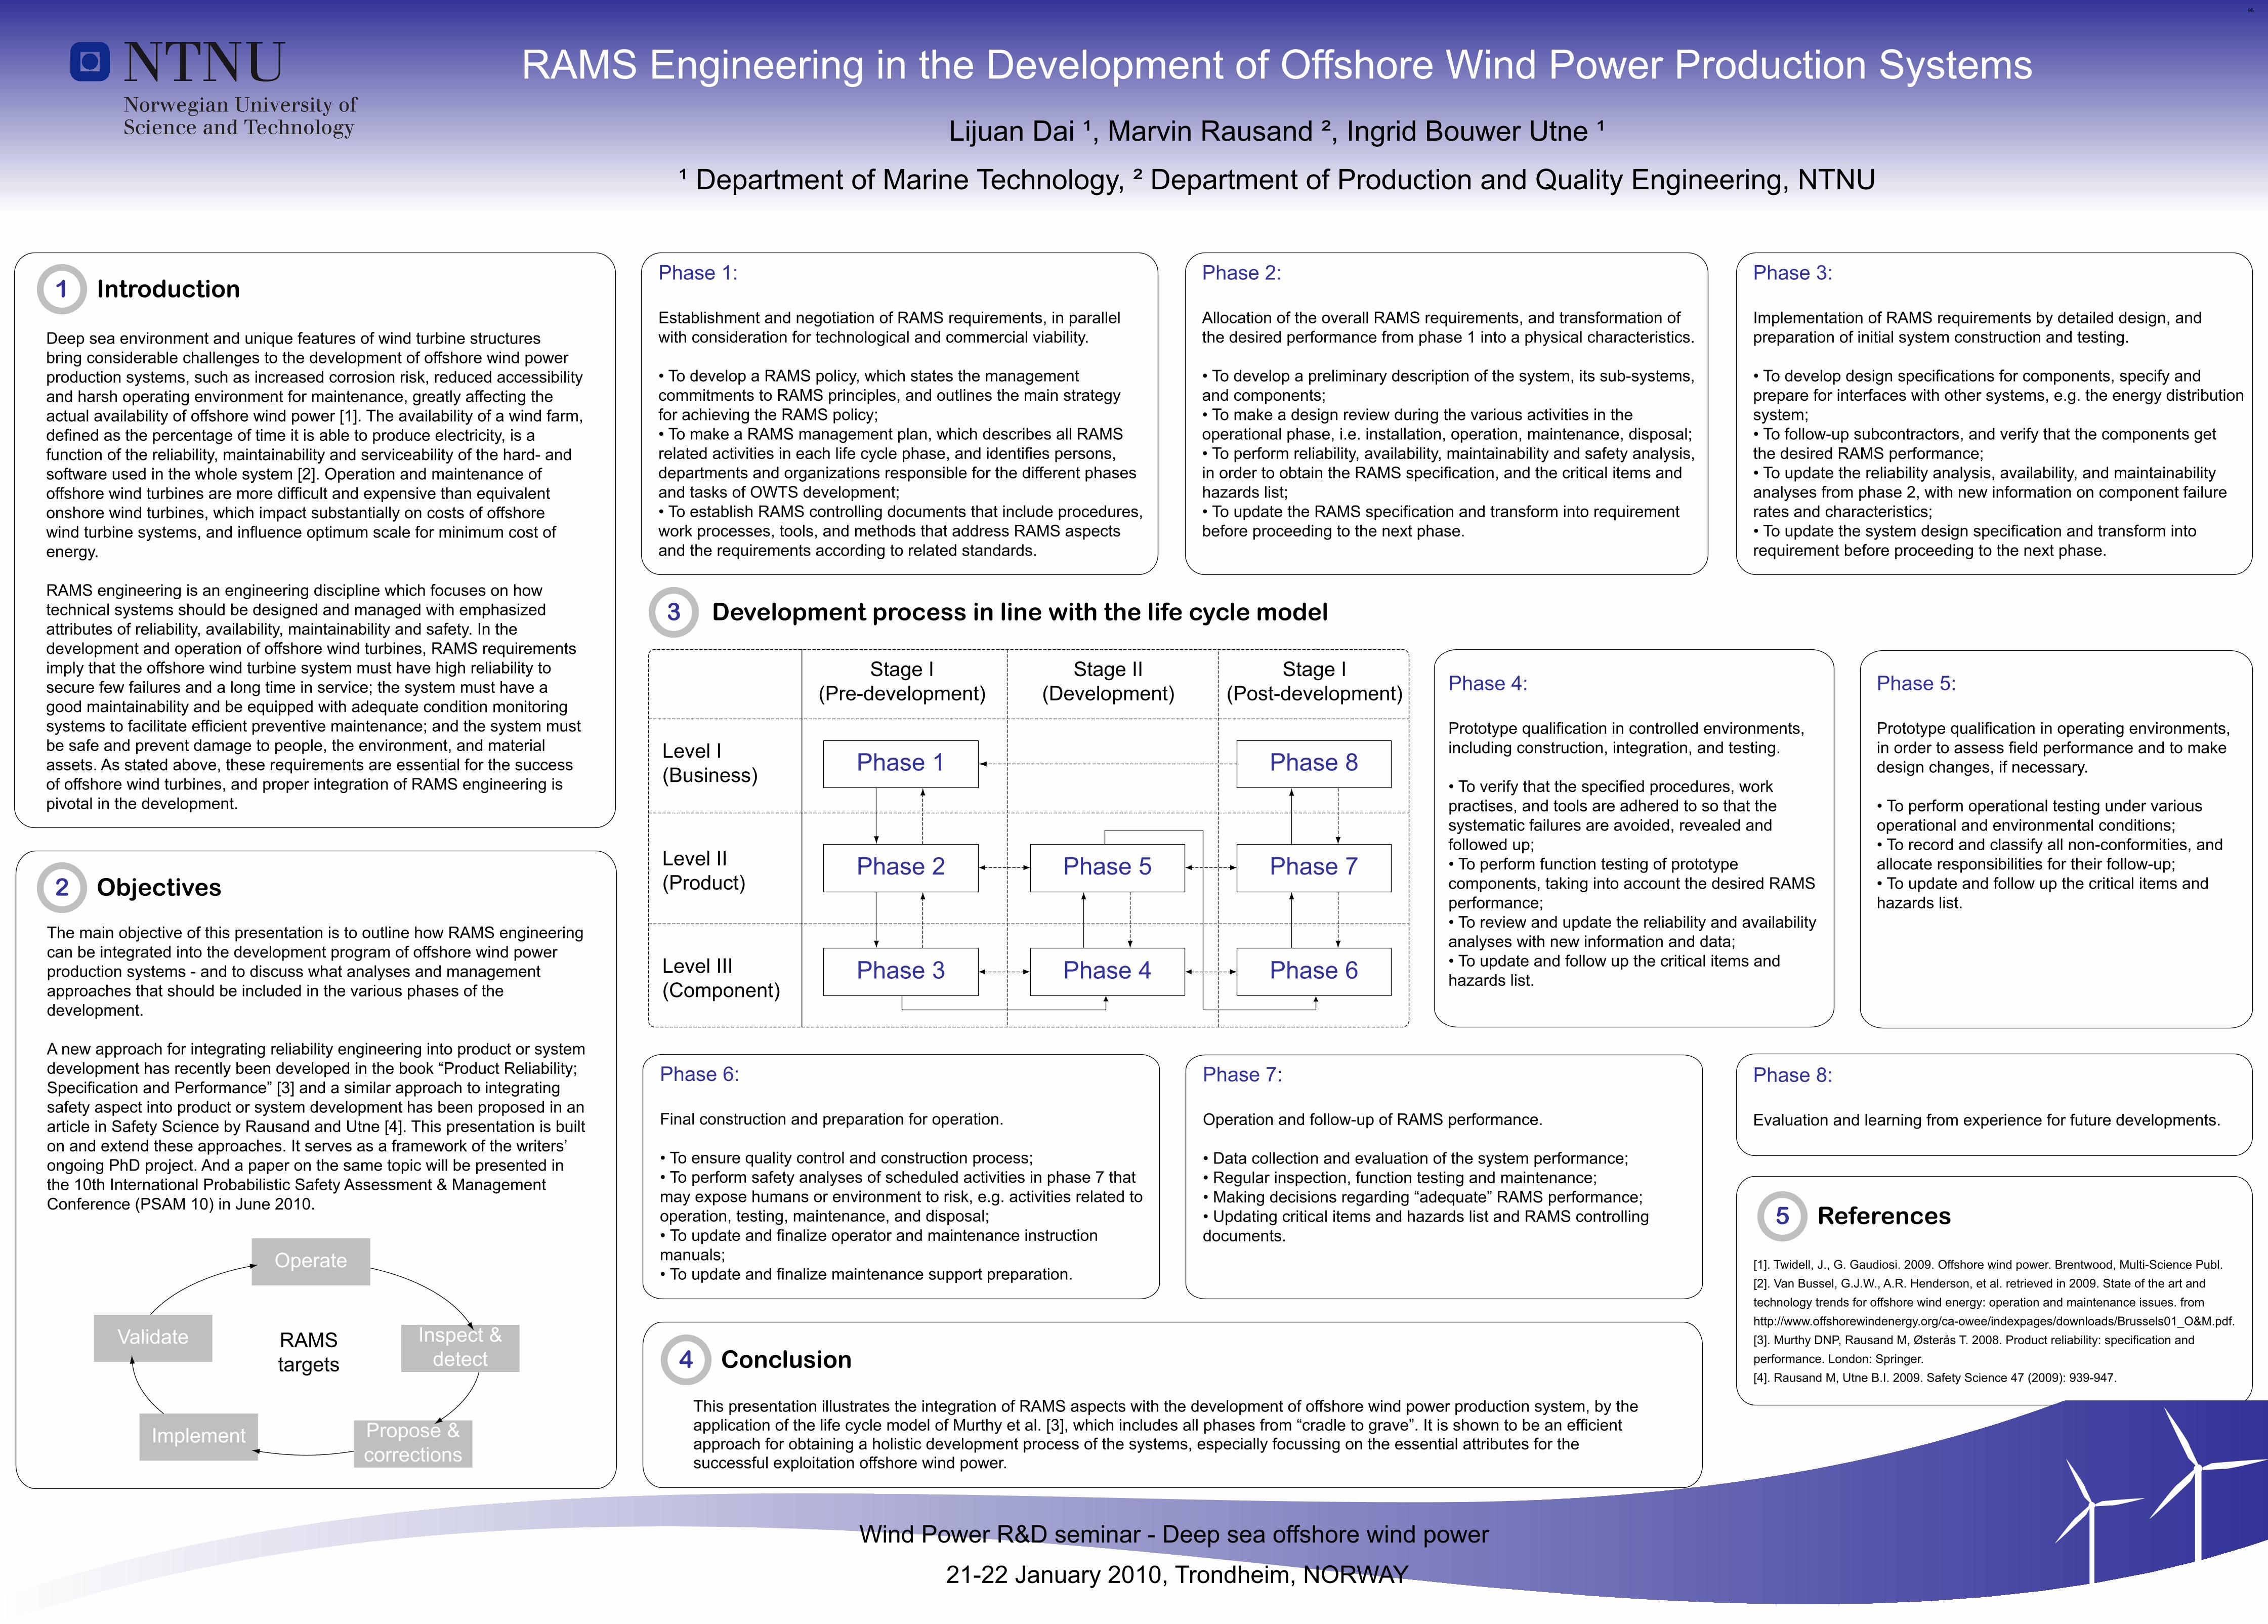
RAMS Engineering in the Development of Offshore Wind Power Production SystemsLijuan Dai ¹, Marvin Rausand ², Ingrid Bouwer Utne ¹
¹ Department of Marine Technology, ² Department of Production and Quality Engineering, NTNU
Wind Power R&D seminar - Deep sea offshore wind power
21-22 January 2010, Trondheim, NORWAY
Phase 1
Phase 2
Phase 3 Phase 4
Phase 5
Phase 6
Phase 7
Phase 8
Stage I(Pre-development)
Stage II(Development)
Stage I(Post-development)
Level I(Business)
Level II(Product)
Level III(Component)
Phase 1: Establishment and negotiation of RAMS requirements, in parallel with consideration for technological and commercial viability.
• To develop a RAMS policy, which states the management commitments to RAMS principles, and outlines the main strategy for achieving the RAMS policy;• To make a RAMS management plan, which describes all RAMS related activities in each life cycle phase, and identifies persons, departments and organizations responsible for the different phases and tasks of OWTS development;• To establish RAMS controlling documents that include procedures, work processes, tools, and methods that address RAMS aspects and the requirements according to related standards.
Phase 2: Allocation of the overall RAMS requirements, and transformation of the desired performance from phase 1 into a physical characteristics.
• To develop a preliminary description of the system, its sub-systems, and components;• To make a design review during the various activities in the operational phase, i.e. installation, operation, maintenance, disposal;• To perform reliability, availability, maintainability and safety analysis,in order to obtain the RAMS specification, and the critical items and hazards list;• To update the RAMS specification and transform into requirement before proceeding to the next phase.
Phase 3: Implementation of RAMS requirements by detailed design, and preparation of initial system construction and testing.
• To develop design specifications for components, specify and prepare for interfaces with other systems, e.g. the energy distributionsystem;• To follow-up subcontractors, and verify that the components getthe desired RAMS performance;• To update the reliability analysis, availability, and maintainability analyses from phase 2, with new information on component failure rates and characteristics;• To update the system design specification and transform into requirement before proceeding to the next phase.
Phase 4: Prototype qualification in controlled environments,including construction, integration, and testing.
• To verify that the specified procedures, work practises, and tools are adhered to so that the systematic failures are avoided, revealed and followed up;• To perform function testing of prototype components, taking into account the desired RAMSperformance;• To review and update the reliability and availabilityanalyses with new information and data;• To update and follow up the critical items and hazards list.
Phase 5: Prototype qualification in operating environments,in order to assess field performance and to makedesign changes, if necessary.
• To perform operational testing under various operational and environmental conditions;• To record and classify all non-conformities, andallocate responsibilities for their follow-up;• To update and follow up the critical items and hazards list.
Phase 6: Final construction and preparation for operation.
• To ensure quality control and construction process;• To perform safety analyses of scheduled activities in phase 7 thatmay expose humans or environment to risk, e.g. activities related tooperation, testing, maintenance, and disposal;• To update and finalize operator and maintenance instructionmanuals;• To update and finalize maintenance support preparation.
Phase 7: Operation and follow-up of RAMS performance.
• Data collection and evaluation of the system performance;• Regular inspection, function testing and maintenance;• Making decisions regarding “adequate” RAMS performance;• Updating critical items and hazards list and RAMS controlling documents.
3 Development process in line with the life cycle model
1 Introduction
Deep sea environment and unique features of wind turbine structures bring considerable challenges to the development of offshore wind power production systems, such as increased corrosion risk, reduced accessibility and harsh operating environment for maintenance, greatly affecting the actual availability of offshore wind power [1]. The availability of a wind farm, defined as the percentage of time it is able to produce electricity, is a function of the reliability, maintainability and serviceability of the hard- and software used in the whole system [2]. Operation and maintenance of offshore wind turbines are more difficult and expensive than equivalent onshore wind turbines, which impact substantially on costs of offshore wind turbine systems, and influence optimum scale for minimum cost of energy.
RAMS engineering is an engineering discipline which focuses on how technical systems should be designed and managed with emphasized attributes of reliability, availability, maintainability and safety. In the development and operation of offshore wind turbines, RAMS requirements imply that the offshore wind turbine system must have high reliability to secure few failures and a long time in service; the system must have a good maintainability and be equipped with adequate condition monitoring systems to facilitate efficient preventive maintenance; and the system must be safe and prevent damage to people, the environment, and material assets. As stated above, these requirements are essential for the successof offshore wind turbines, and proper integration of RAMS engineering is pivotal in the development.
Phase 8: Evaluation and learning from experience for future developments.
2 Objectives
The main objective of this presentation is to outline how RAMS engineeringcan be integrated into the development program of offshore wind powerproduction systems - and to discuss what analyses and management approaches that should be included in the various phases of the development.
A new approach for integrating reliability engineering into product or system development has recently been developed in the book “Product Reliability;Specification and Performance” [3] and a similar approach to integrating safety aspect into product or system development has been proposed in an article in Safety Science by Rausand and Utne [4]. This presentation is builton and extend these approaches. It serves as a framework of the writers’ongoing PhD project. And a paper on the same topic will be presented in the 10th International Probabilistic Safety Assessment & ManagementConference (PSAM 10) in June 2010.
Operate
Inspect &detect
Propose &corrections
Validate
Implement
RAMStargets 4 Conclusion
5 References
[1]. Twidell, J., G. Gaudiosi. 2009. Offshore wind power. Brentwood, Multi-Science Publ.[2]. Van Bussel, G.J.W., A.R. Henderson, et al. retrieved in 2009. State of the art and technology trends for offshore wind energy: operation and maintenance issues. from http://www.offshorewindenergy.org/ca-owee/indexpages/downloads/Brussels01_O&M.pdf.[3]. Murthy DNP, Rausand M, Østerås T. 2008. Product reliability: specification and performance. London: Springer.[4]. Rausand M, Utne B.I. 2009. Safety Science 47 (2009): 939-947.
This presentation illustrates the integration of RAMS aspects with the development of offshore wind power production system, by the application of the life cycle model of Murthy et al. [3], which includes all phases from “cradle to grave”. It is shown to be an efficient approach for obtaining a holistic development process of the systems, especially focussing on the essential attributes for the successful exploitation offshore wind power.
95
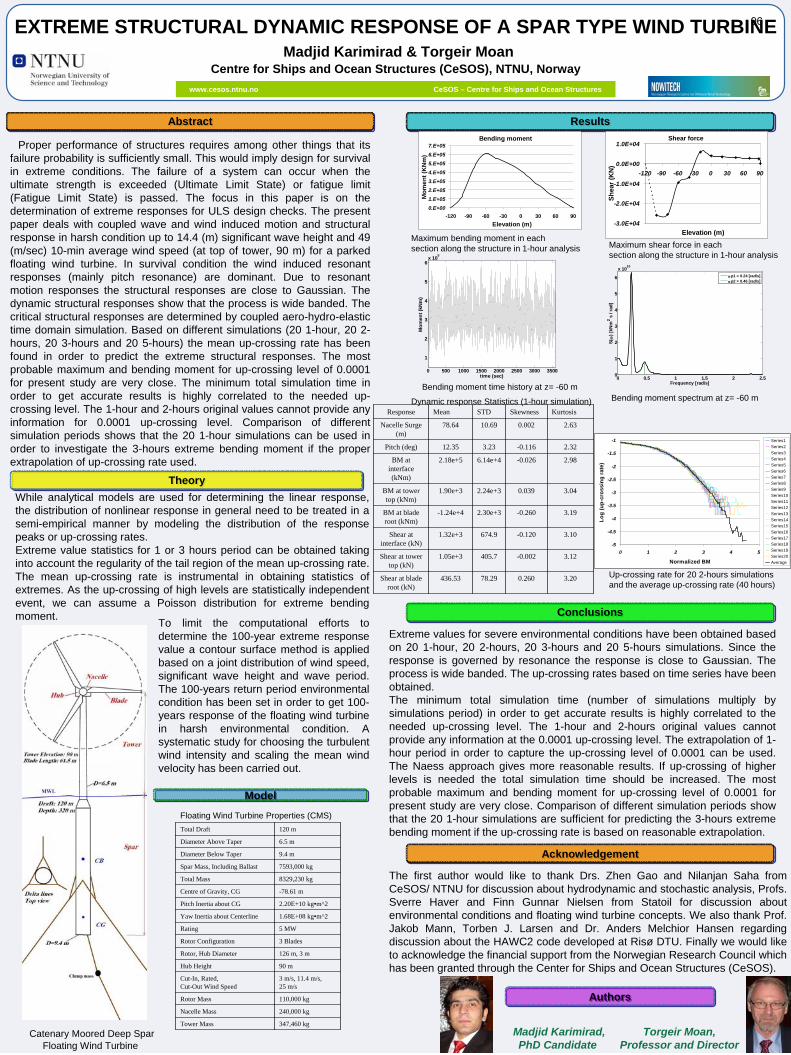
Proper performance of structures requires among other things that its failure probability is sufficiently small. This would imply design for survival in extreme conditions. The failure of a system can occur when the ultimate strength is exceeded (Ultimate Limit State) or fatigue limit (Fatigue Limit State) is passed. The focus in this paper is on the determination of extreme responses for ULS design checks. The present paper deals with coupled wave and wind induced motion and structural response in harsh condition up to 14.4 (m) significant wave height and 49 (m/sec) 10-min average wind speed (at top of tower, 90 m) for a parked floating wind turbine. In survival condition the wind induced resonant responses (mainly pitch resonance) are dominant. Due to resonant motion responses the structural responses are close to Gaussian. The dynamic structural responses show that the process is wide banded. The critical structural responses are determined by coupled aero-hydro-elastic time domain simulation. Based on different simulations (20 1-hour, 20 2- hours, 20 3-hours and 20 5-hours) the mean up-crossing rate has been found in order to predict the extreme structural responses. The most probable maximum and bending moment for up-crossing level of 0.0001 for present study are very close. The minimum total simulation time in order to get accurate results is highly correlated to the needed up- crossing level. The 1-hour and 2-hours original values cannot provide any information for 0.0001 up-crossing level. Comparison of different simulation periods shows that the 20 1-hour simulations can be used in order to investigate the 3-hours extreme bending moment if the proper extrapolation of up-crossing rate used.
AbstractAbstract
EXTREME STRUCTURAL DYNAMIC RESPONSE OF A SPAR TYPE WIND TURBINE Madjid Karimirad & Torgeir Moan
Centre for Ships and Ocean Structures (CeSOS), NTNU, Norway
ResultsResults
ConclusionsConclusions
Catenary Moored Deep Spar Floating Wind Turbine
Extreme values for severe environmental conditions have been obtained based on 20 1-hour, 20 2-hours, 20 3-hours and 20 5-hours simulations. Since the response is governed by resonance the response is close to Gaussian. The process is wide banded. The up-crossing rates based on time series have been obtained.The minimum total simulation time (number of simulations multiply by simulations period) in order to get accurate results is highly correlated to the needed up-crossing level. The 1-hour and 2-hours original values cannot provide any information at the 0.0001 up-crossing level. The extrapolation of 1- hour period in order to capture the up-crossing level of 0.0001 can be used. The Naess approach gives more reasonable results. If up-crossing of higher levels is needed the total simulation time should be increased. The most probable maximum and bending moment for up-crossing level of 0.0001 for present study are very close. Comparison of different simulation periods show that the 20 1-hour simulations are sufficient for predicting the 3-hours extreme bending moment if the up-crossing rate is based on reasonable extrapolation.
Madjid Karimirad,PhD Candidate
Torgeir Moan,Professor and Director
Bending moment
0.E+00
1.E+05
2.E+05
3.E+05
4.E+05
5.E+05
6.E+05
7.E+05
-120 -90 -60 -30 0 30 60 90
Elevation (m)
Mo
me
nt
(KN
m)
Shear force
-3.0E+04
-2.0E+04
-1.0E+04
0.0E+00
1.0E+04
-120 -90 -60 -30 0 30 60 90
Elevation (m)
Sh
ear
(KN
)
Maximum bending moment in each section along the structure in 1-hour analysis Maximum shear force in each
section along the structure in 1-hour analysis
0 500 1000 1500 2000 2500 3000 3500
1
2
3
4
5
6x 10
5
time (sec)
Mo
men
t (k
Nm
)
Bending moment time history at z= -60 m0 0.5 1 1.5 2 2.5
0
1
2
3
4
5
6
x 1010
Frequency [rad/s]
S(
) [k
Nm
2 s /
rad
]
p1 = 0.24 [rad/s]p2 = 0.46 [rad/s]
Bending moment spectrum at z= -60 m
Response Mean STD Skewness Kurtosis
Nacelle Surge (m)
78.64 10.69 0.002 2.63
Pitch (deg) 12.35 3.23 -0.116 2.32
BM at interface (kNm)
2.18e+5 6.14e+4 -0.026 2.98
BM at tower top (kNm)
1.90e+3 2.24e+3 0.039 3.04
BM at blade root (kNm)
-1.24e+4 2.30e+3 -0.260 3.19
Shear at interface (kN)
1.32e+3 674.9 -0.120 3.10
Shear at tower top (kN)
1.05e+3 405.7 -0.002 3.12
Shear at blade root (kN)
436.53 78.29 0.260 3.20
Dynamic response Statistics (1-hour simulation)
-5
-4.5
-4
-3.5
-3
-2.5
-2
-1.5
-1
0 1 2 3 4 5
Normalized BM
Lo
g (
up
-cro
ssin
g r
ate)
Series1
Series2
Series3
Series4
Series5
Series6
Series7
Series8
Series9
Series10
Series11
Series12
Series13
Series14
Series15
Series16
Series17
Series18
Series19
Series20
Average
Up-crossing rate for 20 2-hours simulations and the average up-crossing rate (40 hours)
TheoryTheory
While analytical models are used for determining the linear response, the distribution of nonlinear response in general need to be treated in a semi-empirical manner by modeling the distribution of the response peaks or up-crossing rates. Extreme value statistics for 1 or 3 hours period can be obtained taking into account the regularity of the tail region of the mean up-crossing rate. The mean up-crossing rate is instrumental in obtaining statistics of extremes. As the up-crossing of high levels are statistically independent event, we can assume a Poisson distribution for extreme bending moment.
AcknowledgementAcknowledgement
The first author would like to thank Drs. Zhen Gao and Nilanjan Saha from CeSOS/ NTNU for discussion about hydrodynamic and stochastic analysis, Profs. Sverre Haver and Finn Gunnar Nielsen from Statoil for discussion about environmental conditions and floating wind turbine concepts. We also thank Prof. Jakob Mann, Torben J. Larsen and Dr. Anders Melchior Hansen regarding discussion about the HAWC2 code developed at Risø DTU. Finally we would like to acknowledge the financial support from the Norwegian Research Council which has been granted through the Center for Ships and Ocean Structures (CeSOS).
AuthorsAuthors
Total Draft 120 m
Diameter Above Taper 6.5 m
Diameter Below Taper 9.4 m
Spar Mass, Including Ballast 7593,000 kg
Total Mass 8329,230 kg
Centre of Gravity, CG -78.61 m
Pitch Inertia about CG 2.20E+10 kg•m^2
Yaw Inertia about Centerline 1.68E+08 kg•m^2
Rating 5 MW
Rotor Configuration 3 Blades
Rotor, Hub Diameter 126 m, 3 m
Hub Height 90 m
Cut-In, Rated, Cut-Out Wind Speed
3 m/s, 11.4 m/s, 25 m/s
Rotor Mass 110,000 kg
Nacelle Mass 240,000 kg
Tower Mass 347,460 kg
Floating Wind Turbine Properties (CMS)
To limit the computational efforts to determine the 100-year extreme response value a contour surface method is applied based on a joint distribution of wind speed, significant wave height and wave period. The 100-years return period environmental condition has been set in order to get 100- years response of the floating wind turbine in harsh environmental condition. A systematic study for choosing the turbulent wind intensity and scaling the mean wind velocity has been carried out.
www.cesos.ntnu.no CeSOS – Centre for Ships and Ocean Structures
ModelModel
96
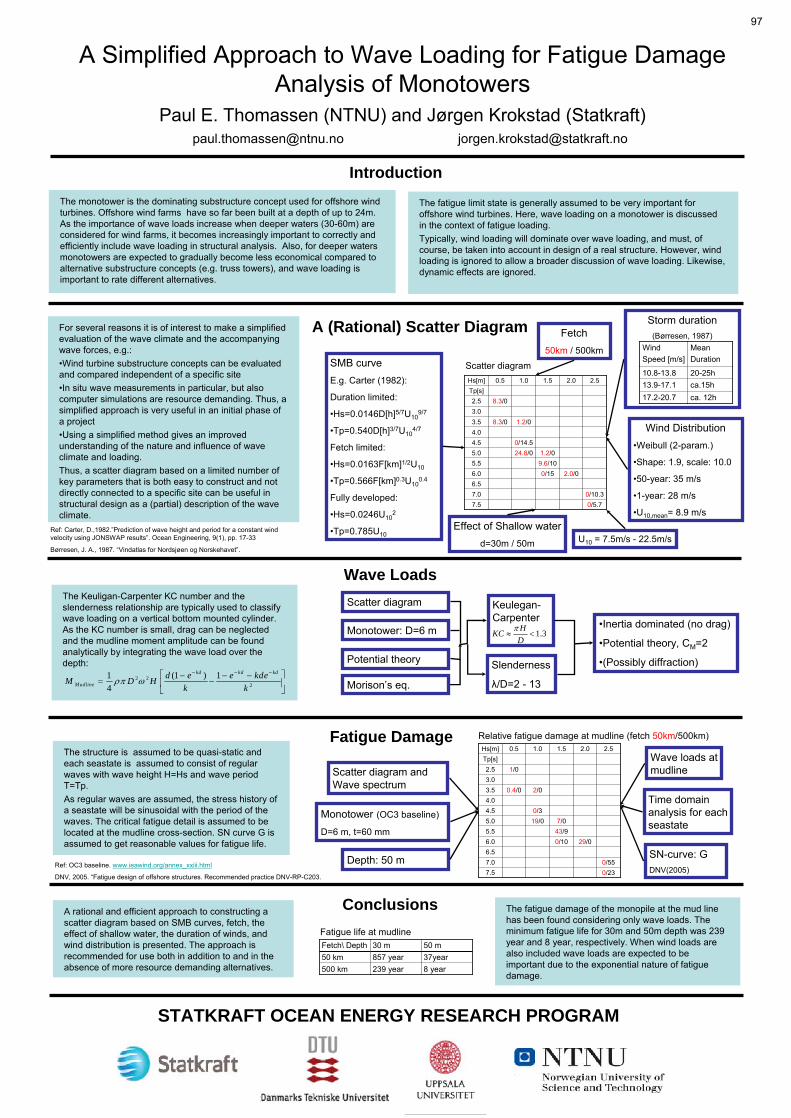
A Simplified Approach to Wave Loading for Fatigue Damage Analysis of Monotowers
Paul E. Thomassen (NTNU) and Jørgen
Krokstad
(Statkraft)
The structure is assumed to be quasi-static and each seastate
is assumed to consist of regular waves with wave height H=Hs and wave period T=Tp.
As regular waves are assumed, the stress history of a seastate
will be sinusoidal with the period of the waves. The critical fatigue detail is assumed to be located at the mudline
cross-section. SN curve G is assumed to get reasonable values for fatigue life.
Fetch
50km
/ 500km
Storm duration
(Børresen, 1987)
Wind Distribution
•Weibull
(2-param.)
•Shape: 1.9, scale: 10.0
•50-year: 35 m/s
•1-year: 28 m/s
•U10,mean
= 8.9 m/s
SMB curve
E.g. Carter (1982):
Duration limited:
•Hs=0.0146D[h]5/7U109/7
•Tp=0.540D[h]3/7U104/7
Fetch limited:
•Hs=0.0163F[km]1/2U10
•Tp=0.566F[km]0.3U100.4
Fully developed:
•Hs=0.0246U102
•Tp=0.785U10
Hs[m] 0.5 1.0 1.5 2.0 2.5
Tp[s]
2.5 8.3/0
3.0
3.5 8.3/0 1.2/0
4.0
4.5 0/14.5
5.0 24.8/0 1.2/0
5.5 9.6/10
6.0 0/15 2.0/0
6.5
7.0 0/10.3
7.5 0/5.7
Scatter diagram
Monotower: D=6 m
Potential theory
Morison’s eq.
Keulegan-
Carpenter
Slenderness
λ/D=2 -
13
•Inertia dominated (no drag)
•Potential theory, CM
=2
•(Possibly diffraction)
Scatter diagram and Wave spectrum
Monotower
(OC3 baseline)
D=6 m, t=60 mm
Wave loads at mudline
SN-curve: G
DNV(2005)
Time domain analysis for each seastate
A (Rational) Scatter DiagramFor several reasons it is of interest to make a simplified evaluation of the wave climate and the accompanying wave forces, e.g.:
•Wind turbine substructure concepts can be evaluated and compared independent of a specific site
•In situ wave measurements in particular, but also computer simulations are resource demanding. Thus, a simplified approach is very useful in an initial phase of a project
•Using a simplified method gives an improved understanding of the nature and influence of wave climate and loading.
Thus, a scatter diagram based on a limited number of key parameters that is both easy to construct and not directly connected to a specific site can be useful in structural design as a (partial) description of the wave climate.
Introduction
The Keuligan-Carpenter KC number and the slenderness relationship are typically used to classify wave loading on a vertical bottom mounted cylinder. As the KC number is small, drag can be neglected and the mudline
moment amplitude can be found analytically by integrating the wave load over the depth:
Effect of Shallow water
d=30m / 50m
Depth: 50 m
Hs[m] 0.5 1.0 1.5 2.0 2.5
Tp[s]
2.5 1/0
3.0
3.5 0.4/0 2/0
4.0
4.5 0/3
5.0 19/0 7/0
5.5 43/9
6.0 0/10 29/0
6.5
7.0 0/55
7.5 0/23
Conclusions
Wave Loads
The monotower
is the dominating substructure concept used for offshore wind turbines. Offshore wind farms have so far been built at a depth
of up to 24m. As the importance of wave loads increase when deeper waters (30-60m) are considered for wind farms, it becomes increasingly important to correctly and efficiently include wave loading in structural analysis. Also, for deeper waters monotowers
are expected to gradually become less economical compared to alternative substructure concepts (e.g. truss towers), and wave loading is important to rate different alternatives.
The fatigue limit state is generally assumed to be very important for offshore wind turbines. Here, wave loading on a monotower
is discussed in the context of fatigue loading.
Typically, wind loading will dominate over wave loading, and must, of course, be taken into account in design of a real structure. However, wind loading is ignored to allow a broader discussion of wave loading. Likewise, dynamic effects are ignored.
The fatigue damage of the monopile
at the mud line has been found considering only wave loads. The minimum fatigue life for 30m and 50m depth was 239 year and 8 year, respectively. When wind loads are also included wave loads are expected to be important due to the exponential nature of fatigue damage.
Fatigue Damage
STATKRAFT OCEAN ENERGY RESEARCH PROGRAM
Wind
Speed [m/s]
Mean
Duration
10.8-13.8 20-25h
13.9-17.1 ca.15h
17.2-20.7 ca. 12h
Fetch\
Depth 30 m 50 m
50 km 857 year 37year
500 km 239 year 8 year
Relative fatigue damage at mudline
(fetch 50km/500km)
Fatigue life at mudline
A rational and efficient approach to constructing a scatter diagram based on SMB curves, fetch, the effect of shallow water, the duration of winds, and wind distribution is presented. The approach is recommended for use both in addition to and in the absence of more resource demanding alternatives.
1.3H
KCD
2 22
1 (1 ) 1
4
kd kd kd
Mudline
d e e kdeM D H
k k
Scatter diagram
U10
= 7.5m/s -
22.5m/sRef: Carter, D.,1982.”Prediction of wave height and period for a constant wind velocity using JONSWAP results”. Ocean Engineering, 9(1), pp. 17-33
Børresen, J. A., 1987. “Vindatlas
for Nordsjøen
og
Norskehavet”.
Ref: OC3 baseline. www.ieawind.org/annex_xxiii.html
DNV, 2005. “Fatigue design of offshore structures. Recommended practice DNV-RP-C203.
97

Abstract—The use of multiterminal HVDC (MTDC)
system as a prospective technology for integrating of offshore
wind farms and offshore loads has been investigated in this
work. A robust power flow control method, based upon DC
bus voltage droop measurements, was proposed for the
MTDC system. For testing the proposed control strategy, a
four terminal HVDC simulation model consisting of an
offshore windfarm, offshore oil/gas platform load and two
onshore grid connections was modeled in PSCAD simulation
software.
Figure 1: Early stage scenario of multiterminal
HVDC in the North Sea
Figure 2: A four terminal HVDC model used for
simulation
The four HVDC converter terminals were assigned
the dc droop characteristics as shown in Figure 2.
Figure 3: Assigned DC droop characteristics for
the HVDC terminals
Advantages of MTDC control with
the DC droop control No need for communication between
terminals
Many converter terminals contribute to DC
voltage regulation
DC analogy to distributed frequency droop
control in AC systems
Figure 4: Complete VSC control structure
including outer controllers
Mathematical model of the voltage
source converter
01
0
( / )
,
d d d Xd
DC
q q q
Xd
i i m VL rdU
i i mL rdt L
Line frequency rad s
L r Line inductance (H) & resistance ( )
V Measured voltage at PCC
m modulation index
Figure 5 : Inner current control loop
Figure 6: DC voltage droop control responses
Figure 7: Impact of three phase short circuit fault
occurring at oil/gas platform load
Figure 8: Loss of generation from the offshore
wind farm
Conclusions
o Robust control of MTDC was achieved
by DC voltage droop characteristics
o No need of fast communication between
terminals for operation under disturbances
o System is little affected by short duration
AC fault occurrences
o Readily expandable without any change
of the existing system needed
Grid Integration of Offshore Windfarms and
Offshore Loads Using Multiterminal HVDC
TEMESGEN M. HAILESELASSIE, NTNU KJETIL UHLEN, NTNU TORE UNDELAND, NTNU
𝑃𝐼 𝑖𝑑 ,𝑟𝑒𝑓
𝑖𝑑
+ −
+ +
𝜔𝐿
𝑃𝐼 𝑖𝑞 ,𝑟𝑒𝑓
𝑖𝑞
+ −
+ +
𝜔𝐿
−
𝑉𝑑
𝑉𝑞
+
𝑉𝑐𝑑 ,𝑟𝑒𝑓
𝑉𝑐𝑞 ,𝑟𝑒𝑓
𝑉𝑋,𝑎𝑏𝑐
abc
ssdq
PLL
𝛳 𝑉𝑋𝑑
𝑉𝑋𝑞
𝑖𝑋 ,𝑎𝑏𝑐 abc
ssdq
𝑖𝑑
𝑖𝑞
𝛳
Inner
current
controller
𝑉𝑐𝑑 ,𝑟𝑒𝑓 𝑉𝑐𝑞 ,𝑟𝑒𝑓
abc
ssdq
PWM 𝑉𝑎𝑏𝑐 ,𝑟𝑒𝑓
Gate
signals
𝛳
𝑖𝑑 ,𝑟𝑒𝑓 𝑖𝑞 ,𝑟𝑒𝑓
C 𝑈𝐷𝐶
𝐼𝐷𝐶
𝑖𝐶
𝑃𝐼
𝑈𝐷𝐶 ,𝑟𝑒𝑓
−
+
𝑃𝑚𝑒𝑎𝑠
𝑃𝑟𝑒𝑓 𝜌𝐷𝐶
+
𝑈𝐷𝐶 ,𝑚𝑒𝑎𝑠
−
+
𝑃𝐼
𝑉𝑋,𝑟𝑒𝑓
−
+
𝑄𝑚𝑒𝑎𝑠
𝑄𝑟𝑒𝑓 𝐾 +
𝑉𝑋,𝑚𝑒𝑎𝑠
−
+
L r
𝑖𝑎𝑏𝑐
𝑈𝐷𝐶 𝑈𝐷𝐶
𝑃 𝑃 0 0
Grid-1 Offshore
windfarm
REC
T
INV
𝑃 0
Oil&gas
Platform
load
𝑃 0
Grid-2
𝑈𝐷𝐶 𝑈𝐷𝐶
𝑈𝐷𝐶 ,𝑟𝑒𝑓
98
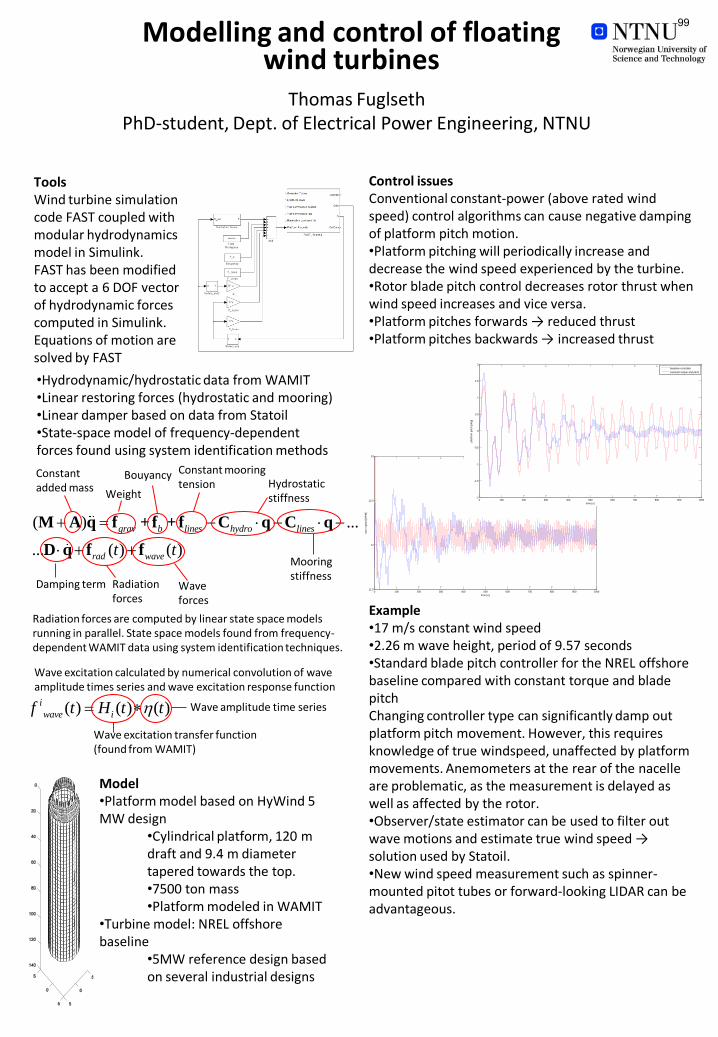
0 100 200 300 400 500 600 700 800 900 100011.5
12
12.5
13
roto
r speed [
RP
M]
time [s]
ToolsWind turbine simulation code FAST coupled with modular hydrodynamics model in Simulink.FAST has been modified to accept a 6 DOF vector of hydrodynamic forces computed in Simulink. Equations of motion are solved by FAST
•Hydrodynamic/hydrostatic data from WAMIT•Linear restoring forces (hydrostatic and mooring)•Linear damper based on data from Statoil•State-space model of frequency-dependent forces found using system identification methods
Model•Platform model based on HyWind 5 MW design
•Cylindrical platform, 120 m draft and 9.4 m diameter tapered towards the top.•7500 ton mass•Platform modeled in WAMIT
•Turbine model: NREL offshore baseline
•5MW reference design based on several industrial designs
Control issuesConventional constant-power (above rated wind speed) control algorithms can cause negative damping of platform pitch motion.•Platform pitching will periodically increase and decrease the wind speed experienced by the turbine.•Rotor blade pitch control decreases rotor thrust when wind speed increases and vice versa.•Platform pitches forwards → reduced thrust•Platform pitches backwards → increased thrust
Modelling and control of floating wind turbines
Example•17 m/s constant wind speed•2.26 m wave height, period of 9.57 seconds•Standard blade pitch controller for the NREL offshore baseline compared with constant torque and blade pitchChanging controller type can significantly damp out platform pitch movement. However, this requires knowledge of true windspeed, unaffected by platform movements. Anemometers at the rear of the nacelle are problematic, as the measurement is delayed as well as affected by the rotor.•Observer/state estimator can be used to filter out wave motions and estimate true wind speed → solution used by Statoil.•New wind speed measurement such as spinner-mounted pitot tubes or forward-looking LIDAR can be advantageous.
Thomas FuglsethPhD-student, Dept. of Electrical Power Engineering, NTNU
( ) ...
... ( ) ( )
grav b lines hydro lines
rad wavet t
M A q f +f + f C q C q
D q f f
Constantadded mass
Weight
Bouyancy Constant mooringtension Hydrostatic
stiffness
Mooringstiffness
Damping term Radiationforces
Waveforces
( ) ( ) ( )i
wave if t H t t
Wave excitation transfer function(found from WAMIT)
Wave amplitude time series
Wave excitation calculated by numerical convolution of wave amplitude times series and wave excitation response function
Radiation forces are computed by linear state space models running in parallel. State space models found from frequency-dependent WAMIT data using system identification techniques.
0 100 200 300 400 500 600 700 800 900 1000-2
-1.5
-1
-0.5
0
0.5
1
1.5
2
pla
tform
pitch [
deg]
time [s]
baseline controller
constant torque and pitch
99
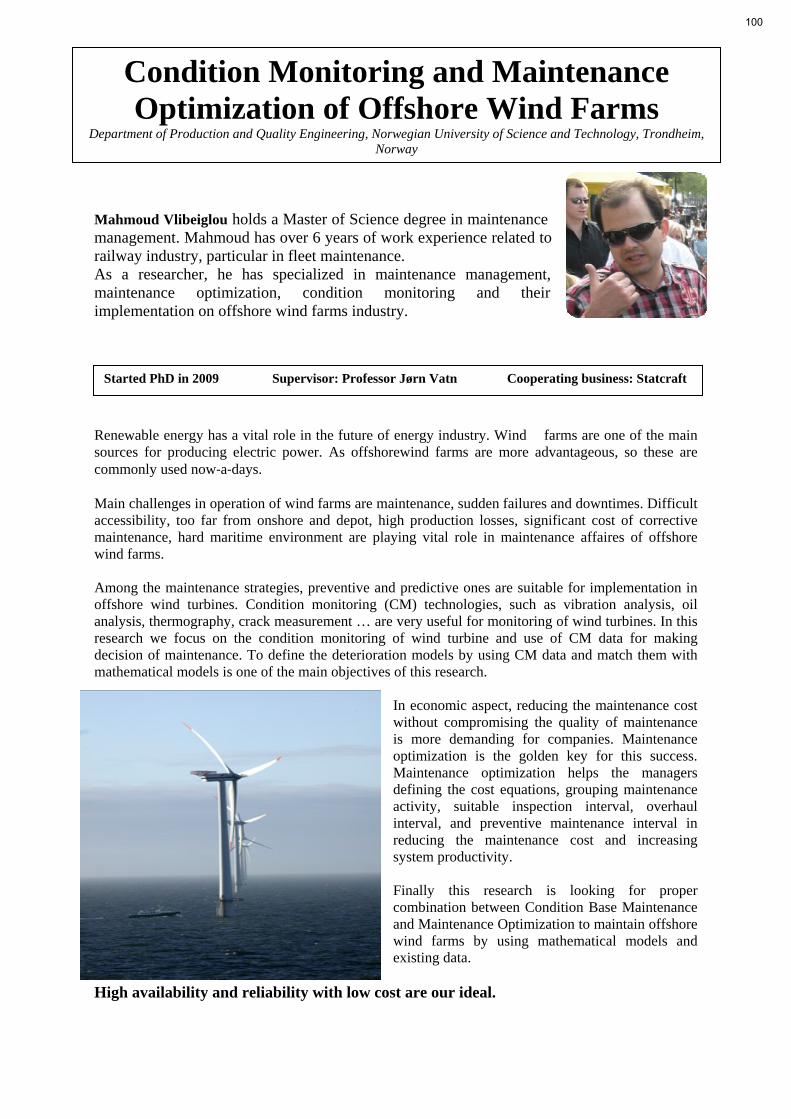
Mahmoud Vlibeiglou holds a Master of Science degree in maintenance management. Mahmoud has over 6 years of work experience related to railway industry, particular in fleet maintenance. As a researcher, he has specialized in maintenance management, maintenance optimization, condition monitoring and their implementation on offshore wind farms industry. Renewable energy has a vital role in the future of energy industry. Wind farms are one of the main sources for producing electric power. As offshorewind farms are more advantageous, so these are commonly used now‐a‐days. Main challenges in operation of wind farms are maintenance, sudden failures and downtimes. Difficult accessibility, too far from onshore and depot, high production losses, significant cost of corrective maintenance, hard maritime environment are playing vital role in maintenance affaires of offshore wind farms. Among the maintenance strategies, preventive and predictive ones are suitable for implementation in offshore wind turbines. Condition monitoring (CM) technologies, such as vibration analysis, oil analysis, thermography, crack measurement … are very useful for monitoring of wind turbines. In this research we focus on the condition monitoring of wind turbine and use of CM data for making decision of maintenance. To define the deterioration models by using CM data and match them with mathematical models is one of the main objectives of this research.
In economic aspect, reducing the maintenance cost without compromising the quality of maintenance is more demanding for companies. Maintenance optimization is the golden key for this success. Maintenance optimization helps the managers defining the cost equations, grouping maintenance activity, suitable inspection interval, overhaul interval, and preventive maintenance interval in reducing the maintenance cost and increasing system productivity. Finally this research is looking for proper combination between Condition Base Maintenance and Maintenance Optimization to maintain offshore wind farms by using mathematical models and existing data.
High availability and reliability with low cost are our ideal.
Started PhD in 2009 Supervisor: Professor Jørn Vatn Cooperating business: Statcraft
Condition Monitoring and Maintenance Optimization of Offshore Wind Farms
Department of Production and Quality Engineering, Norwegian University of Science and Technology, Trondheim, Norway
100

Individual Pitch Control for Horizontal Axis Wind TurbinesFredrik Sandquist, PhD student NTNU [email protected]
Introduction∙ Operation Regions
– Region1, 2 and 3
00
Wind speed
Generatortorque
Region
IRegion
IIRegion
III
∙ Region 2: Maximum power
– Constant tip speed ratio– Collective pitch constant– Variable torque
∙ Region 3: Constant speed and power
– Variable Pitch– “Constant” torque
Inputs∙ Control inputs
– Blade pitch angle for each blade– Turbine torque
Goal
∙ Load reduction
– Drive train– Blade load, mostly flap– Tower
∙ Loading
– Gravity– Wind
∙ Periodic loading
– Gravity– Wind shear
∙ Almost periodic loading
– Wind gusts
Collective vs Individual Pitch ControlPitch, degrees Blade flap, m
Blade edge, m Generator speed, rpm
5050
5050
8080
8080
0
0
204
−1
1 14.3
14
10
Figure 1: Simulation in a steady wind field with a vertical windshearwith collective pitch
Pitch, degrees Blade flap, m
Blade edge, m Generator speed, rpm
5050
5050
8080
8080
0
0
204
−1
1 14.3
14
10
Figure 2: Simulation in a steady wind field with a vertical wind shearwith individual pitch
∙ It is possibly to get rid of the flap motion with individual pitch.
Method∙ Nonlinear aero elastic dynamic model of the entire turbine
– FAST, Bladed, HAWK2, flex5 and others
∙ Determine an operation trajectory for a given wind speed, genera-tor speed and generator torque
– Constant pitch angle– An azimuth depending trajectory for blade motions
∙ Linearize the model around the trajectory
– A linear system for each azimuth angle
∙ Change the states, inputs and outputs for each system with theColeman transformation
– (Almost) the same linear model for all azimuth angles
∙ Take the mean of all system matrixes and call the correspondingsystem the Coleman turbine.
∙ The Coleman turbine “almost” time (azimuth) invariant
The Coleman Wind Turbine∙ The turbine model is a time (azimuth) invariant system, turbine
Coleman, enclosed by time (azimuth) varying Coleman transfor-mations
∙ The Coleman turbine can be approximated by a linear system
∙ It is good representation of the turbine
-
uΦ−1u
-
ucGc -
ycΦy -
y
G
, whereG is the turbine,Gc is the Coleman turbine andΦu andΦy
are the Coleman transformation of the inputs and outputs.
The Coleman Transform
∙ The Coleman transform is a transform from individual blade co-
ordinates,
⎡
⎣
q1q2q3
⎤
⎦ to rotor disk coordinates
⎡
⎣
qccqcℎqcv
⎤
⎦.
– qcc is the collective coordinate– qcℎ is the horizontal coordinate– qcv is the vertical coordinate
TheColeman transformation is given by⎡
⎣
q1q2q3
⎤
⎦ =
⎡
⎣
1 sin(Ψ) cos(Ψ)1 sin(Ψ + 2�/3) cos(Ψ + 2�/3)1 sin(Ψ + 4�/3) cos(Ψ + 4�/3)
⎤
⎦
⎡
⎣
qccqcℎqcv
⎤
⎦
, whereΨ is the azimuth angle,Ψ = 0 when blade1 is straight up.
q =Φqc
Modeling of the Wind∙ Wind shear is easily modeled in Coleman coordinates
– Collective=mean wind– Vertical=vertical linear wind shear– Horizontal=horizontal linear wind shear
∙ Time varying wind fields can be seen as change in wind shear tosome extent.
The Linear Model
Frequency (rad/sec)
10−2
10−2
10−1
10−1
100
100
101
101
102
Figure 3: Singular value plot from pitch to generator speed and indi-vidual flap
∙ The singular value plot shows the gains in the system
∙ The notch and gain at2 rad/sec is due to the tower
∙ The peak at 10.8 rad/s is due to large resonances in the drive trainand blade edge motion.
∙ The peak at 22.9 rad/s is due to resonance in the drive train andblade edge motion.
Bode magnitude plots for the linear sys-tem
Frequency (rad/sec)
ColHorVer
10−2
10−1
10−1
100
100
101
101
102
Figure 4: Generator speed from Collective, Horizontal and Verticalpitch
Frequency (rad/sec)
ColHorVer
10−2
10−1
10−1
100
100
101
101
102
Figure 5: Horizontal flap from Collective, Horizontal and Verticalpitch
Frequency (rad/sec)
ColHorVer
10−2
10−1
10−1
100
100
101
101
102
Figure 6: Vertical flap from Collective, Horizontal and Vertical pitch
Interactions∙ Not much interaction between generator speed and individual pitch
∙ Not much interaction between individual flap and collective pitch
∙ Some interactions between the two individual channels
∙ There are interactions between all signals at 2 rad/s, this is due tothe tower
∙ A diagonal controller can be good
Control Analysis and Design DiagonalPID Controller∙ Measure generator speed and individual flap (2 signals)
∙ Control inputs collective and individual pitch
Controller∙ The individual flap is easy to control with a PID controller
∙ The generator speed is more difficult to control
– Zeros in the right half plane– Low phase– Resonant peaks at high frequency
∙ A PI regulator and notch filters at the resonant peaks works good
∙ This controller works good but it is possibly to achieve better per-formance with other controllers.
SiumulationsPitch, degrees Blade flap, m
Pitch, Coleman Blade flap, Coleman
Generator speed, rpmPitch rate
5050
5050
5050
8080
8080
8080
0
00
0
0
20
20
4
4
14.3
14−10
10
10
10
Figure 7: Collective pitch
Pitch, degrees Blade flap, m
Pitch, Coleman Blade flap, Coleman
Generator speed, rpmPitch rate
5050
5050
5050
8080
8080
8080
0
00
0
0
20
20
4
4
14.3
14−10
10
10
10
Figure 8: Individual pitch with the diagonal controller
Pitch, degrees Blade flap, m
Pitch, Coleman Blade flap, Coleman
Generator speed, rpmPitch rate
5050
5050
5050
8080
8080
8080
0
00
0
0
20
20
4
4
14.3
14−10
10
10
10
Figure 9: Individual pitch with a more advance controller
101
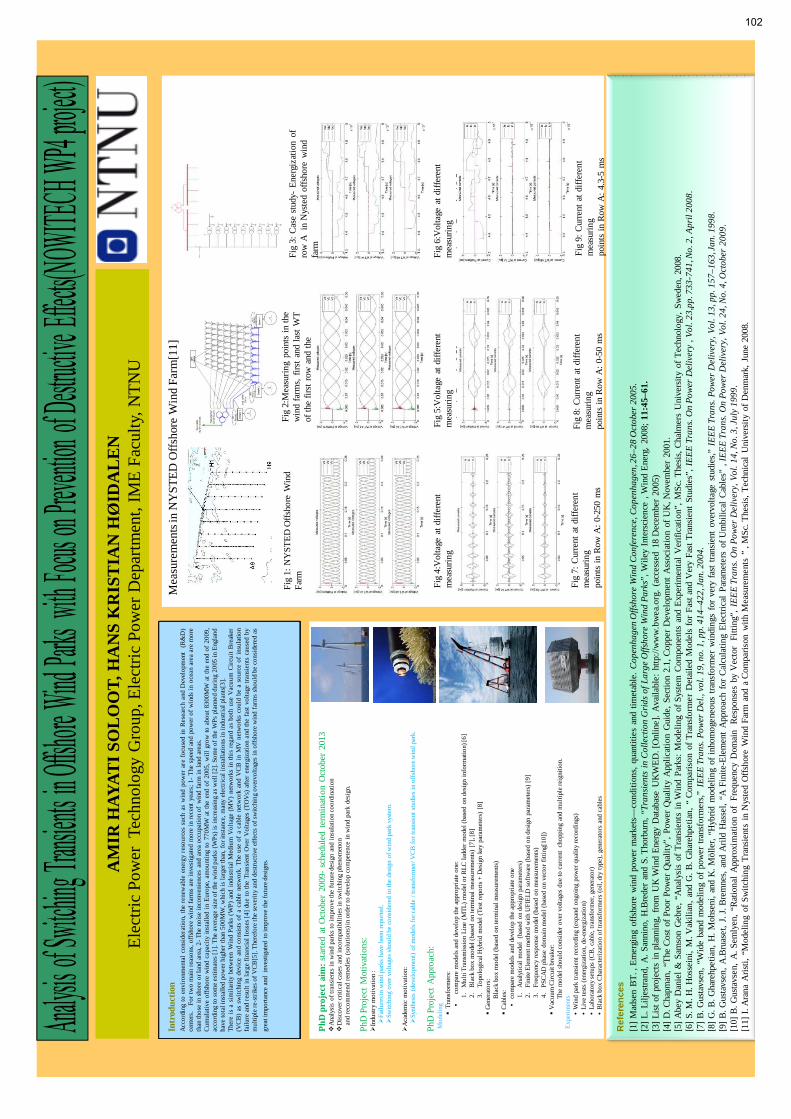
AM
IR H
AYA
TI S
OLO
OT,
HA
NS
KR
IST
IAN
HØ
IDA
LEN
E
lect
ric P
ower
Tec
hnol
ogy
Gro
up, E
lect
ric P
ower
Dep
artm
ent,
IME
Fac
ulty
, N
TN
U
Intr
oduc
tion
Acc
ord
ing
toe
nvir
onm
enta
lco
nsid
erat
ion,
the
rene
wab
leen
erg
yre
sou
rces
such
asw
ind
pow
erar
efo
cuse
din
Re
sear
cha
ndD
evel
opm
ent
(R&
D)
cent
ers.
Fo
rtw
om
ain
rea
sons
,offs
hore
win
dfa
rms
are
inve
stig
ated
mo
rein
rece
ntye
ars;
1-
The
spee
dan
dpo
wer
of
win
dsin
oce
an
are
aar
em
ore
than
tho
sein
sho
reo
rlan
dar
ea,2
-T
heno
ise
inco
nven
ienc
esan
dar
eao
ccu
patio
no
fw
ind
farm
inla
ndar
eas.
Cu
mu
lativ
eo
ffsho
rew
ind
capa
city
inst
alle
din
Eu
rope
,am
ou
ntin
gto
770
MW
atth
een
do
f2
005
,w
illgr
ow
toab
ou
t83
00M
Wat
the
end
of
20
09,
acco
rdin
gto
som
ee
stim
ates
[1].
The
aver
age
size
oft
hew
ind
par
ks(W
Ps)
isin
cre
asin
ga
sw
ell[
2].
So
me
oft
heW
Ps
pla
nne
ddu
ring
20
05in
Eng
lan
dha
veto
tali
nsta
lled
pow
erhi
gher
than
50
0M
W,w
hich
isla
rger
than
,fo
rins
tanc
e,m
any
elec
tric
alin
stal
latio
nsin
indu
stri
alpl
ants
[3].
The
reis
asi
mila
rity
betw
een
Win
dP
arks
(WP
)an
din
dust
rial
Med
ium
Vo
ltage
(MV
)ne
two
rks
inth
isre
gar
da
sbo
thu
seV
acu
um
Cir
cuit
Bre
aker
(VC
B)
assw
itchi
ng
dev
ice
and
cons
ists
of
aca
ble
netw
ork
.T
heu
seo
fa
cabl
ene
two
rkan
dV
CB
inM
Vn
etw
ork
sco
uld
bea
sou
rce
of
insu
latio
nfa
ilure
and
resu
ltin
larg
efin
anc
iall
oss
es[4
]du
eto
the
Tra
nsi
ent
Ove
rV
olta
ges
(TO
Vs)
afte
ren
ergi
zatio
na
ndth
efa
stvo
ltage
tra
nsie
nts
cau
sed
by
mu
ltipl
ere
-str
ikes
ofV
CB
[5].
The
refo
reth
ese
veri
tyan
dde
stru
ctiv
eef
fect
so
fsw
itchi
ng
ove
rvo
ltage
sin
offs
hore
win
dfa
rms
sho
uld
beco
nsi
dere
das
grea
tim
port
ance
and
inve
stig
ated
toim
pro
veth
efu
ture
desi
gns.
Ref
eren
ces
[1]
Mad
sen
BT
. , E
me
rgin
g of
fsho
re w
ind
pow
er
mar
kets
—co
ndi
tion
s, q
uant
itie
s an
d tim
eta
ble
. C
op
en
ha
ge
n O
ffsh
ore
Win
d C
on
fere
nce
, Co
pe
nh
ag
en
, 26
–2
8 O
cto
ber
20
05
.[2
] L.
Lilj
est
ran
d, A
. S
anni
no,
H.B
rede
ran
d S
. Tho
rbur
n, “
Tra
nsi
en
ts i
n C
olle
ctio
n G
rids
of
La
rge
Offsh
ore
Win
d P
ark
s”,
Wile
y In
ters
cie
nce
, W
ind
Ene
rg.
2008
; 11
:45–
61.
[3]
List
of
proj
ect
s in
pla
nnin
g, f
rom
UK
Win
d E
nerg
y D
atab
ase
UK
WE
D.
[Onl
ine
]. A
vaila
ble
: ht
tp://
ww
w.b
we
a.o
rg.
(acc
ess
ed
18 D
ece
mbe
r 20
05)
[4]
D. C
hapm
an,
“T
he C
ost
of P
oor
Pow
er
Qua
lity”
, P
owe
r Q
ualit
y A
pplic
atio
n G
uide
, S
ect
ion
2.1,
Cop
per
De
velo
pme
nt A
ssoc
iatio
n of
UK
, N
ove
mbe
r 20
01.
[5]
Abe
yD
anie
l &
Sam
son
Ge
bre
, “A
naly
sis
of T
rans
ient
s in
Win
d P
arks
: M
ode
ling
of S
yste
m C
ompo
nen
ts a
nd E
xpe
rime
ntal
Ve
rific
atio
n”,
MS
c. T
hesi
s, C
halm
ers
Uni
vers
ity o
f T
ech
nolo
gy,
Sw
ede
n, 2
008.
[6]
S. M
. H
. H
osse
ini,
M. V
akili
an,
and
G.
B.
Gha
rehp
etia
n,
“ C
ompa
riso
n of
Tra
nsfo
rme
r D
eta
iled
Mod
els
for
Fas
t an
d V
ery
Fas
t T
rans
ient
Stu
die
s”,
IEE
E T
ran
s. O
n P
ow
er
De
live
ry ,
Vo
l. 2
3,p
p. 7
33
-74
1, N
o. 2
, A
pril
20
08
.[7
] B
. G
usta
vse
n,
“Wid
e b
and
mod
elin
g of
pow
er
tran
sfo
rme
rs,”
IE
EE
Tra
ns.
Po
we
r D
el.,
vo
l. 1
9, n
o. 1
, pp
. 41
4–
42
2, J
an
. 20
04
.[8
] G
. B
. G
hare
hpe
tian,
H.
Moh
seni
, an
d K
. M
ölle
r, “
Hyb
rid m
ode
ling
of i
nhom
oge
neo
us t
rans
form
er
win
din
gs f
or v
ery
fas
t tr
ansi
ent
ove
rvol
tage
stu
die
s,”
IEE
E T
ran
s. P
ow
er
De
live
ry,
Vo
l. 1
3, p
p. 1
57
–1
63
, Ja
n. 1
99
8.
[9]
B.
Gus
tavs
en, A
.Bru
ase
t, J.
J.
Bre
mne
s, a
nd A
rild
Has
sel,
“A F
inite
-Ele
me
nt A
ppro
ach
for
Cal
cula
ting
Ele
ctric
al P
aram
ete
rs o
f U
mbi
lical
Cab
les”
,
IEE
E T
ran
s. O
n P
ow
er
De
live
ry,
Vo
l. 2
4, N
o. 4
, Oct
obe
r 2
00
9.
[10]
B.
Gus
tavs
en,
A.
Se
mly
en,
“R
atio
na
l A
ppro
xim
atio
n of
F
requ
enc
y D
omai
n R
esp
onse
s by
Ve
ctor
F
ittin
g”,
IEE
E T
ran
s. O
n P
ow
er
De
live
ry,
Vo
l. 1
4, N
o. 3
, Ju
ly 1
99
9.
[11]
I.
Ara
na A
risti,
“M
ode
ling
of S
witc
hin
g T
rans
ient
s in
Nys
ted
Offs
hor
e W
ind
Far
m a
nd a
Com
paris
on w
ith M
eas
ure
me
nts
” ,
MS
c. T
hesi
s, T
ech
nica
l U
nive
rsity
of
De
nmar
k, J
une
200
8.
PhD
pro
ject
aim
: sta
rte
d at
Oct
obe
r 20
09-
sche
dule
d te
rmin
atio
n O
ctob
er
2013
�A
naly
sis
of t
rans
ient
s in
win
d pa
rks
to im
pro
ve th
e fu
ture
des
ign
and
insu
latio
n co
ord
inat
ion
�D
isco
ver
criti
cal c
ases
and
inco
mpa
tibili
ties
in s
witc
hing
phe
nom
eno
n an
d re
com
men
d re
med
ies
(so
lutio
ns) i
n o
rder
to d
evel
op
com
pete
nce
in w
ind
park
des
ign.
PhD
Pro
ject
Mot
ivat
ion
s:�
Indu
stry
mo
tivat
ion
: �
Fai
lure
s in
win
d pa
rks
have
bee
n re
port
ed.
�Sw
itchi
ng o
ver
volta
ges
sho
uld
be
cons
ider
ed i
n th
e de
sign
of w
ind
park
sys
tem
.
�A
cade
mic
mo
tivat
ion:
�S
ynth
esis
(de
velo
pmen
t) o
f mo
dels
fo
r cab
le /
tran
sfo
rmer
/ VC
B f
or t
rans
ient
stu
dies
in o
ffsho
re w
ind
park
.
PhD
Pro
ject
App
roa
ch:
Mo
delin
g�
Tra
nsfo
rmer
s:
•c o
mpa
re m
ode
ls a
nd d
evel
op
the
appr
opr
iate
one
:1
.M
ulti
Tra
nsm
issi
on
Line
(M
TL)
mo
del o
r R
LC la
dder
mo
del (
base
d o
n de
sign
inf
orm
atio
n) [6
] 2
.B
lack
bo
x m
ode
l (ba
sed
on
term
inal
mea
sure
men
ts)
[7],
[8]
3.
To
polo
gica
l Hyb
rid
mo
del (
Tes
t re
port
s +
Des
ign
key
para
met
ers)
[8
]�
Gen
erat
ors
:B
lack
bo
x m
ode
l (ba
sed
on
term
inal
mea
sure
men
ts)
�C
able
s:•
com
pare
mo
dels
and
dev
elo
p th
e ap
pro
pria
te o
ne1
.A
naly
tical
mo
del
(bas
ed o
n de
sign
par
amet
ers)
2.
Fin
ite E
lem
ent m
etho
d w
ith U
FIE
LD s
oft
war
e (b
ased
on
desi
gn p
aram
eter
s) [
9]
3.
Fre
quen
cy r
espo
nse
mo
del (
base
d o
n m
easu
rem
ents
)4
.P
SC
AD
pha
se d
om
ain
mo
del (
base
d o
n ve
cto
r fit
ting[
10
])�
Vac
uu
m C
ircu
it br
eake
r:
T
he m
ode
l sho
uld
co
nsid
er o
ver
volta
ges
due
to c
urr
ent
cho
ppin
g an
d m
ulti
ple
reig
nitio
n.
Exp
erim
ents
•W
ind
park
tra
nsie
nt r
eco
rdin
g (e
xpan
d o
ngo
ing
pow
er q
ual
ity r
eco
rdin
gs)
•L
ive
test
s (e
nerg
izat
ion,
de-
ener
giza
tion)
•La
bora
tory
set
ups
(C
B,
cabl
e, t
rans
form
er,
gene
rato
r)•
Bla
ck b
ox
Cha
ract
eriz
atio
n o
f tra
nsfo
rmer
s (o
il, d
ry t
ype)
, ge
nera
tors
and
cab
les
Me
asu
rem
ent
s in
NY
ST
ED
Offs
hore
Win
d F
arm
[11]
Fig
1:
NY
ST
ED
Offs
hore
Win
d F
arm
Fig
2:M
eas
urin
g po
ints
in
the
w
ind
farm
s, f
irst
and
last
WT
of
the
firs
t ro
w a
nd t
he
tran
sfo
rme
r
Fig
4:V
olta
ge a
t di
ffere
nt
me
asur
ing
poin
ts i
n R
ow A
: 0-
250
ms
Fig
3:
Cas
e s
tudy
-E
nerg
izat
ion
of
row
A i
n N
yste
d of
fsho
re w
ind
farm
Fig
5:V
olta
ge a
t di
ffere
nt
me
asur
ing
poin
ts in
Row
A:
0-50
ms
Fig
6:V
olta
ge a
t di
ffere
nt
me
asur
ing
poin
ts in
Row
A:
4.3-
5 m
s
Fig
7:
Cur
rent
at
diffe
ren
t m
eas
urin
g po
ints
in
Row
A:
0-25
0 m
s
Fig
8:
Cur
rent
at
diffe
ren
t m
eas
urin
g po
ints
in R
ow A
: 0-
50 m
s
Fig
9:
Cur
rent
at
diffe
ren
t m
eas
urin
g po
ints
in R
ow A
: 4.
3-5
ms
102

C Met-ocean conditions, operations and maintenance
North-Sea wind database – NORSEWIND, Erik Berge, Kjeller Vindteknikk / IFE Oceanic wind profile, turbulence and boundary layer characteristics, Prof Idar Barstad, UniResearch Transfer of methods and experience on O&M in other industries to offshore wind farms, Erik Dyrkoren, MARINTEK Corrosion protection of offshore wind turbines, OØ Knudsen, A. Bjørgum, SINTEF
103
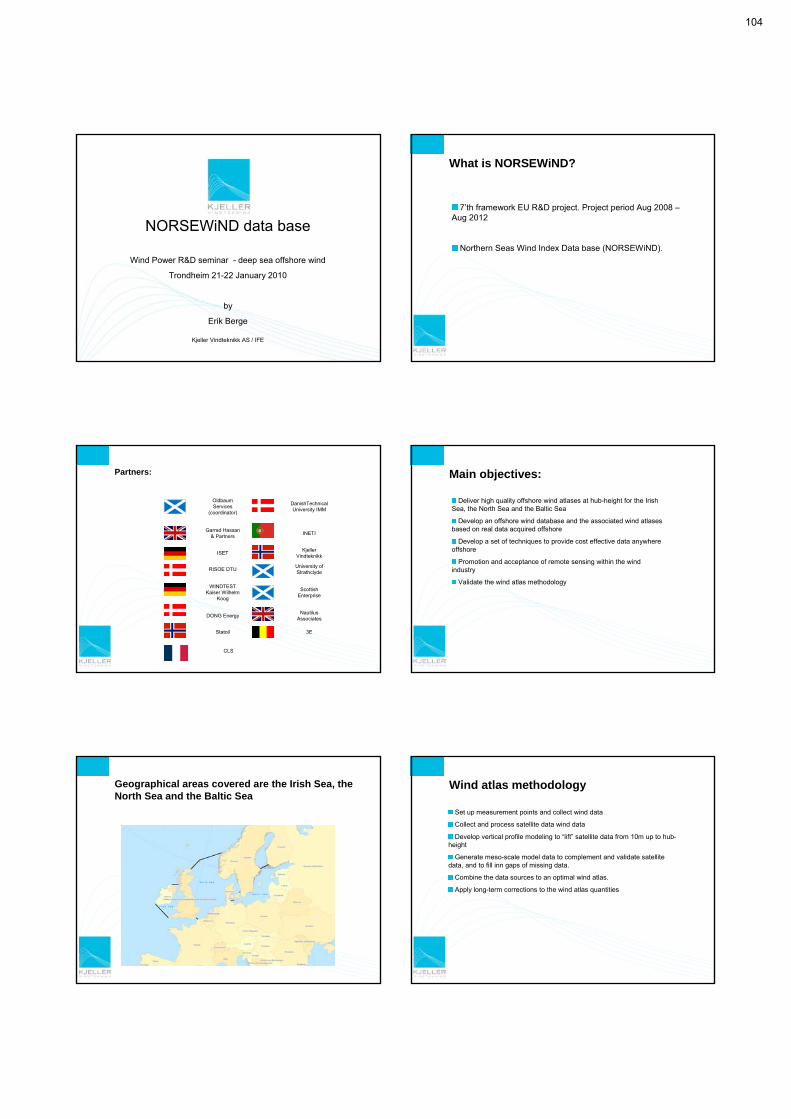
NORSEWiND data base
Wind Power R&D seminar - deep sea offshore wind
Trondheim 21-22 January 2010
by
Erik Berge
Kjeller Vindteknikk AS / IFE
What is NORSEWiND?
7’th framework EU R&D project. Project period Aug 2008 –Aug 2012
Northern Seas Wind Index Data base (NORSEWiND).
Partners:
Oldbaum Services
(coordinator)
DanishTechnical University IMM
Garrad Hassan & Partners
INETI
ISETKjeller
Vindteknikk
RISOE DTUUniversity of Strathclyde
WINDTEST Kaiser Wilhelm
Koog
Scottish Enterprise
DONG EnergyNautilus
Associates
Statoil 3E
CLS
Main objectives:
Deliver high quality offshore wind atlases at hub-height for the Irish Sea, the North Sea and the Baltic Sea
Develop an offshore wind database and the associated wind atlases based on real data acquired offshore
Develop a set of techniques to provide cost effective data anywhere offshore
Promotion and acceptance of remote sensing within the wind industry
Validate the wind atlas methodology
Geographical areas covered are the Irish Sea, the North Sea and the Baltic Sea
Wind atlas methodology
Set up measurement points and collect wind data
Collect and process satellite data wind data
Develop vertical profile modeling to “lift” satellite data from 10m up to hub-height
Generate meso-scale model data to complement and validate satellite data, and to fill inn gaps of missing data.
Combine the data sources to an optimal wind atlas.
Apply long-term corrections to the wind atlas quantities
104

KVT’s main tasks in NORSEWiND
Task leader for the aggregation of the data sources into the wind atlases
Meso-scale modelling
Verical profile analysis and modelling
Long-term data analysis and correction
Operate, maintain and analyse the data from the Statoil wind cube at Utsira.
Parameters of the wind atlas
Annual average wind speed maps (long-term corrected)
Monthly average wind speed maps (long-term corrected)
Standard deviation of annual averages
Weibull-distribution
Wind direction distributions
Turbulence intensity
Wind shear (maps of the wind shear coefficient)
Temperature and static stability
Mixing height
Uncertainty level of each physical parameter
The reference height is 100 m
Data source 1: Measurements (Windtest, ISET)
Public available Lidar and met.mast data
Overview observations:
Public available data:
3 Lidars (Zephir) Irish Sea, Finnish Bay, West of Portugal
Meteorological Masts, Fino 1, 2 and 3 North Sea and Baltic Sea
1 Sodar Coast of Latvia
Pluss oil rig data
Confidential data with restricted usage:
12 Lidars
7 Meteorological masts
All measuerements are entered into a database
Data source 2: Satellite data (RISØ DTU)
Data source 3: Meso-scale model data (KVT)
105

Meso-scale model – WRF Weather Research and forecast model set-up:
18 km resolution
2 km resolution
6 km resolution
Meso-scale model set-up (continued):
• Global NCEP boundary data every 3 hour
• WRF-runs for 27 hours covering 1 day
• Model runs for all three domains for four complete years (2004-2007)
• Data stored hourly in every grid-point for all model layers
Measurements from the FINO 1 plattform
FINO1
Mast data corrected by Lidar data
Annual and monthly averages:
WRF yields ~ 0.1 m/s lower annual average
Hourly correlation is ~ 0.92
Large wind variability and low wind shear at FINO 1 –convective case (10 min averages):
19.11.2004
α ~ 0
Low wind variability and high wind shear at FINO 1 –stable case:
04.04.2004
α ~ 0.15-0.35
106
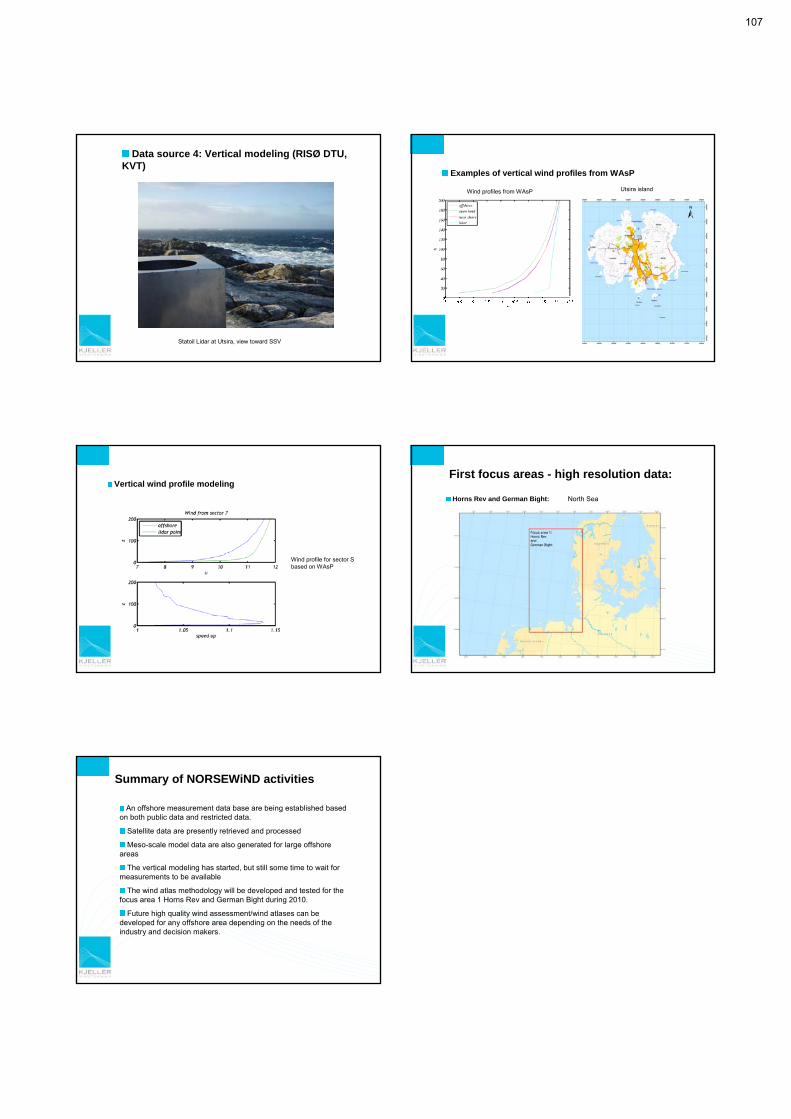
Statoil Lidar at Utsira, view toward SSV
Data source 4: Vertical modeling (RISØ DTU, KVT)
Examples of vertical wind profiles from WAsP
Wind profiles from WAsP Utsira island
Vertical wind profile modeling
Wind profile for sector S based on WAsP
First focus areas - high resolution data:
Horns Rev and German Bight: North Sea
Summary of NORSEWiND activities
An offshore measurement data base are being established based on both public data and restricted data.
Satellite data are presently retrieved and processed
Meso-scale model data are also generated for large offshore areas
The vertical modeling has started, but still some time to wait for measurements to be available
The wind atlas methodology will be developed and tested for thefocus area 1 Horns Rev and German Bight during 2010.
Future high quality wind assessment/wind atlases can be developed for any offshore area depending on the needs of the industry and decision makers.
107
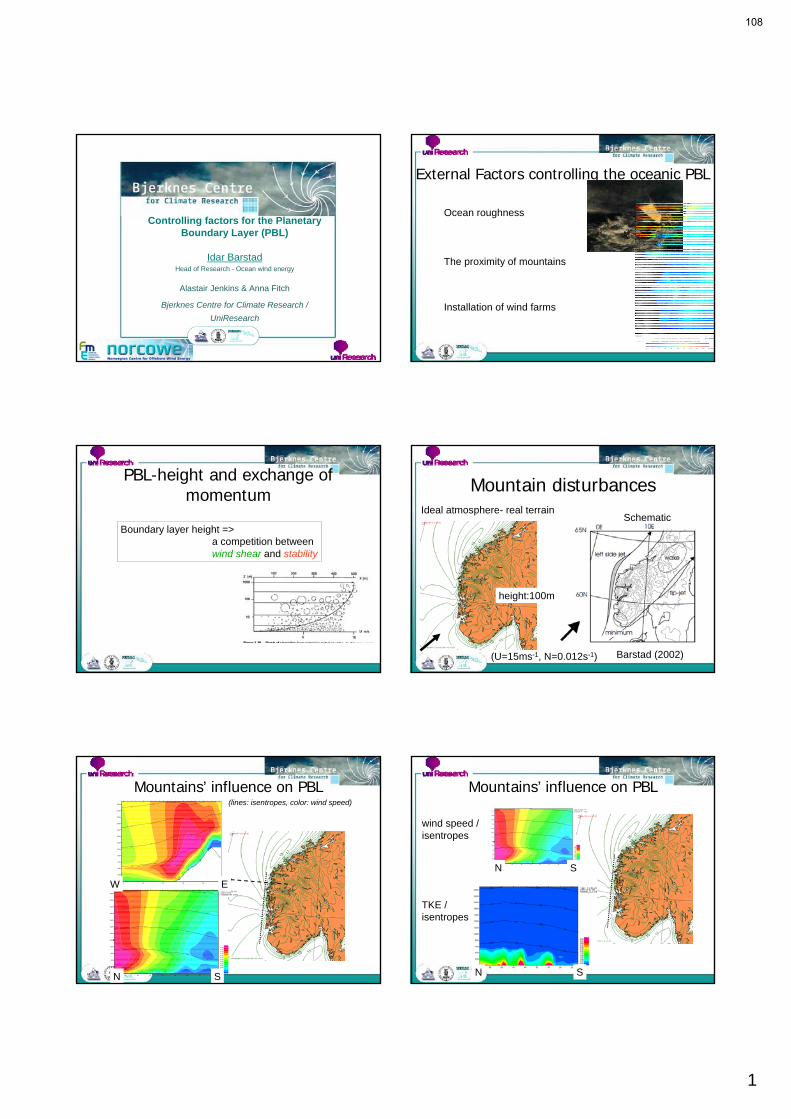
1
Controlling factors for the Planetary Boundary Layer (PBL)
Idar BarstadHead of Research - Ocean wind energy
Alastair Jenkins & Anna Fitch
Bjerknes Centre for Climate Research /
UniResearch
External Factors controlling the oceanic PBL
Ocean roughness
Installation of wind farms
The proximity of mountains
PBL-height and exchange ofmomentum
Boundary layer height =>a competition betweenwind shear and stability
Mountain disturbancesIdeal atmosphere- real terrain
(U=15ms-1, N=0.012s-1)
height:100m,
Barstad (2002)
Schematic
Mountains’ influence on PBL
10 15 20 25 300
200
400
600
800
1000
1200
1400
1600
1800
2000
2200
2400
282.5
282.5
282.5
282.5285.0
285.0
285.0
285.0
285.0287.5
287.5
287.5287.5
287.5
290.0
290.0
290.0290.0
0.700.750.800.850.900.951.001.051.101.151.201.251.30
55 50 45 40 35 30 25 200
200
400
600
800
1000
1200
1400
1600
1800
2000
2200
24001991 12 20 00 +42(1991 12 21 18)0.0666667FF Theta
282.5282.5
282.5282.5
282.5
285.0285.0
285.0285.0
285.0
287.5287.5
287.5287.5
287.5
290.0 290.0290.0
SN
(lines: isentropes, color: wind speed)
W E
Mountains’ influence on PBL
0.700.750.800.850.900.951.001.051.101.151.201.251.30
55 50 45 40 35 30 25 200
200
400
600
800
1000
1200
1400
1600
1800
2000
2200
24001991 12 20 00 +42(1991 12 21 18)0.0666667FF Theta
282.5282.5
282.5282.5
282.5
285.0285.0
285.0285.0
285.0
287.5287.5
287.5287.5
287.5
290.0 290.0290.0
SN
wind speed /isentropes
TKE /isentropes
SN
108
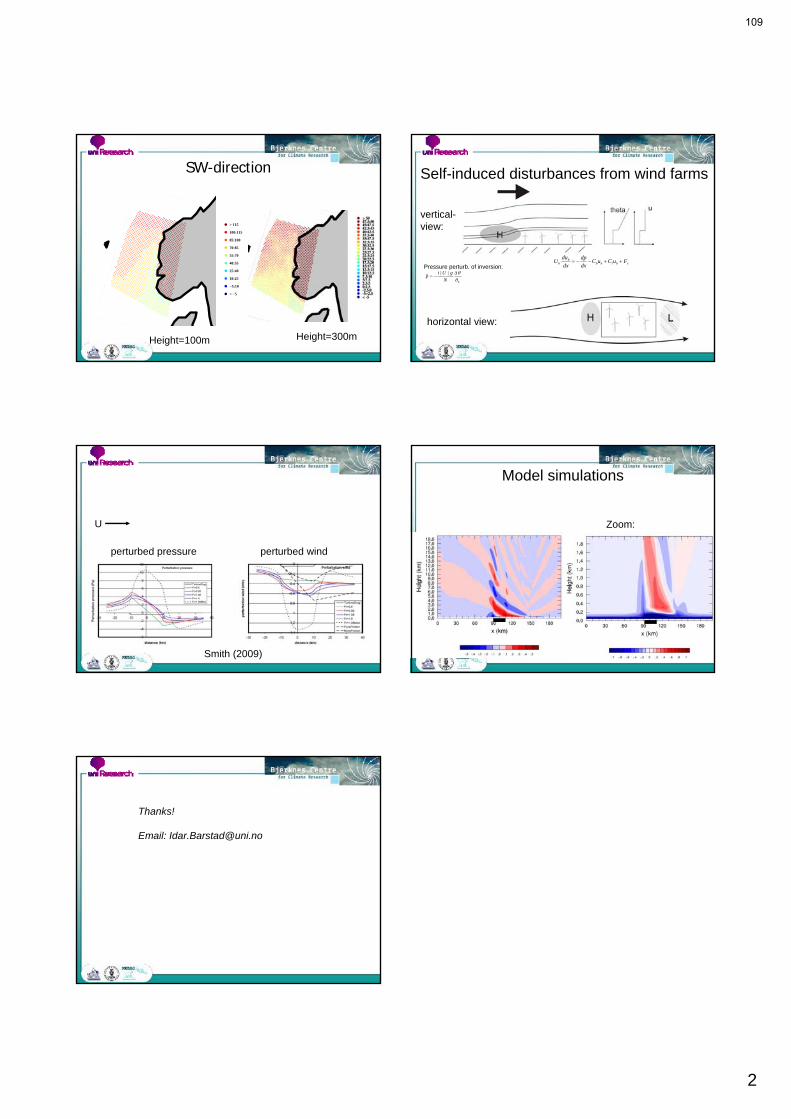
2
SW-direction
Height=300m
< −5
−5:10
10:25
25:40
40:55
55:70
70:85
85:100
100:115
> 115
Height=100m
Self-induced disturbances from wind farms
xbtbbb
b FuCuCdx
dp
dx
duU
dx
dp
dx
duU
horizontal view:
vertical-view:
0
||ˆ
N
gUip
Pressure perturb. of inversion:
Smith (2009)
U
perturbed pressure perturbed wind
Model simulations
Zoom:
Thanks!
Email: [email protected]
109
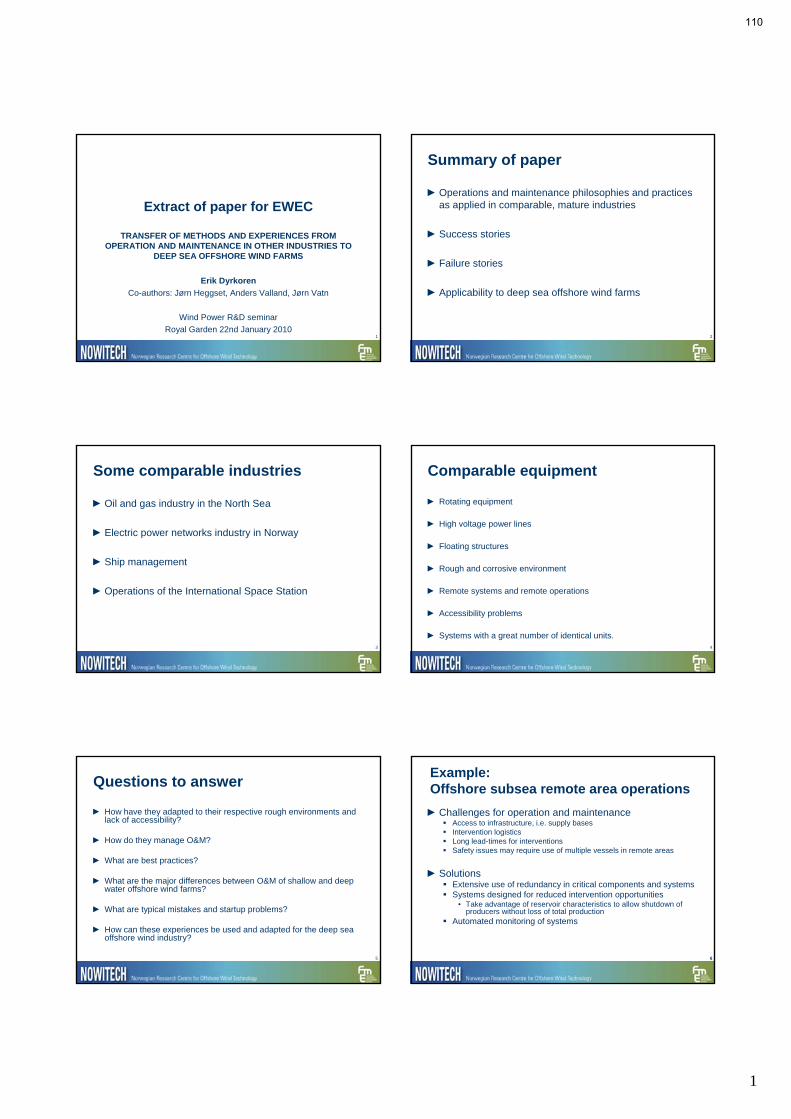
1
1
Extract of paper for EWEC
TRANSFER OF METHODS AND EXPERIENCES FROM OPERATION AND MAINTENANCE IN OTHER INDUSTRIES TO
DEEP SEA OFFSHORE WIND FARMS
Erik Dyrkoren
Co-authors: Jørn Heggset, Anders Valland, Jørn Vatn
Wind Power R&D seminar
Royal Garden 22nd January 20102
Summary of paper
►Operations and maintenance philosophies and practices as applied in comparable, mature industries
►Success stories
►Failure stories
►Applicability to deep sea offshore wind farms
3
Some comparable industries
►Oil and gas industry in the North Sea
►Electric power networks industry in Norway
►Ship management
►Operations of the International Space Station
4
Comparable equipment
► Rotating equipment
► High voltage power lines
► Floating structures
► Rough and corrosive environment
► Remote systems and remote operations
► Accessibility problems
► Systems with a great number of identical units.
5
Questions to answer
► How have they adapted to their respective rough environments and lack of accessibility?
► How do they manage O&M?
► What are best practices?
► What are the major differences between O&M of shallow and deep water offshore wind farms?
► What are typical mistakes and startup problems?
► How can these experiences be used and adapted for the deep sea offshore wind industry?
66
Example:Offshore subsea remote area operations
►Challenges for operation and maintenance Access to infrastructure, i.e. supply bases Intervention logistics Long lead-times for interventions Safety issues may require use of multiple vessels in remote areas
►Solutions Extensive use of redundancy in critical components and systems Systems designed for reduced intervention opportunities
• Take advantage of reservoir characteristics to allow shutdown ofproducers without loss of total production
Automated monitoring of systems
110

2
77
► Business specific operational measures Specialised vessel for dedicated intervention tasks
(i.e. inspection, light well intervention, coil tubing, hot stab etc.)
► Safety / HMS aspects Remote area operations requires vessel autonomy with regard to
• Medical staff, capability for light surgery• Firefighting• Handling of spills
► What can be transferred to Offshore wind? Use of redundancy, Robust design Use of dedicated instrumentation for condition monitoring System design with intrinsic robustness towrads extended downtime of single
producers Component and system design for operation reliability
• Modular systems to allow easy replacement of defective components (plug-and-play)
Example cont.:Offshore subsea remote area operations
8
Example:Electric power networks (overhead lines)► Industry challenges within O&M
Geographically dispersed components Limited/difficult accessibility due to mountains, fjord crossings, rough
climate, etc. Many components near end of life (old) Difficult to make group of identical components for statistical analyses
(mainly due to large climatic variations)
► Technical solutions, Redundancy
(N-1 criterion: The system will handle the loss of one component) Cross-linked polyethylene (XLPE) covered conductors, Earth cables
► Operational solutions Condition monitoring and degradation models to calculate remaining life
(independent of age) Condition monitoring handbooks with specified condition criteria makes it
possible to collect data in a uniform way
9
► Typical O&M methods and strategies Risk based methods (RCM and variations on this) Shift from Time based to Condition based maintenance “Safety based” maintenance
(safety is often the triggering factor for maintenance and renewal)
► Industry unique operational measures Inspection from helicopter and drones (unmanned micro helicopters)
► Failure stories Nord-Salten: Up to 1 week interruption because the reserve line was not
maintained to take over the load during breakdown of the primary line. Impossible to get access to the failed components due to very bad weather.
► What can be transferred to Offshore wind? Use of probabilistic methods to calculate risk Well-defined condition criteria and failure models Helicopter / drone inspections??
Example:Electric power networks (overhead lines)
10
Lessons learned from FPSO
►How to unite a whole industry in doing things differently
►The importance of viewing maintenance as an enabler and not as a cost
►Accept for thinking two thoughts simulataneously, RAM: Regularity and Availability vs.
Maintainability
Maintenance as a mean to achieve regularity
11
TRANSFER OF METHODS AND EXPERIENCES FROM OPERATION AND MAINTENANCE IN OTHER
INDUSTRIES TO DEEP SEA OFFSHORE WIND FARMS
www.ewec2010.info
111
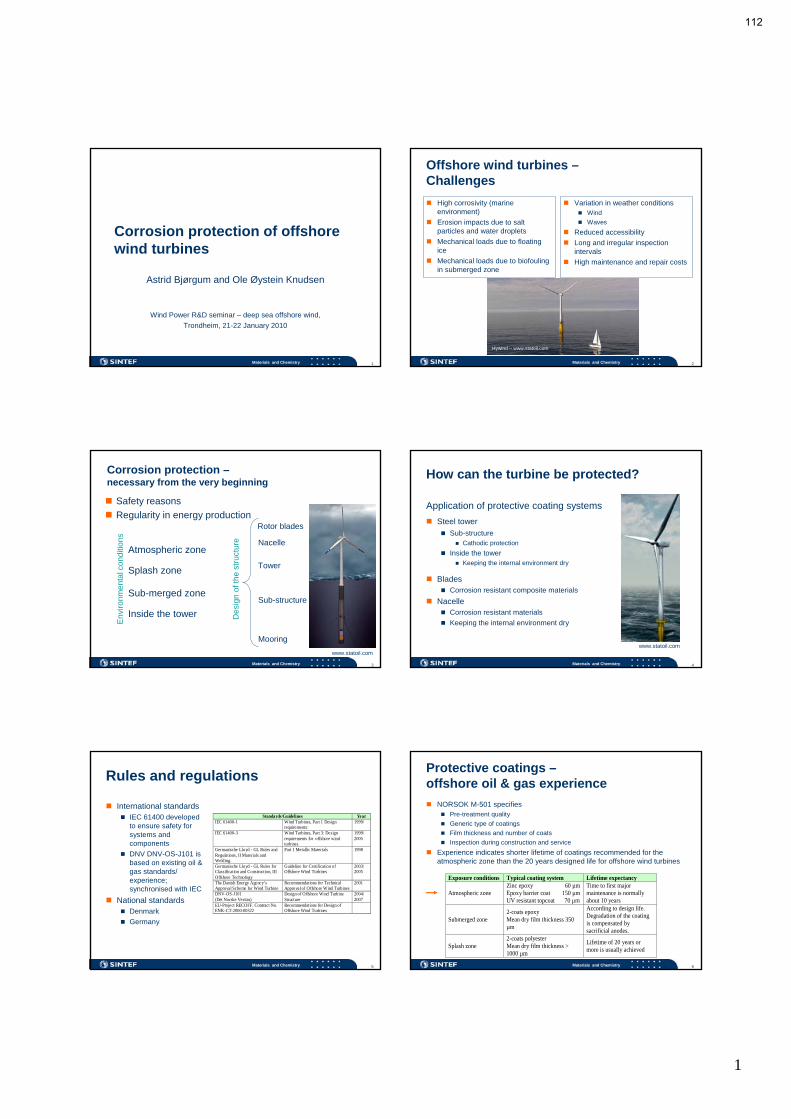
1
1Materials and Chemistry
Corrosion protection of offshore wind turbines
Astrid Bjørgum and Ole Øystein Knudsen
Wind Power R&D seminar – deep sea offshore wind,
Trondheim, 21-22 January 2010
2Materials and Chemistry
Offshore wind turbines –Challenges
High corrosivity (marine environment)
Erosion impacts due to salt particles and water droplets
Mechanical loads due to floating ice
Mechanical loads due to biofoulingin submerged zone
Variation in weather conditionsWind
Waves
Reduced accessibility
Long and irregular inspection intervals
High maintenance and repair costs
Hywind – www.statoil.com
3Materials and Chemistry
Corrosion protection –necessary from the very beginning
Safety reasons
Regularity in energy production
www.statoil.com
Rotor blades
Nacelle
Tower
Sub-structure
Mooring
En
viro
nm
en
tal c
ond
itio
ns
Des
ign
of t
he s
truc
ture
Atmospheric zone
Splash zone
Sub-merged zone
Inside the tower
4Materials and Chemistry
How can the turbine be protected?
Application of protective coating systems
Steel tower
Sub-structureCathodic protection
Inside the towerKeeping the internal environment dry
BladesCorrosion resistant composite materials
NacelleCorrosion resistant materials
Keeping the internal environment dry
www.statoil.com
5Materials and Chemistry
Rules and regulations
International standardsIEC 61400 developed to ensure safety for systems and components
DNV DNV-OS-J101 is based on existing oil & gas standards/ experience; synchronised with IEC
National standardsDenmark
Germany
Standards/Guidelines Year IEC 61400-1
Wind Turbines, Part 1 Design requirements:
1999/
IEC 61400-3 Wind Turbines, Part 3: Design requirements for offshore wind turbines
1999/ 2005
Germanische Lloyd - GL Rules and Regulations, II Materials and Welding.
Part 1 Metallic Materials 1998
Germanische Lloyd - GL Rules for Classification and Construction, III Offshore Technology
Guideline for Certification of Offshore Wind Turbines
2003/ 2005
The Danish Energy Agency’s Approval Scheme for Wind Turbine
Recommendations for Technical Approval of Offshore Wind Turbines
2001
DNV-OS-J101 (Det Norske Veritas)
Design of Offshore Wind Turbine Structure
2004/ 2007
EU-Project RECOFF. Contract No. ENK-CT-2000-00322
Recommendations for Design of Offshore Wind Turbines
6Materials and Chemistry
Protective coatings –offshore oil & gas experience
NORSOK M-501 specifiesPre-treatment quality
Generic type of coatings
Film thickness and number of coats
Inspection during construction and service
Experience indicates shorter lifetime of coatings recommended for the atmospheric zone than the 20 years designed life for offshore wind turbines
Exposure conditions Typical coating system Lifetime expectancy
Atmospheric zone Zinc epoxy 60 µm Epoxy barrier coat 150 µm UV resistant topcoat 70 µm
Time to first major maintenance is normally about 10 years
Submerged zone 2-coats epoxy Mean dry film thickness 350 µm
According to design life. Degradation of the coating is compensated by sacrificial anodes.
Splash zone 2-coats polyester Mean dry film thickness > 1000 µm
Lifetime of 20 years or more is usually achieved
112

2
7Materials and Chemistry
Are extended coating lifetimes possible?
To ensure a lifetime corresponding to design life with a minimummaintenance requirement, DNV recommends
Use coating systems with documented performanceOperational experience
Prequalification (NORSOK M-501)
Control that specified surface preparation and application conditions are followed
Exposure conditions
Typical coating system Dry film thickness
(DFT)
Atmospheric zone
A coating system according to ISO 12944-5, category C5-M (very high corrosivity): - zinc rich epoxy primer - intermediate epoxy - epoxy or polyurethane topcoat, polyurethane if a colour or gloss retention is required
Minimum 320 µm
Splash zone
- Glass flake reinforced epoxy or polyurethane or - Thermally sprayed aluminium with a silicon sealer
Minimum 1.5 mm Minimum 200 µm
Submerged zone
- Multilayer two component epoxy and cathodic protection - Alternatively cathodic protection only
Minimum 450 µm No coating
8Materials and Chemistry
Challenges for offshore wind turbines
Keep costs low
Higher energy outputImproved foundation technology
Enlarged wind turbines
Steel foundations seem to be competitive to concrete
50 years design lifetime is possible for steel structures
What about the corrosion protection?
www.energy.siemens.com
9Materials and Chemistry
Coating systems in use
Offshore wind parks 1
Outside Zinc duplex systems
Thermally sprayed zinc-TSZ 2
Paint system
InsideMainly paint alone
TZS specified in splash zone on some towers
Generally limited information on coatings and coating performance
1: Reported by Hempel
2: Mainly Zinc/Al - TSZA (85/15)
60 µm200 µm
50 µm 100 µm
First 10 m:MetallizationEpoxyAbove 10 m:Zinc epoxy Epoxy
80 µm120 µm100 µm50 µm
MetallizationEpoxyEpoxyPolyurethane topcoat
2003Samsø
80 µm100 µm100 µm
MetallizationEpoxyEpoxy
100 µm100 µm120 µm50 µm
MetallizationEpoxyEpoxyPolyurethane topcoat
2002Horns Rev80 turbines installed
80 µm100 µm100 µm
MetallizationEpoxyEpoxy
100 µm120 µm100 µm50 µm
MetallizationEpoxyEpoxyPolyurethane topcoat
2001Middelgrunden20 turbines installed
70 µm150 µm
Zinc epoxyEpoxy
75 µm2 x 110 µm
50 µm
Zinc epoxyEpoxy Polyurethane topcoat
2000Utgrunden7 turbines installed
75 µm150 µm
EpoxyEpoxy
120 µm100 µm100 µm50 µm
MetallizationEpoxyEpoxyPolyurethane topcoat
1991Vindeby11 turbines installed
40 µm2x 140 µm
Zinc epoxyEpoxy
80 µm100 µm100 µm50 µm
MetallizationEpoxyEpoxyPolyurethane topcoat
1995Tunø Knob
DFT (µm)CoatingDFT (µm)Coating 1
Protection system insideProtection system outsideOperation year
Windpark
10Materials and Chemistry
Corrosion protection on new projects
HywindCoating systems on substructure based on
NORSOK M-501 Statoils experiences from offshore oil & gas
Standard tower/turbineNot known, but probably according to ISO 12944, class C5-M
Tower and nacelleClimate inside controlled by dehumidifiers
Sharingham Shoal wind parkSubstructure
Paints according to NORSOK M-501 in/above splash zoneCathodic protection (sacrificial anodes) only in submerged zone
TowerISO 12944, class C5-M
Below the air-tight deckNo coating applied inside6 mm corrosion allowance added
11Materials and Chemistry
Corrosion protecting coating systems for offshore wind turbines
DemandsRapid production
Low investments costs
Low costs in service
Long lifetime compared to lifetime experienced for offshore oil & gas installations
Maintenance-free coating systems
12Materials and Chemistry
Alternative protection systems today
Conventional coating systemExperiences from offshore oil and gas installations
First maintenance after 8-0 years According to Hempel
Existing NORSOK M-501 qualified coating systems has 20-25 years lifetimeA minor increase in the dry film thickness may increase the lifetime to 25 - 30 years
Including metallizationAlready used on offshore wind turbinesUsed by the Norwegian Public Roads Administration since 1965
Rombak bridge showed no corrosion after 40 yearsCoating system
Thermally sprayed zinc (TSZ)Corrosion protecting paint
Rombak Bridge, www.Wikipedia.com
113

3
13Materials and Chemistry
Our recommendations – existing coatings
Recently, a life cycle cost analysis has been performed forConventional three-coats systemTSZ duplex systems
Metallization30-50% cost increase in construction30% LCC saved by avoiding maintenance
We recommendTSZ duplex system
Atmospheric and splash zone
Combined cathodic protection and epoxy coating in submerged zone
Reduced application costsAutomation of coating applicationReduce the number of paint coats
14Materials and Chemistry
New coating technology
Self repairing coatings may improve corrosion performance of a coating system
Healing agents release from microcapsulesChemical inhibiting species release in connection to coating damages
Before such coatings can be used on offshore wind turbines we need further
EvaluationOptimization
Picture from publication of W. Schott
15Materials and Chemistry
Thank you for your attention!
114

D Installation and sub-structures Research at Alpha Ventus: RAVE and GIGAWIND, Prof. Dr.-Ing. habil. Raimund Rolfes, ForWind, Leibniz University Hannover Hydrodynamic effects on bottom-fixed offshore wind turbines, Karl O. Merz, PhD student NTNU, Prof G Moe, NTNU, Prof Ove T. Gudmestad, Univ. of Stavanger Supply of jackets to the Alpha-Ventus wind farm, Jørgen Jorde, NorWind Cost comparison of sub-structures, Daniel Zwick and Haiyan Long, PhD students NTNU
115

1
Research at Alpha Ventus: Research at Alpha Ventus:
RAVE and GIGAWINDRAVE and GIGAWINDRaimund Rolfes, P. Schaumann, T. Schlurmann, L. Lohaus,
M. Achmus, G. Haake (Leibniz Universität Hannover), H. Huhn, M. Durstewitz (Fraunhofer-IWES)
Outline
• Policy – Germanys offshore wind strategy
• about alpha ventus offshore wind farm
• The RAVE research initiative
• GIGAWIND alpha ventusResearch on support structures
alpha ventus in Nov 09
German offshore strategy
Achievement of
• ~25 GW offshore capacity until 2030,
• profound offshore technology know how
• Independence from energy imports from other countries (nuclear, oil and gas)
Fot
o: ©
DO
TI
• 1st German offshore wind farm
• 12 OWEC á 5MW (Multibrid / REpower)
• operator: DOTI
• distance from coast: 45km
• water depth: 30m
• planning: since 2006
• installation: 2008 – 2009
• Research: RAVE
Offshore‐Testfeld alpha ventus
„alpha ventus“
2nd installation phase 2009
About alpha ventus
About alpha ventus
Location
Layout of alpha ventus
Multibrid M5000
Repower 5M
Met Mast
116
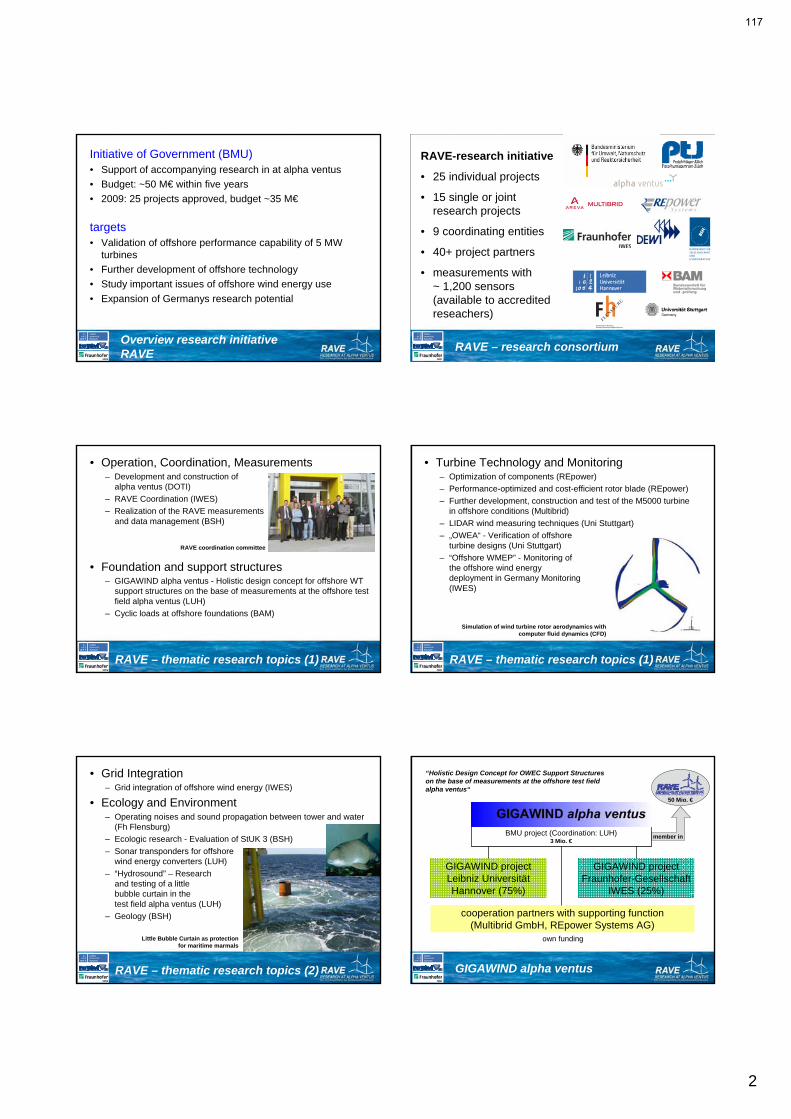
2
Overview research initiative RAVE
Initiative of Government (BMU) • Support of accompanying research in at alpha ventus
• Budget: ~50 M€ within five years
• 2009: 25 projects approved, budget ~35 M€
targets• Validation of offshore performance capability of 5 MW
turbines
• Further development of offshore technology
• Study important issues of offshore wind energy use
• Expansion of Germanys research potential
RAVE – research consortium
RAVE-research initiative
• 25 individual projects
• 15 single or joint research projects
• 9 coordinating entities
• 40+ project partners
• measurements with ~ 1,200 sensors (available to accredited reseachers)
RAVE – thematic research topics (1)
• Operation, Coordination, Measurements– Development and construction of
alpha ventus (DOTI)
– RAVE Coordination (IWES)
– Realization of the RAVE measurements and data management (BSH)
• Foundation and support structures– GIGAWIND alpha ventus - Holistic design concept for offshore WT
support structures on the base of measurements at the offshore test field alpha ventus (LUH)
– Cyclic loads at offshore foundations (BAM)
RAVE coordination committee
RAVE – thematic research topics (1)
• Turbine Technology and Monitoring– Optimization of components (REpower)
– Performance-optimized and cost-efficient rotor blade (REpower)
– Further development, construction and test of the M5000 turbine in offshore conditions (Multibrid)
– LIDAR wind measuring techniques (Uni Stuttgart)
– „OWEA“ - Verification of offshore turbine designs (Uni Stuttgart)
– “Offshore WMEP” - Monitoring of the offshore wind energy deployment in Germany Monitoring (IWES)
Simulation of wind turbine rotor aerodynamics withcomputer fluid dynamics (CFD)
RAVE – thematic research topics (2)
• Grid Integration– Grid integration of offshore wind energy (IWES)
• Ecology and Environment– Operating noises and sound propagation between tower and water
(Fh Flensburg)
– Ecologic research - Evaluation of StUK 3 (BSH)
– Sonar transponders for offshore wind energy converters (LUH)
– “Hydrosound” – Research and testing of a little bubble curtain in the test field alpha ventus (LUH)
– Geology (BSH)
Little Bubble Curtain as protectionfor maritime marmals
“Holistic Design Concept for OWEC Support Structures on the base of measurements at the offshore test field alpha ventus“
GIGAWIND project Leibniz UniversitätHannover (75%)
GIGAWIND project Fraunhofer-Gesellschaft
IWES (25%)
cooperation partners with supporting function (Multibrid GmbH, REpower Systems AG)
own funding
BMU project (Coordination: LUH) 3 Mio. €
member in
50 Mio. €
GIGAWIND alpha ventus
117
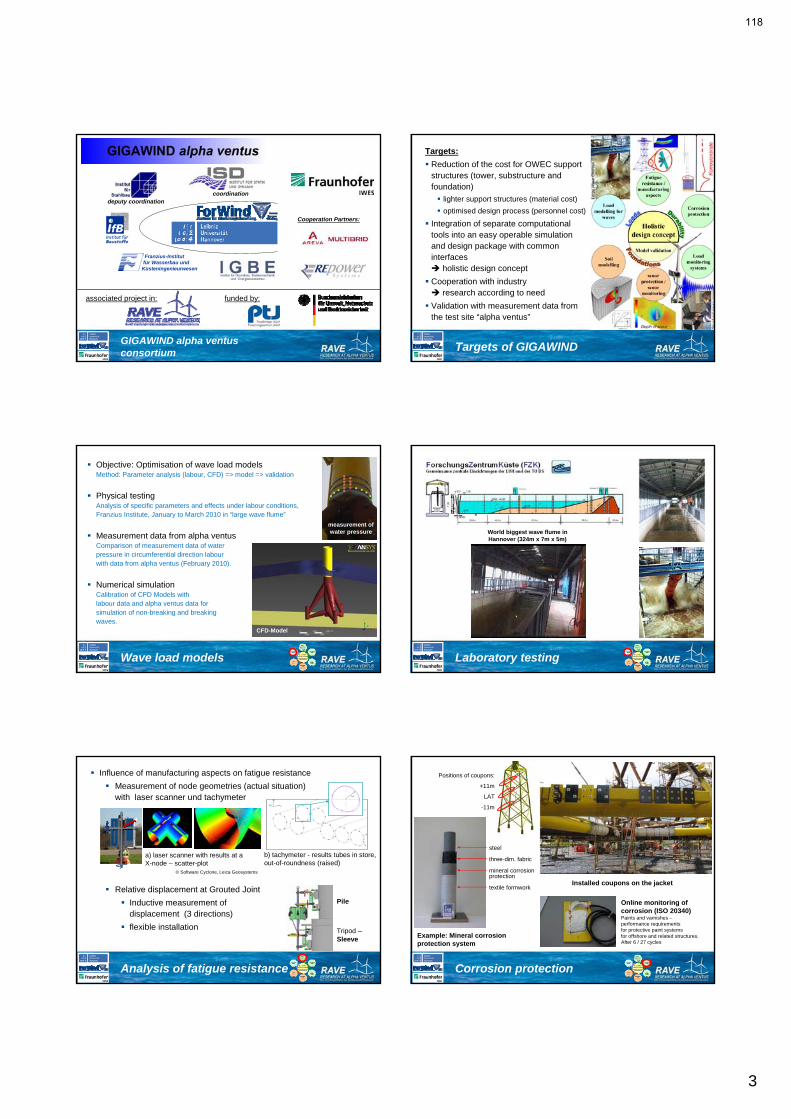
3
GIGAWIND alpha ventusconsortium
Franzius-Institutfür Wasserbau und
Küsteningenieurwesen
Cooperation Partners:
coordinationdeputy coordination
associated project in: funded by:
Targets of GIGAWIND
Targets:
Reduction of the cost for OWEC support structures (tower, substructure and foundation)
lighter support structures (material cost)
optimised design process (personnel cost)
Integration of separate computational tools into an easy operable simulation and design package with common interfaces holistic design concept
Cooperation with industry research according to need
Validation with measurement data from the test site “alpha ventus”
Wave load models
Objective: Optimisation of wave load modelsMethod: Parameter analysis (labour, CFD) => model => validation
Physical testingAnalysis of specific parameters and effects under labour conditions,Franzius Institute, January to March 2010 in “large wave flume”
Measurement data from alpha ventusComparison of measurement data of water pressure in circumferential direction labour with data from alpha ventus (February 2010).
Numerical simulationCalibration of CFD Models withlabour data and alpha ventus data for simulation of non-breaking and breaking waves.
CFD-Model
measurement of water pressure
Laboratory testing
World biggest wave flume in Hannover (324m x 7m x 5m)
Analysis of fatigue resistance
Influence of manufacturing aspects on fatigue resistance
Measurement of node geometries (actual situation) with laser scanner und tachymeter
Relative displacement at Grouted Joint
Inductive measurement of displacement (3 directions)
flexible installation
a) laser scanner with results at a X-node – scatter-plot
© Software Cyclone, Leica Geosystems
b) tachymeter - results tubes in store, out-of-roundness (raised)
Pile
Tripod –Sleeve
Corrosion protection
Online monitoring of corrosion (ISO 20340)Paints and varnishes –performance requirements for protective paint systems for offshore and related structures. After 6 / 27 cycles
Example: Mineral corrosion protection system
Installed coupons on the jacket
steel
three-dim. fabric
mineral corrosionprotection
textile formwork
Positions of coupons:
+11m
LAT
-11m
118
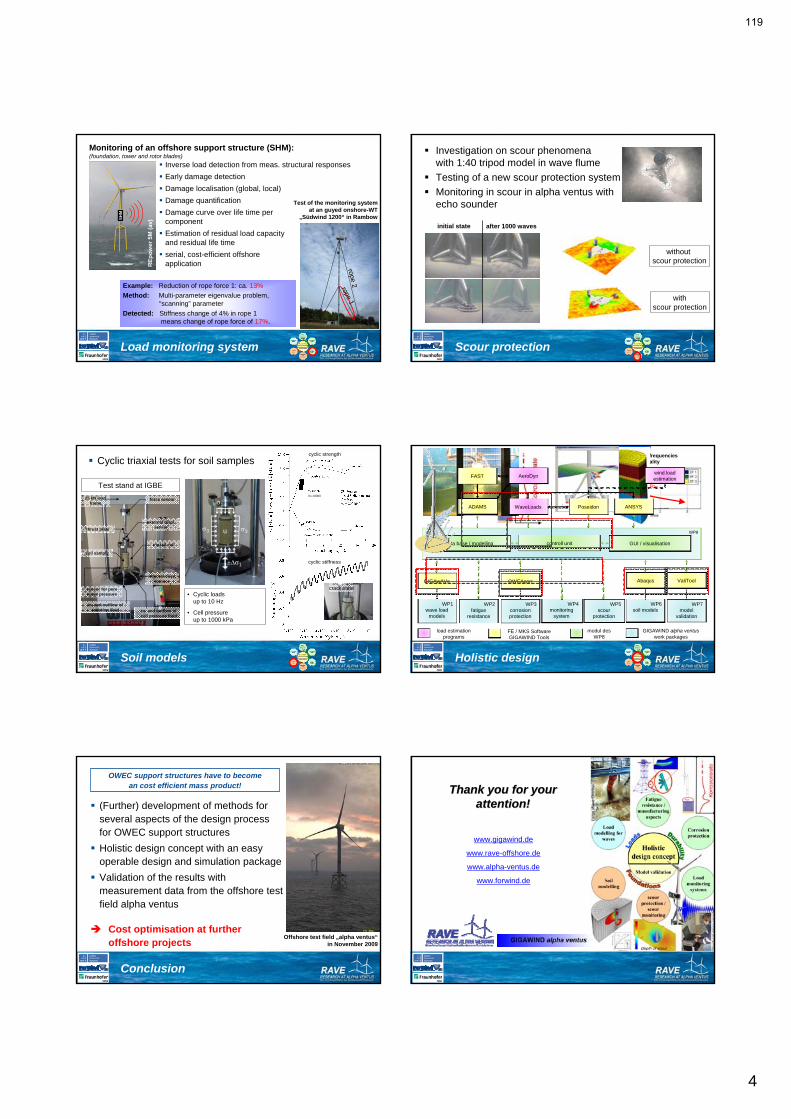
4
Load monitoring system
Monitoring of an offshore support structure (SHM):(foundation, tower and rotor blades)
Inverse load detection from meas. structural responses
Early damage detection
Damage localisation (global, local)
Damage quantification
Damage curve over life time per component
Estimation of residual load capacityand residual life time
serial, cost-efficient offshore application
Test of the monitoring system at an guyed onshore-WT
„Südwind 1200“ in RambowSH
M
rope 2rope 2
rope 1rope 1
Example: Reduction of rope force 1: ca. 13%
Method: Multi-parameter eigenvalue problem, “scanning” parameter
Detected: Stiffness change of 4% in rope 1 means change of rope force of 17%.
RE
po
wer
5M (
av)
Scour protection
Investigation on scour phenomena with 1:40 tripod model in wave flume
Testing of a new scour protection system
Monitoring in scour in alpha ventus with echo sounder
initial state after 1000 waves
without scour protection
withscour protection
Soil models
Cyclic triaxial tests for soil samples
25 kN load frame
force sensor
in- and outflow of cell pressure fluid
in- and outflow of satiation fluid
thrust plate
soil sample
internal displ. sensor
external displ. sensor
triaxial cell
• Cyclic loads up to 10 Hz
• Cell pressure up to 1000 kPa
33
1
±1
u
Test stand at IGBE
crack state
cyclic strength
cyclic stiffness
N=10000
sensor for pore water pressure
FAST
ADAMS
iterative validation
deviation of eigenfrequenciesmodel – reality
Holistic design
wind load estimation
WP1wave load
models
WP2fatigue
resistance
WP3corrosion protection
WP4monitoring
system
WP5scour
protection
WP6soil models
WP7model
validation
GIGAwAVe OWEAcorr Abaqus ValiTool
WP8
data base / modelling controll unit GUI / visualisation
load estimation programs
FE / MKS SoftwareGIGAWIND Tools
modul des WP8
GIGAWIND alpha ventuswork packages
AeroDyn
WaveLoads Poseidon ANSYS
Conclusion
(Further) development of methods for several aspects of the design process for OWEC support structures
Holistic design concept with an easy operable design and simulation package
Validation of the results with measurement data from the offshore test field alpha ventus
Cost optimisation at further offshore projects
Offshore test field „alpha ventus“in November 2009
OWEC support structures have to become an cost efficient mass product! ThankThank youyou forfor youryour
attentionattention!!
www.gigawind.de
www.rave-offshore.de
www.alpha-ventus.de
www.forwind.de
119
5
120

A Review of the Morison Equation forCalculating Hydrodynamic Loads on
Vertically-Oriented Cylinders
Karl MerzDepartment of Civil Engineering
Norwegian University of Science and Technology (NTNU)January 22, 2010
Find the net force of the fluid on the structure, F(z,t).
A Definition of the Problem
The loads on the structure are a function of several flow processes (waves, current, structural motion) which act simultaneously and interact nonlinearly.
Calculation of loads is heavily empirical. There is a lot of laboratory data at flow parameters (like Reynolds number) that are not representative of full-scale structures. There have been field measurements on full-scale structures, but here the flow parameters are somewhat uncertain. Connecting the two is not easy; design values should not be considered "final" or broadly applicable.
The value used for fluid damping should be calibrated independently of the primary drag coefficient CD, and should be guided by full-scale data.
There are several important, outstanding issues that are not considered in this presentation:- free surface effects, run-up, draw-down, impact (slamming), and ringing ("burst motions")- negative damping, "lock-in", the interaction of vortex shedding and structural vibration- forces on members at an angle to the oncoming flow, or parallel to the free surface
Key Points
It is convenient to think about the hydrodynamic loading in terms of flow processes. Multiple processes wind-generated waves, remote swell, current, and structural motion are active simultaneously, and their (nonlinear) interaction results in the fluid force on the structure.
(For the present discussion, we shall assume that each process can be described by a single dominant trigonometric term; in reality, multiple harmonics are involved.)
Flow Processes
The net flow velocity vector may exhibit large fluctuations in both direction and magnitude. If the flow separates, forming a wake of shed vortices, then there is a ``memory effect''; the pressure about the structure is a function not only of the instantaneous flow velocity vector, but also its time history.
How do we predict loads on the structure? For large-volume structures (Kc = Vw0/fw D < 1 or 2), potential theory is used to calculate the wave forces, with an empirical drag force (the second term in the equation below) superposed to account for a steady current.
Typical ocean wavelengths are over 40 m, therefore wind turbine towers will typically be considered small-volume structures. In this case, the Morison equation is used. This equation is a little bit of theory combined with a lot of empiricism:
Morison Equation
The Morison equation states that the fluid force is a superposition of a term in phase with the acceleration of the flow (inertia), and a term whose dominant component is in phase with the velocity of the flow (drag). It accounts for some flow nonlinearity, by way of the drag term.
The Morison equation is deterministic. In itself it does not account for the history of the flow (the state of the wake), the frequency with which the flow oscillates back and forth, nor the fact that the instantaneous velocity vector V arises as a superposition of several flow processes.
Morison Equation: Empirical Coefficients
The effect of the history of the flow on the fluid force dF must be accounted for entirely by the coefficients CM and CD. In other words, the coefficients are a function of the state of the wake, the flow processes which are active, the frequency of flow oscillation, and such.
121
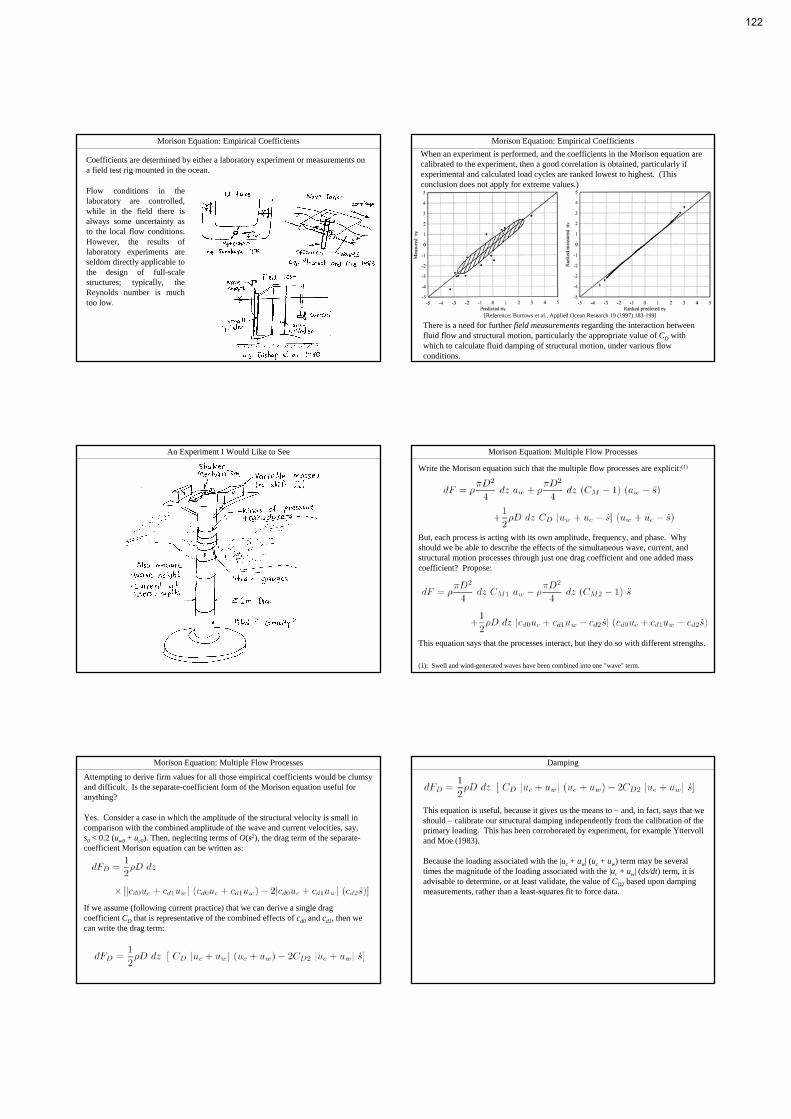
Coefficients are determined by either a laboratory experiment or measurements on a field test rig mounted in the ocean.
Morison Equation: Empirical Coefficients
Flow conditions in the laboratory are controlled, while in the field there is always some uncertainty as to the local flow conditions. However, the results of laboratory experiments are seldom directly applicable to the design of full-scale structures; typically, the Reynolds number is much too low.
There is a need for further field measurements regarding the interaction between fluid flow and structural motion, particularly the appropriate value of CD with which to calculate fluid damping of structural motion, under various flow conditions.
Morison Equation: Empirical Coefficients
[Reference: Burrows et al., Applied Ocean Research 19 (1997) 183-199]
When an experiment is performed, and the coefficients in the Morison equation are calibrated to the experiment, then a good correlation is obtained, particularly if experimental and calculated load cycles are ranked lowest to highest. (This conclusion does not apply for extreme values.)
An Experiment I Would Like to See
Write the Morison equation such that the multiple flow processes are explicit:(1)
Morison Equation: Multiple Flow Processes
But, each process is acting with its own amplitude, frequency, and phase. Why should we be able to describe the effects of the simultaneous wave, current, and structural motion processes through just one drag coefficient and one added mass coefficient? Propose:
(1): Swell and wind-generated waves have been combined into one "wave" term.
This equation says that the processes interact, but they do so with different strengths.
Attempting to derive firm values for all those empirical coefficients would be clumsy and difficult. Is the separate-coefficient form of the Morison equation useful for anything?
Yes. Consider a case in which the amplitude of the structural velocity is small in comparison with the combined amplitude of the wave and current velocities, say,s0 < 0.2 (uw0 + uc0). Then, neglecting terms of O(s2), the drag term of the separate-coefficient Morison equation can be written as:
Morison Equation: Multiple Flow Processes
If we assume (following current practice) that we can derive a single drag coefficient CD that is representative of the combined effects of cd0 and cd1, then we can write the drag term:
This equation is useful, because it gives us the means to and, in fact, says that we should calibrate our structural damping independently from the calibration of the primary loading. This has been corroborated by experiment, for example Yttervoll and Moe (1983).
Because the loading associated with the |uc + uw| (uc + uw) term may be several times the magnitude of the loading associated with the |uc + uw| (ds/dt) term, it is advisable to determine, or at least validate, the value of CD2 based upon damping measurements, rather than a least-squares fit to force data.
Damping
122

Alpha Ventus Jacket Installations
22. January 2010
www.norwind.no
Company overview
Teknisk Data
NorWind AS
OWEC Tower AS
33.4%5%
BiFab Germany
24.5%
SWAY as
GRIEG GROUPSCATEC
60% 40%
Foundation design
(20‐200m)
Detailed
Engineering
Jacket
fabrication
33.4%
Troll WindPower
40%
Electrical systems
PROJECT: ALPHA VENTUS
Location: Borkum Island, Germany
Customer: DOTI (Vattenfall, E.On, EWE)
Contractor: NorWind
Scope: Engineering, Procurement, Construction and Installation of 6 jacket foundations
Jacket: 6 off/500 T/60 m/ 20x20m
Pile: 24 off/75 T/35-40m/OD: 72’
Depth: 28 m
Soil: Sand
Alpha Ventus Offshore Wind Projectbased on pre-piling of Jacket foundations
Photographs courtesy of: Doti, OWEC Tower, BiFab, NorWind
Short introduction to the installation methodology
• Pre‐piling decided – tight tolerances on pile installation
• First: Drive piles: Piling vessel, hammer, pile frame, verification
• Second: Install jacket: Installation vessel, grouting vessel
Piling frame and template
• A centre template (TMP) is used to secure position on seabed, designed: IHC SeaSteel.
• A IHC SeaSteel piling frame (72SLOT) is moved around the centre template for the 4 pile locations.
• This method is verified to ensure correct x y positions of the piles including inclination.
TMP
72SLOT
Piling vessel • Buzzard – owned by GeoSea
• Jack‐up rig with no propulsion
• Deck space very confined
• Limited carrying capacity
• Crawler crane
• No helideck
123

Pile installation• Piles are loaded onboard and up‐ended in an up‐ending tool prior to lifting the piles into the slot on the seabed.
Pile driving • Piles are driven/ hammered down using a sub sea hammer from Menck, monitored by
ROV and measurement equipment from NGI
ROV operations
• Oceaneering WROV was used for all underwater operations including:
‐ hook on/off
‐ position verifications
‐ pile measurements
‐ pile excavation
• Underwater visibility of only 1 ‐ 2 meters and current up to 3 knots
Jacket fabrication •OWEC Tower Quattropods fabricated at BiFab (Scotland)
Jacket transportation Jacket transportation
124

Installation of Jackets Jacket installation•Heerema’s Thialf DP crane vessel (15 000 tonnes capacity)
Grouting of jacket (subsea)•Grouting Vessel – Toisa Valiant, owned by Sealion•Grouting contractor – ULO/Miles Offshore•ROV contractor – Fugro Offshore Survey
Comparison: Operations modelled in real weather data
Waiting to transfer pilesMarginal operation
Time series of Significant wave height, from Alpha Ventus June 2009, installations at three sites (12 piles)
Jack‐up operationsRapid sequencing shorter ops period than weather changes!
NorWind and partners have designed a new vessel concept for installation of piles and jackets. The vessel is based upon the following:
• Experience gained from the Alpha Ventus project
• Experience from the oil and gas, and from the maritime industry
• The following companies are involved in our project
– Maritime Projects – project manger
– Marintek – vessel simulations/model testing
– Rolls Royce & Kongsberg – dynamic positioning system
– TTS Marine – cranes & lifting equipment
– DnV – 3. party verification
New concept – pile and jacket installation vessel
125
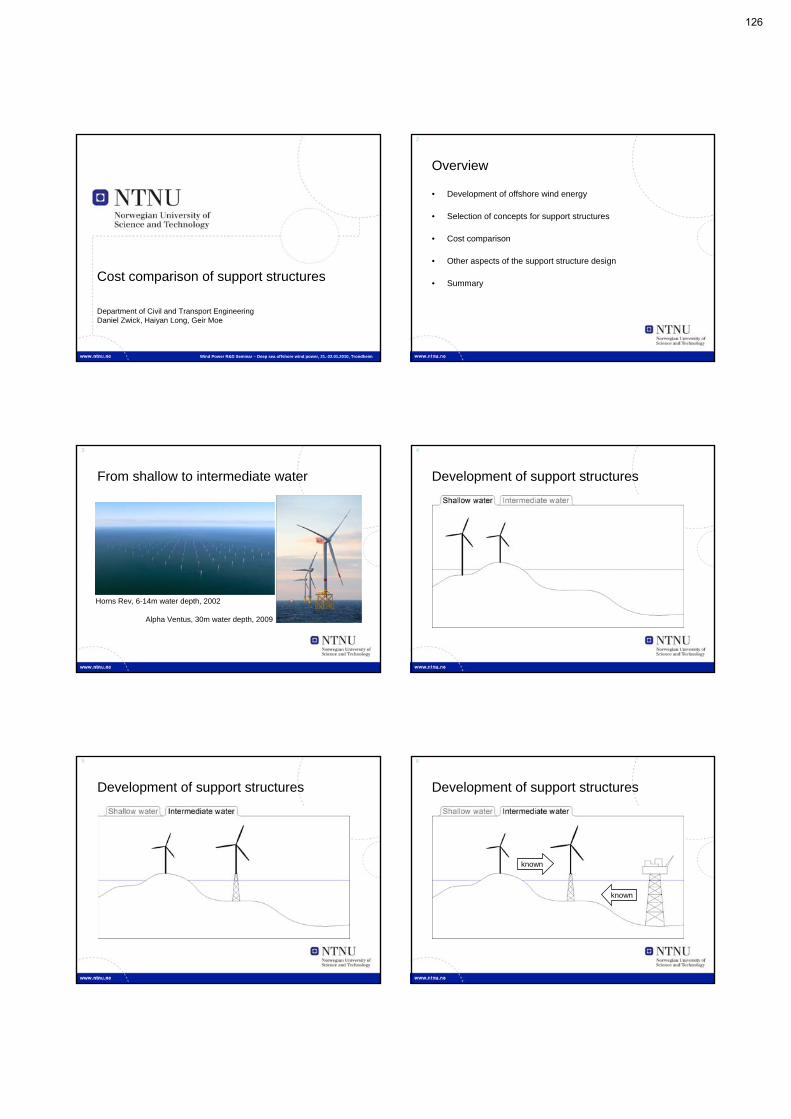
1
Cost comparison of support structures
Department of Civil and Transport EngineeringDaniel Zwick, Haiyan Long, Geir Moe
Wind Power R&D Seminar – Deep sea offshore wind power, 21.-22.01.2010, Trondheim
2
Overview
• Development of offshore wind energy
• Selection of concepts for support structures
• Cost comparison
• Other aspects of the support structure design
• Summary
3
From shallow to intermediate water
Horns Rev, 6-14m water depth, 2002
Alpha Ventus, 30m water depth, 2009
4
Development of support structures
5
Development of support structures
6
Development of support structures
known
known
126

7
Different concepts
fully tubular lattice-tubular fully lattice tripod-tubular
8
Driving force for selection
• Costs
- material
- fabrication
- transport
- installation
• Consequences for total concept
- rotor configuration
- lifetime of the structure
- maintenanceBeatrice Project, 45m water depth, 2007
9
Weight comparison of concepts
fully tubular lattice-tubular fully lattice tripod-tubular
4-legs 3-legs 4-legs
1000t 710t * 700t 540t 800t *
(weights of substructure and tower, * from www.alpha-ventus.de)
10
Fabrication of support structures
Butt welds
K-, X-joints
circumferencialbutt weld
longitudinalbutt weld
Number of welds
Tube diameter Wall thickness
fully tubular 140 3,9-7,3m 19-88mm
fully lattice3-legs4-legs
250330
legs / bracings1,1m / 0,39m0,9m / 0,36m
legs / bracings56mm / 19mm35mm / 14mm
Tower design for 30m water depth, tower height 120m.
11
Welding of support structures
• Submerged arc welding (SAW)
- effective welding process
- suitable for large wall thickness
- simple geometries
• Flux core arc welding (FCAW)
- flexible welding process
- complex geometries
12
Important parameters
• Deposition rate [kg/h]- for calculation of thenet welding time
• Set-up time [h/weld]- preparation- inspection
SAW FCAW
typical10-15kg/h
typical3-5kg/h
Depends mainly on:- size and geometry of the joint- fabrication facilities
127
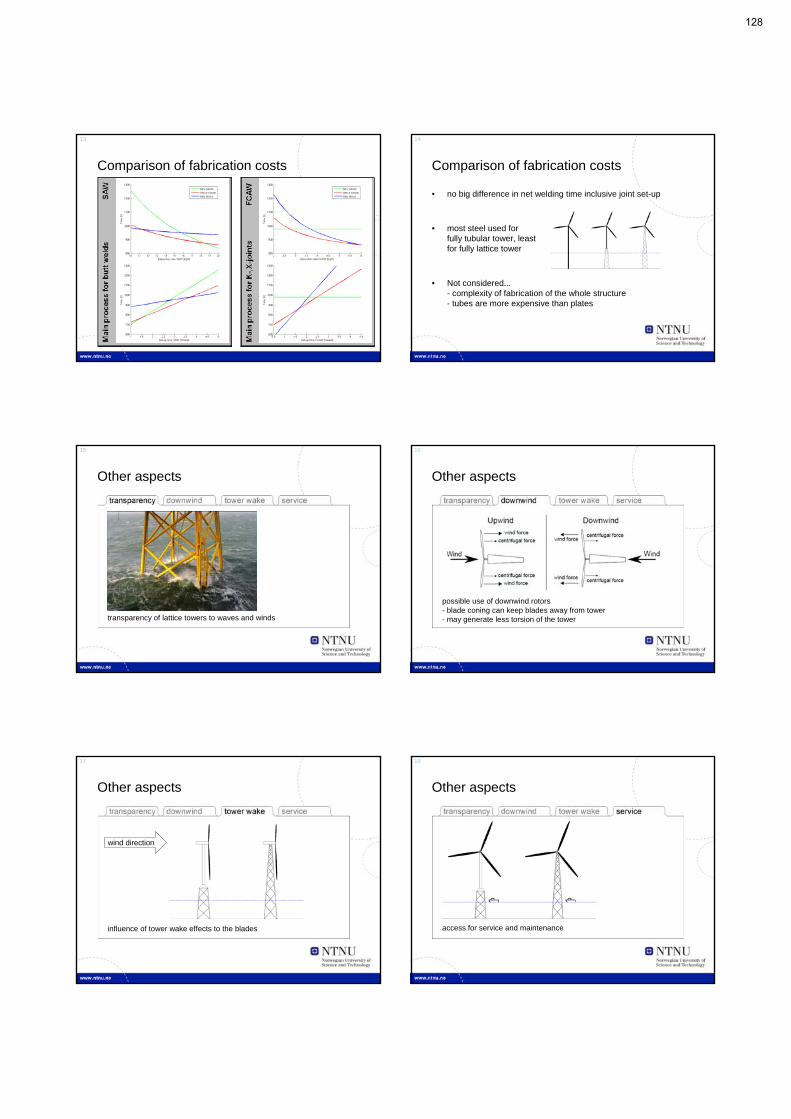
13
Comparison of fabrication costs
14
Comparison of fabrication costs
• no big difference in net welding time inclusive joint set-up
• most steel used forfully tubular tower, leastfor fully lattice tower
• Not considered...- complexity of fabrication of the whole structure- tubes are more expensive than plates
15
Other aspects
transparency of lattice towers to waves and winds
16
Other aspects
possible use of downwind rotors- blade coning can keep blades away from tower- may generate less torsion of the tower
17
Other aspects
influence of tower wake effects to the blades
wind direction
18
Other aspects
access for service and maintenance
128
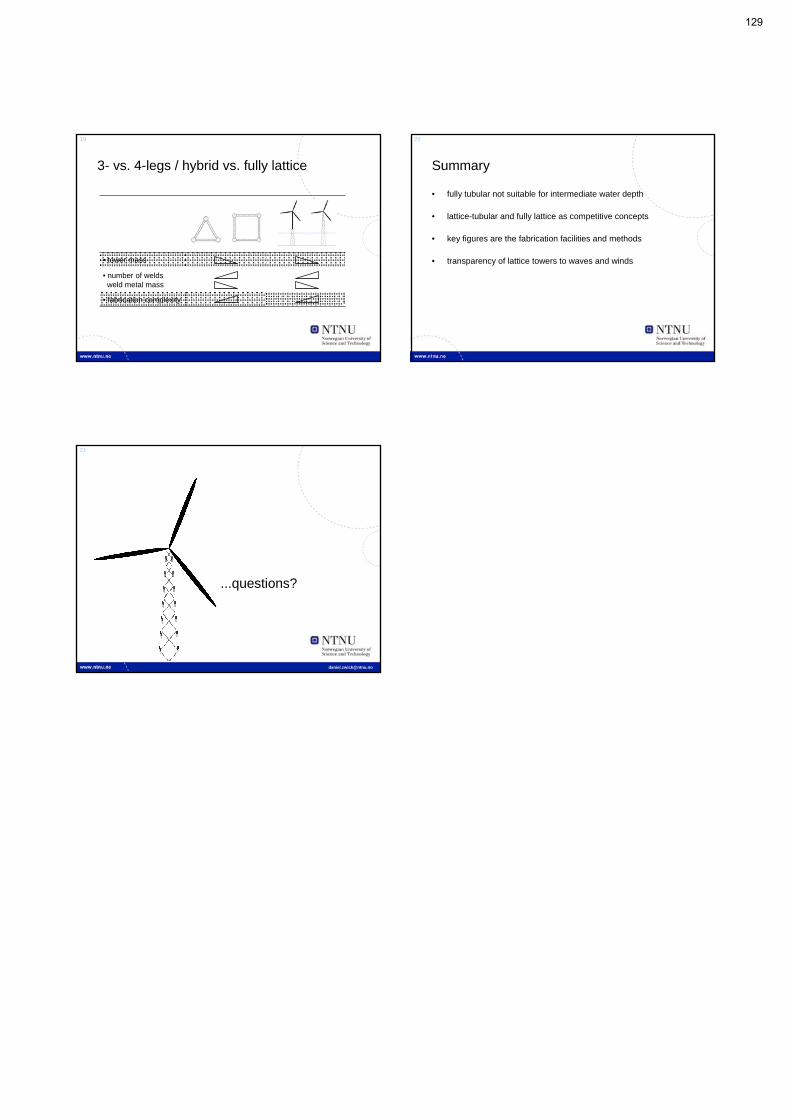
19
3- vs. 4-legs / hybrid vs. fully lattice
• tower mass
• number of weldsweld metal mass
• fabrication complexity
20
Summary
• fully tubular not suitable for intermediate water depth
• lattice-tubular and fully lattice as competitive concepts
• key figures are the fabrication facilities and methods
• transparency of lattice towers to waves and winds
21
...questions?
129

Closing session – expert panel on R&D needs for developing offshore wind farms The European research agenda on offshore wind, Beate Kristiansen, Research Council of Norway State-of-the-art design practices for offshore wind farms, Peter Hauge Madsen, Risø DTU Panel debate on R&D needs for developing offshore wind farms Dr habil Hans-Gerd Busmann, Head of Fraunhofer IWES Peter Hauge Madsen, Head of Wind Energy Division, Risø DTU Dr Olimpo Anaya-Lara, University of Strathclyde Finn Gunnar Nielsen, Chief Scientist, Statoil Bo Rohde Jensen, Senior Specialist, Vestas Wind Systems A/S Terje Gjengedal, R&D director, Statnett
130

1
The European research agenda on offshore wind
Beate Kristiansen, Special Adviser / EU NCP Energy
Drivers for the R&D
The climate and energy targets for 2020:
20 % renewable energy
20 % energy efficiency/saving
20 % GHG reduction
Three pillars:
Competitiveness
Energy security
GHG
Cooperation!
• Member States: Steering Group• Strategic planning and implementation;
Reinforce the coherence between nation.
• Lead by the EC
• Industry: European Industrial Initiatives (EII)• Strengthen industrial energy research and innovation
• Promising technologies where barriers, investment and risk better tackled collectively. Grid, Wind, Sun, CCS, Bio, Cities/efficiency, nuclear fission
• Research institutes: European Energy Research Alliance (EERA)
• Cooperate – excising activities
Strategic Energy Technology (SET) Plan- The technology pillar of the EU's energy & climate policy
SET-plan Roadmaps
Action plan, targets, activities:1. R&D programmes: basic and applied, pilot, test facilities2. Demonstration programmes3. Market replication measures
Resources needed: From 3 to 8 bill euro per year
~ 50 bill Euro the next 10 years
Org. & instruments/funding: Ongoing Programme cooperation, ERA-NET+, JTI… EEPR, EU ETS, EIB, FP7, MS programmes….
Variable geometry (voluntary)
EWI, Industrial Wind Initiative
Industrial sector objective:enable 20 % share wind in EU electricity by 2020
Roadmap: What: reduce costs,
move offshore and resolve grid integration
How:
1. New turbines & components
2. Offshore technology
3. Grid integration
4. Resource assessment
Cost: 6bn€
Roadmap actions (I)
1) New turbines/components: lower investment, O&M costs:
R&D programme: new turbine designs, materials and comp.; on- and offshore applications;demo. programme on large scale turbine prototype (10-20MW).
Network of 5-10 European testing facilities: efficiency & reliability of turbine systems.
EU cross-industrial cooperation and demo. programme: mass production of wind systems: increased component and system reliability, advanced manufacturingtechniques, and offshore turbines. 5–10 demo. projects.
131
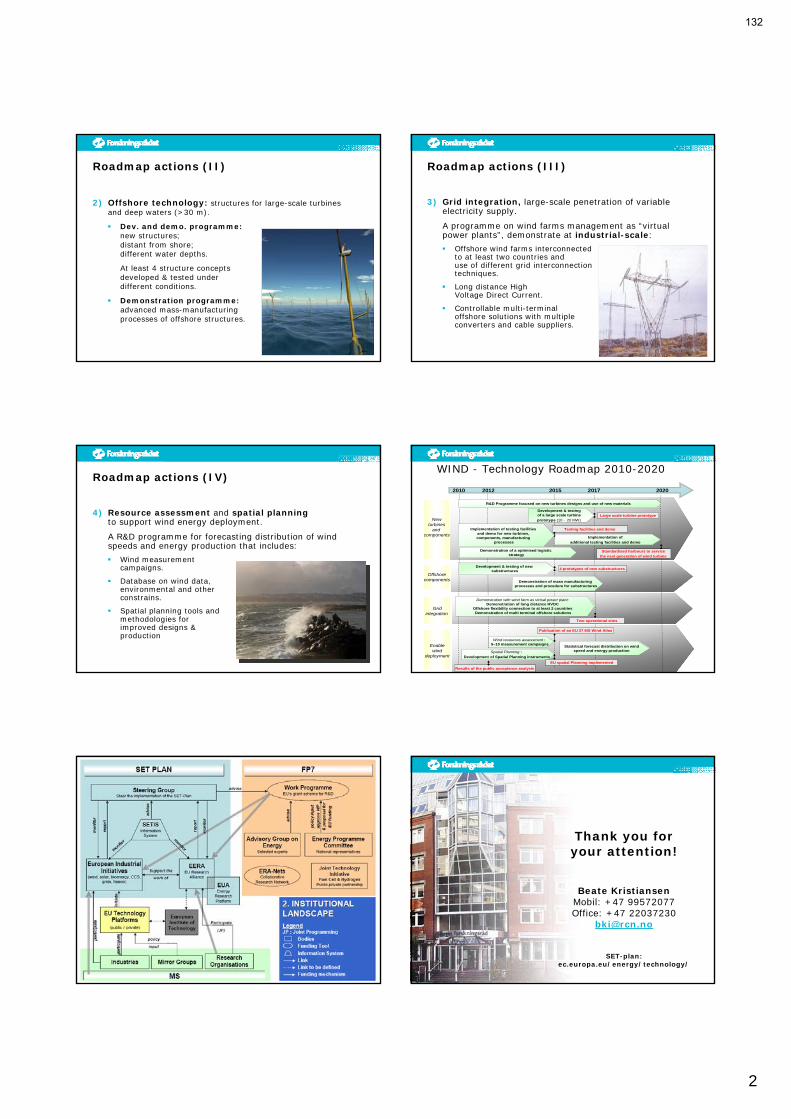
2
Roadmap actions (II)
2) Offshore technology: structures for large-scale turbines and deep waters (>30 m).
Dev. and demo. programme:new structures; distant from shore; different water depths.
At least 4 structure concepts developed & tested underdifferent conditions.
Demonstration programme:advanced mass-manufacturing processes of offshore structures.
Roadmap actions (III)
3) Grid integration, large-scale penetration of variable electricity supply.
A programme on wind farms management as “virtual power plants”, demonstrate at industrial-scale:
Offshore wind farms interconnected to at least two countries and use of different grid interconnection techniques.
Long distance High Voltage Direct Current.
Controllable multi-terminal offshore solutions with multiple converters and cable suppliers.
Roadmap actions (IV)
4) Resource assessment and spatial planning to support wind energy deployment.
A R&D programme for forecasting distribution of wind speeds and energy production that includes:
Wind measurement campaigns.
Database on wind data, environmental and other constrains.
Spatial planning tools and methodologies for improved designs & production
WIND - Technology Roadmap 2010-2020
Newturbines
and components
Gridintegration
Enablewind
deployment
Offshorecomponents
Wind resources assessment : 5–10 measurement campaigns
Spatial Planning :
Development of Spatial Planning instruments
Statistical forecast distribution on wind speed and energy production
Implementation of
additional testing facilities and demo
R&D Programme focused on new turbines designs and use of new materials
Testing facilities and demo
Demonstration of a optimised logistic strategy
Results of the public acceptance analysis
2010 2012 2015 2017 2020
EU spatial Planning implemented
Development & testing of new substructures
Demonstration of mass manufacturing processes and procedure for substructures
Two operational sites
Demonstration with wind farm as virtual power plant:Demonstration of long distance HVDC
Offshore flexibility connection to at least 2 countries Demonstration of multi terminal offshore solutions
Publication of an EU 27 MS Wind Atlas
Standardised harbours to service
the next generation of wind turbine
Implementation of testing facilities and demo for new turbines, components, manufacturing
processes
Large scale turbine prototype
4 prototypes of new substructures
Development & testing of a large scale turbine
prototype (10 – 20 MW)
Thank you for your attention!
Beate KristiansenMobil: +47 99572077Office: +47 22037230
SET-plan: ec.europa.eu/energy/technology/
132

3
Which parts of the RD&D at national level? at EU level?
Researchers as links between disciplines and sectors?
Funding instruments for R&D to promote cooperation?(when “common pot” is not possible...)
Facing big challenges calls for more/better cooperation!Cross: themes, disciplines, sectors, industries, nations…
133
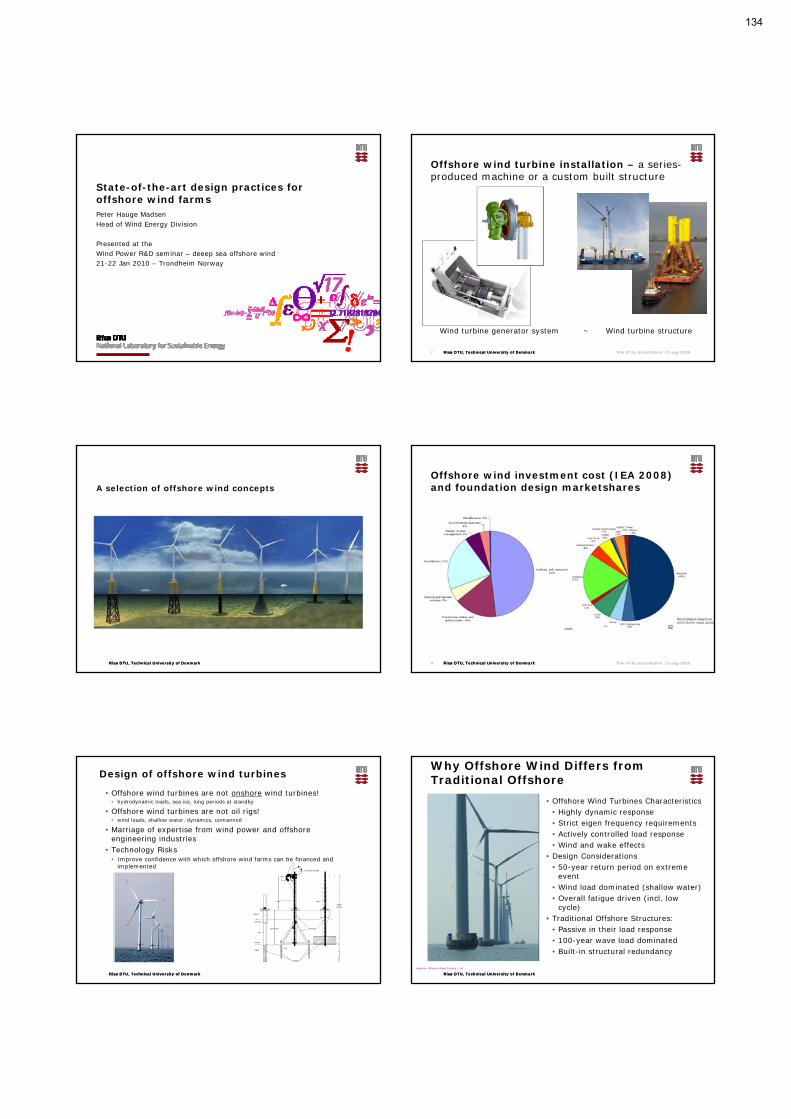
State-of-the-art design practices for offshore wind farmsPeter Hauge MadsenHead of Wind Energy Division
Presented at the Wind Power R&D seminar – deeep sea offshore wind 21-22 Jan 2010 – Trondheim Norway
Risø DTU, Technical University of DenmarkRisø DTU, Technical University of Denmark
Offshore wind turbine installation – a series-produced machine or a custom built structure
21-aug-2008Title of the presentation2
Wind turbine generator system ~ Wind turbine structure
Risø DTU, Technical University of DenmarkRisø DTU, Technical University of Denmark
A selection of offshore wind concepts
Risø DTU, Technical University of DenmarkRisø DTU, Technical University of Denmark
Offshore wind investment cost (IEA 2008) and foundation design marketshares
21-aug-2008Title of the presentation4
4%
Risø DTU, Technical University of DenmarkRisø DTU, Technical University of Denmark
Design of offshore wind turbines
• Offshore wind turbines are not onshore wind turbines!• hydrodynamic loads, sea ice, long periods at standby
• Offshore wind turbines are not oil rigs!• wind loads, shallow water, dynamics, unmanned
• Marriage of expertise from wind power and offshore engineering industries
• Technology Risks• Improve confidence with which offshore wind farms can be financed and
implemented
s u b - s t r u c t u r e
p i l e
f o u n d a t i o n
p i l e
p l a t f o r m
t o w e r t o w e r
s u b - s t r u c t u r e
sea floor
supportstructure
rotor-nacelle assembly
seabed
water level
Risø DTU, Technical University of DenmarkRisø DTU, Technical University of Denmark
Why Offshore Wind Differs fromTraditional Offshore
• Offshore Wind Turbines Characteristics• Highly dynamic response• Strict eigen frequency requirements• Actively controlled load response• Wind and wake effects
• Design Considerations• 50-year return period on extreme
event• Wind load dominated (shallow water)• Overall fatigue driven (incl. low
cycle)• Traditional Offshore Structures:
• Passive in their load response• 100-year wave load dominated• Built-in structural redundancy
Beatrice Offshore Wind Turbine - UK
134

Risø DTU, Technical University of DenmarkRisø DTU, Technical University of Denmark
Standards for Offshore Wind Turbines
•Onshore wind turbines• IEC 61400-1, Edition 3
•Offshore wind turbines• IEC 61400-3• GL Regulations for Offshore WECS, 1995 • DNV, Design of Offshore Wind Turbine Structures, OS-J101, 2007• GL Wind, Guideline for the Certification of Offshore Wind Turbines,
2005
•Offshore structures – petroleum and natural gas industries • ISO 19900, General Requirements for Offshore Structures, 2002• ISO 19901, Specific Requirements for Offshore Structures, 2003• ISO 19902, Fixed Steel Offshore Structures, 2004 (DIS)• ISO 19903, Fixed Concrete Offshore Structures, 2004 (DIS)
Risø DTU, Technical University of DenmarkRisø DTU, Technical University of Denmark
IEC 61400-3 Design Requirements for offshore wind turbines
• A wind turbine is considered “offshore”if the support structure is subject to hydrodynamic loading
• Support structure design must be based on “site-specific” conditions
• Design of rotor - nacelle assembly maybe based on:• site-specific conditions, or,• generic conditions, e.g. from 61400-1.
In this case the structural integrity of RNA must be demonstrated based on site-specific conditions
Rotor - Nacelle Assembly
Support Structure
Risø DTU, Technical University of DenmarkRisø DTU, Technical University of Denmark
Design processIEC 61400-3
Risø DTU, Technical University of DenmarkRisø DTU, Technical University of Denmark Slide 10
Design steps and documentation
Risø DTU, Technical University of DenmarkRisø DTU, Technical University of Denmark
www.risoe.dk
0.2 0.4 0.6 0.8 1
Normalised wind speed (relative to wind speed at 150 m)
0
40
80
120
160
Hei
ght (
m)
OffshoreLand
• Higher wind speeds/lower turbulence/lower wind shear
• Stability important: Complex u profiles/further wake propagation
• Higher wind speeds, more frequent, persist for longer periods offshore
• Statistically, coastal zone >20 km
General concept based on lower roughness offshore
Risø DTU, Technical University of DenmarkRisø DTU, Technical University of Denmark
www.risoe.dk
Complexity of winds in the coastal zone (~50 km)
Adjustment layer
Equilibrium layer
T,Q
0 20 40 60 80 100
Fetch (km)
1
1.1
1.2
1.3
1.4
1.5
Win
d s
peed
rat
io (
U5
0/U
10)
StableAverageUnstable
Rødsand (measurements)
135
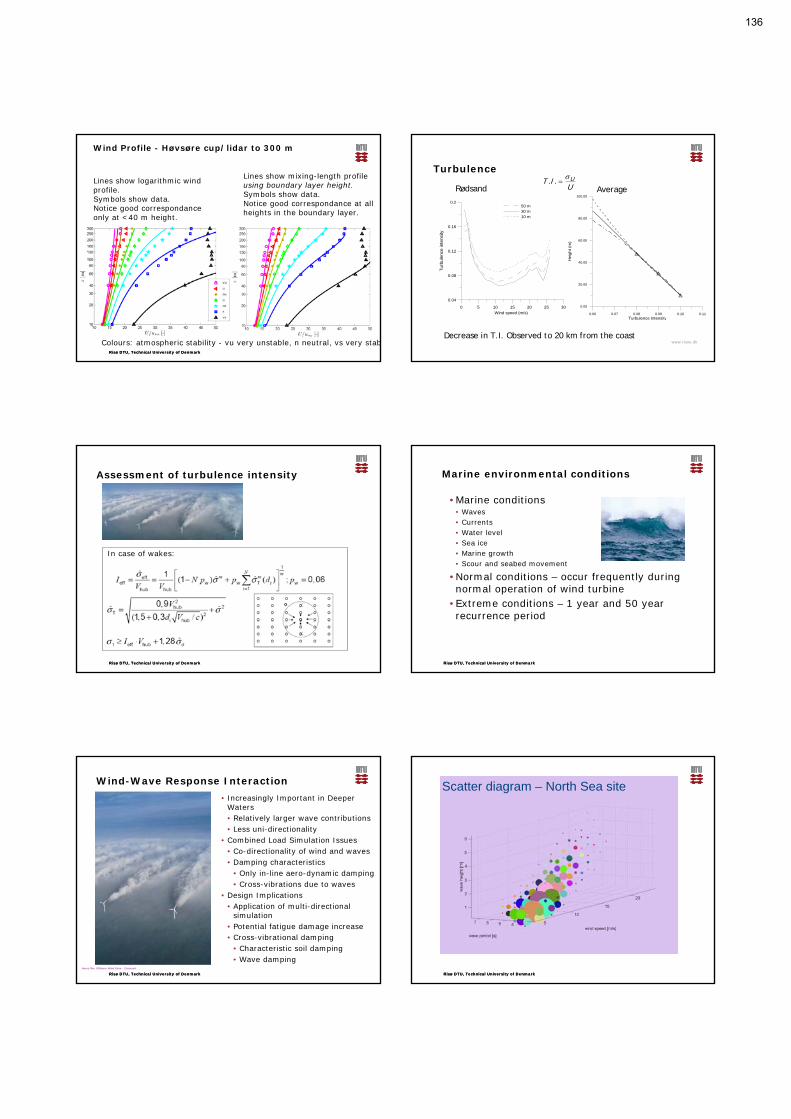
Risø DTU, Technical University of DenmarkRisø DTU, Technical University of Denmark
Lines show logarithmic wind profile.Symbols show data.Notice good correspondance only at <40 m height.
Lines show mixing-length profile using boundary layer height.Symbols show data.Notice good correspondance at all heights in the boundary layer.
Colours: atmospheric stability - vu very unstable, n neutral, vs very stab
Wind Profile - Høvsøre cup/lidar to 300 m
www.risoe.dk
Turbulence
Rødsand
0.06 0.07 0.08 0.09 0.10 0.11Turbulence Intensity
0.00
20.00
40.00
60.00
80.00
100.00
He
igh
t (m
)
0 5 10 15 20 25 30Wind speed (m/s)
0.04
0.08
0.12
0.16
0.2
Turb
ule
nce
inte
nsity
50 m30 m10 m
Decrease in T.I. Observed to 20 km from the coast
AverageUIT U..
Risø DTU, Technical University of DenmarkRisø DTU, Technical University of Denmark
Assessment of turbulence intensity
In case of wakes:
Risø DTU, Technical University of DenmarkRisø DTU, Technical University of Denmark
Marine environmental conditions
•Marine conditions • Waves• Currents • Water level• Sea ice• Marine growth• Scour and seabed movement
•Normal conditions – occur frequently during normal operation of wind turbine
•Extreme conditions – 1 year and 50 year recurrence period
Risø DTU, Technical University of DenmarkRisø DTU, Technical University of Denmark
Wind-Wave Response Interaction
• Increasingly Important in Deeper Waters• Relatively larger wave contributions• Less uni-directionality
• Combined Load Simulation Issues• Co-directionality of wind and waves• Damping characteristics
• Only in-line aero-dynamic damping• Cross-vibrations due to waves
• Design Implications• Application of multi-directional
simulation• Potential fatigue damage increase• Cross-vibrational damping
• Characteristic soil damping• Wave damping
Horns Rev Offshore Wind Farm - Denmark
Risø DTU, Technical University of DenmarkRisø DTU, Technical University of Denmark
Scatter diagram – North Sea site
136
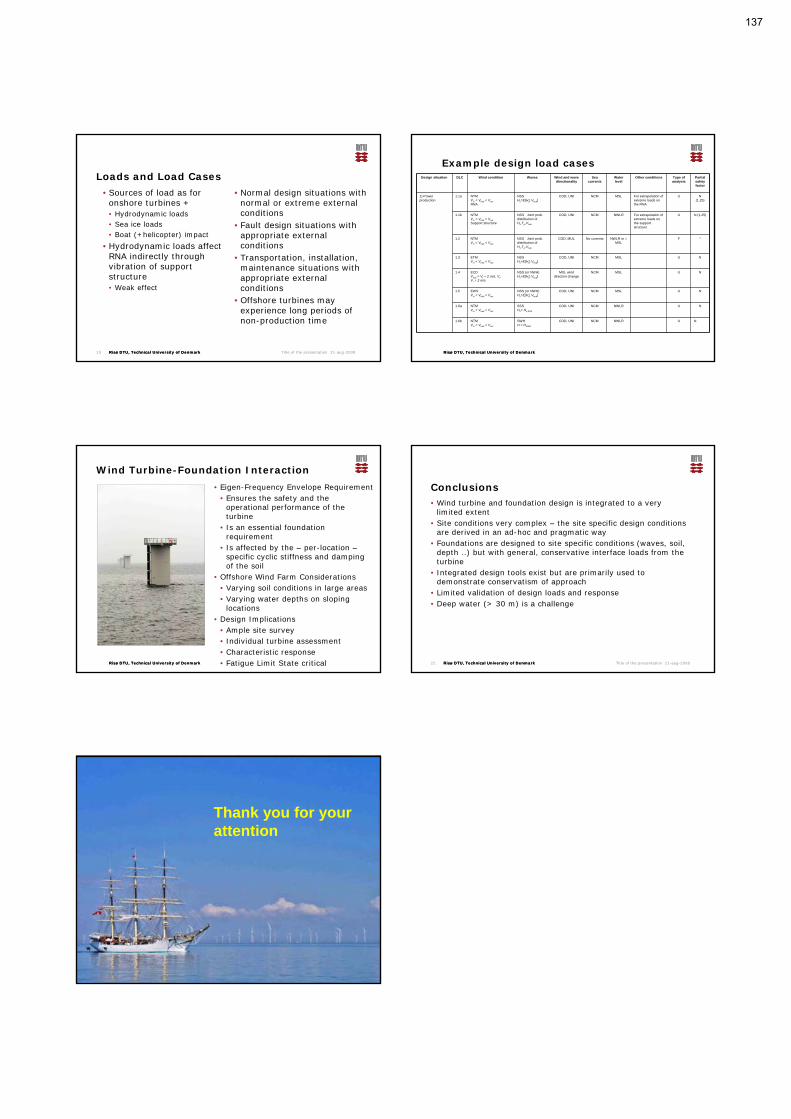
Risø DTU, Technical University of DenmarkRisø DTU, Technical University of Denmark
Loads and Load Cases
•Sources of load as for onshore turbines + • Hydrodynamic loads • Sea ice loads • Boat (+helicopter) impact
•Hydrodynamic loads affect RNA indirectly through vibration of support structure• Weak effect
•Normal design situations with normal or extreme external conditions
•Fault design situations with appropriate external conditions
•Transportation, installation, maintenance situations with appropriate external conditions
•Offshore turbines may experience long periods of non-production time
21-aug-2008Title of the presentation19 Risø DTU, Technical University of DenmarkRisø DTU, Technical University of Denmark
Example design load casesDesign situation DLC Wind condition Waves Wind and wave
directionalitySea
currentsWater level
Other conditions Type of analysis
Partial safety factor
1) Power production
1.1a NTMVin < Vhub < Vout
RNA
NSSHs=E[Hs| Vhub]
COD, UNI NCM MSL For extrapolation of extreme loads on the RNA
U N(1,25)
1.1b NTMVin < Vhub < Vout
Support structure
NSS Joint prob. distribution ofHs,Tp,Vhub
COD, UNI NCM NWLR For extrapolation of extreme loads on the support structure
U N (1,25)
1.2 NTMVin < Vhub < Vout
NSS Joint prob. distribution ofHs,Tp,Vhub
COD, MUL No currents NWLR or ≥MSL
F *
1.3 ETMVin < Vhub < Vout
NSSHs=E[Hs| Vhub]
COD, UNI NCM MSL U N
1.4 ECDVhub = Vr – 2 m/s, Vr,Vr + 2 m/s
NSS (or NWH)Hs=E[Hs| Vhub]
MIS, wind direction change
NCM MSL U N
1.5 EWSVin < Vhub < Vout
NSS (or NWH) Hs=E[Hs| Vhub]
COD, UNI NCM MSL U N
1.6a NTMVin < Vhub < Vout
SSS Hs= Hs,SSS
COD, UNI NCM NWLR U N
1.6b NTMVin < Vhub < Vout
SWH H = HSWH
COD, UNI NCM NWLR U N
Risø DTU, Technical University of DenmarkRisø DTU, Technical University of Denmark
Wind Turbine-Foundation Interaction
• Eigen-Frequency Envelope Requirement• Ensures the safety and the
operational performance of the turbine
• Is an essential foundation requirement
• Is affected by the – per-location –specific cyclic stiffness and damping of the soil
• Offshore Wind Farm Considerations• Varying soil conditions in large areas• Varying water depths on sloping
locations• Design Implications
• Ample site survey• Individual turbine assessment• Characteristic response• Fatigue Limit State critical Risø DTU, Technical University of DenmarkRisø DTU, Technical University of Denmark
Conclusions• Wind turbine and foundation design is integrated to a very
limited extent• Site conditions very complex – the site specific design conditions
are derived in an ad-hoc and pragmatic way• Foundations are designed to site specific conditions (waves, soil,
depth ..) but with general, conservative interface loads from the turbine
• Integrated design tools exist but are primarily used to demonstrate conservatism of approach
• Limited validation of design loads and response• Deep water (> 30 m) is a challenge
21-aug-2008Title of the presentation22
Risø DTU, Technical University of DenmarkRisø DTU, Technical University of Denmark
Thank you for your attention
137
1
Some R&D challenges
• Condition Monitoring developments (highest
reliability and lower OPEX)
Significant developments are required in CM for
transformers (e.g. DGA of oil, tap-changers), cables
(Partial Discharge?, located where?), switchgear
(gas pressure?), power electronic converter
equipment (?).
2
Some R&D challenges
• Enhanced offshore transmission models for fast
switching transients and harmonics analyses in
power systems
Over-voltages from switching transients and
phenomena of this type may be very damaging on
very extensive EHV submarine cable circuits. The
insulation co-ordination requirements of the offshore
substations needs to be evaluated.
3
Some R&D challenges
• There is also a requirement to define the duty that
will be seen by the switchgear and other equipment.
• The effect of faults at various locations have to be
investigated and the transient behaviour of the
network simulated (using appropriate models)
138

1
Classification: Internal
Foundations for manufacturing and installation.
How to approach Gordon Browns challenge: 30 – 40% cost reduction?
Time for evolution or step change?
Classification: Internal
From tip vorticity to wake
Wake losses may jeopardise the park economy
139

R&D Challenges
Terje Gjengedal
Development of interconnectors and a possible future grid
• TSO cooperation thru ENTSO-E, flexible regulators and political willingness• A possible grid will emerge as modules from national wind clusters and or new
interconnectors
• Interconnector technology
• VSC HVDC, recommended solution, supplier interface needed
• Voltage level, to be agreed
• CIGRE to develop standards
• R&D development needed
• Multi-terminals, DC breakers
• Increased capacity and reduced losses
• Trading and balancing
• European trading with renewables
• European balancing and storage
27. januar 2010 3
Offshore development in Norway as seen from the TSO
• Legal framework for offshore wind not yet approved, seems promising• Dedicated areas to be selected for wind production offshore
• Interconnector routing may be located close to selected areas
• Stepwise development
• Technology and standards need development
• Electrification of offshore oil and gas installations may be a driver
• Norway have not yet nominated an offshore TSO• May hamper overall planning and development offshore and coordination with onshore
Is power trade via wind parks better than direct connections?
Technically feasible? Probably, but complicated
Requires VSC HVDC to handle multi terminal solutions
Unproven – several challenges
Will regulatory systems allow it? Hopefully
• Need to overcome national focus
Who pays and who gets the power?• Power flow in the right direction?
27. januar 2010 4
Wind and market structure?
Increasing amount of wind power will require new market instruments?
How do we design the market to manage huge amounts of wind power?
New market instruments and other products?
How to design the market to include• Huge amounts of wind power
• The need to manage flexibility
• Congestion management and a flexible grid
140

SINTEF Energi ASSINTEF Energy Research
No-7465 TrondheimTelephone: + 47 73 59 72 00
[email protected]/energy