wind power systems - university of colorado...
TRANSCRIPT

Wind Power Systems ConclusionsConclusions
ECEN 2060

Trends: turbine types
TurbineTurbine concepts
discussed in class
Greater share now, and expected toexpected to grow further
2ECEN2060
From: F. Blaabjerg, Z. Chen, R. Teodorescu, F. Iov, “Power Electronics in Wind Turbine Systems,” IPEMC 2006

Trends: turbine power rating
Cost per kWh as a function of turbine size
From: F. Blaabjerg, Z. Chen, R. Teodorescu, F. Iov, “Power Electronics in Wind Turbine Systems,” IPEMC 2006
From: W. Erdman and M. Behnke , The Application of Medium-Voltage Electrical Apparatus to the Class of Variable Speed Multi-Megawatt Low Wind Speed Turbines, NREL report, 2005
3ECEN2060
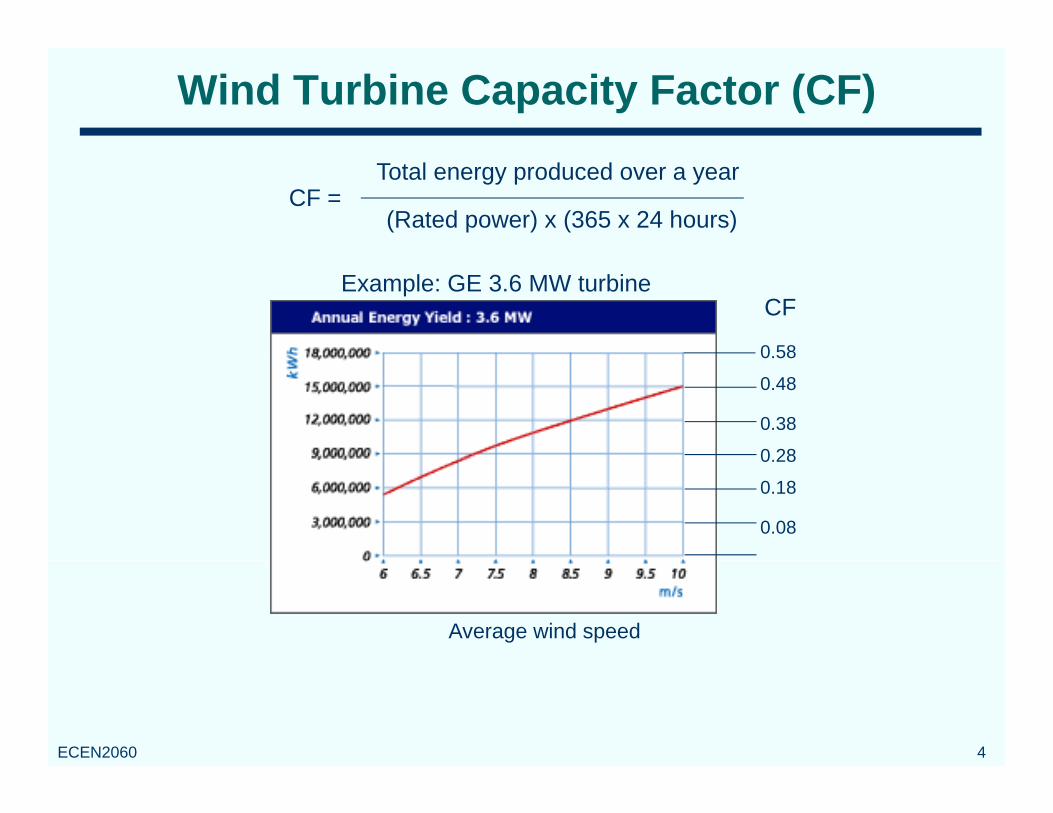
Wind Turbine Capacity Factor (CF)
CF = Total energy produced over a year
(Rated power) x (365 x 24 hours)
Example: GE 3.6 MW turbineCF
0 580.58
0.48
0.38
0 280.28
0.18
0.08
Average wind speed
4ECEN2060

Wind Power EconomicsTextbook Section 6 11Textbook Section 6.11
Example 6.19 (a detailed analysis of the required selling price of electricity to make p ( y q g p ydeveloping a 50 MW wind farm economically viable):
Wind power class Average wind speed c/kWh (approx)3 (Fair) 6.7-7.4 m/s 4.04 (G d) 7 4 7 9 / 3 5
5ECEN2060
4 (Good) 7.4-7.9 m/s 3.55 (Excellent) 7.9-8.4 m/s 3.0

US Wind Resource Map (NREL)http://rredc.nrel.gov/wind/pubs/atlas/
6ECEN2060
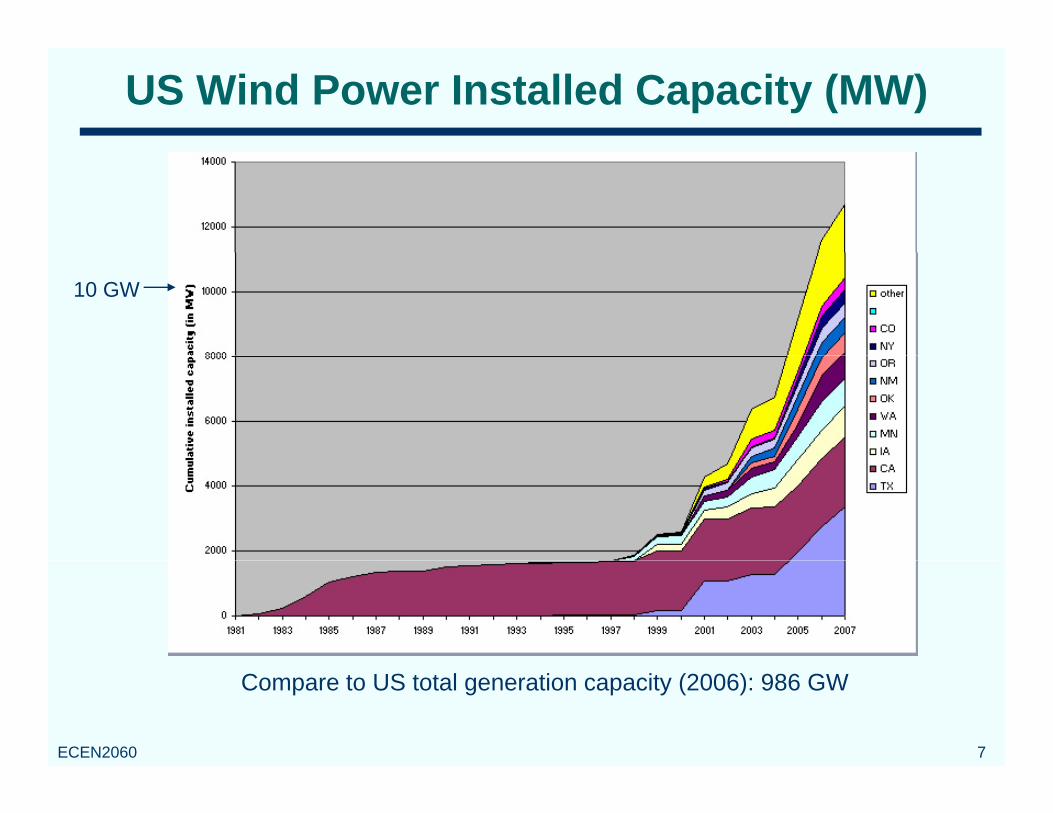
US Wind Power Installed Capacity (MW)
10 GW
7ECEN2060
Compare to US total generation capacity (2006): 986 GW
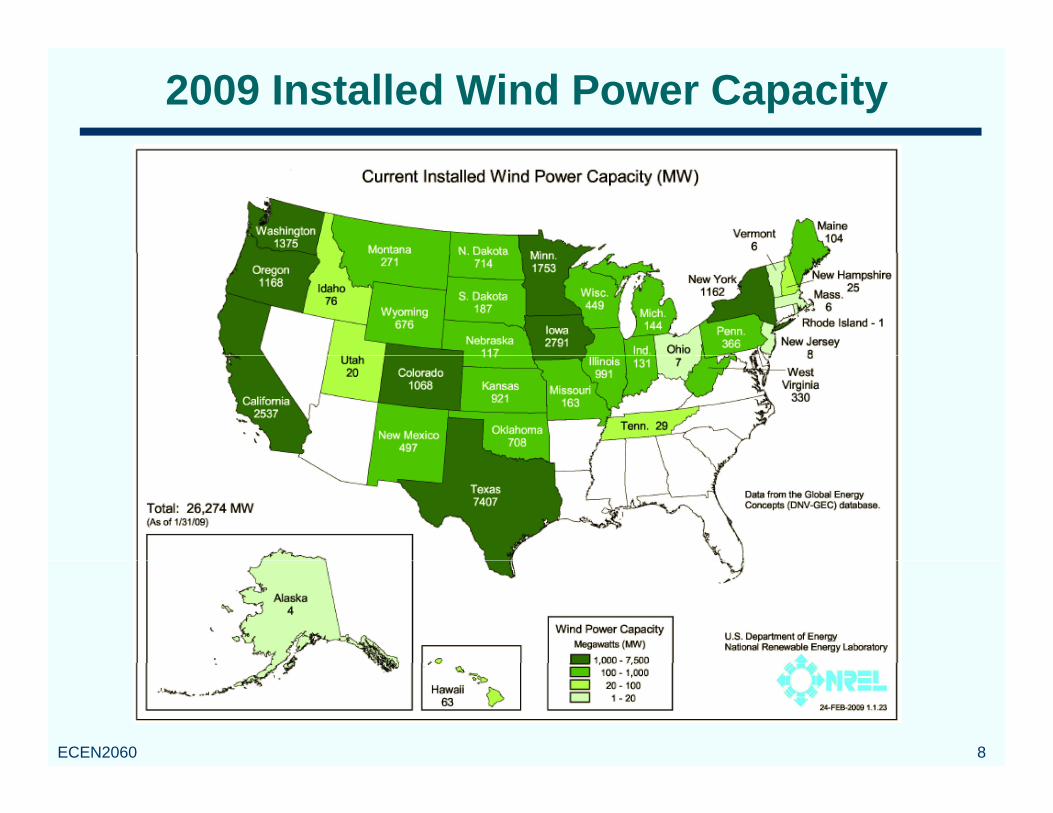
2009 Installed Wind Power Capacity
8ECEN2060

Colorado Wind Power Map
9ECEN2060

Colorado Wind Power400MW Peetz Table (267 GE turbines)
300MW Cedar Creek
Spring Canyon Rudgecrest30MW Ponnequin
Spring Canyon, Rudgecrest, Logan, and Peetz Table wind farms near Peetz
Vestas Blades manufacturing plant, Windsor, CO
10ECEN2060
162 MW Colorado Green, and Twin Buttes wind farms near Lamar

Impact on EnvironmentTextbook Section 6 12
• Zero emissions• Very modest imbedded energy
Textbook Section 6.12
• Other: birds, noise, esthetics
Wallace P. Erickson, Gregory D. Johnson, and David P. Young, “A Summary and Comparison of Bird Mortality from Anthropogenic Causes with an Emphasis on Collisions,” 2002
11ECEN2060

Trends: Wind Power TechnologyC t f R h d Ed ti i Wi d (CREW) NREL CU CSU CSMCenter for Research and Education in Wind (CREW): NREL, CU, CSU, CSM
http://crew.colorado.edu/
Objectives: improved efficiency, improved reliability, reduced cost
1. Turbine Modeling develops models for all aspects of wind turbines including: mechanical components aerod namics aeroelasticit aeroaco stics load
j p y, p y,Focus areas:
mechanical components, aerodynamics, aeroelasticity, aeroacoustics, load prediction, wind farm effects, electrical systems, grid interactions, wind inflow, and hydrodynamics for offshore wind turbines.
2 El i l S h i l d2. Electrical Systems research includes grid modeling, power converter research. Grid modeling research covers power quality, fault tolerance, islanding, andquality, fault tolerance, islanding, and stability analysis with high wind penetration. The power converter area includes advanced control of converters, modular
t f i d tili ti f i d
12ECEN2060
converters for improved utilization of wind power, and generators. Modular multi-level AC-AC converters
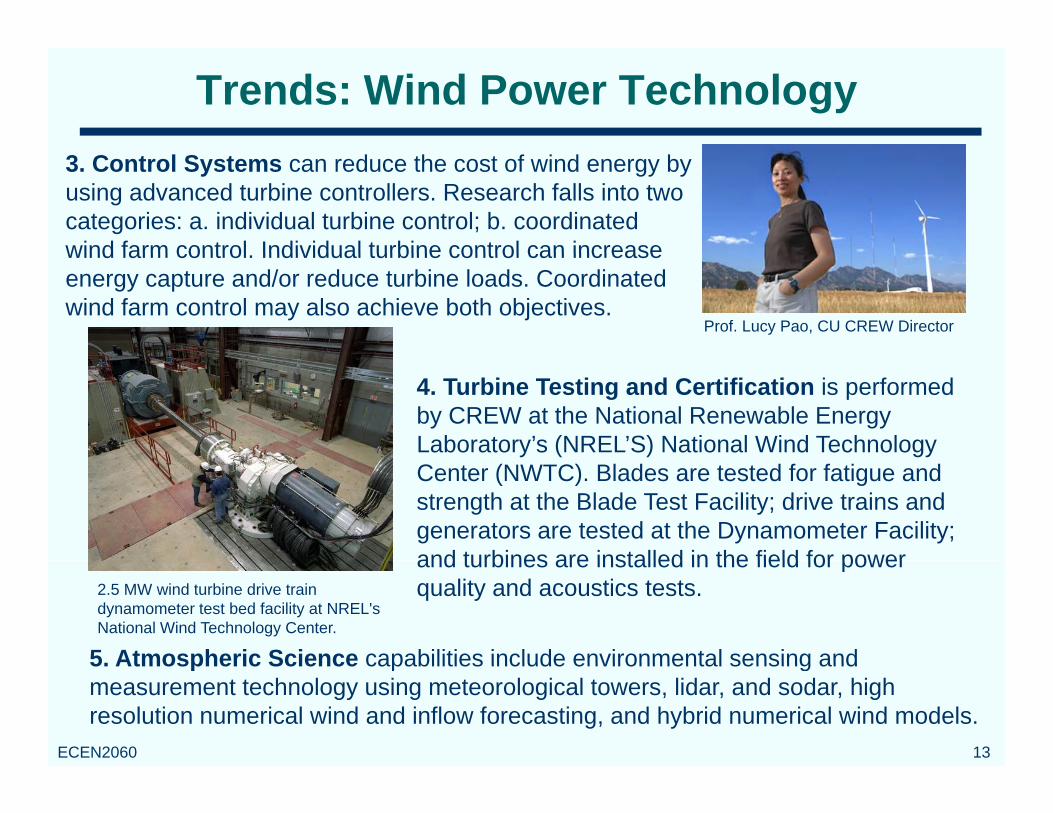
Trends: Wind Power Technology3. Control Systems can reduce the cost of wind energy by using advanced turbine controllers. Research falls into two categories: a. individual turbine control; b. coordinatedwind farm control Individual turbine control can increasewind farm control. Individual turbine control can increase energy capture and/or reduce turbine loads. Coordinated wind farm control may also achieve both objectives.
Prof. Lucy Pao, CU CREW Director
4. Turbine Testing and Certification is performed by CREW at the National Renewable Energy Laboratory’s (NREL’S) National Wind Technology Center (NWTC). Blades are tested for fatigue and strength at the Blade Test Facility; drive trains and generators are tested at the Dynamometer Facility; and turbines are installed in the field for power
5. Atmospheric Science capabilities include environmental sensing and
and turbines are installed in the field for power quality and acoustics tests.2.5 MW wind turbine drive train
dynamometer test bed facility at NREL's National Wind Technology Center.
13ECEN2060
5. Atmospheric Science capabilities include environmental sensing and measurement technology using meteorological towers, lidar, and sodar, high resolution numerical wind and inflow forecasting, and hybrid numerical wind models.
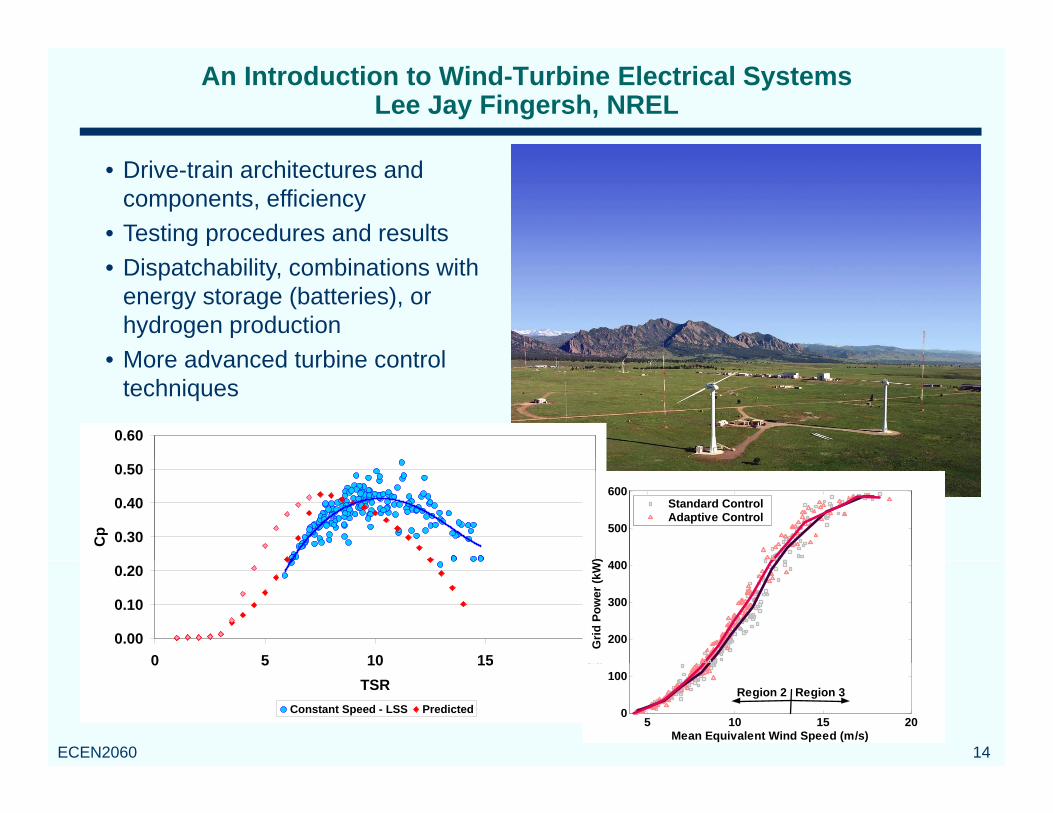
An Introduction to Wind-Turbine Electrical SystemsLee Jay Fingersh, NREL
• Drive-train architectures and components, efficiency
• Testing procedures and results• Dispatchability, combinations with
energy storage (batteries), or hydrogen productionMore advanced turbine control• More advanced turbine control techniques
0.60
0.30
0.40
0.50
Cp 500
600
)
Standard ControlAdaptive Control
0.00
0.10
0.20
0 5 10 15 20200
300
400
Grid
Pow
er (k
W)
14ECEN2060
0 5 10 15 20TSR
Constant Speed - LSS Predicted5 10 15 20
0
100
Mean Equivalent Wind Speed (m/s)
Region 3Region 2

Related technologies in early stages of development
M i d h d ki ti t h l i• Marine and hydrokinetic technologieshttp://www1.eere.energy.gov/windandhydro/hydrokinetic/ Tidal energy Wave energy
water = 1,000 kg/m3 !
Wave energy Ocean streams
• High-altitude windg
Roberts, B.W.; Shepard, D.H.; Caldeira, K.; Cannon, M.E.; Eccles, D.G.;
Sub-Tropical Jet and Polar Front Jet streams, 17-19 kW/m2 at 15,000 ft.
15ECEN2060
Grenier, A.J.; Freidin, J.F., “Harnessing High-Altitude Wind Power” IEEE Trans. On Energy Conversion, March 2007