wind resource estimation and siting of wind turbines filewind article wind resource estimation and...
TRANSCRIPT

General rights Copyright and moral rights for the publications made accessible in the public portal are retained by the authors and/or other copyright owners and it is a condition of accessing publications that users recognise and abide by the legal requirements associated with these rights.
Users may download and print one copy of any publication from the public portal for the purpose of private study or research.
You may not further distribute the material or use it for any profit-making activity or commercial gain
You may freely distribute the URL identifying the publication in the public portal If you believe that this document breaches copyright please contact us providing details, and we will remove access to the work immediately and investigate your claim.
Downloaded from orbit.dtu.dk on: Jan 06, 2020
Wind resource estimation and siting of wind turbines
Lundtang Petersen, Erik; Mortensen, N.G.; Landberg, L.
Published in:European directory of renewable energy. Suppliers and services 1994
Publication date:1994
Document VersionPublisher's PDF, also known as Version of record
Link back to DTU Orbit
Citation (APA):Lundtang Petersen, E., Mortensen, N. G., & Landberg, L. (1994). Wind resource estimation and siting of windturbines. In B. Cross (Ed.), European directory of renewable energy. Suppliers and services 1994 (pp. 181-190).London: James and James Science Publishers.

Wind
ARTICLE
Wind resource estimation and siting of wind turbines
ERIK L. PETERSEN, NIELS G. MORTENSEN AND LARS LANDBERG
Detailed knowledge of the characteristics of the natural wind is necessary for the design, planning and operational aspect of wind energy systems. Here, we shall only be concerned with those meteorological aspects of wind energy planning that are termed wind resource estimation.
The estimation of the wind resource ranges from the overall estimation of the mean energy content of the wind over a large area - called regional assessment - to the prediction of the average yearly energy production of a specific wind turbine at a specific location - called siting. A regional assessment will most often lead to a so-called wind atlas.
A precise prediction of the wind speed at a given site is essential because for aerodynamic reasons the power output of a wind turbine is proportional to the third power of the wind speed, hence even small errors in prediction of wind speed may result in large deviations in the anticipated power production and thereby lead to considerable uncertainty in the assessment of the economic benefits of installing wind power.
REGIONAL WIND RESOURCE ASSESSMENT - WIND ATLAS
The wind energy resources can vary greatly from one region to another and by more than a factor ten on the energy scale. But not only does the mean energy content in the wind vary over large distances - substantial variations can be experienced over short distances also. Therefore, reliable data and methods are a prerequisite for the determination of regional wind energy resources as well as the resources of selected locations.
The purpose of a wind atlas is therefore twofold: both to present wind data and to provide methodologies for generalizing wind data to a surrounding region for use in estimations of wind energy potential and wind turbine siting.
An example is the European Wind Atlas, where more than 200 meteorological stations in the European Union countries were selected for calculating regional wind climatologies. For each station a dataset of meteorological measurements taken over a period of 10 years was utilized in addition to an accurate description of the station and its topographical setting. The information from each station was used to calculate a wind climatology considered to be
representative for a region out to a distance of approximately lOOkm from the station. To do this it was necessary to consider and correct for the influence of local topography on the measured wind data as described below.
The result of the analysis was the Atlas of Regional Wind Climates in the form of Weibull parameter tables corresponding to 12 standard azimuth sectors, five heights between 10 and 200 metres above ground level, and four terrain types ranging from off-shore conditions to very sheltered urban areas.
Figure 1 illustrates the procedure leading to a wind atlas and also the application of a wind atlas, following a method in which the regional wind climatologies are used as input to the models to produce site-specific wind climatologies, which in turn are used for siting of wind turbines (as explained in the next section).
The map in Figure 2 is from the European Wind Atlas. It provides a means for estimating the wind energy resources at a height of 50 metres above the ground. The map depicts the geographical distribution of five wind energy classes, each class representing a range of mean wind power densities or' equivalent mean wind speeds, the range being topography-dependent.
The expected ranges of mean power density and mean wind speed are given in a table as an example for five different topographical conditions. The map does not depict the considerable variability in the mean power over short distances, especially in areas of coastal, hilly and mountainous terrain. It can be used, together with the table and knowledge of local topography, to identify reasonably large areas with a possible high wind resource. Incidentally, the number of W/m-2 at 50 metres is of the same order as the number of households a lMW wind turbine (hub height and rotor diameter 50 metres) can provide with electricity (4500kWh/year/ household): say, more than 500 households in Scotland at open plains and more than 1800 at a favourable hill.
The map in Figure 3 depicts the wind resources at the open sea at five heights. Open sea means here more than lOkm off-shore. In the coastal region it is necessary to perform calculations taking into account the orientation and the topography of the coast, for example by use of the iriting methodology described below.
I

Figure 1. A schematic presentation of the method used for the transformation of meteorological data. The left arrow illustrates the process of "cleaning" wind data for local conditions. The inverse calculation is illustrated by the righthand arrow: the "cleaned" regionally representative data are used for the calculation of wind conditions at a specific location. (Source: European Wind Atlas)
SITING
When it comes to actual calculations of the expected yearly power production from specific turbines at selected locations - siting - it is generally necessary to have much more detailed information than can be read from maps like Figure 2. Such information can be found in the
Wind
meteorological data that are being measured at airports, climatological stations, etc. But the application of measured wind-speed statistics to wind energy resource calculations is not straightforward. This is so because the wind speed measured at a meteorological station is determined mainly by two factors: the overall weather systems, which usually have an extent of several hundred kilometres, and the nearby topography out to a few tens of kilometres from the station. Strictly speaking, the direct use of measured wind speed data for wind resource calculations results in power estimates that are representative only for the actual position of the wind-measuring instruments. The application of measured wind speed statistics to wind energy resource calculations therefore requires methods for the transformation of wind speed statistics from one location and/or height to another.
SITING METHODS
During the last 10 years great effort has gone into the development of such methods, ranging from a purely statistical estimation to models based on the full set of physical equations for flows in the atmosphere. An example of a statistical method is the Measure-Correlate-Predict method where one or more short-term data series measured at a planned wind farm site are linked to a base station with a longer series of measurements by simple correlation techniques. Due to the very high cost of wind measurements, the method is mostly used in cases where a wind farm is already being planned. In order for the method to be useful, the calculated correlations need to be close to one. One drawback is that the estimated site statistics are only valid for the positions and the heights where the measurements were taken. Any realistic extrapolation away from the measuring points requires physical methods. This is so because any measurement of the wind is influenced by the surrounding topography, i.e. the effect of different surface conditions, sheltering effects due to buildings and other obstacles, and the modification of the wind imposed by variations of the height of ground around the meteorological station. Figure 1 illustrates these three main topographical features which have to be taken into consideration in any siting procedure. Further, Figure 4 illustrates the profound influence of topography on the spatial distribution of the wind resource.
At present the most widely used siting methodology is the one laid down in the European Wind Atlas and provided by the PC programme WA'P (Wind Atlas Analysis and Application Programme). The methodology follows closely Figure 1, i.e. the creation of regional climatologies by cleaning (correcting) data from topographical effects and in the siting procedure recolouring the regional statistics by introducing the topographical effects at the individual

Wind
Wind resources1 at 50 metres above ground level for five different topographic conditions Sheltered terrain2 Open plain3 At a sea coast4 Open sea5 Hills and ridges6
ms- 1 wm- 2 ms-1 wm-2 ms-1 wm- 2 ms-1 wm- 2 ms- 1 wm-2
> 6.0 > 250 > 7.5 > 500 > 8.5 > 700 > 9.0 > 800 > 11.5 > 1800 5.0-6.0 150-250 6.5-7.5 300-500 7.0-8.5 400-700 8.0-9.0 600-800 10.0-11.5 1200-1800 4.5-5.0 100-150 5.5-6.5 200-300 6.0-7.0 250-400 7.0-8.0 400-600 8.5-10.0 700-1200 3.5-4.5 50-100 4.5-5.5 100-200 5.0-6.0 150-250 5.5-7.0 200-400 . 7.0- 8.5 400- 700 < 3.5 < 50 < 4.5 < 100 < 5.0 < 150 < 5.5 < 200 < 7.0 < 400
1. The resources refer to the power present in the wind. A wind turbine can utilize between 20 and 30% of the available resource. The resources are calculated for an air density ofl.23 kgm- 3 , corresponding to standard sea level pressure and a temperature of 15°C. Air density decreases with height but up to 1000 m a.s.l. the resulting reduction of the power densities is less than 10%.
2. Urban districts, forest and farm land with many windbreaks (roughness class 3). 3. Open landscapes with few windbreaks (roughness class 1). In general, the most favourable inland sites on level land are
found here. 4. The classes pertain to a straight coastline, a uniform wind rose and a land surface with few windbreaks (roughness class
1). Resources will be higher, and closer to open sea values, if winds from the sea occur more frequently, i.e. the wind rose is not uniform and/or the land protrudes into the sea. Conversely, resources will generally be smaller, and closer to land values, if winds from land occur more frequently.
5. More than 10 km offshore (roughness class 0). 6. The classes correspond to 50% overspeeding and were calculated for a site on the summit of a single axisymmetric hill
with a height of 400 metres and a base diameter of 4 km. The overspeeding depends on the height, length and specific setting of the hill.
Figure 2. Distribution of wind resources in Europe. By means of the legend the available wind energy at a height of 50 metres can be estimated for five topographical conditions. (Source: European Wind Atlas)


Wind
Wind resources over open sea (more than 10 km offshore) for five standard heights lOm 25m 50m lOOm 2oom
ms-1 wm-2 ms-1 wm-2 ms-1 wm-2 ms-1 wm-2 ms-1 wm-2
> 8.0 > 600 > 8.5 > 700 > 9.0 > 800 > 10.0 > 1100 > 11.0 > 1500 7.0-8.0 350-600 7.5-8.5 450-700 8.0-9.0 600-800 8.5-10.0 650-1100 9.5-11.0 900-1500 6.0-7.0 250-300 6.5-7.5 300-450 7.0-8.0 400-600 7.5- 8.5 450- 650 8.0- 9.5 600- 900 4.5-6.0 100-250 5.0-6.5 150-300 5.5-7.0 200-400 6.0- 7.5 250- 450 6.5- 8.0 300- 600 < 4.5 < 100 < 5.0 < 150 < 5.5 < 200 < 6.0 < 250 < 6.5 < 300
Figure 3. Distribution of wind resources in Europe over open sea. (Source: European Wind Energy Confer-ence, Travemiinde, 1993) ·
sites. WA"P was used for the production of the European Wind Atlas and has been used for producing wind atlases in Algeria, Jordan, Western Australia, Switzerland, Sweden and Finland. It is presently used for siting in more than 50 countries.
FLOW MODELLING
A particular challenge has been the development of flow models suitable for predicting mean flow characteristics for hills, ridges and similar topo-
graphical features. As the wind speed accelerates over hills and might double the magnitude, summits are very attractive sites. Currently three different types of physical models are in use: mass-consistent models which build on the conservation-of-mass principle, models based on linearized versions of the full set of equations, and models based on the full set of equations. The three groups of models all have their advantages and disadvantages. The mass-consistent models are very simple to use and require only very simple computational resources. One
Wind
0 )
0
"'" ,......, .. E 0
~ 0 "1
'-'
>.. .,_. ·a;
0 c:: 0 Cl) N "'O
>.. Ol .._ Cl) c:: 0
Island LU 0
Sea Land
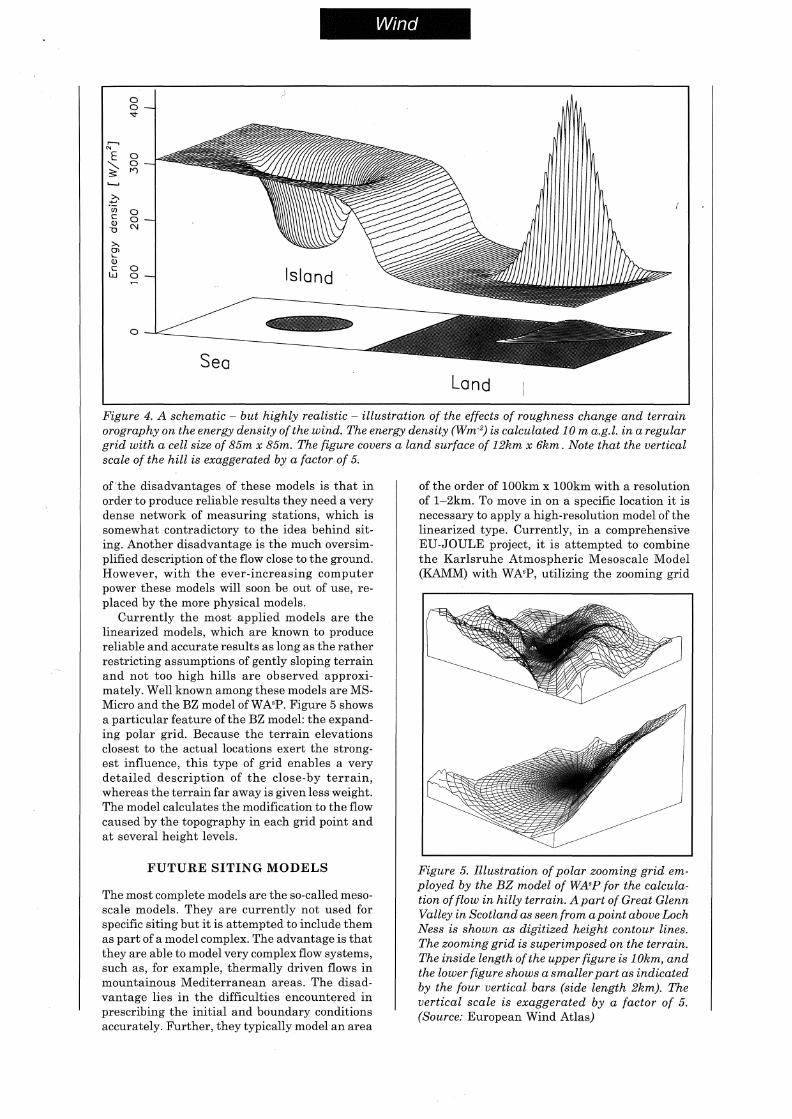
Figure 4. A schematic - but highly realistic - illustration of the effects of roughness change and terrain orography on the energy density of the wind. The energy density (Wm-2) is calculated 10 m a.g.l. in a regular grid with a cell size of 85m x 85m. The figure covers a land surface of 12km x 6km. Note that the vertical scale of the hill is exaggerated by a factor of 5.
of 'the disadvantages of these models is that in order to produce reliable results they need a very dense network of measuring stations, which is somewhat contradictory to the idea behind siting. Another disadvantage is the much oversimplified description of the flow close to the ground. However, with the ever-increasing computer power these models will soon be out of use, replaced by the more physical models.
Currently the most applied models are the linearized models, which are known to produce reliable and accurate results as long as the rather restricting assumptions of gently sloping terrain and not too high hills are observed approximately. Well known among these models are MSMicro and the BZ model ofWA'P. Figure 5 shows a particular feature of the BZ model: the expanding polar grid. Because the terrain elevations closest to the actual locations exert the strongest influence, this type of grid enables a very detailed description of the close-by terrain, whereas the terrain far away is given less weight. The model calculates the modification to the flow caused by the topography in each grid point and at several height levels.
FUTURE SITING MODELS
The most complete models are the so-called mesoscale models. They are currently not used for specific siting but it is attempted to include them as part of a model complex. The advantage is that they are able to model very complex flow systems, such as, for example, thermally driven flows in mountainous Mediterranean areas. The disadvantage lies in the difficulties encountered in prescribing the initial and boundary conditions accurately. Further, they typically model an area
of the order of lOOkm x lOOkm with a resolution of 1-2km. To move in on a specific location it is necessary to apply a high-resolution model of the linearized type. Currently, in a comprehensive EU-JOULE project, it is attempted to combine the Karlsruhe Atmospheric Mesoscale Model (KAMM) with WA'P, utilizing the zooming grid
Figure 5. Illustration of polar zooming grid employed by the BZ model of WA•P for the calculation of flow in hilly terrain. A part of Great Glenn Valley in Scotland as seen from a point above Loch Ness is shown as digitized height contour lines. The zooming grid is superimposed on the terrain. The inside length of the upper figure is 1 Okm, and the lower figure shows a smaller part as indicated by the four vertical bars (side length 2km). The vertical scale is exaggerated by a factor of 5. (Source: European Wind Atlas)

feature of the BZ model. The siting skill of the KAMM-WA•P model combinationris presently being tested against a massive climatological measuring programme, which is part of the EU project, in mountainous areas in Portugal, Italy, Greece, Ireland and Germany.
STATE OF THE ART
The question "What is the state of the art in wind resource assessment?" can also be formulated quite simply: "What is the uncertainty in the power production estimate for a given wind turbine at a given location?" From many years of experience we can quite bluntly state that the expectation of many wind farm developers and their investors for an uncertainty better than 10% is quite often more than unrealistic. First of all, the uncertainty on the power curves of wind turbines from the same production line is most likely larger than 5%. Secondly, only very carefully calibrated and continuously maintained wind-measuring devices, e.g. anemometers, can measure the wind speed with an error of less than 5% (corresponding to an error of approximately 15% in the mean power production!) Then the models for horizontal and vertical extrapolation will for mean wind conditions at a flat plain give errors of the order: shelter 5% and roughness 5%. The largest expected errors are related to the calculation of flow in complex orography. Empirically, the BZ model and other similar models are found to work well for the prediction of flows over not too steep hills and ridges. The model-induced typical error is of the order of 10% in estimates of relative increase of wind speed on top of a hill that has horizontal dimensions of less than 1-2km and slopes less than 30%. For steeper hills and ridges the error can become much larger.
Larger-scale orographic features render the BZ model and other linearized models increasingly deficient because of the importance of physical effects not present in these models. However, these effects are well modelled by the KAMM model and our hope is that the combined KAMMWA•P model will be able to predict mean wind speeds in an area as complicated as northern Portugal with an average error less than ±15%.
It should be noted that in spite of these investor-terrifying errors the ability of the models to locate the optimum sites in a given area is almost always very good.
THE FUTURE
A vision of a future siting is a wind farm developer walking in the terrain - perhaps in virtual reality on a computer - and searching for the optimal sites. In his hand he is holding a small computer which obtains his position from a satellite and communicates this via satellite to the World Data Bank System, a system that connects all major international database centres and, among those, those whi:Ch contain all regional
Wind
wind climatologies, detailed terrain heights and updated land use information. This, together with the very efficient and highly accurate application programmes - e.g. the successors of WA"P and KAMM - also available at the centres, allows a fast calculation of the wind resource at the position of our developer. This is transmitted back to him and, as he changes position, hp can follow the change in the wind potential on the screen or rather the average yearly production from a wind turbine specified by him. Back at his drawing table the developer can then extract all other necessary information from the System, such as land use restrictions, power lines, domestic planning, price of land, etc., and finally design the optimal wind farm under the given conditions.
How far are we from this vision? Around the year 2000 we will probably get close; at the present moment some of the cornerstones are being placed. To mention a few, but important, ones:
the reanalysis project at the European Centre of Medium Weather forecast, providing a homogeneous dataset of the last 15 years of global atmospheric observations
• the CORINE Land Cover Project (EU), providing high-resolution land cover data for a number of countries
• releases of presently militarily restricted topographical information - especially height information the development of Geographical Information Systems
• finally, the combined Karlsruhe Atmospheric Mesoscale Model and Wind Atlas Analysis and Application Model.
Erik Lundtang Petersen, Niels Gylling Mortensen and Lars Landberg work in the
Department of Meteorology and Wind Energy, Risrli National Laboratory, Denmark
ACKNOWLEDGEMENTS
The work by Rise National Laboratory on wind energy resources has - since 1981 - been supported by the Commission of the European Communities Directorate-General for Science, Research and Development.
REFERENCES AND FURTHER READING
Troen I, Petersen EL (1989).European Wind Atlas. Ris0 National Laboratory, Roskilde, Denmark.
Walmsley JL,Troen I, Lalas DP, Mason PJ (1990). Surface-layer flow in complex terrain: comparison of models and full-scale observations. Boundary-Layer Meteorology 52, 259-281.
Adrian G, Fiedler F (1990). Simulation ofunstationary wind and temperature fields over complex terrain and comparison with observations. Beitr. Phys. Atmosph. 64,27-48.
Sections on wind resources in proceedings of: European Wind Energy Conferences (EWEC), European Community Wind Energy Conferences (ECWEC), British Wind Energy Association (BWEA).