wind & solar energy - windlogics€¦ · wind & solar energy forecasting ... to wind and...
TRANSCRIPT

•
MARK AHLSTROM, CEO, WINDLOGICS INC.
WIND & SOLAR ENERGYFORECASTING & INTEGRATING VARIABLE GENERATION
TWIN CITIES METRO NOVEMBER 22, 2013
WindLogics Background
Founded in 1989 Assessment, forecasting & integration of renewable energy
• 65 people • 50% Meteorology • 25% Math, Statistics, CompSci
Became a NextEra Energy company in 2006 !
Forecasting & optimization solutions that enable low cost, reliable & sustainable power systems
Copyright © 2013, WindLogics Inc.
Copyright © 2013, WindLogics Inc.
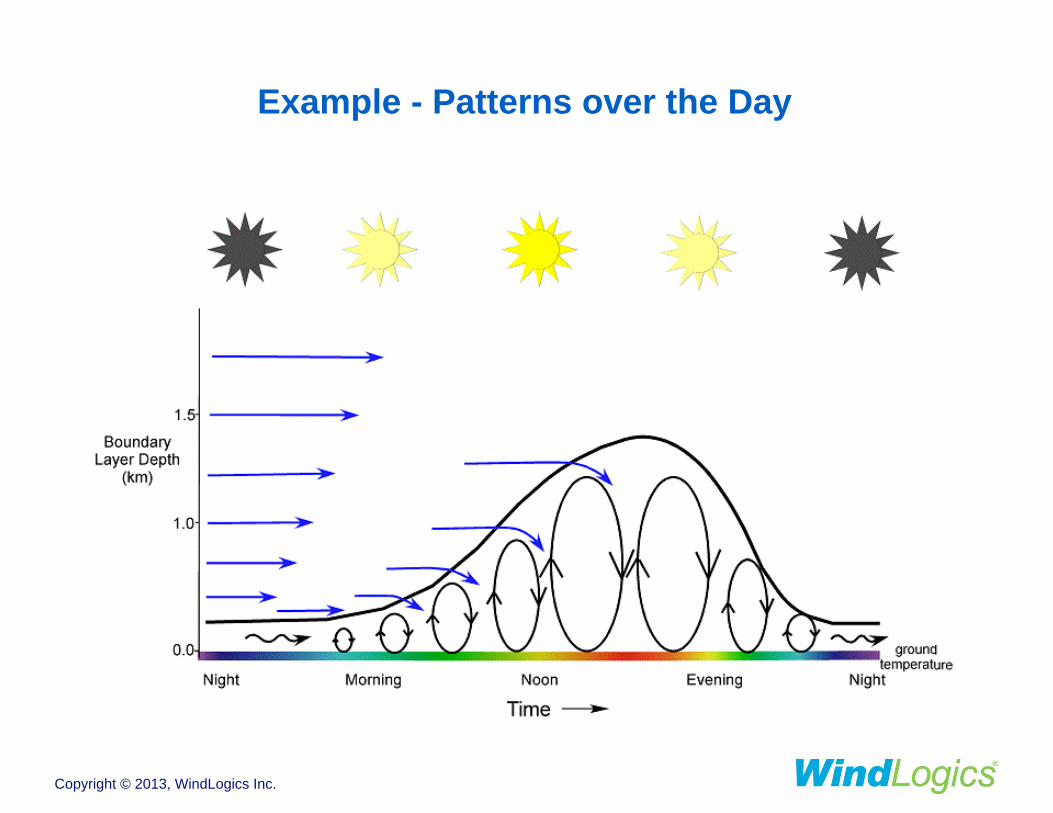
Example - Patterns over the Day
Copyright © 2013, WindLogics Inc.
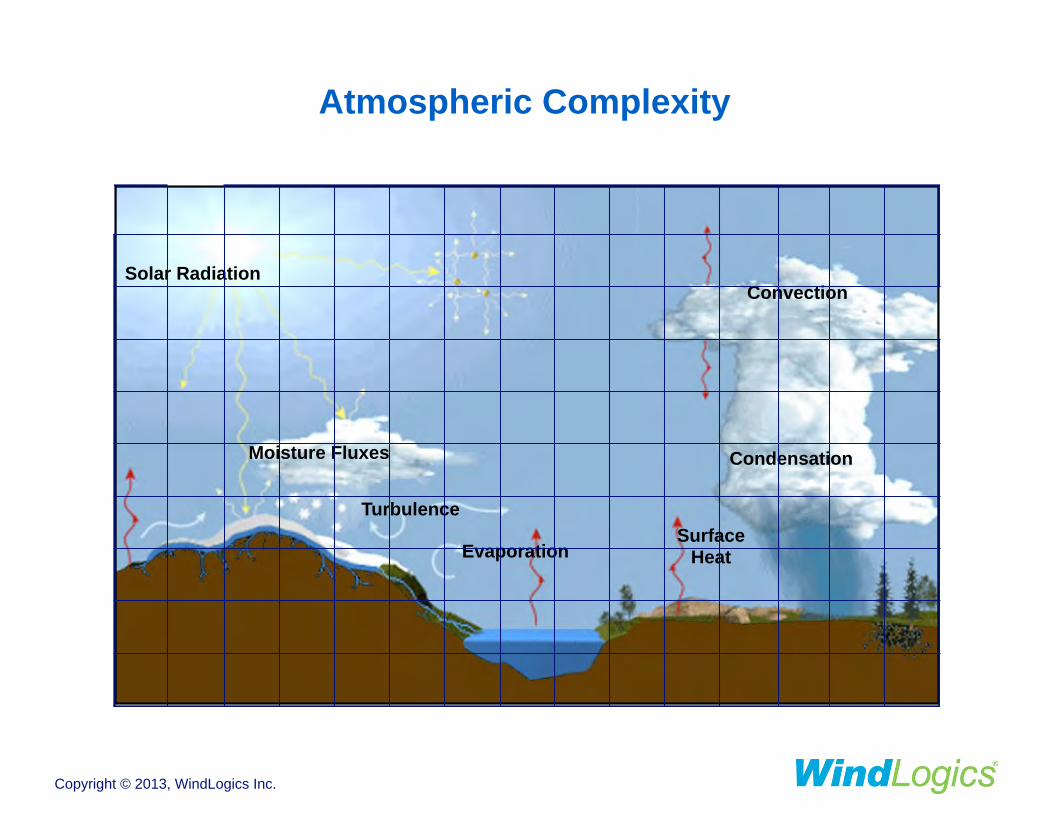
Solar Radiation
Moisture Fluxes
Turbulence
Evaporation
Convection
Condensation
Surface Heat
Atmospheric Complexity
Copyright © 2013, WindLogics Inc.
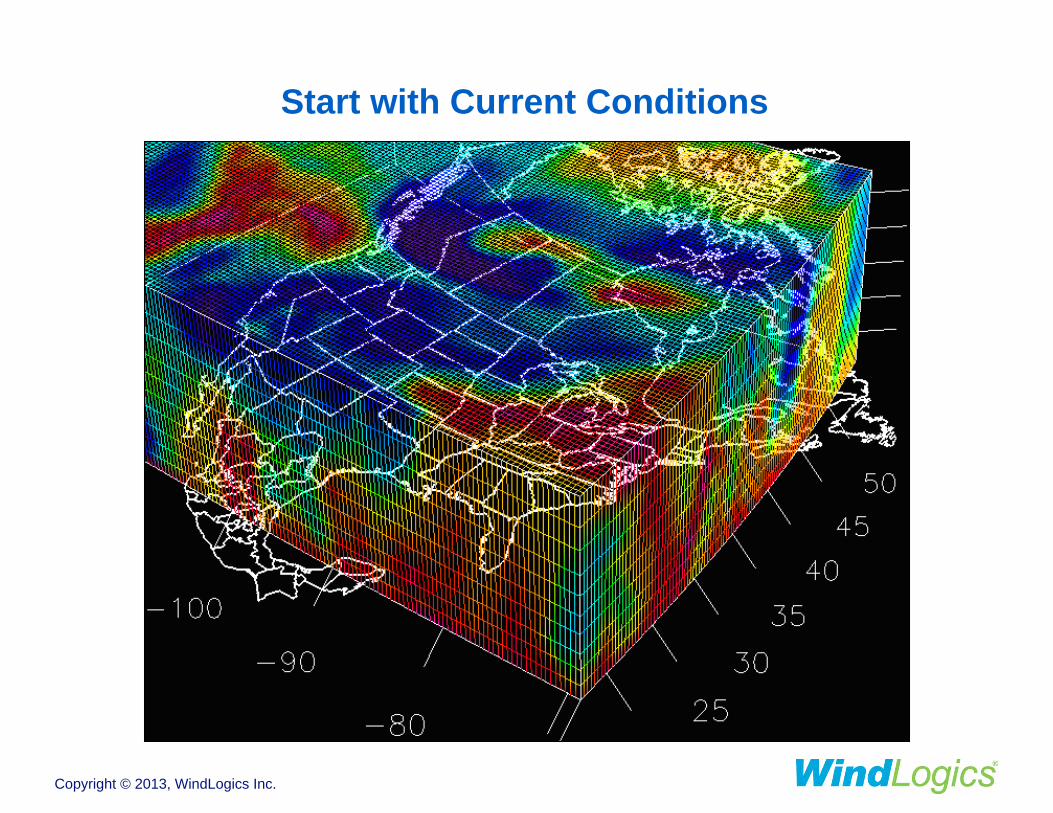
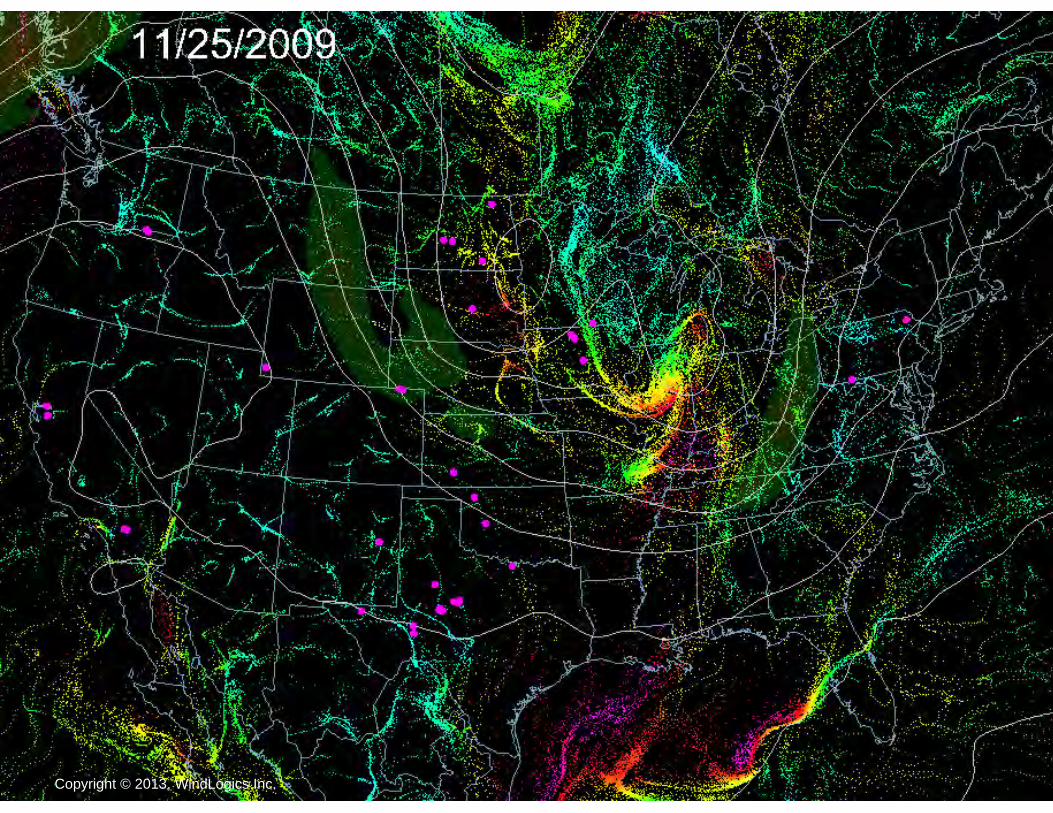
Start with Current Conditions
Copyright © 2013, WindLogics Inc.
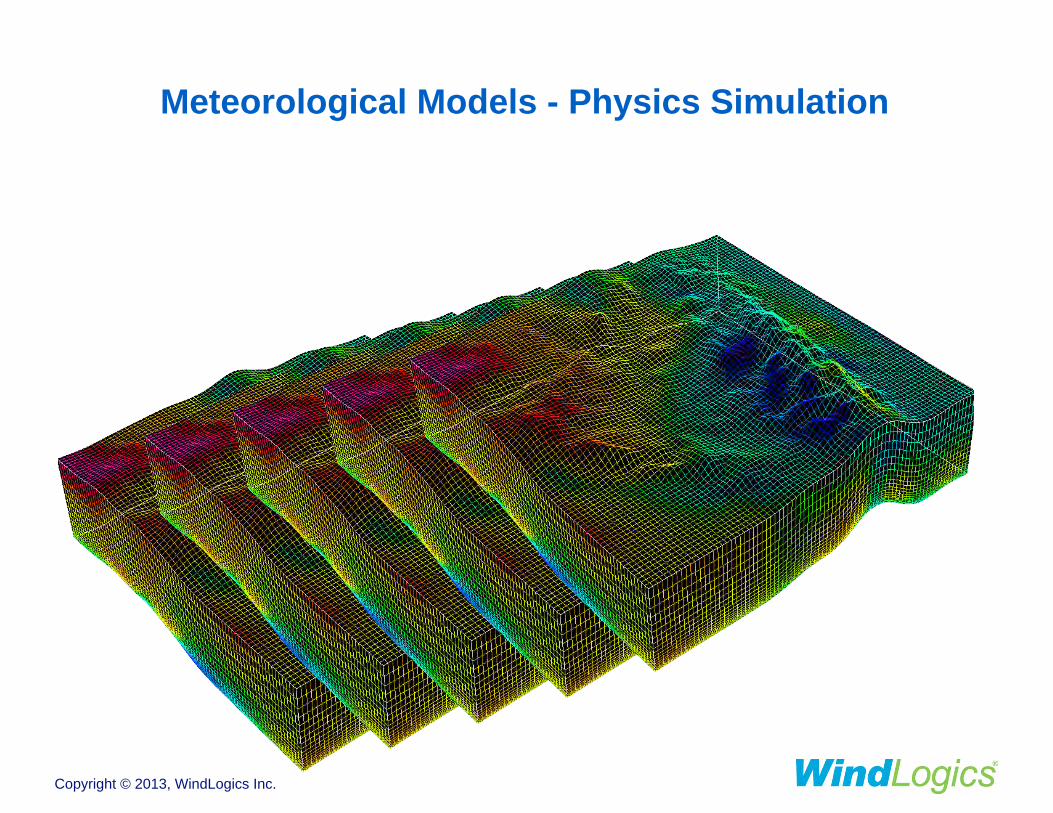
Meteorological Models - Physics Simulation
Copyright © 2013, WindLogics Inc.
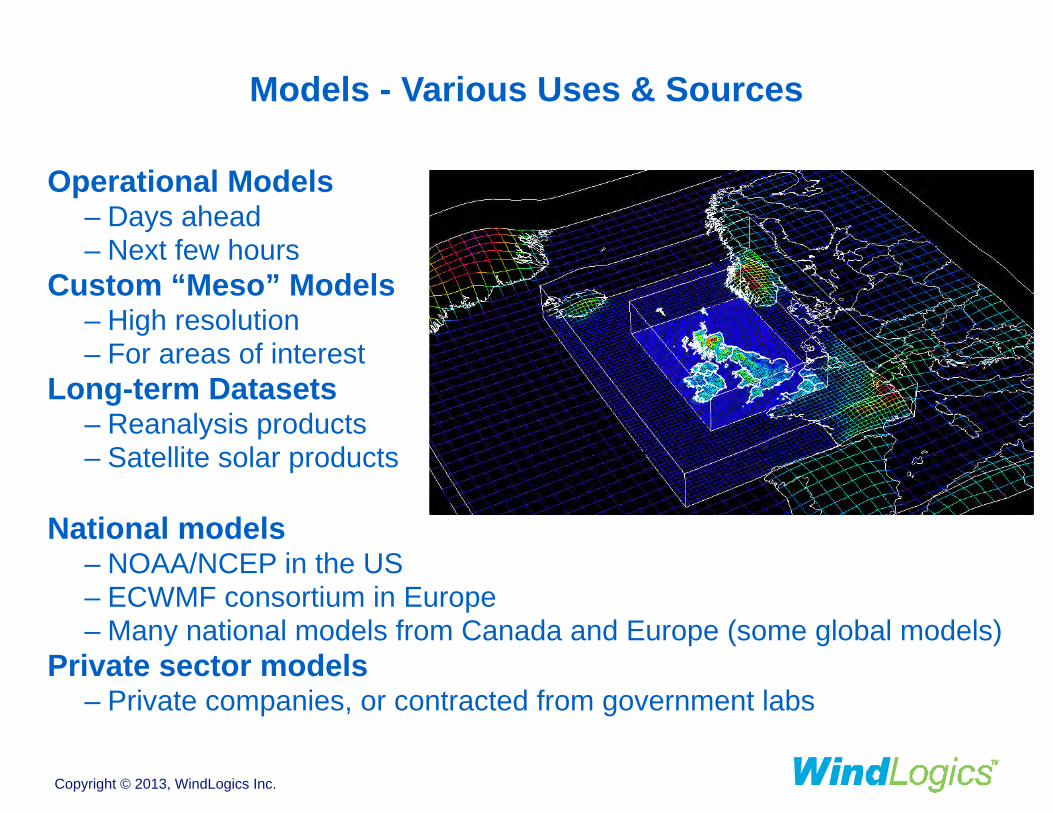
Models - Various Uses & Sources
Operational Models – Days ahead – Next few hours
Custom “Meso” Models – High resolution – For areas of interest
Long-term Datasets – Reanalysis products – Satellite solar products !
National models – NOAA/NCEP in the US – ECWMF consortium in Europe – Many national models from Canada and Europe (some global models)
Private sector models – Private companies, or contracted from government labs
Copyright © 2013, WindLogics Inc.
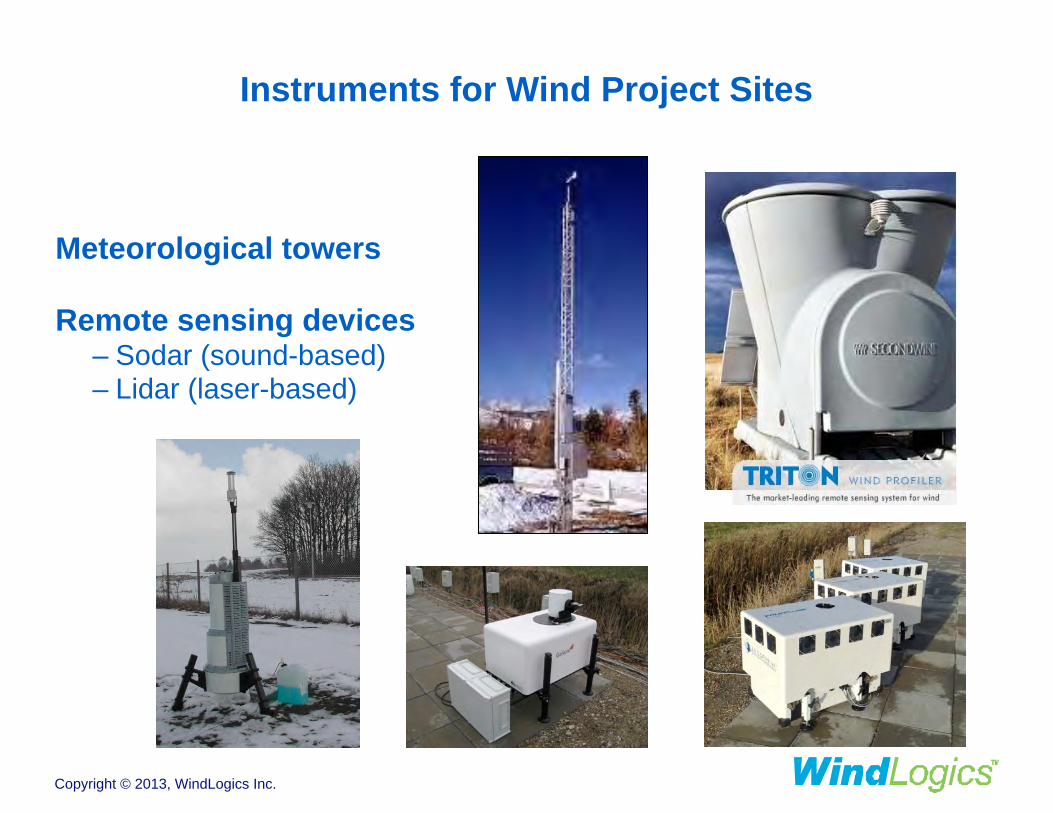
Instruments for Wind Project Sites
Meteorological towers !
Remote sensing devices – Sodar (sound-based) – Lidar (laser-based)
Copyright © 2013, WindLogics Inc.
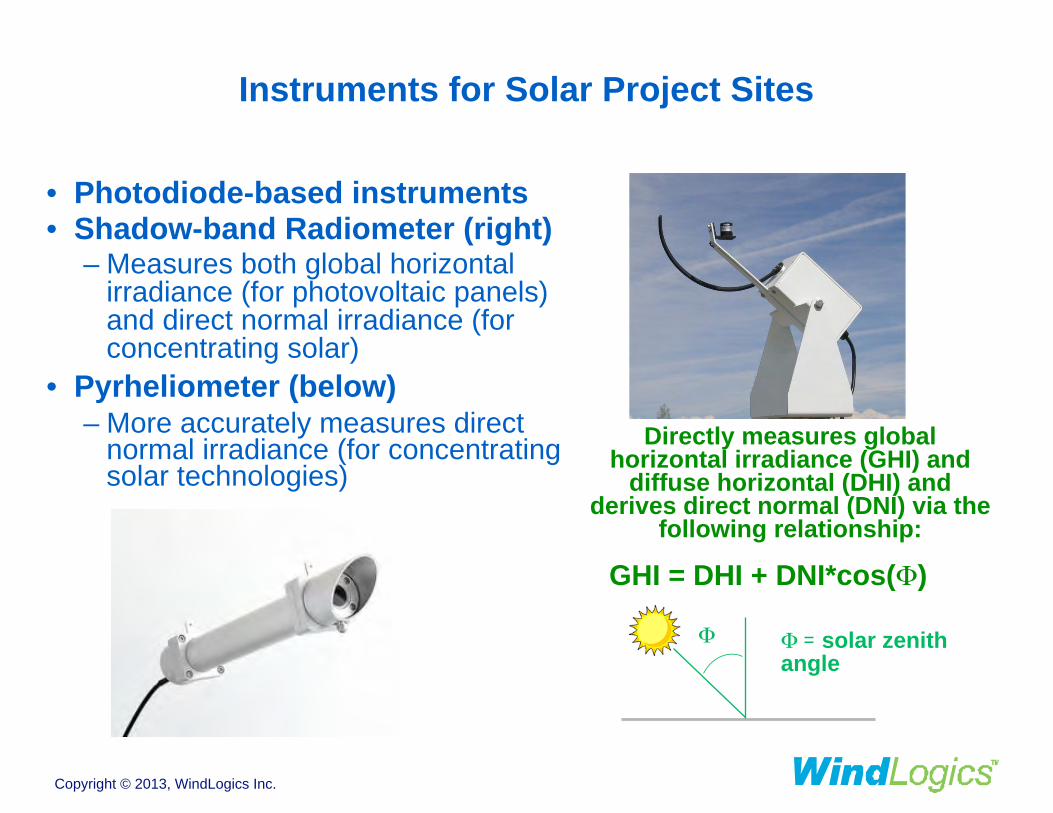
Instruments for Solar Project Sites
GHI = DHI + DNI*cos(Φ)
Φ Φ = solar zenith angle
Directly measures global horizontal irradiance (GHI) and
diffuse horizontal (DHI) and derives direct normal (DNI) via the
following relationship:
• Photodiode-based instruments • Shadow-band Radiometer (right)
– Measures both global horizontal irradiance (for photovoltaic panels) and direct normal irradiance (for concentrating solar)
• Pyrheliometer (below) – More accurately measures direct
normal irradiance (for concentrating solar technologies)
Copyright © 2013, WindLogics Inc.
Climate
Weather versus Climate
Climate is what you expect –Long-term normals –Smoothed, averaged value of what is normal for a location at this
time of year !
Weather is what you get –The normal variability of weather is high, and the “noise” can
overwhelm the climate signals in the short term !
Copyright © 2013, WindLogics Inc.
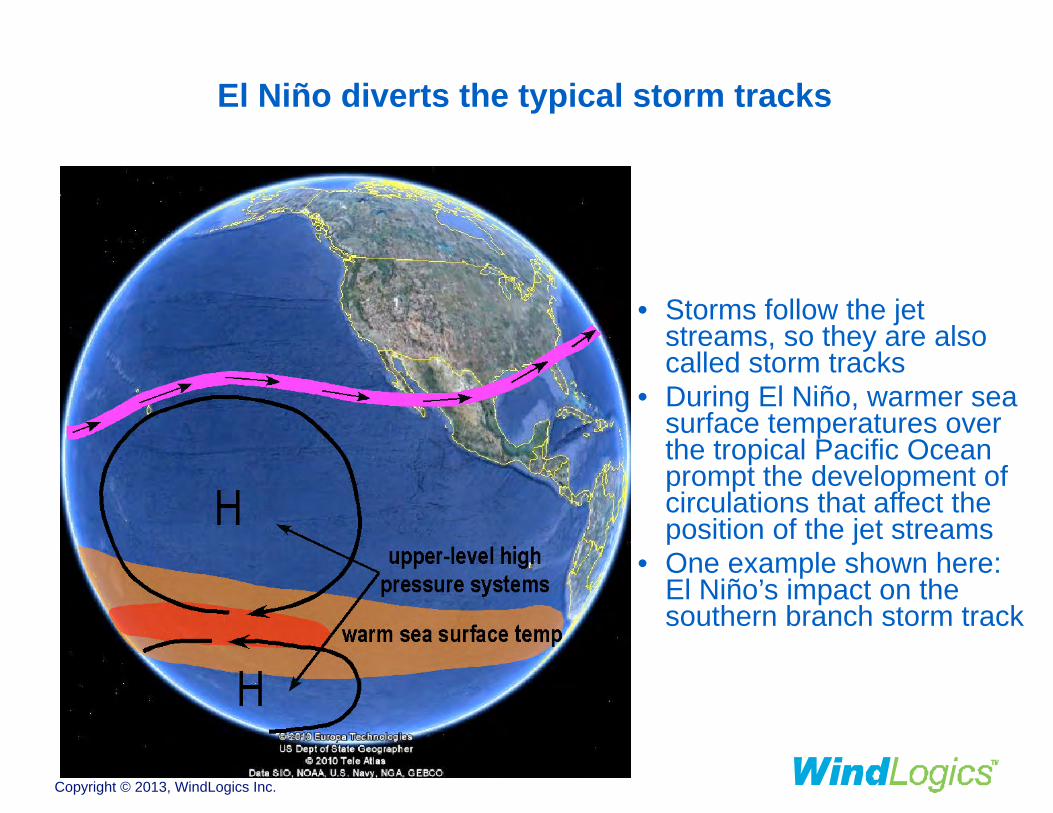
• Storms follow the jet streams, so they are also called storm tracks
• During El Niño, warmer sea surface temperatures over the tropical Pacific Ocean prompt the development of circulations that affect the position of the jet streams
• One example shown here: El Niño’s impact on the southern branch storm track
El Niño diverts the typical storm tracks
Copyright © 2013, WindLogics Inc.
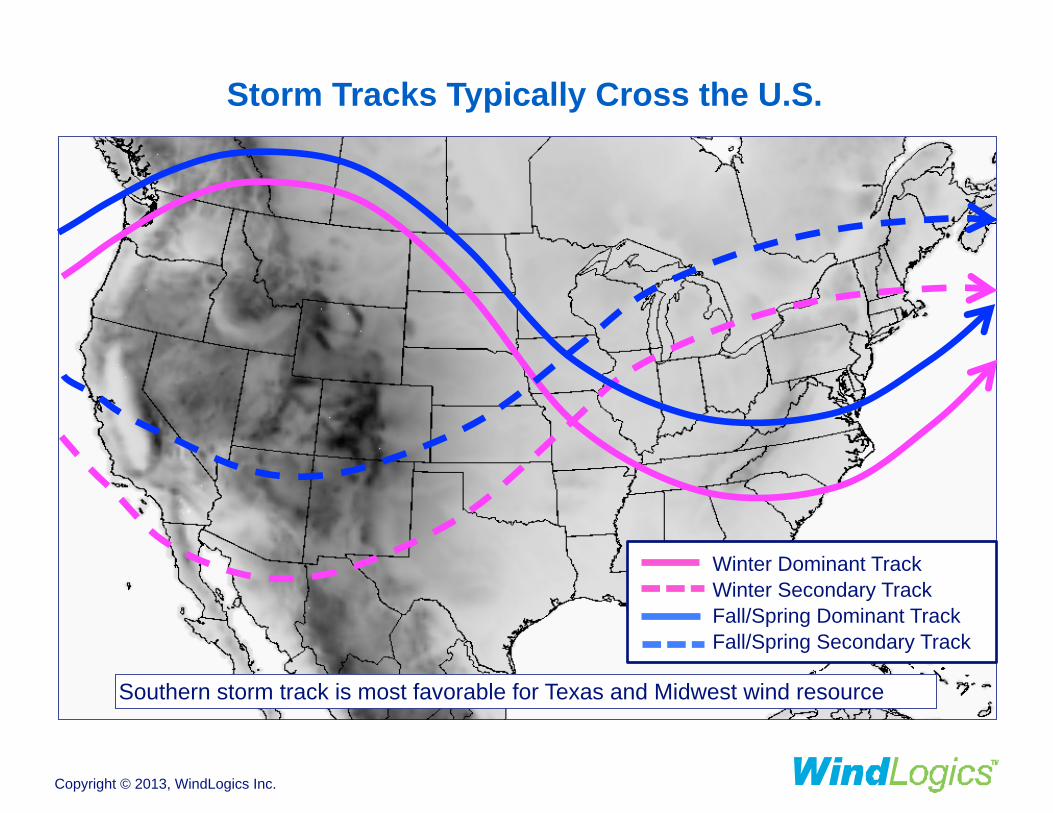
Southern storm track is most favorable for Texas and Midwest wind resource
Fall/springWinter Dominant Track Winter Secondary Track Fall/Spring Dominant Track Fall/Spring Secondary Track
Storm Tracks Typically Cross the U.S.
Copyright © 2013, WindLogics Inc.
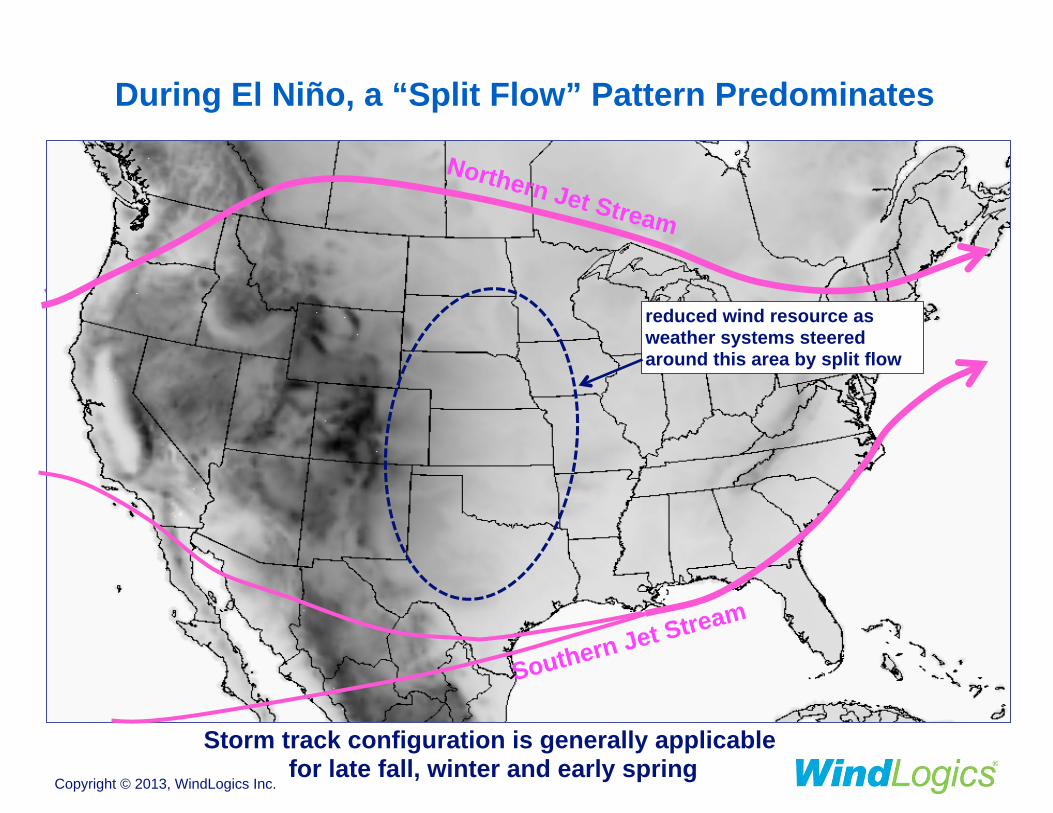
Jet Stream
Jet Stream
Typical Fall Storm TracksNorthern Jet Stream
Southern Jet Stream
reduced wind resource as weather systems steered around this area by split flow
Storm track configuration is generally applicable for late fall, winter and early spring
During El Niño, a “Split Flow” Pattern Predominates
Copyright © 2013, WindLogics Inc.
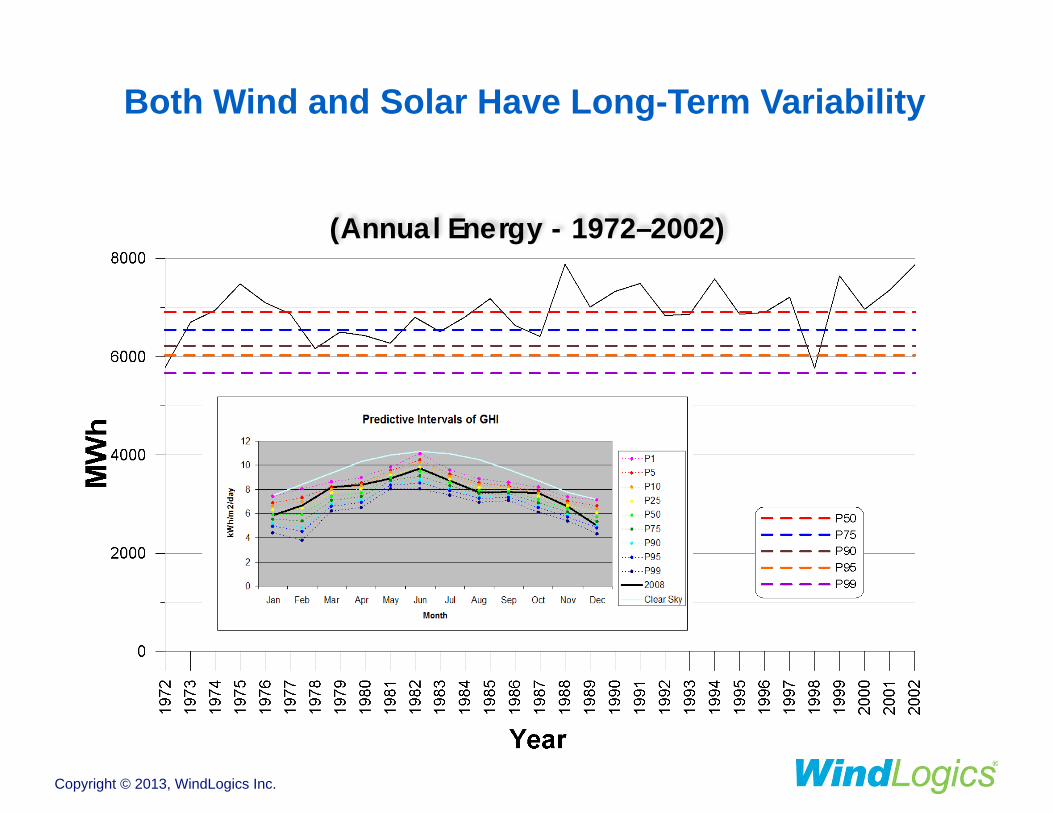
Both Wind and Solar Have Long-Term Variability
(Annual Energy - 1972–2002)
Copyright © 2013, WindLogics Inc.
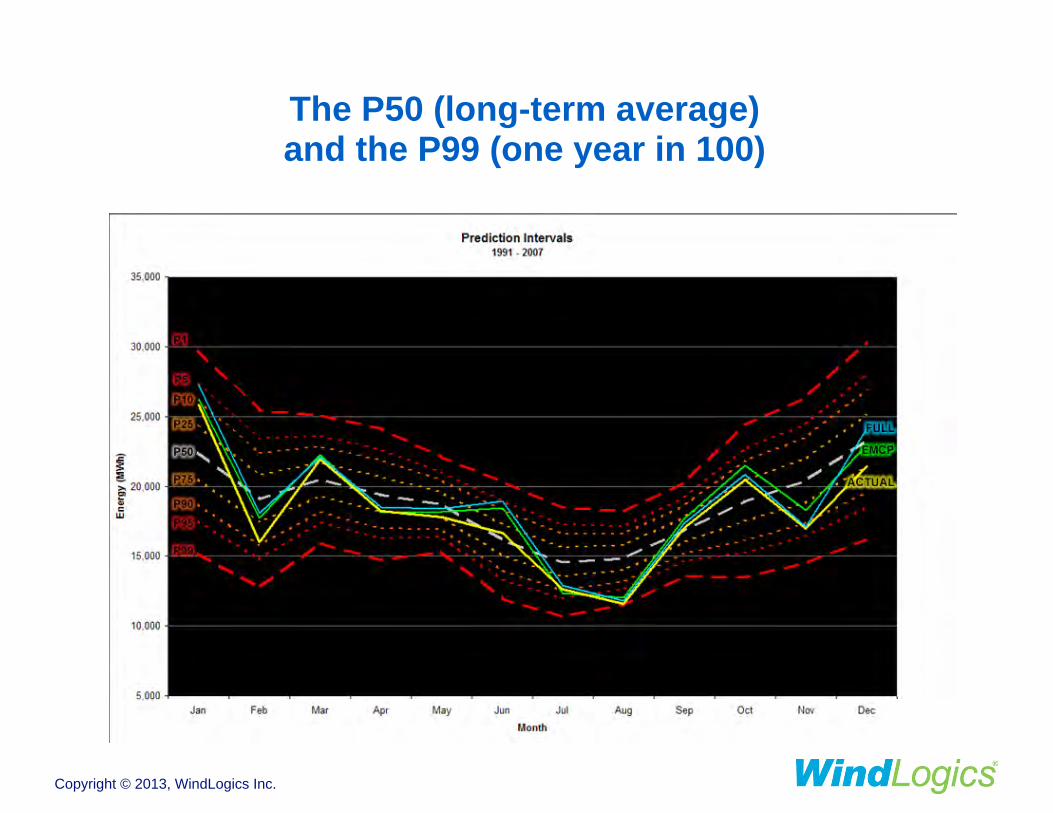
The P50 (long-term average) and the P99 (one year in 100)
Copyright © 2013, WindLogics Inc.

Variable Generation - Wind and Solar
The Challenge of Variable Generation
All power plants and fuel supplies have operational characteristics and integration issues
!Variability and uncertainty are intrinsic to weather, and therefore to wind and solar energy –Understand weather-driven
variability and risk –Understand impacts on the power
system and power markets –Engineer systems to operate and
optimize the new system
Copyright © 2013, WindLogics Inc.
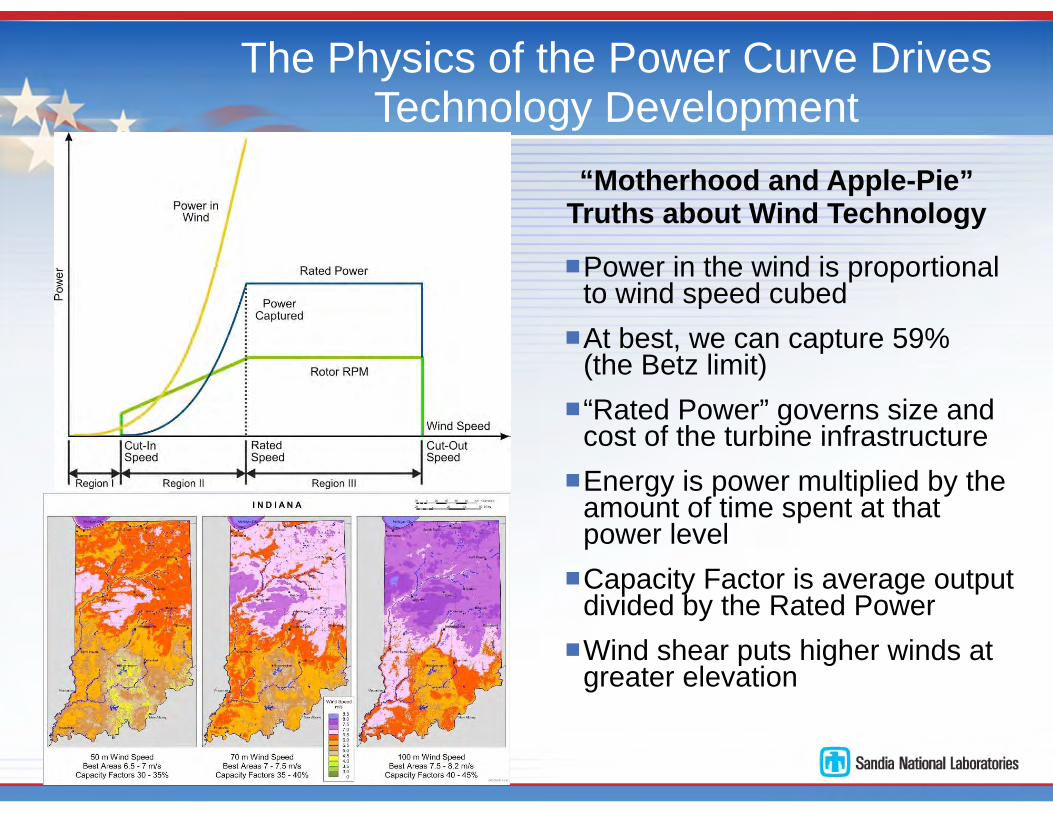
The Physics of the Power Curve Drives Technology Development
nPower in the wind is proportional to wind speed cubed
nAt best, we can capture 59% (the Betz limit)
n“Rated Power” governs size and cost of the turbine infrastructure
nEnergy is power multiplied by the amount of time spent at that power level
nCapacity Factor is average output divided by the Rated Power
nWind shear puts higher winds at greater elevation
“Motherhood and Apple-Pie” Truths about Wind Technology
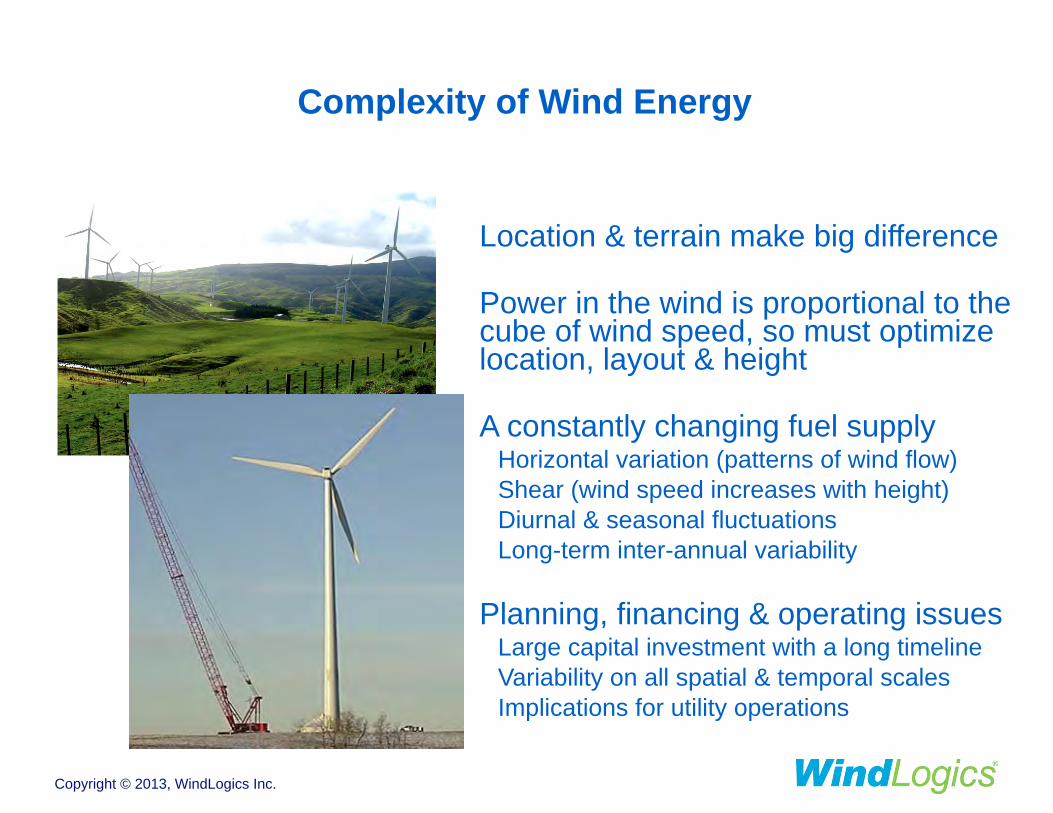
Location & terrain make big difference !
Power in the wind is proportional to the cube of wind speed, so must optimize location, layout & height
!A constantly changing fuel supply
Horizontal variation (patterns of wind flow) Shear (wind speed increases with height) Diurnal & seasonal fluctuations Long-term inter-annual variability
!Planning, financing & operating issues
Large capital investment with a long timeline Variability on all spatial & temporal scales Implications for utility operations
Complexity of Wind Energy
Copyright © 2013, WindLogics Inc.
Traditional Method: Measure-Correlate-Predict (MCP)
Measure on-site data –Usually done with a 60 meter meteorological tower (met tower) –Typically requires at least a year of data !
Correlate to another longer-term measurement –Extend on-site data by correlating to another source –An airport or other weather station is usually used !
Predict long-term project energy output –Predict long-term values from relatively short-term measurements –Predict hub height wind speeds from lower measurements
Copyright © 2013, WindLogics Inc.
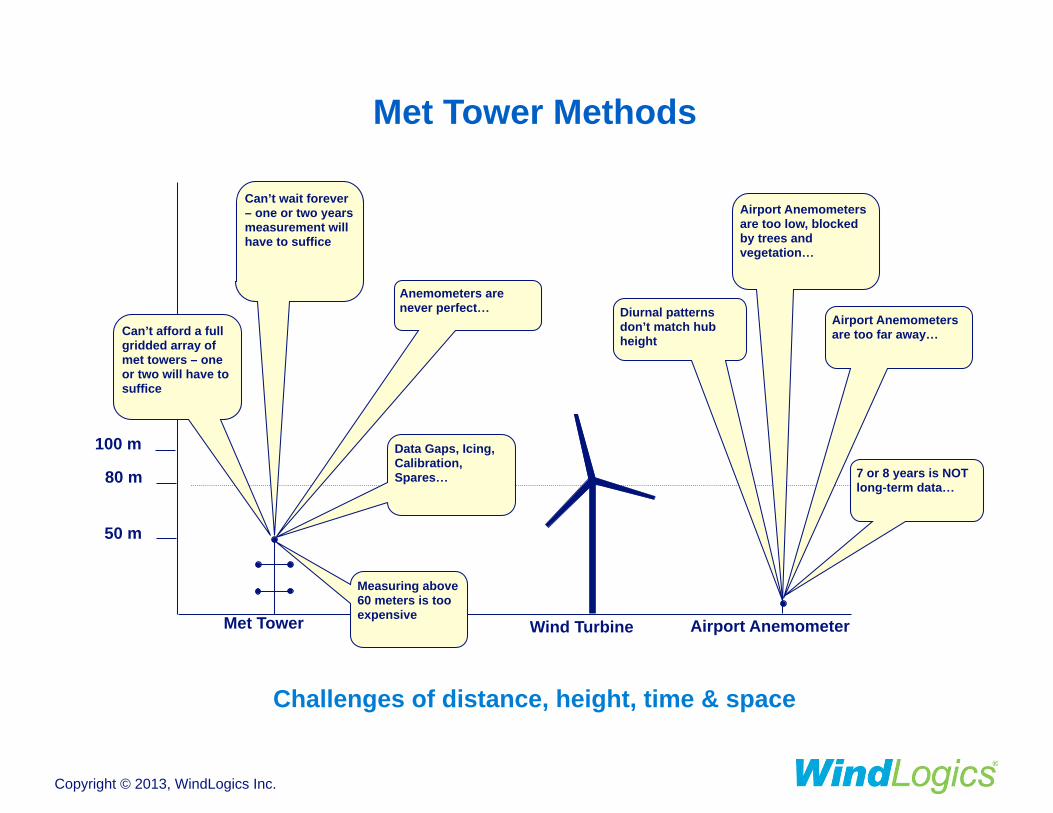
50 m
80 m
100 m
Met Tower Wind Turbine Airport Anemometer
Can’t afford a full gridded array of met towers – one or two will have to suffice
Measuring above 60 meters is too expensive
Can’t wait forever – one or two years measurement will have to suffice
Anemometers are never perfect…
Data Gaps, Icing, Calibration, Spares…
Challenges of distance, height, time & space
Airport Anemometers are too low, blocked by trees and vegetation…
Airport Anemometers are too far away…
7 or 8 years is NOT long-term data…
Diurnal patterns don’t match hub height
Met Tower Methods
Copyright © 2013, WindLogics Inc.
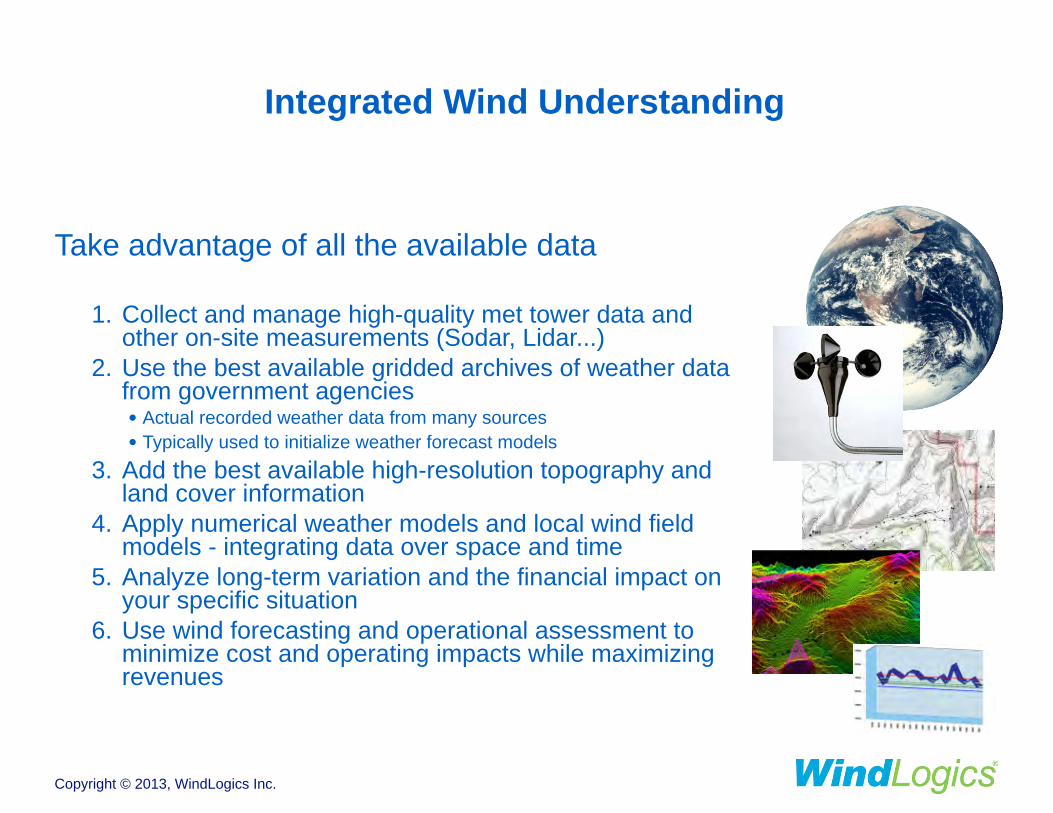
Integrated Wind Understanding
Take advantage of all the available data !
1. Collect and manage high-quality met tower data and other on-site measurements (Sodar, Lidar...)
2. Use the best available gridded archives of weather data from government agencies • Actual recorded weather data from many sources • Typically used to initialize weather forecast models
3. Add the best available high-resolution topography and land cover information
4. Apply numerical weather models and local wind field models - integrating data over space and time
5. Analyze long-term variation and the financial impact on your specific situation
6. Use wind forecasting and operational assessment to minimize cost and operating impacts while maximizing revenues
Copyright © 2013, WindLogics Inc.
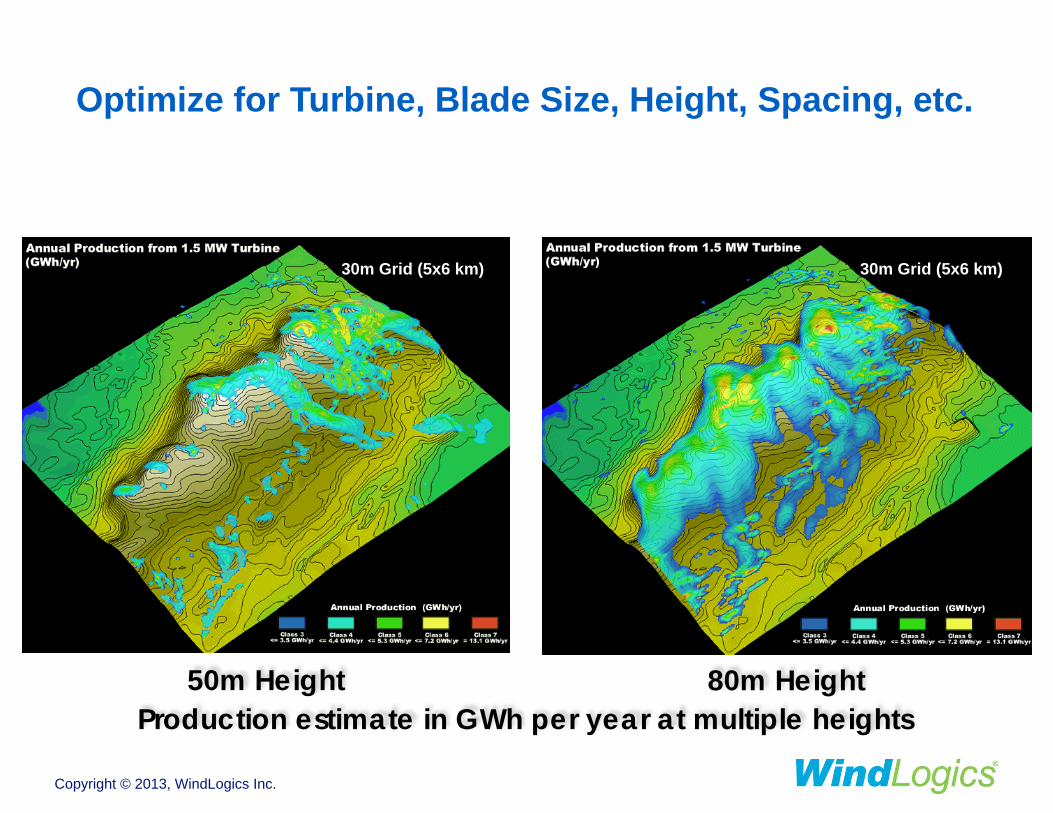
Production estimate in GWh per year at multiple heights80m Height
30m Grid (5x6 km)
50m Height
30m Grid (5x6 km)
Optimize for Turbine, Blade Size, Height, Spacing, etc.
Copyright © 2013, WindLogics Inc.
Gross Capacity Factor (GCF) is based on wind resource and a “theoretical” turbine
!Losses reflect deductions in energy production in a real world wind power plant
– Wake and array losses 3-7% typical, depends on density and size – Turbine availability 3% typical, negotiable in turbine agreement – Turbine power curve 2% typical, negotiable in turbine agreement – Electrical losses 2-3% typical, based on design & current levels – Icing, bugs, dirt, etc. 1-2% typical, site & turbine dependent
!Net Capacity Factor (NCF) is the estimate of actual energy production that should be available at the meter
Gross Capacity Factor (GCF) & Net Capacity Factor (NCF)
Copyright © 2013, WindLogics Inc.
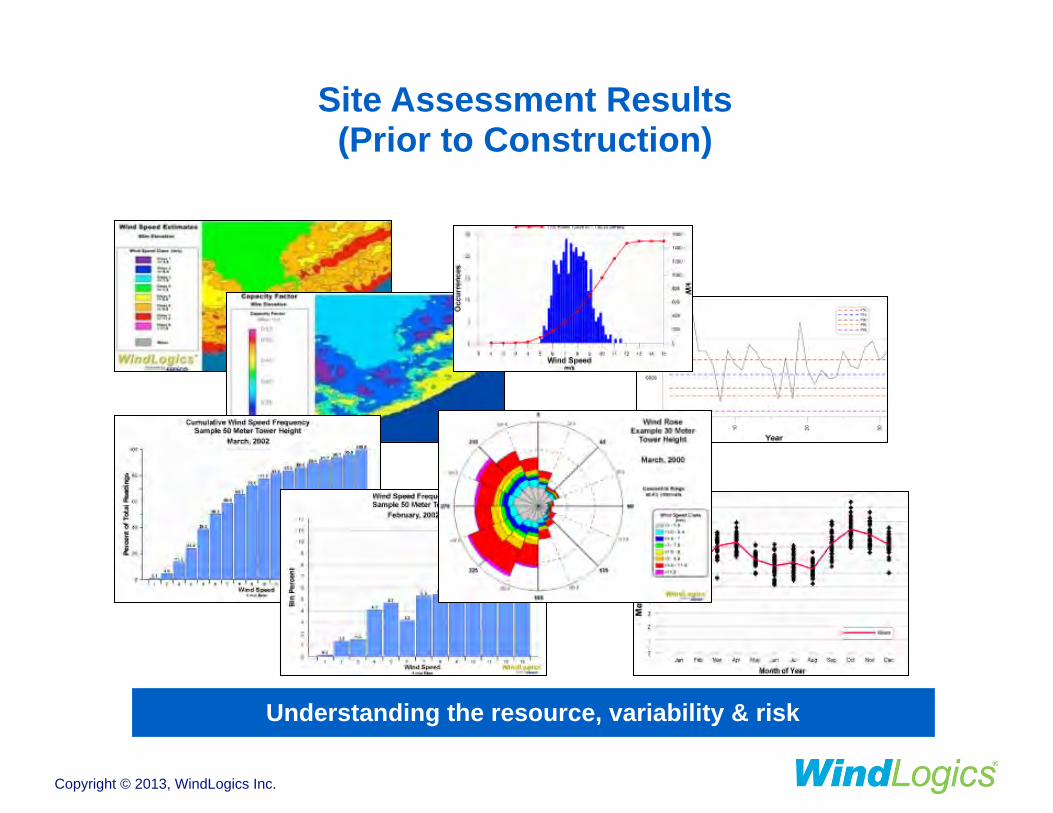
Site Assessment Results (Prior to Construction)
Understanding the resource, variability & risk
Copyright © 2013, WindLogics Inc.
Wind Forecasting
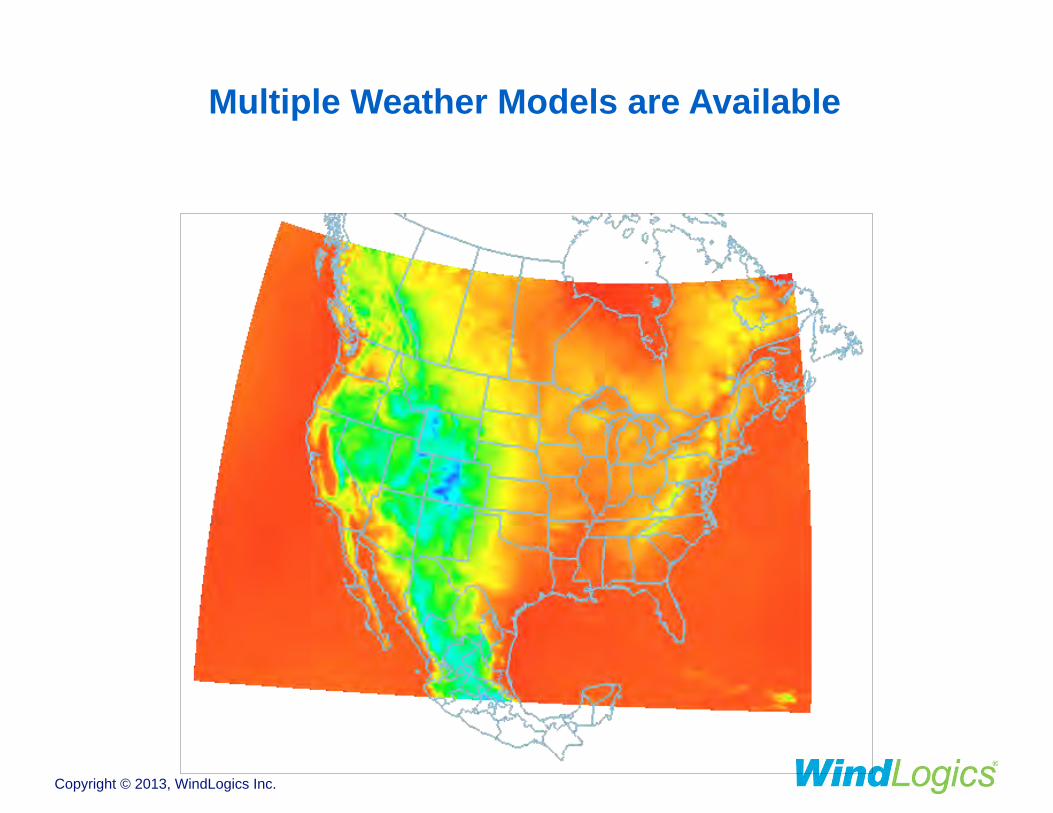
Multiple Weather Models are Available
Copyright © 2013, WindLogics Inc.
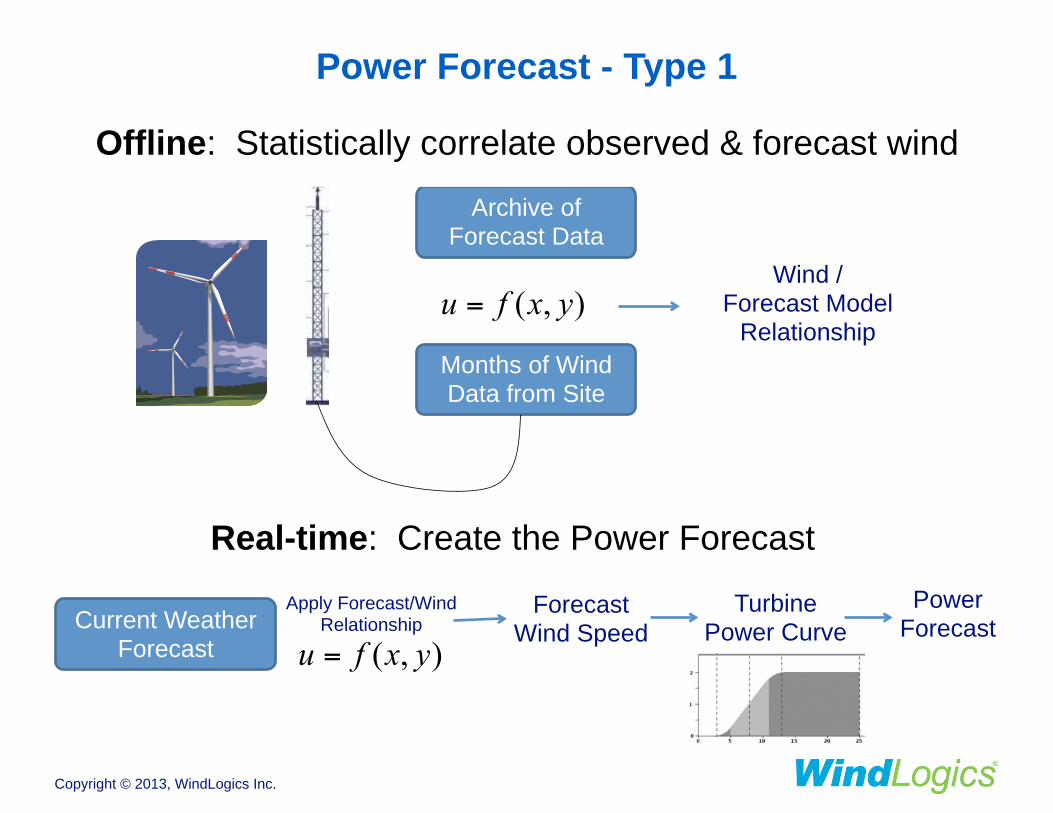
Power Forecast - Type 1
Archive of Forecast Data
Months of Wind Data from Site
Wind / Forecast Model
Relationship
Offline: Statistically correlate observed & forecast wind
Turbine Power Curve
Power ForecastCurrent Weather
Forecast
Apply Forecast/Wind Relationship
Forecast Wind Speed
Real-time: Create the Power Forecast
Copyright © 2013, WindLogics Inc.
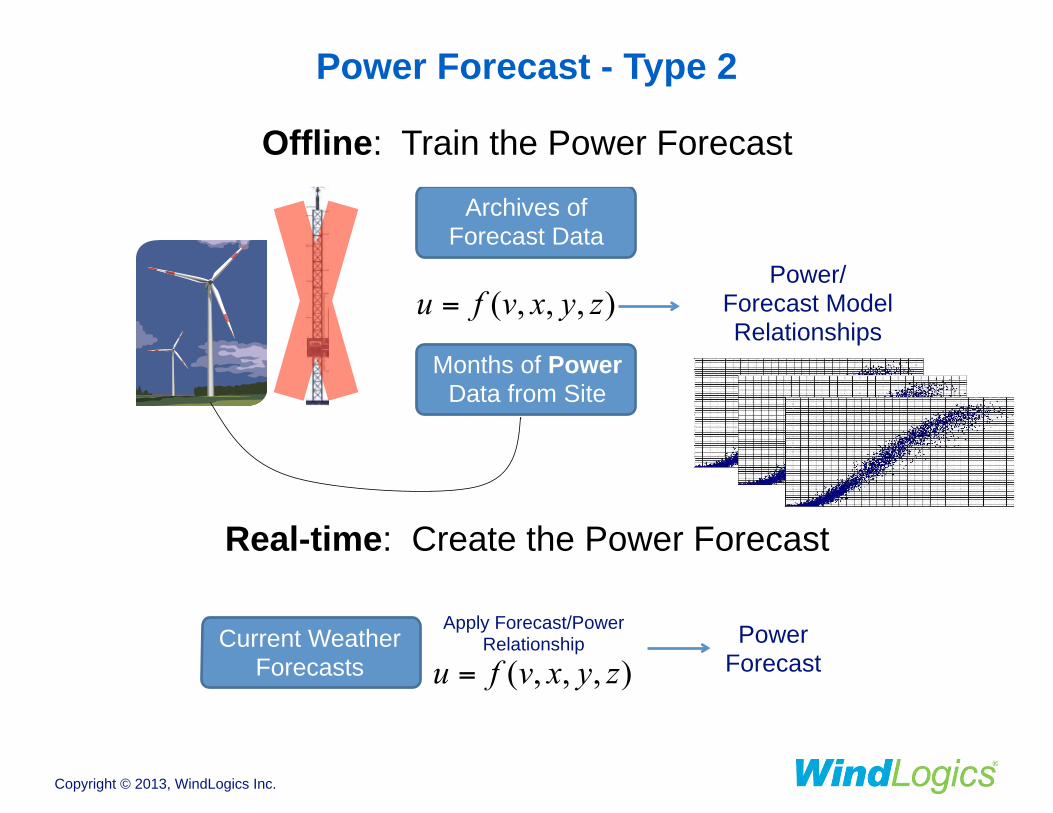
Power Forecast - Type 2
Archives of Forecast Data
Months of Power Data from Site
Power/Forecast Model Relationships
Offline: Train the Power Forecast
Power Forecast
Current Weather Forecasts
Apply Forecast/Power Relationship
Real-time: Create the Power Forecast
Copyright © 2013, WindLogics Inc.
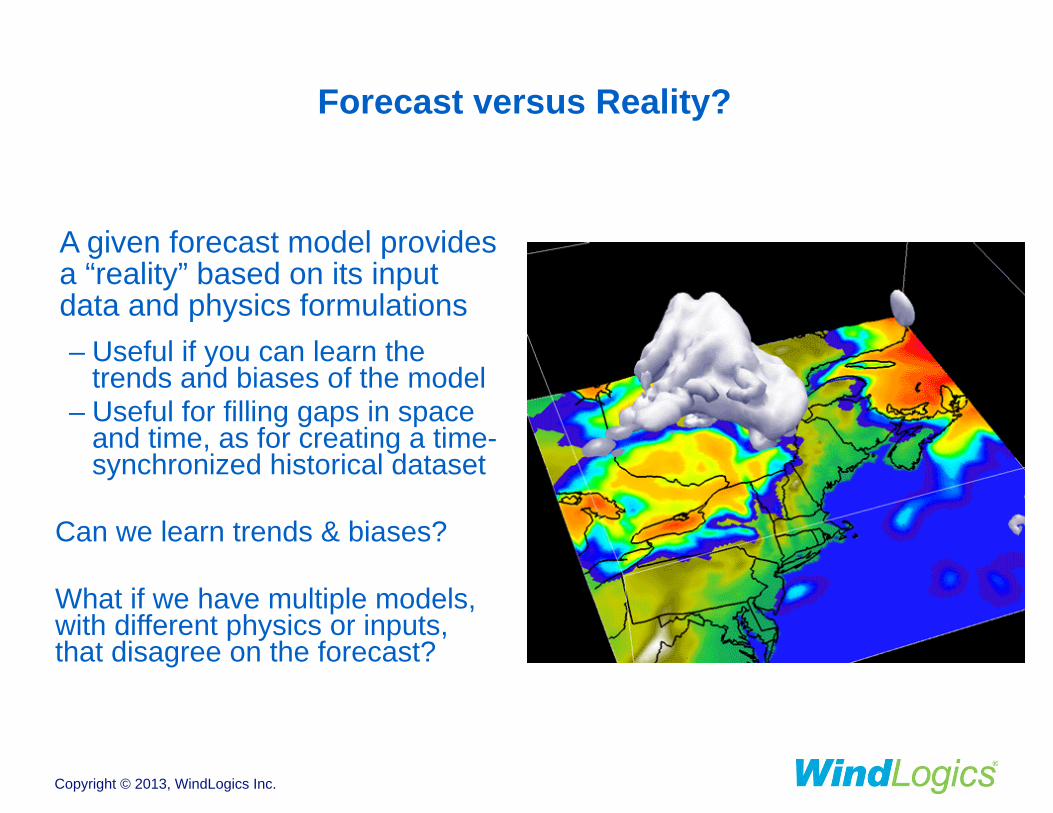
Forecast versus Reality?
A given forecast model provides a “reality” based on its input data and physics formulations – Useful if you can learn the
trends and biases of the model – Useful for filling gaps in space
and time, as for creating a time-synchronized historical dataset !
Can we learn trends & biases? !What if we have multiple models, with different physics or inputs, that disagree on the forecast?
Copyright © 2013, WindLogics Inc.
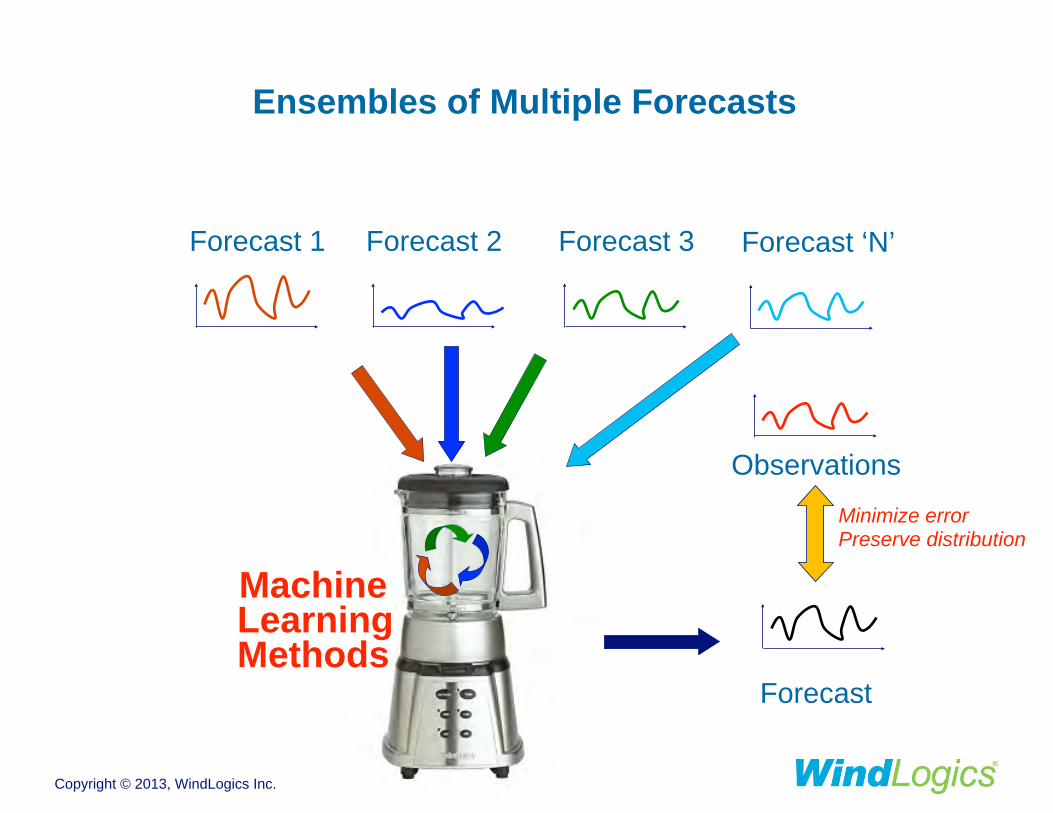
Observations
Forecast 1 Forecast 2 Forecast 3
MachineLearning Methods
Forecast
Minimize error Preserve distribution
Forecast ‘N’
Ensembles of Multiple Forecasts
Copyright © 2013, WindLogics Inc.
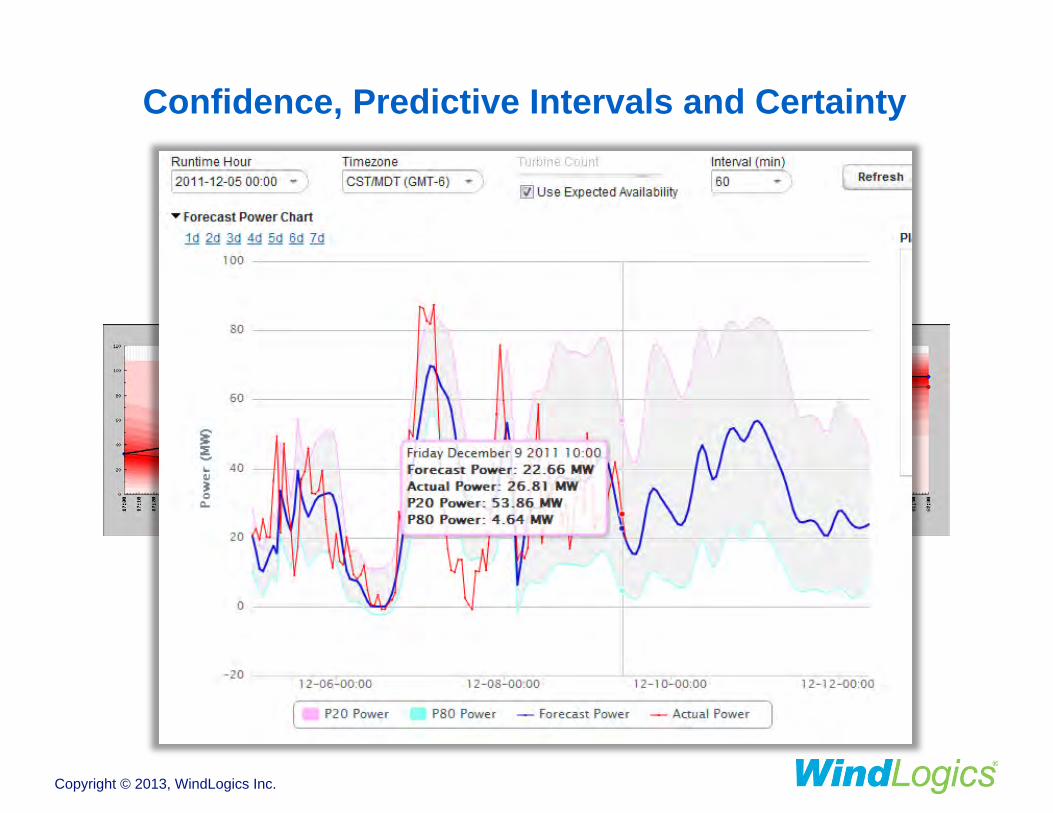
Confidence, Predictive Intervals and Certainty
Copyright © 2013, WindLogics Inc.
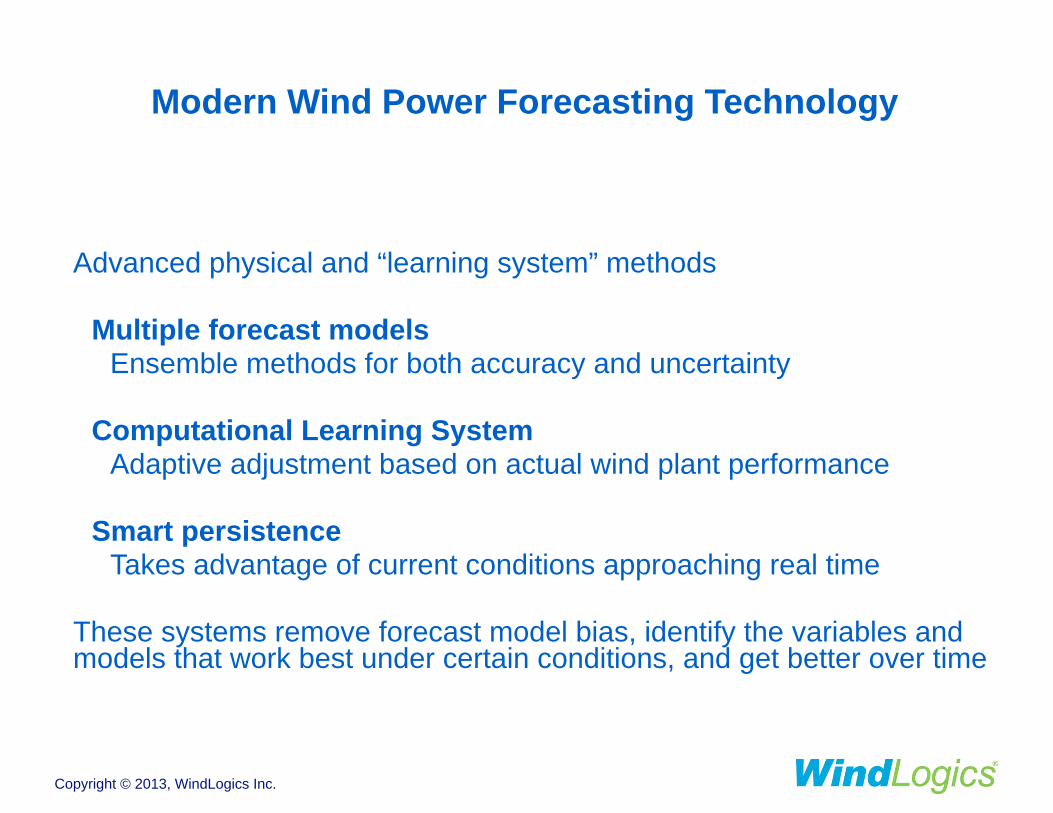
Modern Wind Power Forecasting Technology
Advanced physical and “learning system” methods !Multiple forecast models
Ensemble methods for both accuracy and uncertainty !Computational Learning System
Adaptive adjustment based on actual wind plant performance !Smart persistence
Takes advantage of current conditions approaching real time !These systems remove forecast model bias, identify the variables and models that work best under certain conditions, and get better over time
Copyright © 2013, WindLogics Inc.
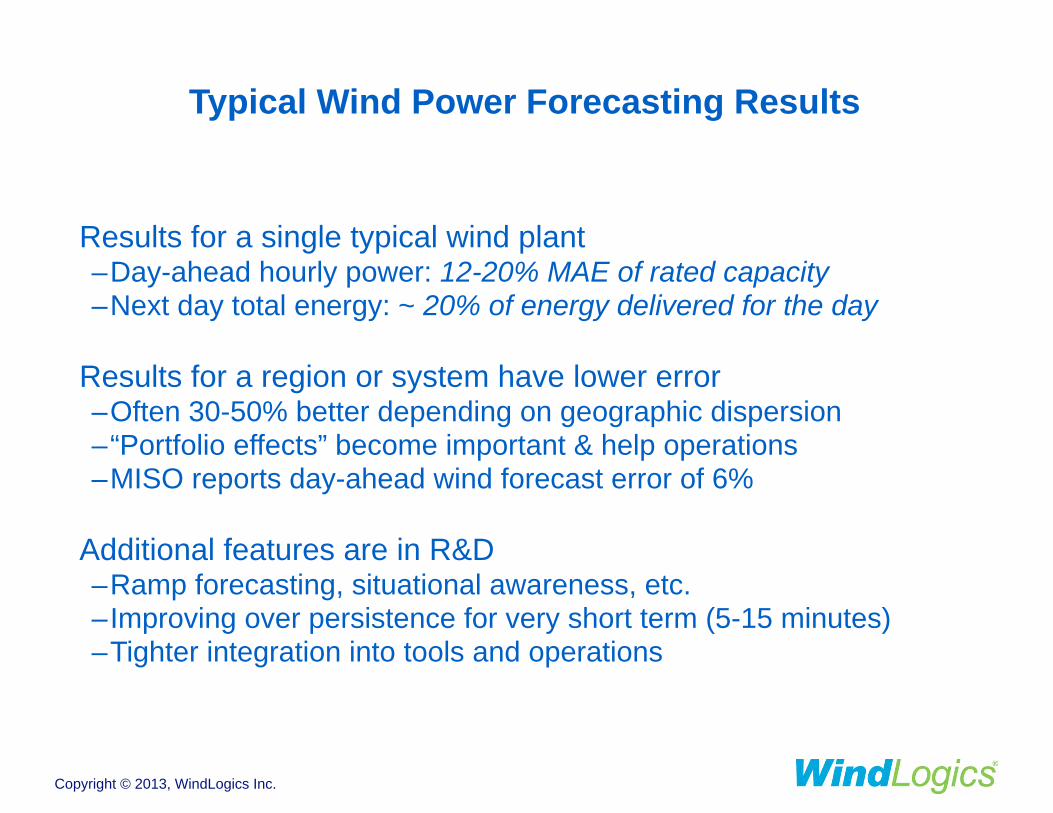
Typical Wind Power Forecasting Results
Results for a single typical wind plant –Day-ahead hourly power: 12-20% MAE of rated capacity –Next day total energy: ~ 20% of energy delivered for the day !Results for a region or system have lower error –Often 30-50% better depending on geographic dispersion –“Portfolio effects” become important & help operations –MISO reports day-ahead wind forecast error of 6% !Additional features are in R&D –Ramp forecasting, situational awareness, etc. –Improving over persistence for very short term (5-15 minutes) –Tighter integration into tools and operations
Copyright © 2013, WindLogics Inc.
Energy Markets and Dispatching Wind
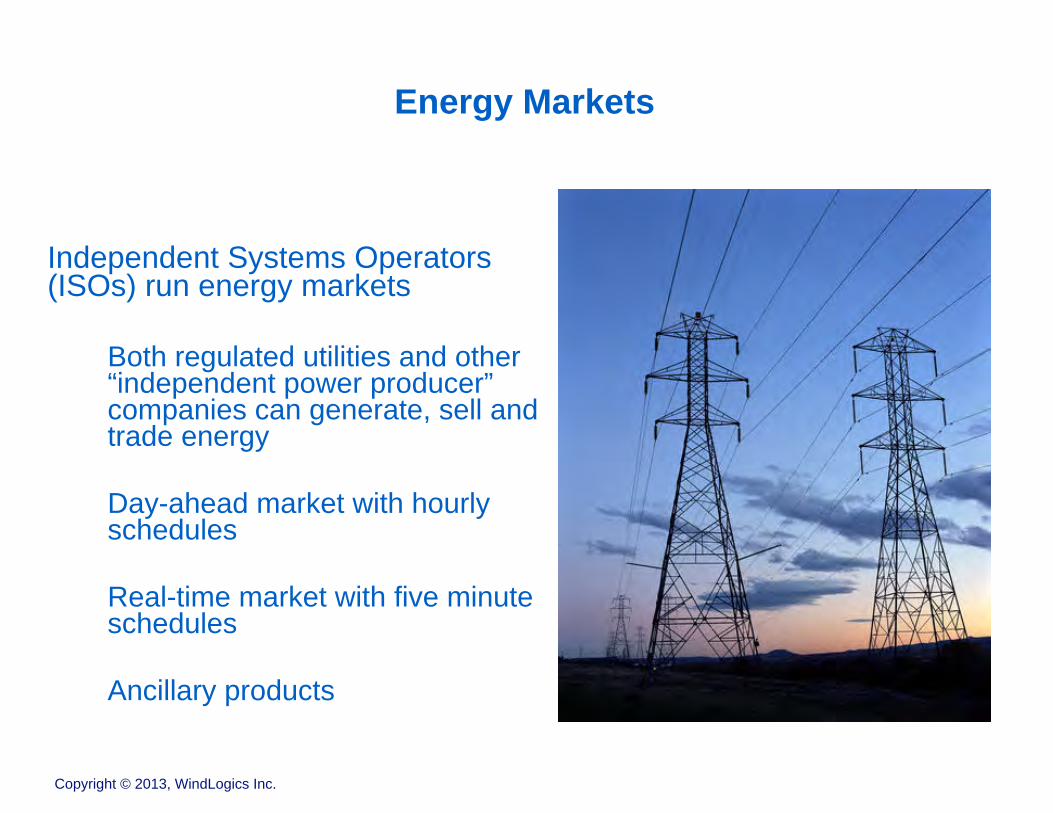
Energy Markets
!Independent Systems Operators (ISOs) run energy markets
!Both regulated utilities and other “independent power producer” companies can generate, sell and trade energy !Day-ahead market with hourly schedules !Real-time market with five minute schedules !Ancillary products
Copyright © 2013, WindLogics Inc.
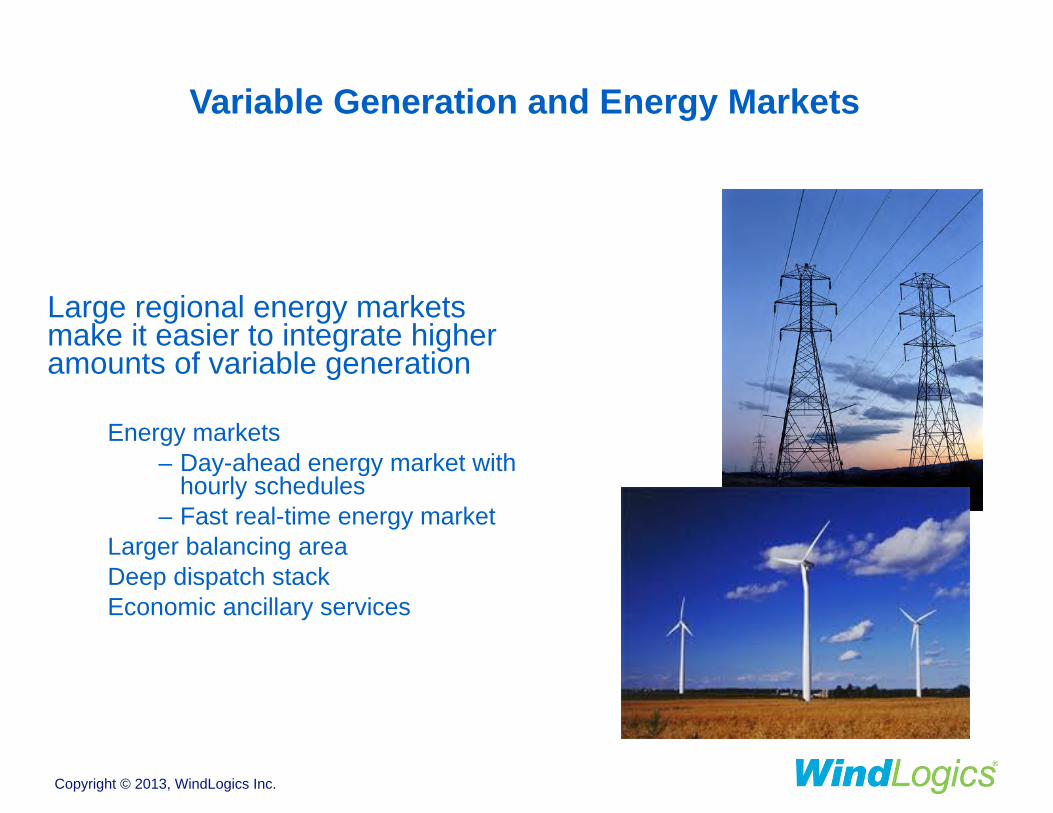
Variable Generation and Energy Markets
Large regional energy markets make it easier to integrate higher amounts of variable generation
!Energy markets
– Day-ahead energy market with hourly schedules
– Fast real-time energy market Larger balancing area Deep dispatch stack Economic ancillary services
Copyright © 2013, WindLogics Inc.
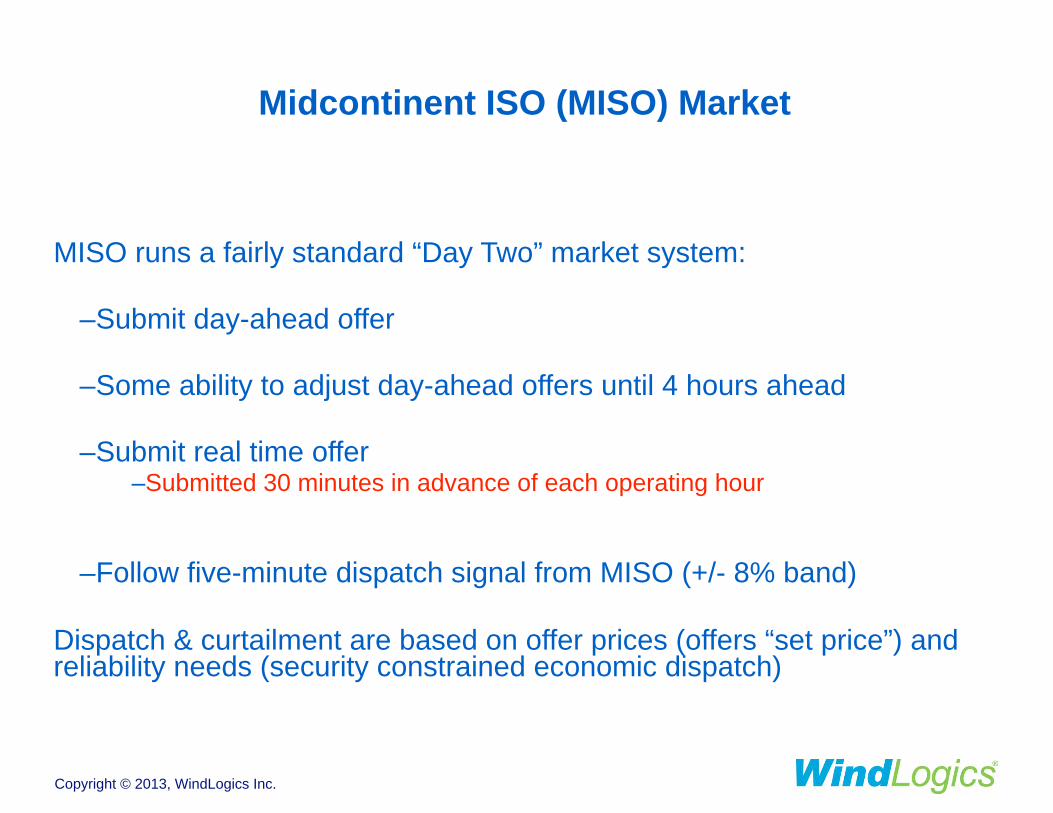
Midcontinent ISO (MISO) Market
MISO runs a fairly standard “Day Two” market system: !
–Submit day-ahead offer !
–Some ability to adjust day-ahead offers until 4 hours ahead !
–Submit real time offer –Submitted 30 minutes in advance of each operating hour !!
–Follow five-minute dispatch signal from MISO (+/- 8% band) !Dispatch & curtailment are based on offer prices (offers “set price”) and reliability needs (security constrained economic dispatch)
Copyright © 2013, WindLogics Inc.
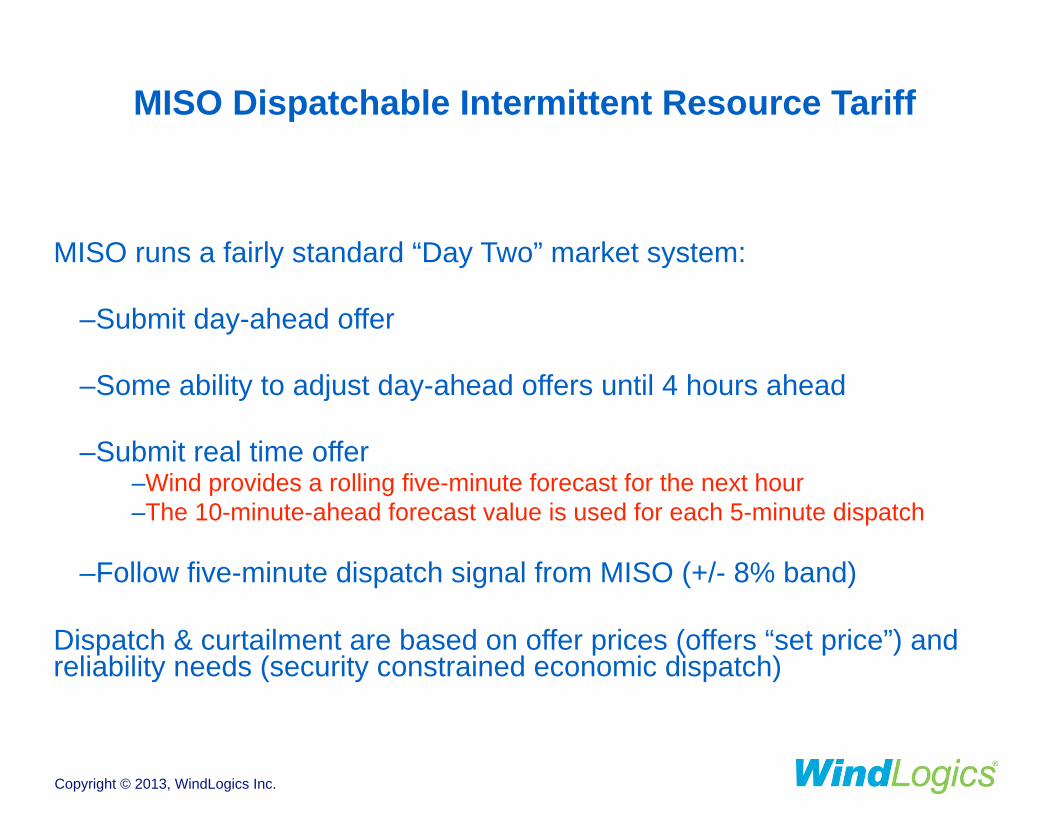
MISO Dispatchable Intermittent Resource Tariff
MISO runs a fairly standard “Day Two” market system: !
–Submit day-ahead offer !
–Some ability to adjust day-ahead offers until 4 hours ahead !
–Submit real time offer –Wind provides a rolling five-minute forecast for the next hour –The 10-minute-ahead forecast value is used for each 5-minute dispatch !
–Follow five-minute dispatch signal from MISO (+/- 8% band) !Dispatch & curtailment are based on offer prices (offers “set price”) and reliability needs (security constrained economic dispatch)
Copyright © 2013, WindLogics Inc.
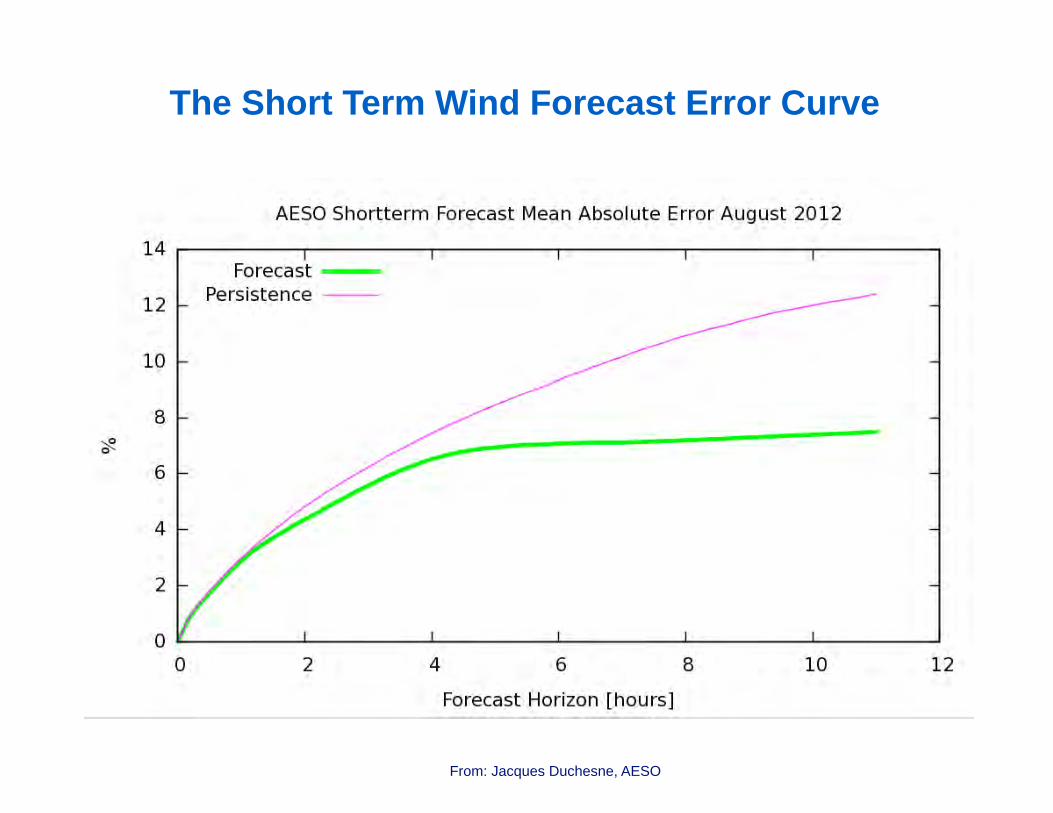
The Short Term Wind Forecast Error Curve
From: Jacques Duchesne, AESO
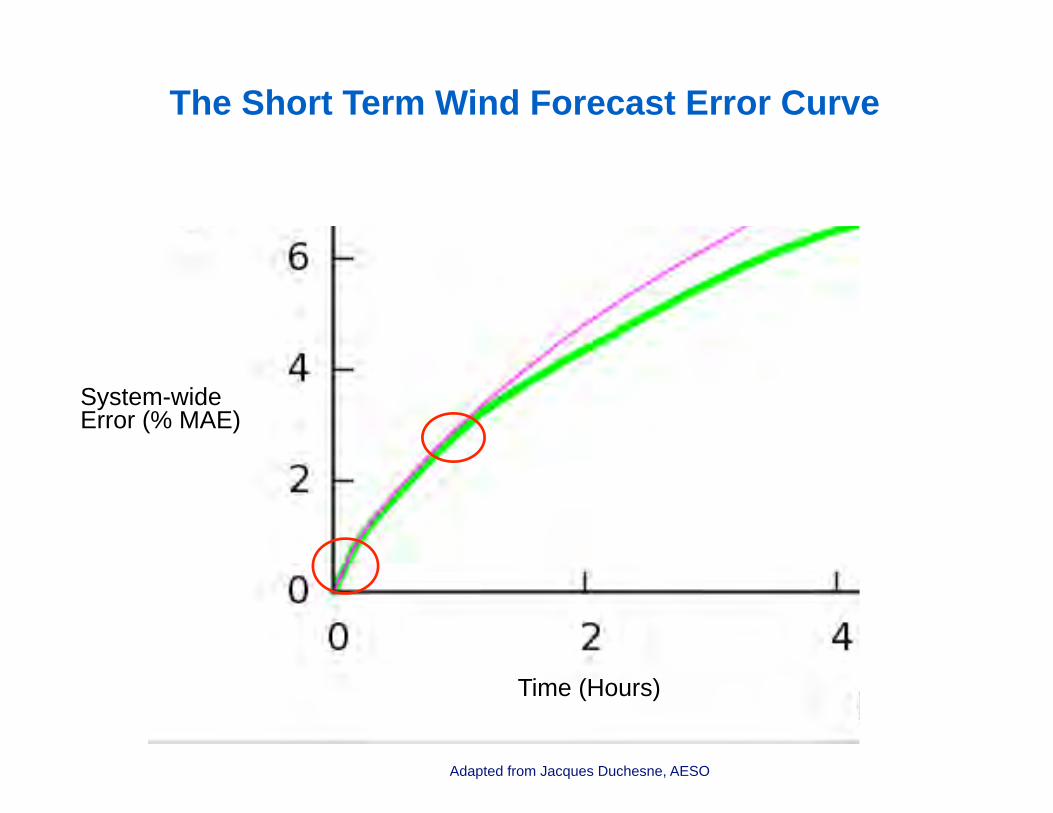
The Short Term Wind Forecast Error Curve
Adapted from Jacques Duchesne, AESO
Time (Hours)
System-wideError (% MAE)
Dispatching Wind Changes the Perception of the Problem
“Variability” is the change or error within the dispatch period Uses some regulation, but not much given geographic aggregation !“Uncertainty” is mostly the error from the day-ahead forecast Largely handled through the real time dispatch stack Uses some non-spin reserve for extreme situations !Is there a ramping or flexibility problem?
With a deep and robust real time dispatch… not really Wind ramping up - you have dispatch control of wind if needed Wind ramping down - units backed down and have room to move up
!Without a deep and robust real time dispatch stack, integrating wind is more challenging… but the most effective action is to get one!
Copyright © 2013, WindLogics Inc.
Wind as a Full Market Participant
Wind in dispatch (real time operations) Must be based on a 0-10 minute-ahead forecast! A robust real time market encourages wind to offer day ahead !Wind in day-ahead market (day-ahead unit commitment) Ongoing importance of better day-ahead forecasts Value to both system operator and market participants !Wind forecast changes within the day Ramping and reducing day-ahead forecast error Value to system operators for rolling commitment decisions
Copyright © 2013, WindLogics Inc.

Solar Energy
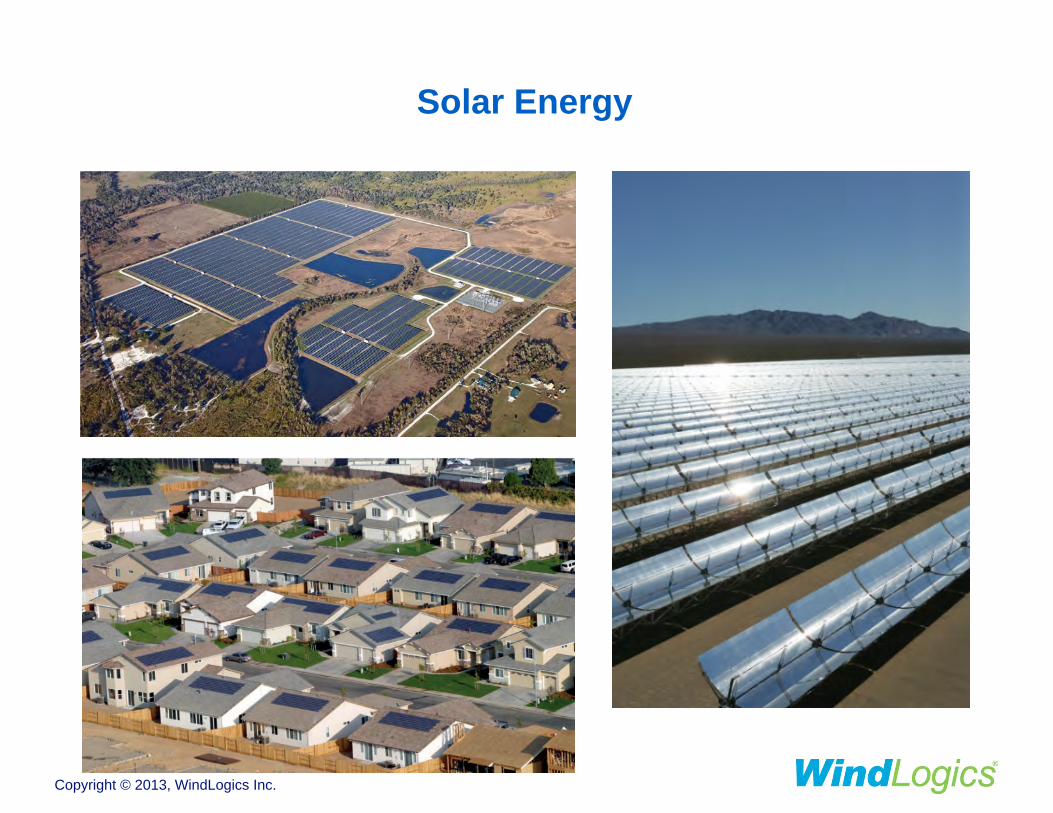
Solar Energy
Copyright © 2013, WindLogics Inc.
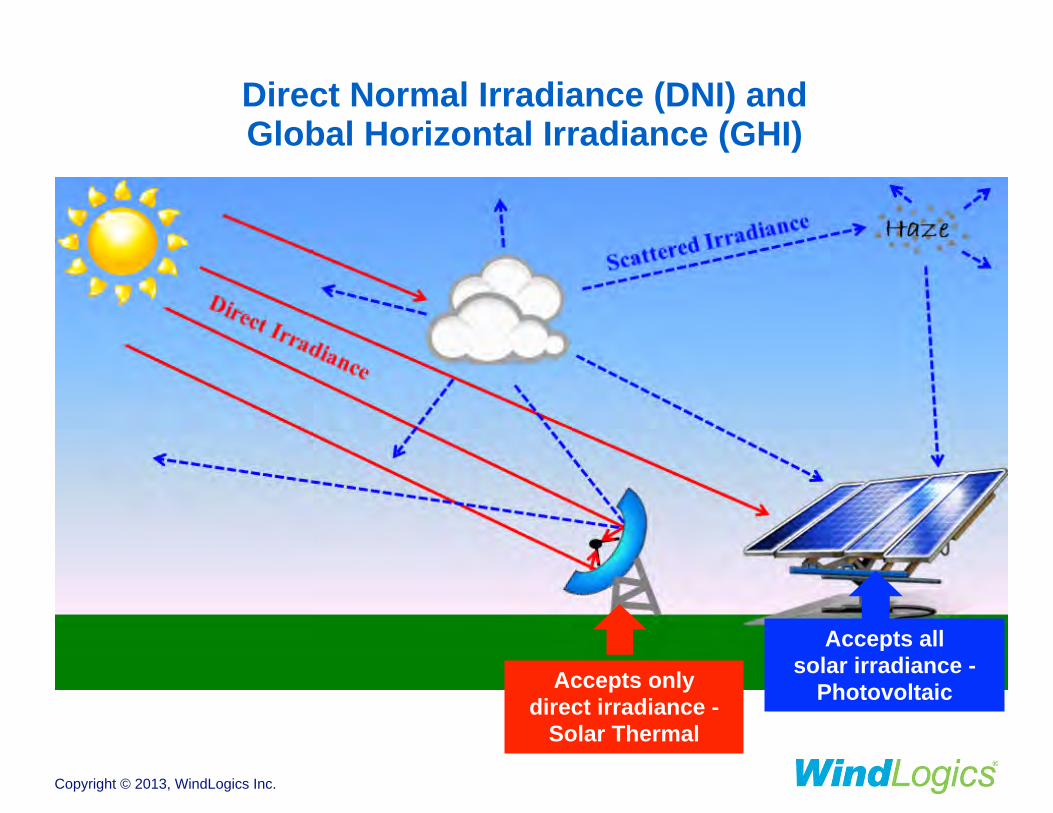
Direct Normal Irradiance (DNI) and Global Horizontal Irradiance (GHI)
Accepts only direct irradiance -
Solar Thermal
Accepts all solar irradiance -
Photovoltaic
Copyright © 2013, WindLogics Inc.
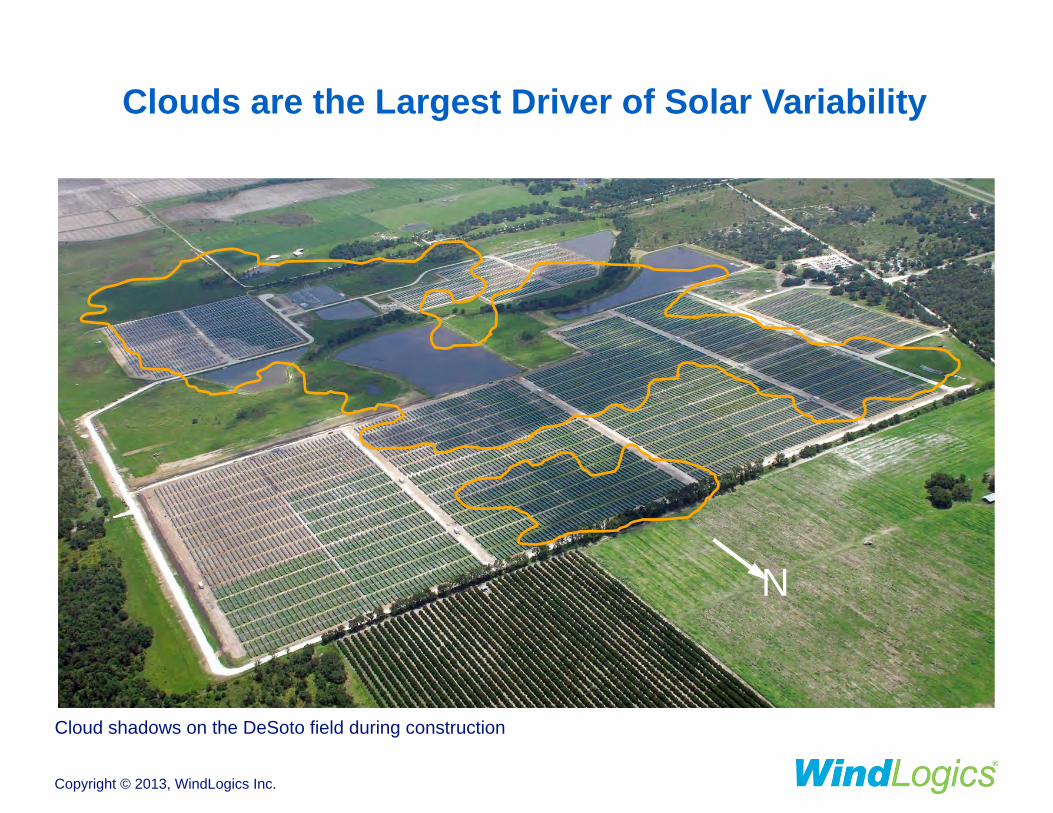
Clouds are the Largest Driver of Solar Variability
N
Cloud shadows on the DeSoto field during construction
Copyright © 2013, WindLogics Inc.
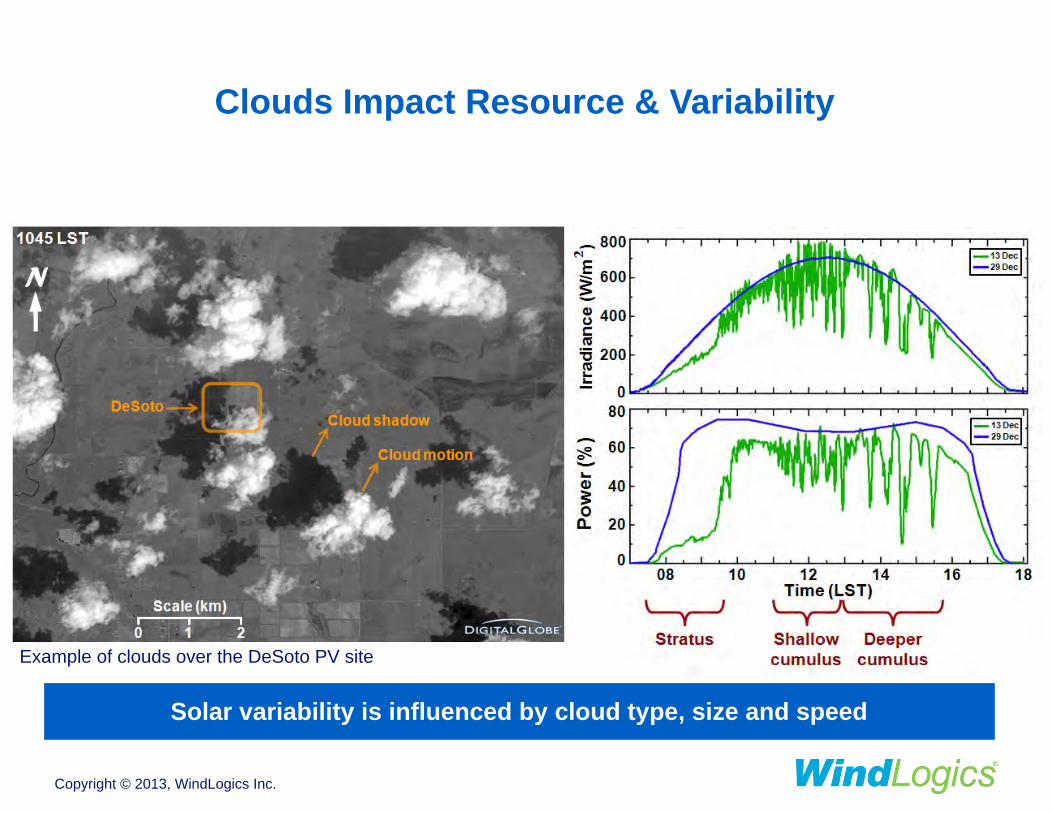
Clouds Impact Resource & Variability
Solar variability is influenced by cloud type, size and speed
Example of clouds over the DeSoto PV site
Copyright © 2013, WindLogics Inc.
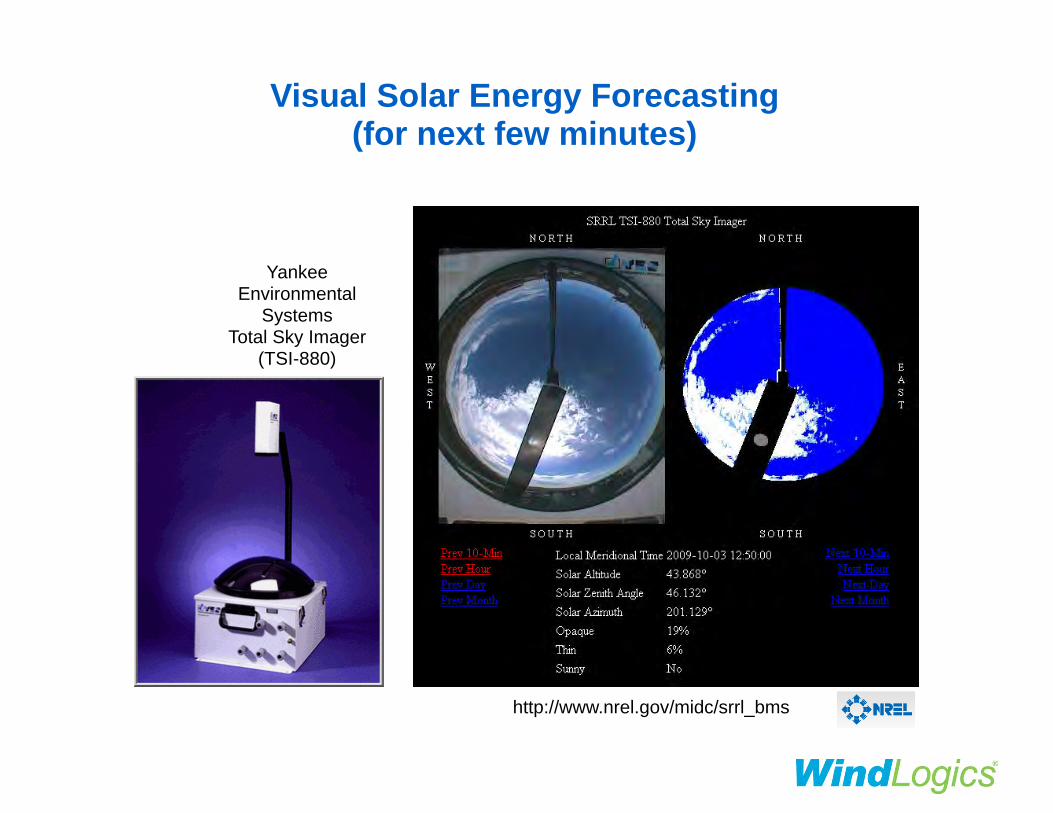
Visual Solar Energy Forecasting (for next few minutes)
Clouds moving from the west (~ 45 m/s)
Forecasted cloud impact
zone
http://www.nrel.gov/midc/srrl_bms
Yankee Environmental
Systems Total Sky Imager
(TSI-880)
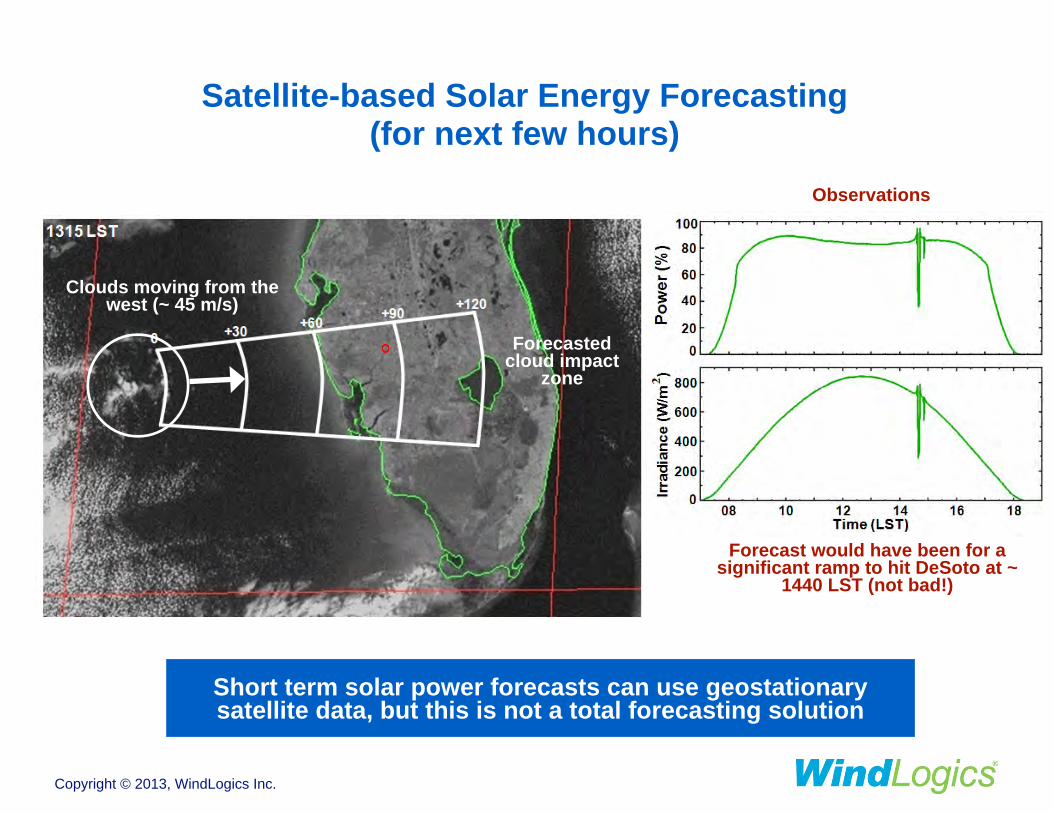
Satellite-based Solar Energy Forecasting (for next few hours)
Clouds moving from the west (~ 45 m/s)
Forecasted cloud impact
zone
Forecast would have been for a significant ramp to hit DeSoto at ~
1440 LST (not bad!)
Observations
Short term solar power forecasts can use geostationary satellite data, but this is not a total forecasting solution
Copyright © 2013, WindLogics Inc.
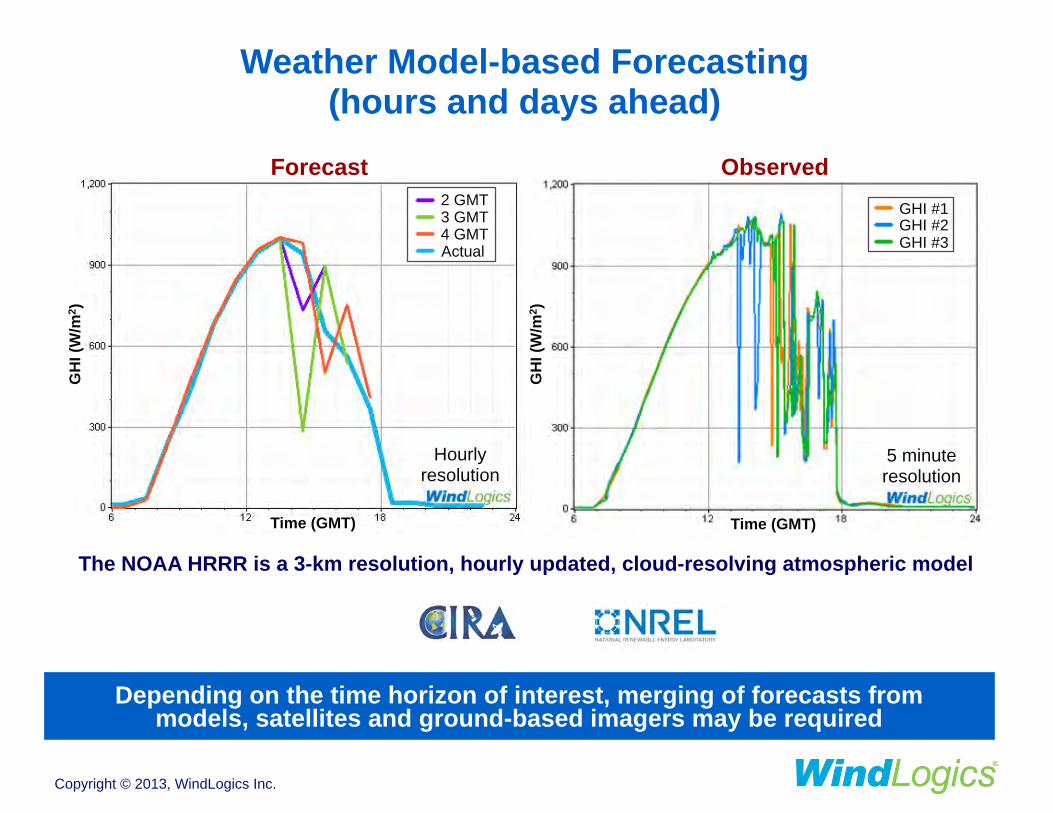
Weather Model-based Forecasting (hours and days ahead)
Depending on the time horizon of interest, merging of forecasts from models, satellites and ground-based imagers may be required
The NOAA HRRR is a 3-km resolution, hourly updated, cloud-resolving atmospheric model
Forecast 2 GMT 3 GMT 4 GMT Actual
Hourly resolution
Time (GMT)
GH
I (W
/m2 )
Observed GHI #1 GHI #2 GHI #3
GH
I (W
/m2 )
5 minute resolution
Time (GMT)
Copyright © 2013, WindLogics Inc.
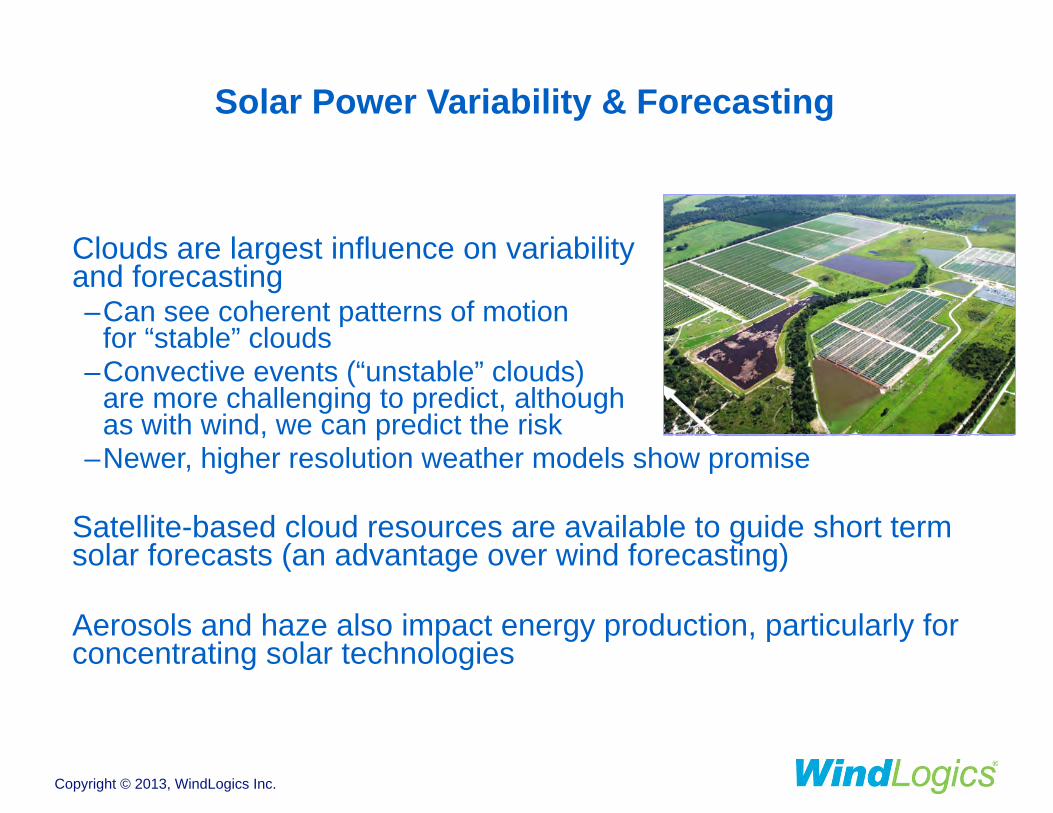
Solar Power Variability & Forecasting
Clouds are largest influence on variability and forecasting –Can see coherent patterns of motion
for “stable” clouds –Convective events (“unstable” clouds)
are more challenging to predict, although as with wind, we can predict the risk
–Newer, higher resolution weather models show promise !
Satellite-based cloud resources are available to guide short term solar forecasts (an advantage over wind forecasting) !
Aerosols and haze also impact energy production, particularly for concentrating solar technologies
Copyright © 2013, WindLogics Inc.
Distributed Solar
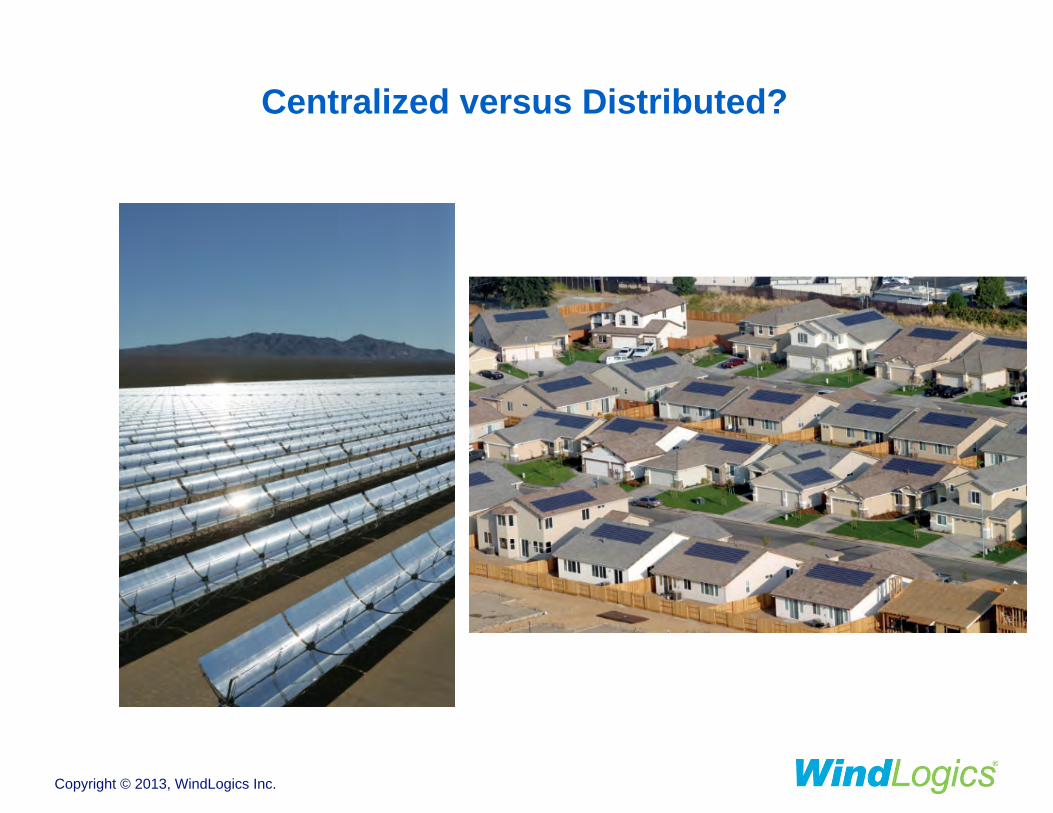
Centralized versus Distributed?
Copyright © 2013, WindLogics Inc.
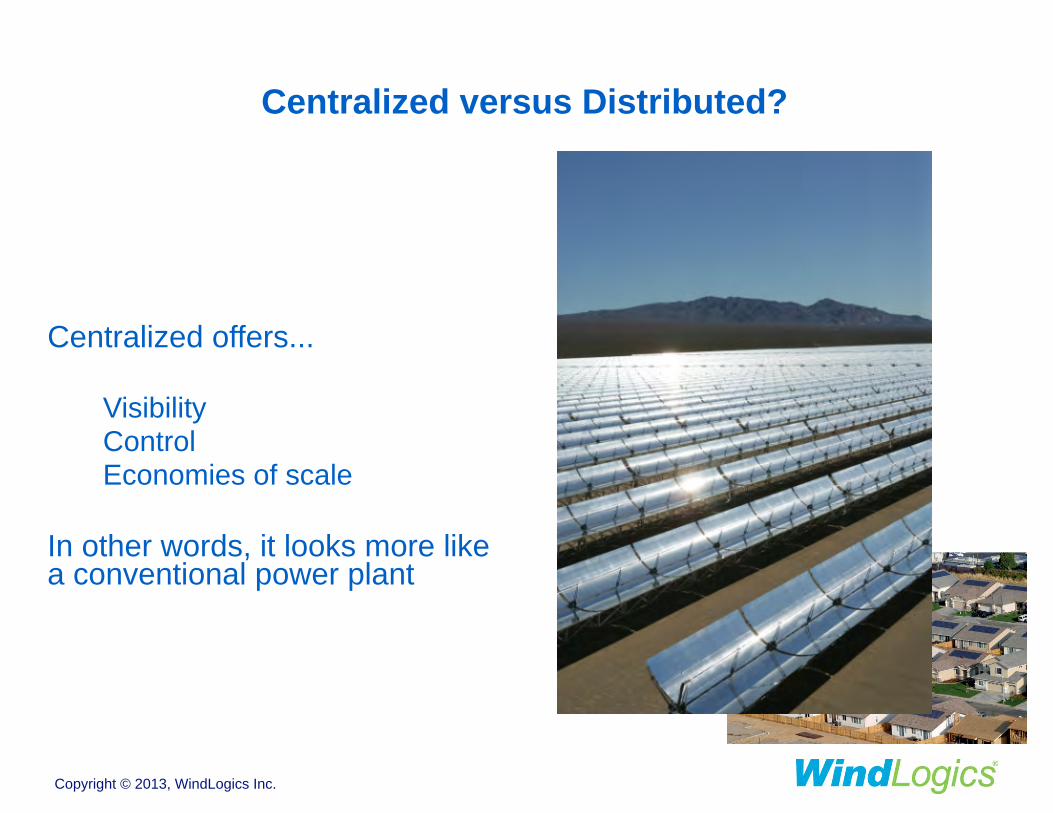
Centralized versus Distributed?
Centralized offers... !
Visibility Control Economies of scale
!In other words, it looks more like a conventional power plant
Copyright © 2013, WindLogics Inc.
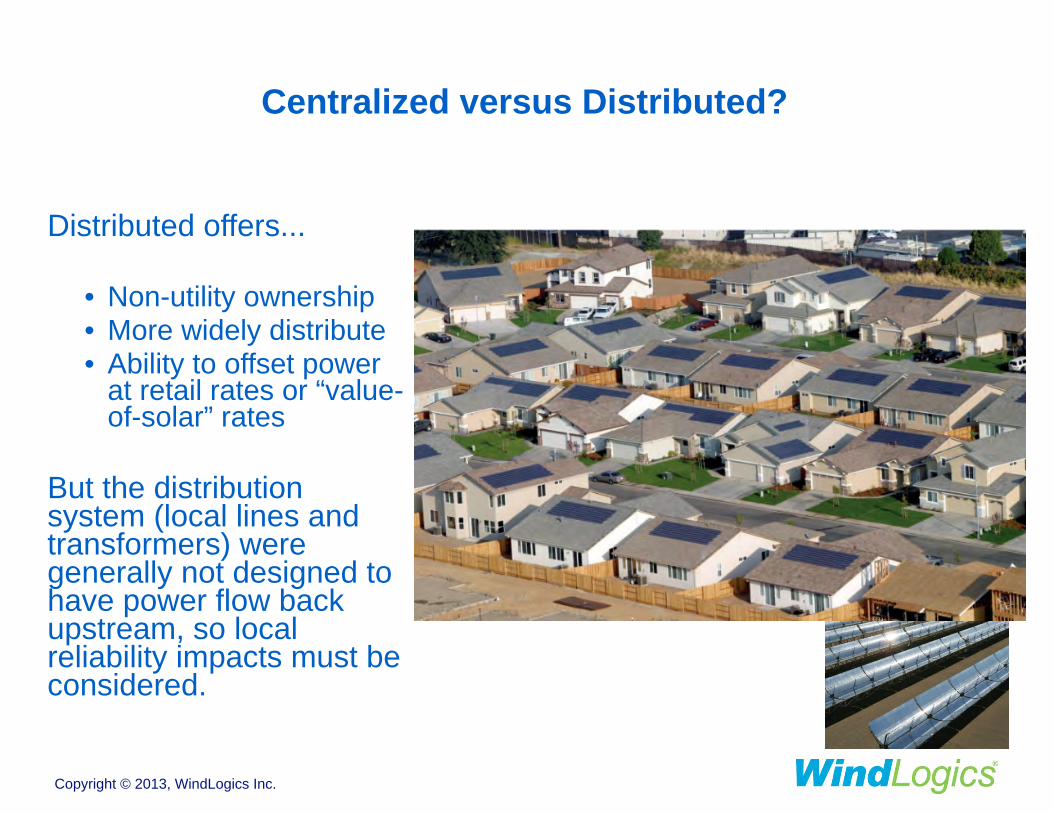
Centralized versus Distributed?
Distributed offers... !
• Non-utility ownership • More widely distribute • Ability to offset power
at retail rates or “value-of-solar” rates
!But the distribution system (local lines and transformers) were generally not designed to have power flow back upstream, so local reliability impacts must be considered.
Copyright © 2013, WindLogics Inc.
Distributed Solar and “Value of Solar” Tariffs
•
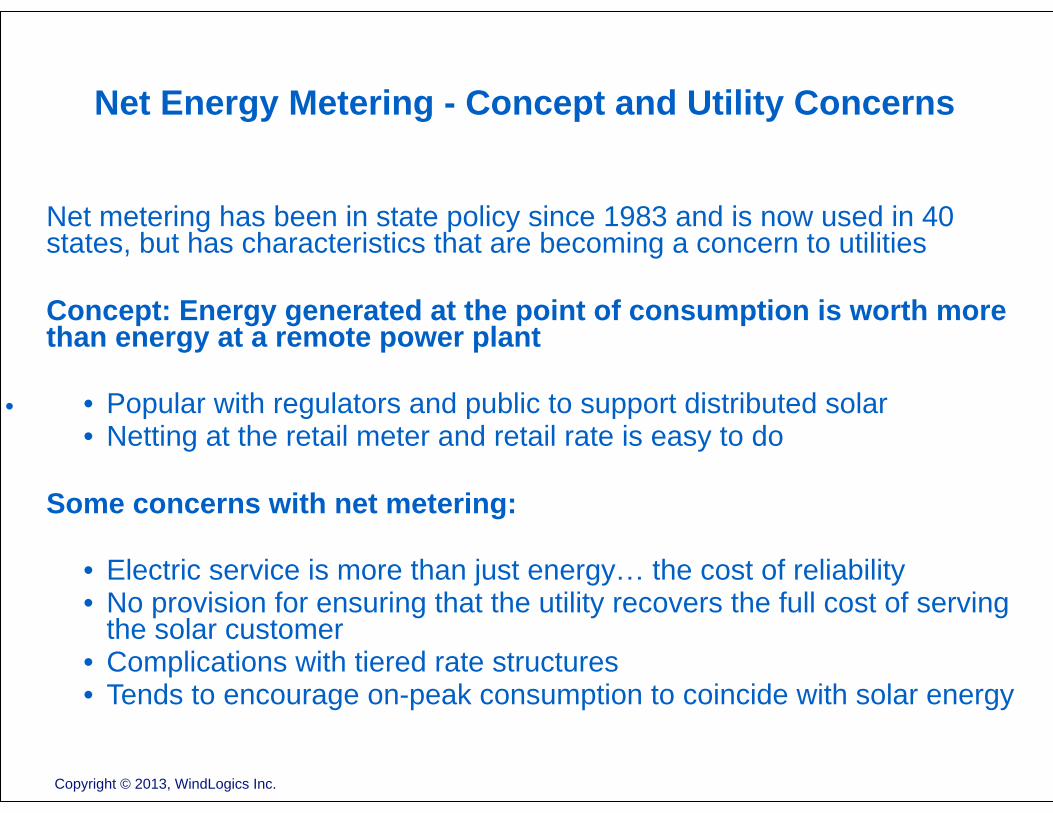
Net Energy Metering - Concept and Utility Concerns
Net metering has been in state policy since 1983 and is now used in 40 states, but has characteristics that are becoming a concern to utilities !Concept: Energy generated at the point of consumption is worth more than energy at a remote power plant !
• Popular with regulators and public to support distributed solar • Netting at the retail meter and retail rate is easy to do
!Some concerns with net metering: !
• Electric service is more than just energy… the cost of reliability • No provision for ensuring that the utility recovers the full cost of serving
the solar customer • Complications with tiered rate structures • Tends to encourage on-peak consumption to coincide with solar energy
Copyright © 2013, WindLogics Inc.
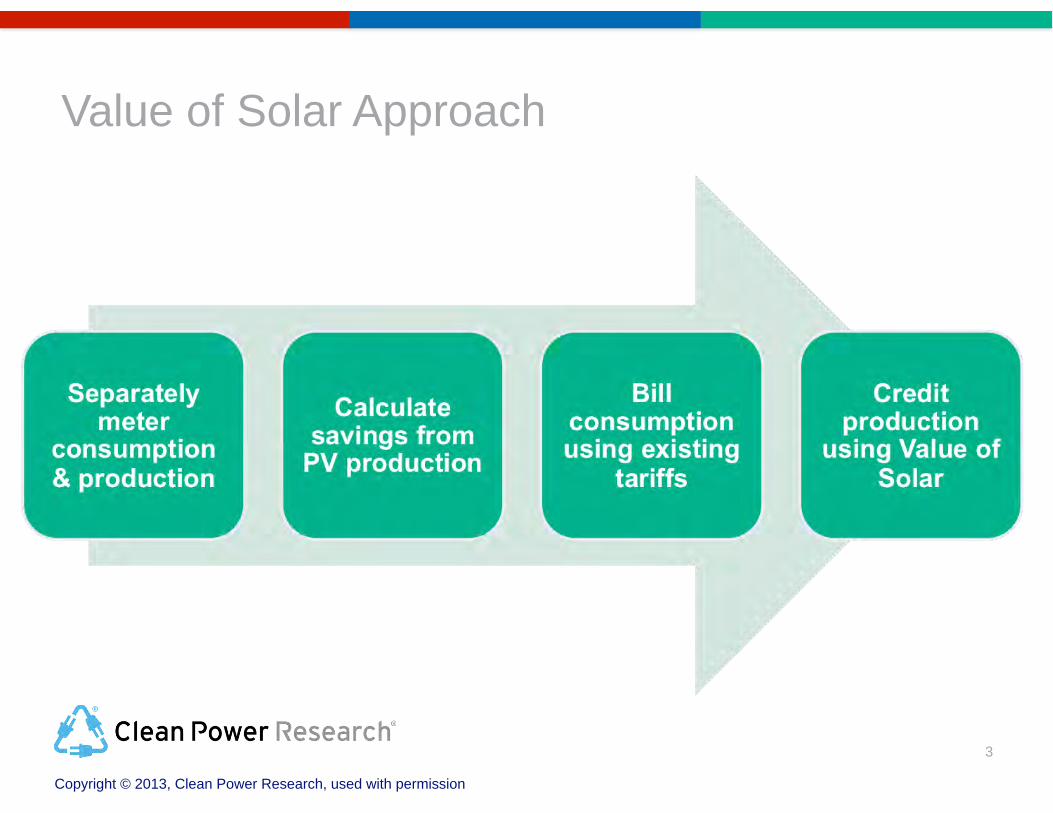
Value of Solar Approach
3
Copyright © 2013, Clean Power Research, used with permission
•
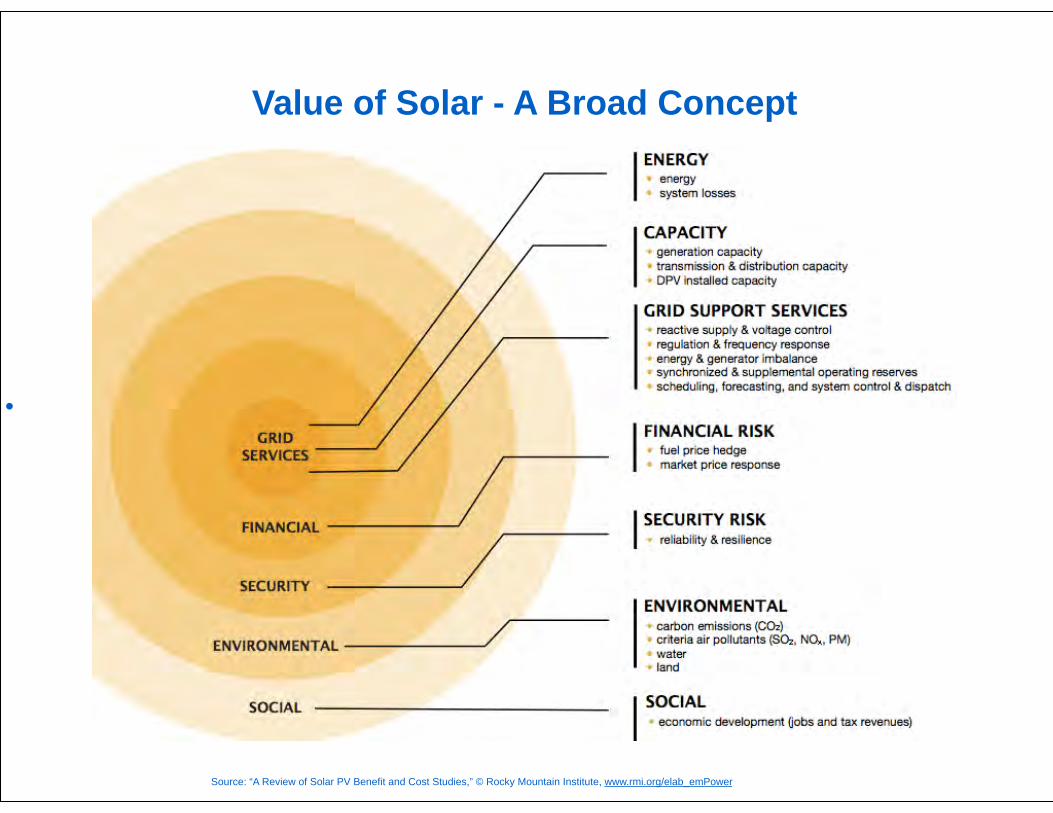
Value of Solar - A Broad Concept
Source: “A Review of Solar PV Benefit and Cost Studies,” © Rocky Mountain Institute, www.rmi.org/elab_emPower
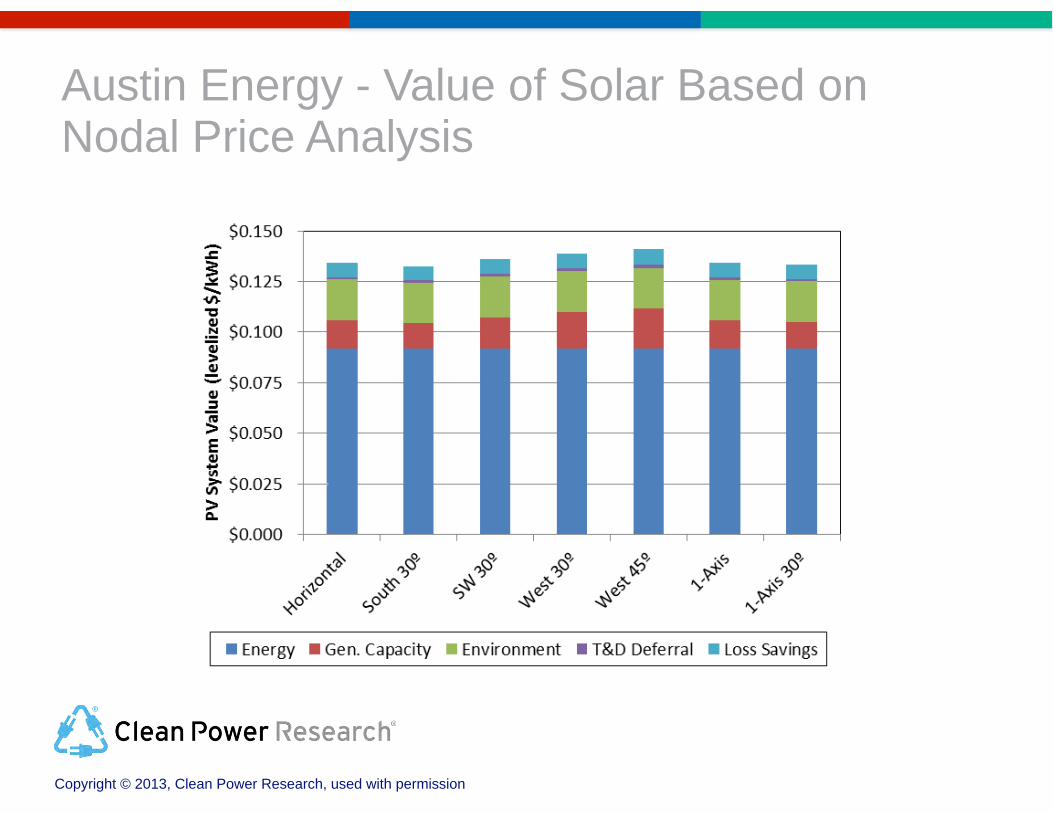
Austin Energy - Value of Solar Based on Nodal Price Analysis
Copyright © 2013, Clean Power Research, used with permission
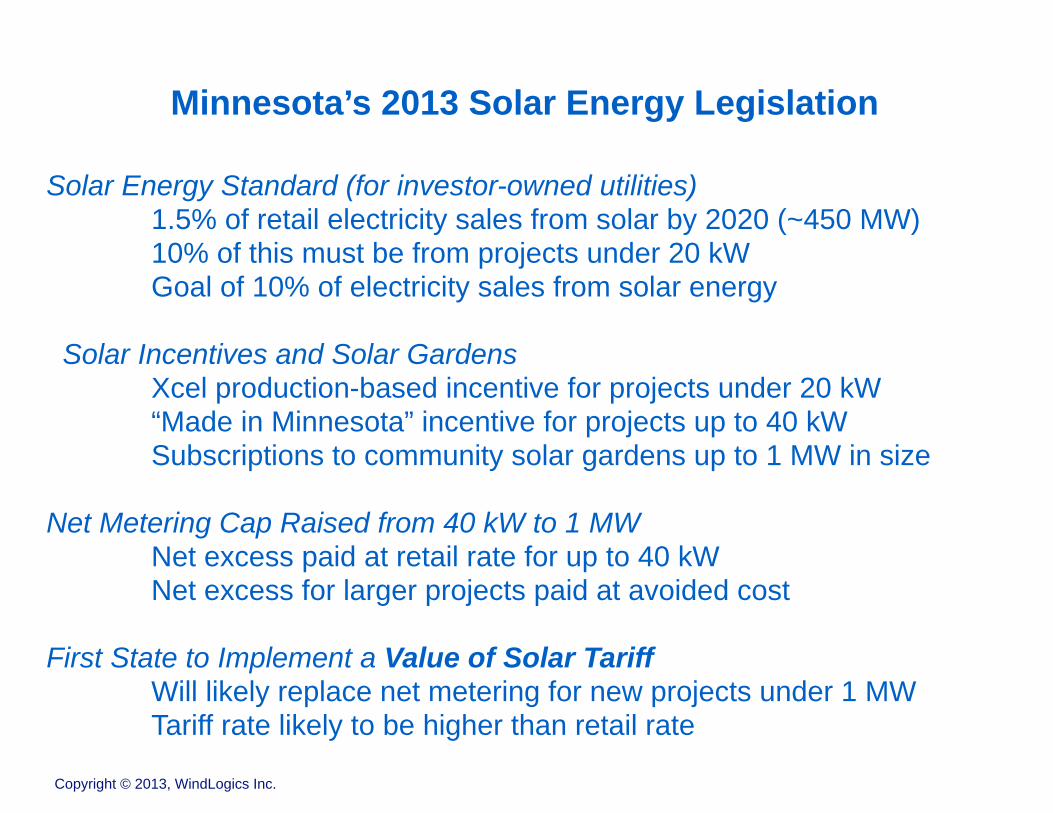
Minnesota’s 2013 Solar Energy Legislation
Solar Energy Standard (for investor-owned utilities) 1.5% of retail electricity sales from solar by 2020 (~450 MW) 10% of this must be from projects under 20 kW Goal of 10% of electricity sales from solar energy
!Solar Incentives and Solar Gardens
Xcel production-based incentive for projects under 20 kW “Made in Minnesota” incentive for projects up to 40 kW Subscriptions to community solar gardens up to 1 MW in size !Net Metering Cap Raised from 40 kW to 1 MW Net excess paid at retail rate for up to 40 kW Net excess for larger projects paid at avoided cost !First State to Implement a Value of Solar Tariff Will likely replace net metering for new projects under 1 MW Tariff rate likely to be higher than retail rate
Copyright © 2013, WindLogics Inc.
A Model Program for Distributed Solar?
Minnesota could set a very important precedent for the nation !
Latest developments from November 19 - Value of Solar Methodology
!How to support distributed solar in a fair and sustainable way?
!Provide long-term fixed-price contracts
Avoid cannibalizing energy charges and cost recovery of system investments
Pay based on a defensible “Value of Solar” for distributed generation !
!
Copyright © 2013, WindLogics Inc.