wind tunnel experiments for supersonic optical-electrical ...cdn.intechweb.org/pdfs/16695.pdf ·...
TRANSCRIPT

32
Wind Tunnel Experiments for Supersonic Optical-electrical Seeker’s Dome Design
Qun Wei, Hongguang Jia, Ming Xuan and Zhenhai Jiang Changchun Institute of Optics, Fine Mechanics and Physics
China
1. Introduction
Missiles play a more and more important role in the modern wars. The seeker is the most
important sub-system of a guided missile. As long as the development of optics, most
missiles use optical-electrical seekers. This kind of seeker has plenty of benefits such as high
resolving power, anti-camouflage and low cost. Optical guided missile has a optical dome
which plays a very important role on the seeker system. The seeker’s dome has two jobs:
first, it is the first element of the imaging system, so the dome should have good optical
performance; second, it protects the sensitive optical, detector, and processor components of
the missile seeker from hostile environments such as rain, sand, or large temperature
gradients. When missile flies at supersonic, the aero load has serious impacts on seeker’s
dome. These loads mainly include aerodynamic, aero-thermodynamic, turbulence around
the dome and aero vibration. The aerodynamic and aero-thermodynamic make the dome’s
shape change. The aero-thermodynamic causes heat barrier. And the turbulences and aero
vibration make the image dithering and blur. Because all of the above effects are important
for dome design, the study of this chapter is necessary. The study of domes has begun for
many years, scientists got a lot of achievement in this field. The research is mainly divided
into three parts: materials and fabrication[1,2], test and measurement[3,4], aerodynamic and
aerothermal[5,6]. For recent years, there is a new branch of optics : conformal optics[7].
Conformal optical systems are characterized as having external optical surfaces that are
optimized for non-optical system requirements. This typically implies blending smoothly
with a host platform to achieve an optimum shape. Although the open literature provides
extensive discussions on current developments in conformal system design, little
information is available to study the conformal seeker’s dome wind tunnel experiments.
This chapter describes a method for researching the supersonic dome’s aero-optical
phenomena and theirs influents on optical image by wind tunnel experiments. Combined
with thrice wind tunnel experiments and CFD (computational fluid dynamics) numerical
simulation, this chapter studies the aerodynamic, aero-thermodynamic and the turbulent of
the dome’s out surface when it flies at supersonic speed. Then, by using the wind tunnel
experiments results, the seeker’s image which is affected by missile flies at supersonic speed
is studied. After analyzing the results, the conclusion will be the fundamentals to design
future domes. The straight matter describes the methods of wind tunnel experiments, and it
is divided into three parts.
www.intechopen.com

Wind Tunnels and Experimental Fluid Dynamics Research
662
Part one: simulated spherical dome wind tunnel experiment study. Most traditional seeker’s dome’s shape is spherical, so we study its aero-optical effects by wind tunnel experiment first. A model with spherical dome is designed for CFD simulation. After the CFD simulation, all kinds of parameters such as the dome’s surface pressure and temperature field are got. Using these results, we analyze their influents on seeker’s imaging. Then, the wind tunnel model is made with the same shape of the CFD simulation model. The wind tunnel experiment is done with this model at different kinds of speed and attack angles. After the experiment, actual pressure field of the dome’s surface and schieren photography around the dome are got. Comparing the wind tunnel results and the simulation results, the veracity of the simulation is 90% at average. These two kinds of results are all used to analyze seeker’s image influenced by aero-optical phenomena. Part two: simulated conformal dome wind tunnel experiments study. Along with the development of optical design, optical fabrication and optical test technologies, the new conformal dome will be instead of the traditional spherical dome. This part will study the conformal dome’s aero-optical effects caused by missile flies at supersonic speed, and its influences on seeker’s image. A model for both CFD simulation and wind tunnel experiments used is designed. The CFD simulation is as same as what have done in part one. The simulation results are prepared for further use. The wind tunnel experiments are done at another wind tunnel. This wind tunnel has bigger experiment part then the one used in part one. Besides that, the wind tunnel models are different too. One model is designed for dome’s surface pressure field along with time test experiments, and the other one is designed for dome’s surface temperature field along with time test experiments. Wind tunnel experiments are done with different speed and attack angles for both models. The results together with the simulation results got before are used for coupling simulation FEA software. After analyzing and computing, the conformal dome’s aero-optical effects are studied, and based on that the MgF2 dome and the seeker shell are designed. The last part of this chapter is conclusion, and some discussion about future dome design.
2. Simulated spherical dome wind tunnel experiments study
Most optical guided missiles use spherical domes, so the first wind tunnel experiment is about spherical dome. The purpose of this wind tunnel experiment is to value the veracity of CFD simulation compared with wind tunnel experiments and to find a way to analysis how the shock wave affect the seeker’s dome and optical system.
2.1 Model definition The model of CFD and wind tunnel should be the same, and for this study dome is the only one who will be studied. So the model is designed like below. The model is composed by
Fig. 1. CFD simulation model
www.intechopen.com

Wind Tunnel Experiments for Supersonic Optical-electrical Seeker’s Dome Design
663
three parts. The first part is half of a spherical, and the diameter of the spherical is 100mm. The second part is a column, and its diameter is 100mm with a length of 300mm. The last part is a round platform. The model is shown in figure 1. The first part is the simulated dome , and the last two parts represent body. The wind tunnel model is made by 30CrMnSiA as in figure 2.
Fig. 2. Wind tunnel model
2.2 Grid generation The first step to build the grid is to define the outflow area of the model. The outflow figure is shown in figure 3.
Fig. 3. The outflow of the dome
For compare, there are four kinds of grid used in this simulation. First, the structure grid is used for the dome’s grid as in figure 4. The black part is the dome and the body. The yellow grid is symmetry boundary, and the red grid is outflow. And the un-structure gird, mix grid and polyhedra grid are shown in figure 5 figure 6 and figure 7.
www.intechopen.com

Wind Tunnels and Experimental Fluid Dynamics Research
664
Fig. 4. Grid of the simulation dome outflow
Fig. 5. Un-structure grid
www.intechopen.com

Wind Tunnel Experiments for Supersonic Optical-electrical Seeker’s Dome Design
665
Fig. 6. Mix grid
Fig. 7. Polyhedra grid
www.intechopen.com

Wind Tunnels and Experimental Fluid Dynamics Research
666
2.3 CFD setup The flow solver uses a finite-volume technique with multi-zone method to solve multi-dimensional flow in a body-fitted grid system[8]. The blending of density- and pressure-based numerical methodology in the code allows efficient computation of compressible flow regimes. For turbulent flow computations, the Partially-Average Navier-Stokes (PANS) technique was implemented in the k-ε model[9,10].
2.4 Wind tunnel experiment The wind tunnel experiment is done in trisonic wind tunnel of China Academy of Aerospace and Aerodynamics (CAAA). This wind tunnel is an intermittent semireturn type with Mach number ranging from 0.4 to 4.5. The cross area of the test section is 0.6m×0.6m
and the length is 1.575m. The flow quality in the wind tunnel is satisfactory and completely up to the national standards of high speed wind tunnel. This tunnel has steady performance characters[11]. The experiment is shown in figure 8. The model is fixed on the “force-balance” and can be seen though the view window.
Fig. 8. Spherical dome wind tunnel experiment
2.5 Results 2.5.1 wind tunnel experiment da ta processing and precision On the assumption that the air flow from front area to experiment area is isentropic process. So the total pressure and total temperature of experiment area are equal to front area. The effects of the wind tunnel model and balance’s self weigh has been modified. The RMS random error is shown in table 1.
2.5.2 Wind tunnel results and analysis As the data of the wind tunnel experiments are a great many, the data is shown in figures. Normal force coefficient with attack angle is shown in figure 9.
www.intechopen.com

Wind Tunnel Experiments for Supersonic Optical-electrical Seeker’s Dome Design
667
ae cne cafe cabe
±0.02° ±0.0010 ±0.0050 ±0.0060
Cze 0mze 0mye mxe
±0.0020 ±0.0005 ±0.0005 ±0.0004
Table 1. RMS random error
Fig. 9. Normal force coefficient with attack angle
Normal force coefficient with Mach number is shown in figure 10.
Fig. 10. Normal force coefficient with Mach number
www.intechopen.com

Wind Tunnels and Experimental Fluid Dynamics Research
668
Lengthwise pressure centre coefficient is shown in figure 11.
Fig. 11. Lengthwise pressure centre coefficient
Front axial force coefficient is shown in figure 12.
Fig. 12. Front axial force coefficient
2.5.3 CFD results There are four kinds of grid. The first step is to value which kind of grid is more suitable for
this dome CFD simulation. The drag comparison table is shown in table 2.
Compared with the wind tunnel experiments‘ result, the structire grid is more suitable for this
kind of simulation. Then using the structure grid, more CFD simulations have been done. And
we can get the precision of CFD simulation. The comparison table is shown in table 3.
www.intechopen.com

Wind Tunnel Experiments for Supersonic Optical-electrical Seeker’s Dome Design
669
Speed (Ma) 0.6 0.95 1.5 2 2.6
Structure grid 12.915 109.535 486.925 950.299 1625.430
Un-structure grid 26.973 138.798 509.046 969.552 1704.025
Mix grid 30.069 158.682 508.339 978.657 1708.466
Polyhedra grid 17.373 111.899 501.365 970.484 1672.004
Table 2. Drag comparison table
CFD Wind tunnel error
0.4Ma 4°
Drag 74.6 70.5 5%
Lift 289.9 272.3 6%
Pressure centre 1306 1418 7.8%
0.6Ma 6°
Drag 169.3 149.4 13%
Lift 1016.6 982.9 3.5%
Pressure centre 1362 1448 6%
0.8Ma 8°
Drag 308.1 272.7 13.2%
Lift 2643.2 2569.1 2.9%
Pressure centre 1526 1457 4.5%
1.1Ma 4°
Drag 1367.9 1164.5 17%
Lift 2815.4 2640.7 6%
Pressure centre 1561 1408 10%
1.5Ma 0°
Drag 2619.4 2289.3 14%
Lift -43 0 -
Pressure centre 1182 1294 9%
2Ma 2°
Drag 4349.9 4154.2 3.8%
Lift 2198.3 2594.6 15%
Pressure centre 1528 1434 6.5%
2.5Ma 5°
Drag 6374.3 6260.2 0.98%
Lift 8220.2 8462.9 2.9%
Pressure centre 1497 1462 2.4%
3Ma 10°
Drag 8372.5 8591.5 2.5%
Lift 23255.2 23469.4 0.9%
Pressure centre 1529 1471 3.9%
Table 3. CFD and wind tunnel experiments comparison table
The biggest error is the drag value at Mach 1.1 attack angle 4°, and the best CFD simulation is the lift value at Mach 3 attack angle 10°. The average drag error is 8.685%, the average lift value is 5.314%, and the average pressure centre value is 6.263%. Accoding these results, the CFD simulation is good enough for dome design.
2.5.4 CFD contours In this experiment, the outline of shock wave can be seen clearly, and accurate aero-dynamic force of all kinds of flight condition are obtained. The compare of the shock wave which is shown in Figure 13 can prove the simulation is accurate. After this experiment, the density field of the outflow can be obtained.
www.intechopen.com

Wind Tunnels and Experimental Fluid Dynamics Research
670
Fig. 13. Shock wave comparison figure
2.6 Equivalent lens deisign The Lorentz-lorenz formula provides a bridge linking Maxwell’s electromagnetic theory
with the micro substances[11]. The relationship between the flow-field density ρ and the
refractive index n is modeled by[12]:
2 1 1 22 32
nKGD
n r
æ ö÷-ç ÷ç =÷ç ÷ç ÷÷ç +è ø (1)
Here KGD is the G-D constant. Generally, the refractive index of air relies on the density in
normal temperature. If the temperature is very high, the index of refraction will be
dependent mainly on the temperature and components of fluids. This paper neglects the
influences of aerodynamic heating and ionization on the index and considers only the
effects of varying flow densities on the refractive index. Because the index of normal airflow
is approximately equal to 1, the G-D relationship can be gained by the following:
1 GDn K r= + (2)
Where ρ is the local density of outflow, and for visible light KGD is 0.22355[13]. Using the
formula above, the refractive index of the outflow can be obtained accurately. The density
field calculated by CFD is discrete, so the refractive index of outflow is discrete too. In that
case, the refractive is divided into three zones, and each of them has a equal refractive index.
The figure 14 shows the refractive index zones by different colors.
Thought the key points’ coordinates, the formulas of the two boundaries can be calculated.
Together with the refractive index, the two equivalent lenses are gotten. The inside lens(the
red zone in the above figure) has a refractive index of 1.004, 52.535702mm for radius and its
thickness is 2.535702mm. The outside lens(the yellow zone)’s refractive index is 1.010 with
the radius is 57.804844mm and the thickness is 5.269142mm.
2.7 Conclusions In this section, the spherical dome wind tunnel experiments have been done. By comparing
the result of CFD simulation and wind tunnel experiments, we can get that the average drag
error is 8.685%, the average lift error is 5.314%, and the average pressure centre error is
6.263%. The shock wave figures which are got from wind tunnel experiments and CFD
simulation are nearly the same. By using these results, the equivalent lens is designed for
missile’s dome design.
www.intechopen.com

Wind Tunnel Experiments for Supersonic Optical-electrical Seeker’s Dome Design
671
Fig. 14. The refractive index zones. The black lines are line of sight.
3. Simulated conformal dome wind tunnel experiments study
3.1 Backgroud
Conformal optics systems contain optical components such as windows or domes that a shape which reduces the effect of the atmosphere on system aerodynamic, mechanical, electrical or thermal performance. The most obvious application concept is that of a missile nose cone. Traditional missiles use a flat or spherical window covering an optical tracker or seeker. Neither of these shapes interacts well with the high-speed airflow across the front end of the missile. An optimum shape would be given by a vonkaiman tangent ogive, which provides a minimum drag front end to the airflow. Between the blunt spherical shape and the pointed ogival shape there is a continuum of shapes that permit reduced drag but do produce a range of optical aberration effects that must be compensated by elements following the missile front end window. The conformal dome has so many benefits, but there are some problem which should be considered first. When the missile flies at supersonic speed, the aerodynamic will make the dome’s shape change. Not only must the dome withstand high pressure and forces of hundreds of pounds during the high speed flight of the missile, it must also withstand severe thermal gradients from the increases in temperature at these speeds. The elevated temperatures heat the dome surface while the interior of the dome remains at a lower temperature, which causes thermal stress across the dome interior. The capability of the dome to withstand thermal stress is very important for dome design. So the conformal dome wind tunnel experiments are done to value how the aerodynamic and thermal affect the conformal dome.
3.2 Wind tunnel experiment model
The aim of this wind tunnel experiment is not the same as the spherical dome wind tunnel experiments. Differently, the aim of this wind tunnel experiment is to get the pressure and
www.intechopen.com
Wind Tunnels and Experimental Fluid Dynamics Research
672
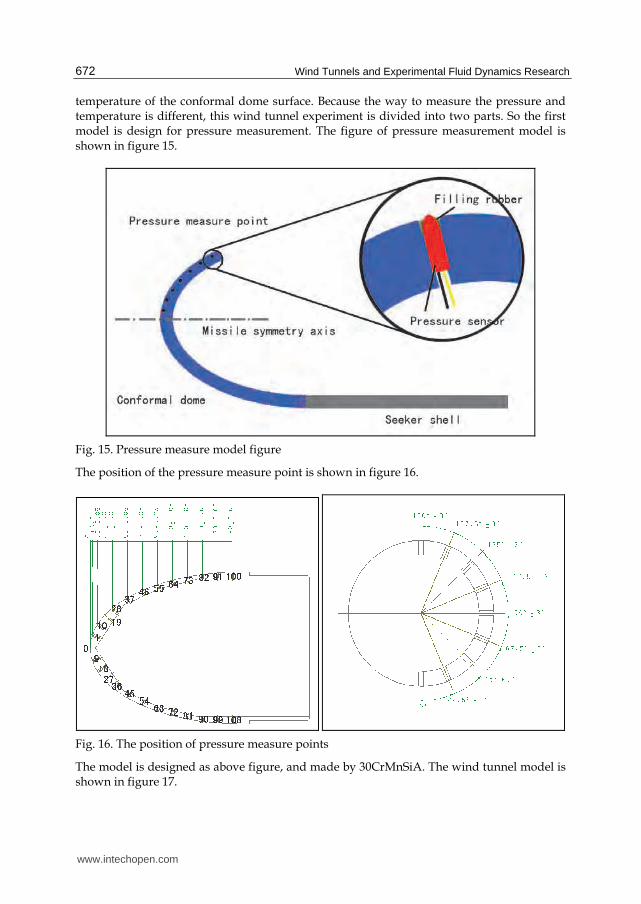
temperature of the conformal dome surface. Because the way to measure the pressure and temperature is different, this wind tunnel experiment is divided into two parts. So the first model is design for pressure measurement. The figure of pressure measurement model is shown in figure 15.
Fig. 15. Pressure measure model figure
The position of the pressure measure point is shown in figure 16.
Fig. 16. The position of pressure measure points
The model is designed as above figure, and made by 30CrMnSiA. The wind tunnel model is shown in figure 17.
www.intechopen.com

Wind Tunnel Experiments for Supersonic Optical-electrical Seeker’s Dome Design
673
Fig. 17. Pressure measure wind tunnel experiment model
The same as pressure measure model, the temperature measure model is designed as in
figure 18.
Fig. 18. Temperature measure wind tunnel model
The position of temperature measure point is shown in figure 19.
www.intechopen.com

Wind Tunnels and Experimental Fluid Dynamics Research
674
Fig. 19. The position of temperature measure point
The temperature measure wind tunnel experiment model is made by 30CrMnSiA, and shown in figure 20.
Fig. 20. Temperature measure wind tunnel model
3.3 CFD model and grid generation
According to the wind tunnel model above, the CFD model for simulation is designed and shown in figure 21.
www.intechopen.com

Wind Tunnel Experiments for Supersonic Optical-electrical Seeker’s Dome Design
675
Fig. 21. CFD simulation model
The structure grid generation of the conformal dome surface is shown in figure 22.
Fig. 22. Conformal dome surface grid
The outflow grid is shown in figure 23.
Fig. 23. The outflow grid
www.intechopen.com

Wind Tunnels and Experimental Fluid Dynamics Research
676
3.4 Wind tunnel experiments 3.4.1 Pressure measure wind tunnel experiment This wind tunnel experiment is get the pressure distributing of the conformal dome’s surface. The flight condition is according the missile’s attacking mission. So the wind tunnel experiments are taken at Mach number 2, 2.5 and 3. The attack angles are 0°, 10°, 20° and 25°. The wind tunnel experiment photo is shown in figure 24.
Fig. 24. Pressure measure wind tunnel experiment
3.4.2 Temperature measure wind tunnel experiment Temperature measure wind tunnel experiment is taken as the same condition as the pressure measure wind tunnel experiment. The wind tunnel experiment photo is shown in figure 25.
Fig. 25. Temperature measure wind tunnel experiment
www.intechopen.com

Wind Tunnel Experiments for Supersonic Optical-electrical Seeker’s Dome Design
677
3.5 Results
3.5.1 CFD simulation results The pressure data of conformal dome surface will be discussed later together with the real wind tunnel data. The figure of static pressure is shown in figure 26. The attack angle are 10°, 20°, 30° and 40°.
Fig. 26. Static pressure contour
Studying the figure above, it is clearly seen that when missile flies at one speed such as 3Ma the angle between shock wave and the missile body is becoming smaller when the attack angle goes higher. The high pressure zone(the red and orange aera) gets larger. The windward surface and the leeward surface are under different pressure load, so it is very important to consider this uneven force in conformal dome design section. The static temperature figure is shown in figure 27. The attack angle is 20°, and the mach number is 2, 2.5, and 3.
Fig. 27. Static temperature contour
3.5.2 Wind tunnel results The conformal dome surface pressure data of 2Ma is shown in figure 28. The attack angles are 0°, 10°, 20° and 25°.
www.intechopen.com

Wind Tunnels and Experimental Fluid Dynamics Research
678
0 20 40 60 80 100 1200
2
4
6
8
10
12
14
16x 10
4
Point number
Pre
ssur
e(P
a)
Attack angle=0°
0 20 40 60 80 100 1200
2
4
6
8
10
12
14
16x 10
4
Point number
Pre
ssur
e(P
a)
Attack angle=10°
0 20 40 60 80 100 1200
2
4
6
8
10
12
14
16x 10
4
Point number
Pre
ssur
e(P
a)
Attack angle=20°
0 20 40 60 80 100 1200
2
4
6
8
10
12
14
16x 10
4
Point number
Pre
ssur
e(P
a)
Attack angle=25°
Fig. 28. Conformal dome surface pressure data of 2Ma
The data of 2.5Ma is shown in figure 29. The attack angle is the same as 2Ma.
0 20 40 60 80 100 1200
2
4
6
8
10
12
14
16x 10
4
Point number
Sta
tic P
ress
ure(
Pa)
Attack angle=0°
0 20 40 60 80 100 1200
2
4
6
8
10
12
14
16x 10
4
Point number
Sta
tic P
ress
ure(
Pa)
Attack angle=10°
0 20 40 60 80 100 1200
2
4
6
8
10
12
14
16x 10
4
Point number
Sta
tic P
ress
ure(
Pa)
Attack angle=20°
0 20 40 60 80 100 1200
2
4
6
8
10
12
14
16x 10
4
Point number
Sta
tic P
ress
ure(
Pa)
Attack angle=25°
Fig. 29. Conformal dome surface pressure data of 2.5Ma
www.intechopen.com

Wind Tunnel Experiments for Supersonic Optical-electrical Seeker’s Dome Design
679
The data of 3Ma is shown in figure 30.
0 20 40 60 80 100 1200
1
2
3
4
5
6
7
8
9
10x 10
4
Point number
Sta
tic P
ress
ure(
Pa)
Attack angle=0°
0 20 40 60 80 100 1200
1
2
3
4
5
6
7
8
9
10x 10
4
Point number
Sta
tic P
ress
ure(
Pa)
Attack angle=0°
0 20 40 60 80 100 1200
1
2
3
4
5
6
7
8
9
10x 10
4
Point number
Sta
tic P
ress
ure(
Pa)
Attack angle=0°
0 20 40 60 80 100 1200
1
2
3
4
5
6
7
8
9
10x 10
4
Point number
Sta
tic P
ress
ure(
Pa)
Attack angle=0°
Fig. 30. Conformal dome surface pressure data of 3Ma
The wind tunnel data is used for conformal dome design. The surface pressure is the input parameter of FEA. The surface pressure data is used to calculate the distortion of the conformal dome when it is under great load of outflow. But wind tunnel data can not provide all point value of pressure on the dome’s surface. So CFD simulation data is used when the wind tunnel data is not enough. In this situation, the accuracy of CFD simulation becomes significant in this study. In the above part, the accuracy of force is discussed. The pressure of
0 50 100 150 200 250 300 3500
5
10
15x 10
4
Positon(mm)
Sta
tic p
ress
ure(
Pa)
CFD
Wind tunnel data
Fig. 31. CFD and wind tunnel data comparison of 2.5Ma attack angle 0°
www.intechopen.com

Wind Tunnels and Experimental Fluid Dynamics Research
680
0 50 100 150 200 250 300 3500
2
4
6
8
10
12x 10
4
Ponit position(mm)
Sta
tic p
ress
ure(
Pa)
CFDCFDWind tunnelWind tunnel
Fig. 32. CFD and wind tunnel data comparison of 3Ma attack angle 20°
conformal dome’s generatrix will be compared to value whether the pressure data of CFD simulation is correct. Figure 31 shows the data of CFD and wind tunnel at 2.5Ma with the attack angle is equal to 0°, and figure 32 showns the comparison of condition 3Ma 20°. From the figures above, it is clearly seen that the wind tunnel data and the CFD simulation data match perfectly. This means that the CFD simulation data can be used for further design. The temperature data of the surface will not be shown here, because the data is processed in the way.
3.6 Conformal dome analysis
In the above study, we can get the exact pressure and temperature data of conformal dome’s surface from wind tunnel experiments and CFD simulation. This data is used for conformal dome’s FEA simulation. The purpose to progressing the FEA simulation is to value how the aerodynamic load and aerothermal affect the conformal dome’s performance. The shape of the dome will change when missile flies at different speed and attack angle. The conformal dome’s grid is shown in figure 33.
Fig. 33. Conformal dome grid
www.intechopen.com

Wind Tunnel Experiments for Supersonic Optical-electrical Seeker’s Dome Design
681
The temperature data of the dome’s surface is the input file of FEA simulation. The result of conformal dome’s temperature distribution is shown in figure 34. In this figure, we can get that along with the speed gets higher, the red area which means high temperature becomes larger.
Fig. 34. Conformal dome temperature
Through the equilant stress simulation, the conformal dome’s SEQV figure is got as shown in figure 35.
Fig. 35. Conformal dome equivalent stress simulation
www.intechopen.com

Wind Tunnels and Experimental Fluid Dynamics Research
682
These stresses caused by aerodynamic load make the dome’s shape change, and the some
shape’s change will bring the seeker’s optical system additional aberrations. For example,
the change of conformal dome’s shape at 2.5Ma speed 0° attack angle is put in optical design
software ZEMAX. The MTF change is shown in figure 36. The left figure is orginal MTF of
conformal optical system, and the right one is the MTF after dome’s shape change. The spot
diagram comparison is shown in figure 37.
Fig. 36. Conformal optical system MTF comparison
Fig. 37. Conformal optical system spot diagram comparison
4. Conclusion
In this chapter, two different kind of wind tunnel has been done. The first wind tunnel
experiment is about spherical dome. The experiment is done from 0.4Ma to 3Ma with the
attack angle from 0° to 10°. The comparison of force and shock wave figure ensure the
reliability of spherical dome wind tunnel experiment. The data of wind tunnel experiment is
used to study how aerodynamic affects the dome. The conclusion is the shock wave and the
outflow can be considered as one or several air lenses which loacts before the dome. So
when the missile flies, the ouflow of the dome will add aberration to the optical system. The
second wind tunnel experiment is about conformal dome which is foucs topic now. This
wind tunnel experiment is divided into two parts: pressure measurement wind tunnel
www.intechopen.com

Wind Tunnel Experiments for Supersonic Optical-electrical Seeker’s Dome Design
683
experiment and temperature measurement wind tunnel experiment. Besides, CFD
simulation is used when wind tunnel data is not enough. The comparison of the pressure of
conformal dome’s sureface shows that the CFD simulation has a very high accuracy. The
pressure and temperature data is the input file of conformal dome FEA simulation which is
used to value how the shape and temperature change. After simulation, the shape change
data is put in optical design software, and the MTF and spot diagram of optical system goes
down.
5. References
K. V. Ravi. Diamond Technology for Endo-KEW Seeker Windows. AIAA, 92-2801. Scott B., Mike B., & Scott D.. Recent Development in Finishing of Deep Concave, Aspheric,
and Plano Surfaces Utilizing the UltraForm 5-axes Computer Controlled. SPIE, 2009, Vol.7302, 73020U.
Paul E. M., Jon F., & Greg F.. High precision metrology of domes and aspheric optics. SPIE, 2005, Vol.5786, 112-121.
William P. K., Matthew B. D., & Robert S. L.. Measurement results for time-delayed source interferometers for windows, hemispherical domes, and tangent ogives. SPIE, 2009, Vol.7302, 73020R.
Thomas J. H., W. Lance R., & Leslie G.. A technique for transient thermal testing of thick structures. SPIE, 1997, Vol.3151, 73-91.
Claude A. K.. How Missile Windows Degrade the Noise-Equivalent Irradiance of Infrared Seeker Systems. SPIE, 1994, Vol.2286, 458-470.
Zhao N., Chang J., & Sun Z.. Summarize of Conformal Optics. SPIE, 2007, Vol.6624, 66241N. Juan M. Ceniceros, David A. Nahrstedt, & Y-C Hsia, et al.. Wind Tunnel Validation of a
CFD-Based Aero-Optics Model. AIAA, 2007-4011. Girimaji S. S., Abdol-Hamid K. S.. Partially-averaged Navier-Stokes Model for Turbulence:
Implementation and Validation. AIAA, 2005-502. Tosh A., Frendi A., & Girimaji S.. Partially Averaged Navier Stokes: A New Turbulence
Model for Unsteady Flows with Application to Acoustics. 11# AIAA/CEAS Aeroacoustics Conf, Monterey, CA, May 23-25, 2005.
http://www.bia701.co/html/e17fd0602.htm M Born & E. Wolf. Principles of Optics. Cambridge U. Press, 1999, 92-93. G. Havener. Optical Wavefront Variance: a Study on Analytic Modes in Use Today. AIAA,
92-0654. G. C. Li. Aero-optics. National Defense Industry Press, 2006. Xingqiao Ai, Xin Zhang, & Zhenhai Jiang, et al.. Modulation transfer function in seeker
camera limits resulting from missile flutter caused by aerodynamic force. ICIMA, 2010, 146-151.
Huhai Jiang, Qun Wei, Hongguang Jia. Analysis of impact of gyroscope synthetical error on an electric-optical stabilized control system. BMEI, 2010, 2623-2625.
Qun Wei, Hongguang Jia, Ming Xuan. Equivalent lenses of supersonic seeker’s outflow refractive index field obtained by simulation and experiment. SPIE, 2009, Vol.7156, 71561Q.
Wei Qun, Bai Yang, & Liu Hui. Optimized design of the inside surface of supersonic missile’s elliptical dome. SPIE, 2009, Vol.7384, 73840E.
www.intechopen.com

Wind Tunnels and Experimental Fluid Dynamics Research
684
Ai Xingqiao, Wei qun, Jia Hongguang. Dome design and coupled thermal-mechanical analysis of supersonic missile. SPIE, 2009, Vol.7506, 75061Q.
Wei Qun, Zhang Xin, & Jia Hongguang. The design of missile’s dome that fits both optical and aeordynamic needs. SPTE, 2010, Vol.7659, 76590F.
Jiang Zhenhai, Zhang Xin, & Ai Xingqiao. Gimbal displacement errors analysis on an electro-optical seeker. SPIE, 2010, Vol.7849, 784924.
Wei Qun, Ai Xingqiao, & Jiang Huhai. The optimize design of supersonic seeker’s dome. Optics and Precision Engineering, Vol.18, No.2, 384-389.
www.intechopen.com

Wind Tunnels and Experimental Fluid Dynamics ResearchEdited by Prof. Jorge Colman Lerner
ISBN 978-953-307-623-2Hard cover, 709 pagesPublisher InTechPublished online 27, July, 2011Published in print edition July, 2011
InTech EuropeUniversity Campus STeP Ri Slavka Krautzeka 83/A 51000 Rijeka, Croatia Phone: +385 (51) 770 447 Fax: +385 (51) 686 166www.intechopen.com
InTech ChinaUnit 405, Office Block, Hotel Equatorial Shanghai No.65, Yan An Road (West), Shanghai, 200040, China
Phone: +86-21-62489820 Fax: +86-21-62489821
The book “Wind Tunnels and Experimental Fluid Dynamics Research†is comprised of 33 chaptersdivided in five sections. The first 12 chapters discuss wind tunnel facilities and experiments in incompressibleflow, while the next seven chapters deal with building dynamics, flow control and fluid mechanics. Third sectionof the book is dedicated to chapters discussing aerodynamic field measurements and real full scale analysis(chapters 20-22). Chapters in the last two sections deal with turbulent structure analysis (chapters 23-25) andwind tunnels in compressible flow (chapters 26-33). Contributions from a large number of international expertsmake this publication a highly valuable resource in wind tunnels and fluid dynamics field of research.
How to referenceIn order to correctly reference this scholarly work, feel free to copy and paste the following:
Qun Wei, Hongguang Jia, Ming Xuan and Zhenhai Jiang (2011). Wind Tunnel Experiments for SupersonicOptical-Electrical Seeker's Dome Design, Wind Tunnels and Experimental Fluid Dynamics Research, Prof.Jorge Colman Lerner (Ed.), ISBN: 978-953-307-623-2, InTech, Available from:http://www.intechopen.com/books/wind-tunnels-and-experimental-fluid-dynamics-research/wind-tunnel-experiments-for-supersonic-optical-electrical-seeker-s-dome-design