wind tunnel test and aerodynamic damping study for ...€¦ · wind tunnel test and aerodynamic...
TRANSCRIPT
Wind Tunnel Test and Aerodynamic Damping Study for Galloping of Iced 6-bundled Conductors
Wen-juan Lou1) and *Jiang Yu2) 1), 2)
Institute of Structural Engineering, Zhejiang University, Hangzhou 310058, China 2)
ABSTRACT
A scaffolding spring suspension device which could adjust 3-DOF frequency was designed in wind tunnel. Wind tunnel test for galloping of an D-shape iced sectional model of 6-bundled conductors was carried out under three different attack angles and five different ratios of vertical to rotational natural frequency. 3-DOF motion state of iced conductor sectional model was recorded accurately by using monocular measuring technology under uniform wind field. The results of wind tunnel test and calculation which was carried out by the proposed galloping nonlinear solution of 3-DOF galloping response verified each other. Vertical or torsional aerodynamic damping identified by measured response and numerical simulation of galloping were compared with theoretical Den Hartog or Nigol aerodynamic damping. The corresponding influence of aerodynamic characteristic, natural vibration characteristic and wind speed on galloping characteristic and aerodynamic damping had been studied separately. The results of wind tunnel test indicate that conductors will show different galloping law due to different combination of both positive and negative value of Den Hartog coefficient or Nigol coefficient and different ratios of vertical to rotational natural frequency. It also indicates that galloping mechanism of single degree of freedom can’t predict three freedom coupled galloping.
1. INTRODUCTION
The galloping of transmission line is due to the change of aerodynamic parameter
after conductor covering ice,causing high amplitude low frequency self-excited vibration
by wind. Single or several half-wave vertical galloping is the main form of iced conductor
galloping. Eccentricity and aerodynamic coupling effect between different direction often
exist in actual iced conductor, so both significant horizontal and torsional galloping
occurs at the same time as vertical galloping happens. When galloping gets more
serious, it can cause interruptions in power supply, even tower collapse accident, which
1)
Professor 2)
Graduate Student
means an enormous economic cost. Therefore, it is quite essential to study the
galloping mechanism of iced bundled conductors for EHV transmission line. Based on
the unanimous recognized Den Hartog and Nigol galloping mechanism by domestic and
international scholar so far [1-3], the immediate cause of galloping on transmission line is
that the damping term expressed by aerodynamic force showed negative, that is to say
the essential condition of galloping is for aerodynamic damping ratio is less than zero.
Since aerodynamic damping ratio has many uncertainties, its mechanism of production
and influencing factor seem to have no clear conclusion, so the identification of
aerodynamic damping ratio which is under galloping condition could be conductive to
in-depth study on galloping mechanism.
So far, the research on galloping mainly focused on five aspects: galloping
mechanism[1~3], aerodynamic characteristic test[4], galloping test[5~7], galloping numerical
simulation[8] and galloping prevention measures[9]. As far as the galloping test is
concerned, transmission conductor has the characteristics of long span and small sag, it
is very difficult to design the aeroelastic model in wind tunnel which meet the similarity
principle of the whole span transmission line. Therefore, the segment model with spring
suspension has been widely adopted. Foreign scholars Keutgen & Lilien (2000)
stimulated vertical and torsional coupled galloping or pure vertical galloping in wind
tunnel by using spring system [5]. Muhammad (2008) adopted the way of combination of
iced 4-bundled conductors segment model and inhaul cable, proposed a galloping test
model which could consider the geometric nonlinear characteristics of transmission line
in some ways [6]. Domestic scholar Lou Wenjuan (2011) reproduced the beginning of
galloping in wind tunnel based on crescent shaped and D-shaped iced conductor as the
research objects, and the reliability of galloping analysis method based on the quasi
steady assumption was validated [7]. Liu Xiaohui (2011) examined the galloping
response characteristics of single and 4-bundled conductors by using similar
experimental methods, also validated the galloping numerical simulation method based
on results of experiments [8].
At the moment, as far as conductor aeroelastic model galloping test was concerned,
domestic and international scholars mostly validate the quasi steady assumption and
existing galloping mechanism against specific aerodynamic type, only a few scholars
recognize the aerodynamic damping through the process of iced conductor galloping
and proceed some related researches. Wang Xin(2011) simulated the galloping
phenomenon of iced conductor aeroelastic model in wind tunnel and also the
aerodynamic damping was identified[10], he studied the varying pattern and influencing
factor of aerodynamic damping, but still unable to explain why the galloping
phenomenon diverging from Den Hartog and Nigol galloping mechanism, moreover only
very few aerodynamic damping were given under certain conditions in his studies, there
is not so much research on the influencing factor and varying pattern. In the meantime,

vertical natural frequency of conductor aeroelastic model is mostly greater than 0.8 Hz
(actually low order natural vibration frequency of bundled conductors for EHV
transmission line is usually less than this value), also for the torsional natural frequency,
different value basically just considerate its condition which is much greater than vertical
natural frequency, there is not so much research on the influence of ratio of vertical to
rotational natural frequency on galloping characteristics, not to speak of the value of
horizontal natural frequency in the literature.
Given this, a D-shape iced sectional model of 6-bundled conductors was made. A
scaffolding spring suspension device which could adjust 3-DOF frequency was
designed in wind tunnel. 3-DOF motion state of iced conductor sectional model was
recorded accurately under uniform wind field in view of three typical combination of
positive/negative of Den Hartog coefficient and Nigol coefficient. The influence of
aerodynamic characteristic, natural vibration characteristic and wind speed on galloping
characteristic and aerodynamic damping had been studied. Aerodynamic damping
identified by measured response and numerical simulation of galloping were compared
with theoretical Den Hartog or Nigol aerodynamic damping. The results of wind tunnel
test explained galloping phenomena which traditional galloping mechanism couldn’t
explain.
2. WIND TUNNEL TEST FOR GALLOPING OF ICED 6-BUNDLED CONDUCTORS
2.1 Test device
The wind tunnel test was proceeded in Zhejiang University boundary layer wind
tunnel (ZD-1). The size of wind tunnel laboratory is 4m(width) × 3m(height) ×
18m(length), and the range of wind speed in test section is 3~55m/s. Aeroelastic
galloping test device of iced conductor sectional model which had three degrees of
freedom (i.e. vertical - torsional - horizontal) was constructed, as shown in Fig. 1. Iced
conductor sectional model connected to the support (hidden in wind guide plate with
wheel) through the spring suspension system and entered idle state in a wind tunnel
center position. The vertical, rotational and horizontal dynamic characteristics of
transmission line could be simulated by adjusting vertical spring stiffness, vertical spring
spacing, horizontal spring stiffness and model weight.

(a) Wind direction (b) Observation direction Fig. 1 Wind tunnel test system for galloping of aeroelastic model of iced conductor
Through combining with the result of aerodynamic force test of iced multi bundled
conductor [11], wind attack angle that instability was likely to happen could be confirmed
and adjusted based on Den Hartog vertical and Nigol rotational galloping mechanism.
Wind guide plate with wheel and guiding device were shifted in and set from both sides
of the test model along up and down guide rails. Testers could observe the motion state
of iced multi bundled conductor sectional model which was under the effect of wind field
from outside the wind tunnel, and also monitor the movement displacement time history
of the model in real time by means of monocular measuring technology.
In consideration of the specification limits and experimental safety of wind tunnel
laboratory, as part of the test equipment, the wind guide plate with wheel has the
reserved hole size of 0.6m × 0.3m. Once deducts the space occupation of cylindrical
connector (φ0.09m), the actual range of free translational motion of conductor model is
about vertical 0.5m, horizontal 0.2m, and its torsional angle is not restricted by the
reserved hole size.
2.2 Iced conductor model
The ice cross section, wind attack angle definition and aerodynamic parameters
definition of conductor model were all consistent with the aerodynamic force test of iced
6-bundled conductors that had already done before [11]. This experiment also use
uniform wind field. Both conductor and ice model made the choice of a plexiglass
production of goods. To make sure meeting the requirements of similitude ratio on the
unit length mass of sectional conductor model and actual transmission line which should
be 1:1, the weight of sectional model need to be controlled. Iced 6-bundled Conductors
referred to model regulation of 《 LGJ GB1179-83 》 , single conductor chose
LGJ-300/40(diameter 23.94mm), D-shape ice coating was consistent with simulated ice
shape of actual transmission line in Henan Jian mountain, the geometric dimensioning
and physical model as shown in Fig. 2. Definition of wind attack angle and
three-component force direction of D-shape iced 6-bundled conductors as shown in Fig.
3. The scope of wind attack angle in aerodynamic force test took 0~180°, an interval in
wind attack angle is 5°, now fitting of aerodynamic force test results [11] according to an
interval of 1°, Aerodynamic force coefficient under every wind attack angle of can be get
more accurately by using this way. The wind speed of aerodynamic force test chose
10m/s, and the wind speed of this test mostly chose 3~8m/s, but still within the scope of
wind speed of 3~10m/s. Based on the above reasons, Reynolds number of conductor
was mostly in the state of sub-critical region, different wind speed did not much affect
aerodynamic force of conductor. By the lift coefficient CL, drag coefficient CD and
torsional coefficient CM, Den Hartog coefficient and Nigol coefficient under every wind
attack angle α had been received, as shown in Fig. 4.

(a) Geometry size (b) Physical section
Fig. 2 Aeroelastic model of iced 6-bundled conductors
y
z
┍
FD
FL
M
375mm
┍
┒0
┡
┒0+┍-┡ Ur
U+z
y
0▲ wind angle
R┍+
Fig. 3 Definition of attack angle and three-component force coefficient
of iced 6-bundled conductors
Fig. 4 Den Hartog and Nigol coefficient of iced 6-bundled conductors
2.2 Test condition
A case study of transmission line with iced 6-bundled conductors, hypothetically,
the single span is 250m, the unit length mass of D-shape iced sub-conductor is about
2.10Kg/m as shown in Fig. 2. The tensioning force of conductor is 46.1KN after
conductor covering ice, The parameter of sub-conductor is according to model
LGJ-300/40 in 《LGJ GB1179-83》, whose A=338.99×10⁻⁶m2, E=73000×106N/m2,
GJ≈108.79N·m2/rad. The breaking force of model LGJ-300/10 conductor is 92.22KN,
based on 《Code for designing of 110~750kV overhead transmission line》, the upper
limit of conductor operational tension is 20 percent of the breaking force, while the
maximum tension in the lowest point of sag should not exceed 70 percent of the
breaking force in rare icing condition. Because of the D-shape ice coating we studied in
this paper belongs to heavy ice coating, which as shown in Fig. 2, therefore, the
conductor operational tension was assumed to be 50 percent of the breaking force (i.e.
46.1KN). According to the method of literature [12], the finite element model of single
span transmission line with iced 6-bundled conductors was established, and the first

nine order vibration characteristics of transmission line was received by calculation as
shown in Tab. 1.
Tab. 1 Vibration characteristics of single span transmission line of iced 6-bundled conductors
No. Natural
Frequency/Hz
Vibration
Direction
Vibration
Mode
No. Natural
Frequency/Hz
Vibration
Direction
Vibration
Mode
1 0.295 Horizontal 6 0.674 Torsional
2 0.353 Torsional 7 0.886 Horizontal
3 0.368 Vertical 8 0.889 Vertical
4 0.590 Vertical 9 1.002 Torsional
5 0.591 Horizontal
Parameters such as spring stiffness and model mass were set with the
above-mentioned single span transmission line with iced 6-bundled conductors as the
model sample, and also chose spring with smaller stiffness to simulate low natural
vibration frequency of conductor through comprehensive consideration of test safety
elements. By combining test conditions and theoretical calculation, the length of
conductor was set to 2.481m, and controlled the weight of conductor model system
(including suspension bar, connecting piece, spring and so on) with 30.4kg through
adjusting weight of each component. Total stiffness of the vertical spring is 400KN/m,
and total stiffness of the horizontal spring is 40KN/m. This test specially aimed at three
typical combinations of positive/negative of Den Hartog coefficient and Nigol coefficient,
studied the characters of galloping under different ratio of vertical to rotational natural
frequency and wind speed conditions by adjusting the vertical spring spacing. Working
condition was listed in Tab. 2, Parameters and dynamic characteristics of model were
listed in Tab. 3.
Tab. 2 Working condition and wind speed domain of galloping wind tunnel test
Wind attack angle/°
70 85 170
Den Hartog coefficient -1.86 3.04 -0.54
Nigol coefficient 33.98 -48.54 -9.88
Range of wind speed
for experimental design/
(m/s)
=/ 1.35y
f f
3~7 3~6 3~6
=/ 1.00y
f f
3~7 3~7 3~6
=/ 0.89y
f f
3~7 3~6
=/ 0.80y
f f
3~7 3~6
/ =0.65y
f f
3~8 3~7 3~6
Note: Wind speed for experimental design will gradually upgrade with 1m/s

Tab. 3 Parameters and dynamic characteristics of aeroelastic model of iced 6-bundled conductors
Spacing of vertical spring/m 0.34 0.54 0.64 0.74 0.94
Vertical natural frequency/Hz 0.58 0.58 0.58 0.58 0.58
Torsional natural frequency/Hz 0.43 0.58 0.65 0.72 0.89
Horizontal natural frequency/Hz 0.57
Vertical damping ratio(10-2) 0.15 0.41 0.15 0.15 0.14
Torsional damping ratio(10-2) 1.18 1.25 0.78 0.66 0.48
Horizontal damping ratio(10-2) 0.25
3. 3-DOF GALLOPING RESPONSE NONLINEAR SOLUTION
Equations of motion of three degree of freedom system to calculate galloping
response Wind MU CU KU F was derived by Lagrange second equation of motion in
this paper while the wind tunnel test was in progress, as shown in Eq. (1)
y y y y
z z z z
y z z M
my S c y k y f
mz S c z k z f
S y S z J c k S g f
(1)
And compared the calculation results with test results to provide mutual authentication
between those two. In Eq. (1), m is unit length mass; yS and zS are respectively unit
length static moment, relative to z axis and y axis respectively; J is unit length
moment of inertia; yk , zk and k are respectively unit length vertical stiffness,
horizontal stiffness and torsional stiffness respectively; 2y y yc k m , 2z z zc k m and
2c k J are respectively structure damping on y direction, z direction and
direction respectively. Above-mentioned parameters need further test measurement to
be obtained. The direction of y , z and is consistent with the definition of Fig. 3.
The wind load term can be expressed as Eq. (2).
2
2
2 2
0.5 cos sin
0.5 sin cos
0.5 C
y r L D
z r L D
r M
f U D C C
f U D C C
f U D
(2)
In Eq. (2),
222
rU U z R y , U is Inflow wind speed; aerodynamic force coefficient
LC , DC and MC are related to wind attack angle ; 0 + , 0 and are
respectively the initial wind attack angle and torsional angle of conductor section model,
respectively; =arctan(( / ))R y U z ; is air density; D is conductor equivalent
diameter.
And then made use of Newmark-β method, The displacement of 1i step which
was 1
1 1 1ˆ
i i i i
U K P U can be computed directly by equivalent stiffness and load (i.e.

1 12
ˆ
( )i i
tt
M CK K ,
1 1 2
11 (1 ) 1
2 2
i i i
i i i i it
t tt
U U UP F M U C U U ) .
The simplified galloping calculation which was involved in this test all assigned a value
of total duration to 600 seconds, time step was 0.005 seconds. If the divergence of
motion response of conductor became very slow under some kinds of working
conditions, then total duration of calculation should be simply increased as appropriate.
Calculated results of each working condition were listed in section 4.2.
4. ANALYSIS OF WIND TUNNEL TEST RESULTS OF CONDUCTOR GALLOPING
4.1 Treatment of test results
As a direct test result, the time history of conductor displacement response was
measured by six mark points which were on both sides of suspension bar (as shown in
Fig. 1(b) and Fig. 5). Iced conductor galloping displacement response could be obtained
by averaging the displacement response of any one of those marked points which were
selected on both sides of suspension bar, as shown in Eq. (3).
, , 1
, c ,
1 2
( ( ) ( ) )( ) ( )
vertical right vertical left
vertical onductor vertical left
y t y ty t y t
(3)
And the corresponding torsional angle can be expressed as Eq. (4).
, ,
1 2
( ( ) ( ) )( )
vertical right vertical left
conductor
y t y tt
(4)
In Eq. (3) and Eq. (4), , ( )vertical lefty t and , ( )vertical righty t are respectively the time history of
displacement response of any one of those marked displacement points which were
selected on both sides of suspension bar, 1 and 2 are respectively the distance
from the center of suspension bar to the selected marker point.
Wi nd
hor i zont al,r i ght
y
y
ver t i t al,r i ght
hor i zont al,l ef t
y
y
ver t i t al,l ef t
⊇1 ⊇2
Fig. 5 Calculation diagram of motion response of conductor model
4.2 Galloping displacement
By adjusting model to the unstable wind attack angle which was according to
Den Hartog galloping mechanism and Nigol galloping mechanism, and also by adjusting
vertical spring spacing, various galloping conditions of D-shape iced 6-bundled
conductors under different ratios of vertical to rotational natural frequency couled be
stimulated.
4.2.1 70° wind attack angle(Den<0、Nigol>0)
The tested and calculated vertical displacement amplitude of iced 6-bundled
conductors under wind attack angle 70° with different wind speed were listed in Tab. 4,

at the moment, Den Hartog coefficient was negative, Nigol coefficient was positive. It is
important to note that all the vertical displacement amplitude that mentioned in this
paper meant the extreme displacement from the highest to the lowest point of response
in a single cycle when the conductor motion reached steady state, so is the torsional
angle. Besides, due to the restriction in conditions of wind tunnel laboratory and the
safety of test, amplitude of galloping limit cycle under all the working conditions couldn’t
be measured.
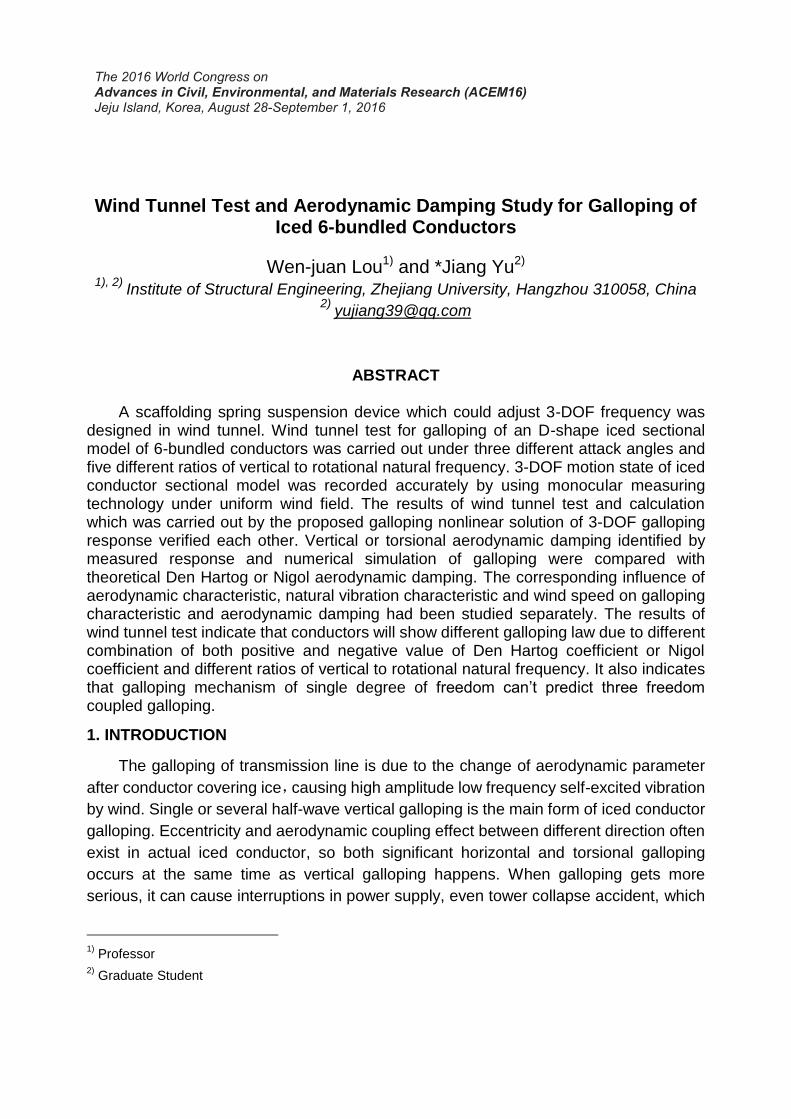
The tested and calculated galloping time history responses of conductor model
under typical working conditions were given in Fig. 6~8, two results both from test and
from calculation coincided quite well, and amplitude tended to be much closer to each
other, the increase form of response agreed. Thus it can be seen that from the tested
galloping response, under wind attack angle 70°, when yf f , vertical response was
the only exist while galloping; when yf f , a certain torsional response (5°~10°, as
shown in Fig. 6) existed as well while the model galloping gave priority to vertical
response, that was basically matched with Den Hartog galloping mechanism. When
/ 1yf f , vertical displacement amplitude of conductor model increased with wind speed
increasing, which was consistent with Den Hartog galloping mechanism. But when
/yf f was approaching and getting close to 1.35, the model wouldn’t had a significant
displacement response after wind speed reached 5m/s, moreover, the motion of model
would still attenuate rapidly after giving initial vertical displacement artificially at this
point. It indicated that the wind speed which could cause galloping was in an interval
(about 2~5m/s), no galloping would exist when wind speed got too high or too low. This
galloping wind speed range coincided with the existing actual observation phenomenon,
but it couldn’t be predicted by Den Hartog galloping mechanism, it was also the
disadvantage of Den Hartog galloping mechanism with single degree of freedom.
Tab. 4 Tested and calculated vertical displacement amplitude of iced 6-bundled conductors under wind attack angle 70°
yf
f
Measured
wind speed
(m/s)
Experimental
value
(m)
Calculate
value
(m)
yf
f
Measured
wind speed
(m/s)
Experimental
value
(m)
Calculate
value
(m)
1.35
2.24 0.143(-) 0.227
0.80
2.24 0.357 0.232
3.76 0.105(-) 0.427 3.76 0.446 0.441
4.99 × 0.348 4.99 0.481(*) 0.610
5.99 × × 5.99 0.456(*) 0.744
6.75 × × 6.75 0.450(*) 0.843
1.00
2.28 0.244 0.122
0.65
2.24 0.298 0.236
3.86 0.322 0.255 3.76 0.413 0.446
5.02 × 0.211 4.99 0.482(*) 0.619
5.99 × × 5.99 0.420(*) 0.760
6.79 × × 6.75 0.406(*) 0.867
0.89
2.24 0.363 0.232
3.76 0.448 0.440
4.99 0.473(*) 0.608
5.99 0.438(*) 0.740
6.75 0.384(*) 0.837
Note: “(-)” means that the movement can not reach a stable state in 3 minutes; “(*)” means that the movement limit
is beyond reserved hole; “×” means no galloping.
(a)Vertical displacement (b)Torsional angle (c)Motion trail Fig. 6 Tested galloping time history response of conductor model
under wind attack angle 70° (U=2.28m/s, yf f )
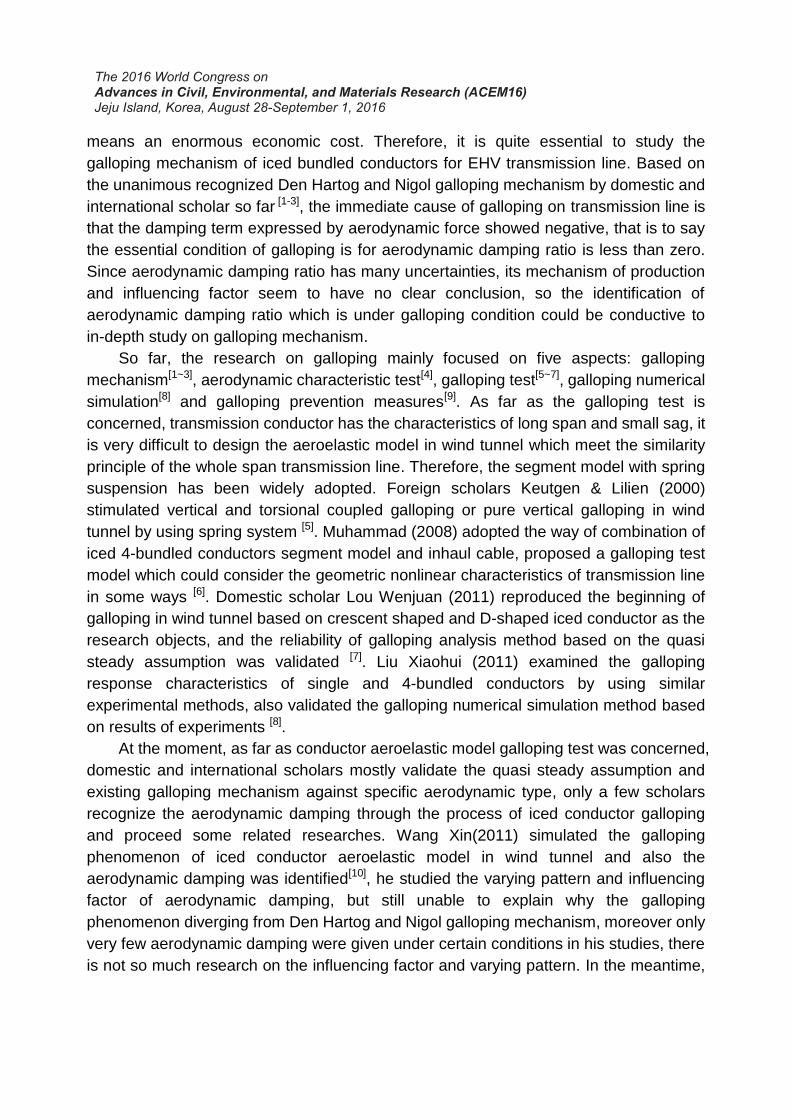
(a)Vertical displacement (b)Torsional angle (c)Motion trail Fig. 7 Calculated galloping time history response of conductor model
under wind attack angle 70° (U=2.28m/s, yf f )
(a)Tested value (b)Calculated value Fig. 8 Tested and calculated galloping vertical time history response of conductor model
under wind attack angle 70° (U=2.28m/s, 0.65yf f )
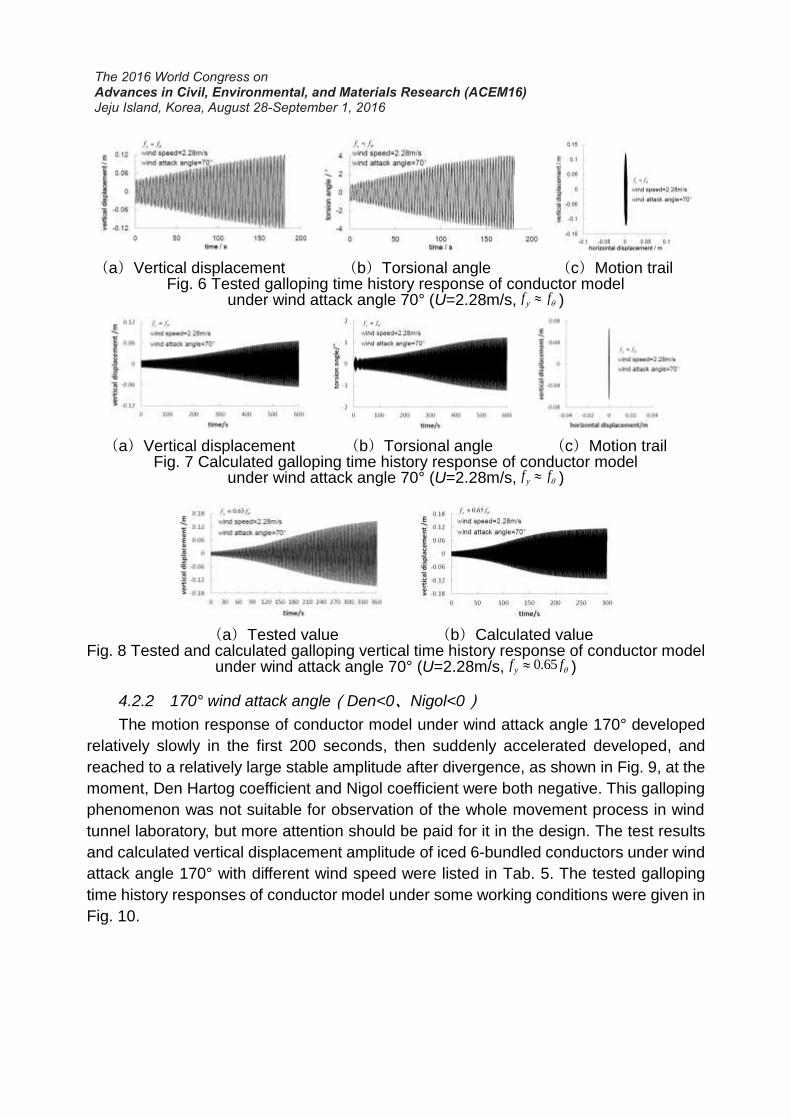
4.2.2 170° wind attack angle(Den<0、Nigol<0)
The motion response of conductor model under wind attack angle 170° developed
relatively slowly in the first 200 seconds, then suddenly accelerated developed, and
reached to a relatively large stable amplitude after divergence, as shown in Fig. 9, at the
moment, Den Hartog coefficient and Nigol coefficient were both negative. This galloping
phenomenon was not suitable for observation of the whole movement process in wind
tunnel laboratory, but more attention should be paid for it in the design. The test results
and calculated vertical displacement amplitude of iced 6-bundled conductors under wind
attack angle 170° with different wind speed were listed in Tab. 5. The tested galloping
time history responses of conductor model under some working conditions were given in
Fig. 10.

(a)Tested value (b)Calculated value Fig. 9 Tested and calculated galloping vertical time history response of conductor model
under wind attack angle 170° (U=3.76m/s, 1.35yf f )
(a) yf f (b) 0.80yf f (c) 0.65yf f Fig. 10 Tested galloping time history response of conductor model
under wind attack angle 170° (U=3.76m/s)
Tab. 5 Test results and calculated vertical displacement amplitude of iced 6-bundled conductors under wind attack angle 170°
yf
f
Measured
wind speed
(m/s)
Whether
galloping
(yes or no)
Calculate
value
(m)
yf
f
Measured
wind speed
(m/s)
Whether
galloping
(yes or no)
Calculate
value
(m)
1.35
2.24 yes 1.559
0.80
2.24 yes ×
3.76 yes 3.004 3.76 yes 3.027
4.99 yes 4.157 4.99 yes 4.155
5.99 yes 5.077 5.99 no ×
1.00
2.24 yes ×
0.65
2.24 yes ×
3.76 yes 1.494 3.76 yes 3.055
4.99 yes 2.451 4.99 yes 4.198
5.99 yes 3.226 5.99 yes 5.128
0.89
2.24 yes ×
3.76 yes ×
4.99 no ×
5.99 no ×
Note: “×” means no galloping.
Thus it can be seen that from the tested galloping response, similar to the test result
under wind attack angle 70°, when yf f , vertical response was the only exist while
galloping; when yf f , a certain torsional response (test observation amplitude was
less than 10°) existed as well while the model galloping gave priority to vertical response,
that was basically matched with Den Hartog galloping mechanism. When / 1yf f ,
vertical displacement amplitude of conductor model increased with wind speed
increasing, which was consistent with Den Hartog galloping mechanism. But when
/yf f was 0.80 or 0.89, the model wouldn’t had a significant displacement response
after wind speed reached 5m/s, moreover, the motion of model would still attenuate
rapidly after giving initial vertical displacement artificially at this point. It indicated that the
wind speed which could cause galloping was in an interval (about 2~5m/s), no galloping
would exist when wind speed got too high or too low. Once again, it indicated the
disadvantage of Den Hartog galloping mechanism with single degree of freedom.
Additional instructions: 1) when / =0.89yf f , probably due to the range of galloping wind
speed was too small or it was more sensitive to changes in the vicinity of this ratio of
vertical to rotational natural frequency, so galloping motion was failed to be simulated
and calculated; 2) when / =0.65yf f , due to the smallish torsional stiffness of model
system and the biggish torque, wind attack angle of initial state had been transferred to
165°,which deviated from the original set of 170°, so the test results under this working
condition were only for reference.
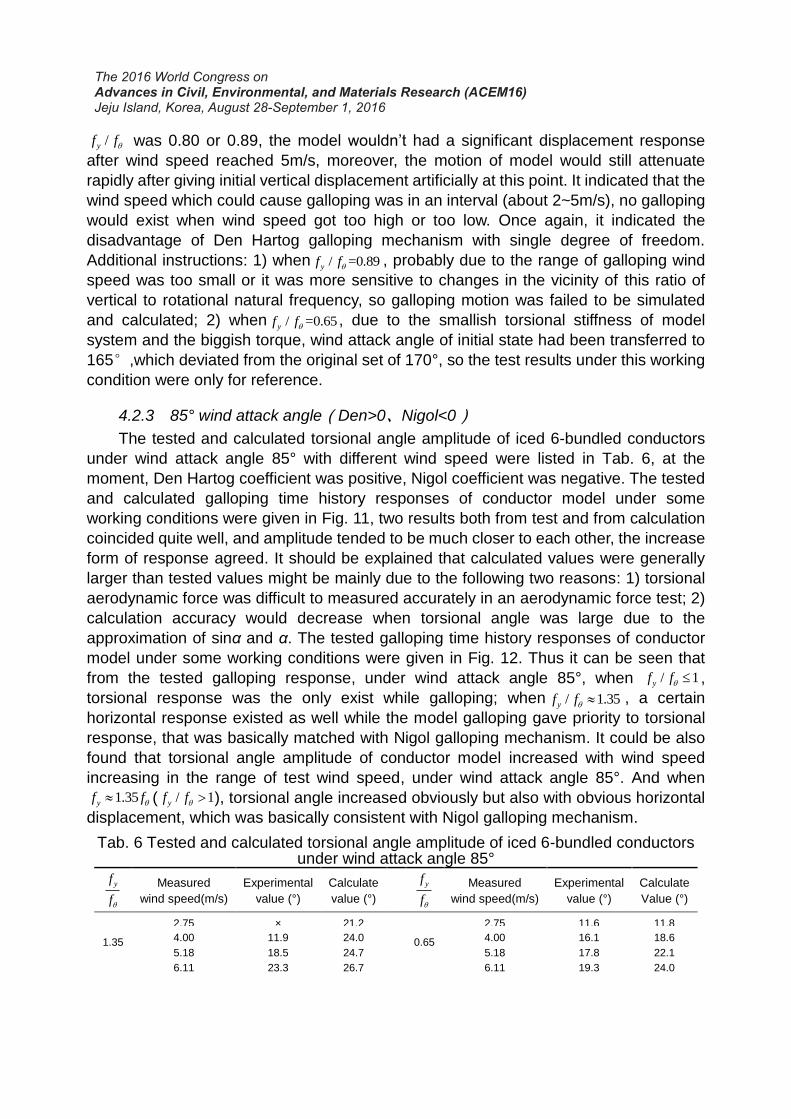
4.2.3 85° wind attack angle(Den>0、Nigol<0)
The tested and calculated torsional angle amplitude of iced 6-bundled conductors
under wind attack angle 85° with different wind speed were listed in Tab. 6, at the
moment, Den Hartog coefficient was positive, Nigol coefficient was negative. The tested
and calculated galloping time history responses of conductor model under some
working conditions were given in Fig. 11, two results both from test and from calculation
coincided quite well, and amplitude tended to be much closer to each other, the increase
form of response agreed. It should be explained that calculated values were generally
larger than tested values might be mainly due to the following two reasons: 1) torsional
aerodynamic force was difficult to measured accurately in an aerodynamic force test; 2)
calculation accuracy would decrease when torsional angle was large due to the
approximation of sinα and α. The tested galloping time history responses of conductor
model under some working conditions were given in Fig. 12. Thus it can be seen that
from the tested galloping response, under wind attack angle 85°, when / 1yf f ,
torsional response was the only exist while galloping; when / 1.35yf f , a certain
horizontal response existed as well while the model galloping gave priority to torsional
response, that was basically matched with Nigol galloping mechanism. It could be also
found that torsional angle amplitude of conductor model increased with wind speed
increasing in the range of test wind speed, under wind attack angle 85°. And when
1.35yf f ( / 1yf f ), torsional angle increased obviously but also with obvious horizontal
displacement, which was basically consistent with Nigol galloping mechanism.
Tab. 6 Tested and calculated torsional angle amplitude of iced 6-bundled conductors under wind attack angle 85°
yf
f
Measured
wind speed(m/s)
Experimental
value (°)
Calculate
value (°)
yf
f
Measured
wind speed(m/s)
Experimental
value (°)
Calculate
Value (°)
1.35
2.75 × 21.2
0.65
2.75 11.6 11.8
4.00 11.9 24.0 4.00 16.1 18.6
5.18 18.5 24.7 5.18 17.8 22.1
6.11 23.3 26.7 6.11 19.3 24.0

1.00
2.75 16.0 8.82
4.00 12.4 14.8
5.18 13.3 18.0
6.11 15.2 20.1
Note: “×” means no galloping.
(a)Tested value (b)Calculated value
Fig. 11 Galloping torsional time history response of conductor model under wind attack angle 85° (U=3.40m/s, 0.65yf f )
(a)U =5.18m/s (b)U =6.11m/s (c)U =7.01m/s
Fig. 12 Tested galloping torsional time history response of conductor model Under wind attack angle 85°( 0.65yf f )
4.3 Analysis of galloping phenomenon
(1) Each galloping forms of conductor sectional model under various working
conditions were listed in Tab. 7. In Tab. 7, “Vertical” meant pure vertical galloping,
“Torsional” meant pure torsional galloping, “Vertical & Torsional” meant vertical and
torsional coupled galloping, “Torsional & Horizontal” meant torsional and horizontal
coupled galloping, “(~)” meant that wind speed which could cause galloping was in a
certain interval.
Tab. 7 Galloping form summary of iced 6-bundled conductors
Wind attack angle/°
70 85 170
Den Hartog coefficient -1.86 3.04 -0.54
Nigol coefficient 33.98 -48.54 -9.88
=/ 1.35y
f f
Vertical(~) Torsional & Horizontal Vertical
=/ 1.00y
f f
Vertical & Torsional (~) Torsional Vertical & Torsional
=/ 0.89y
f f
Vertical Vertical (~)
=/ 0.80y
f f
Vertical Vertical (~)
/ =0.65y
f f
Vertical Torsional Vertical
(2) Conductor mainly showed vertical galloping under specific wind attack angle
that Den Hartog coefficient was negative, but conductor showed two opposite galloping

characteristics when ratio of vertical to rotational natural frequency was greater than or
equal to 1 and less than 1 because of the difference of positive and negative of Nigol
coefficient.
(3) Under specific wind attack angle that Nigol coefficient was negative and Den
Hartog coefficient was positive, conductor mainly showed torsional galloping, and
torsional angle amplitude increased with wind speed increasing. When the ratio of
vertical to rotational natural frequency was greater than 1, conductor showed torsional
and horizontal coupled galloping, and torsional angle amplitude was larger.
5. IDENTIFICATION OF AERODYNAMIC DAMPING
Due to the galloping response mainly comes from the average component of wind
excitation, and the fluctuating component of wind excitation has very limited influence on
it. Transmission line dynamic model was simplified to linearized aeroelastic model which
only had three degrees of freedom (i.e. vertical, horizontal and torsional). Galloping
response of aeroelastic model mostly displayed four modes as pure vertical, pure
torsional, vertical-torsional coupled and torsional-horizontal coupled. Therefore, the
tested signal of conductor galloping response was only derived from one mode
response, and Hilbert transformation could be performed directly on it to get Hilbert
spectrum, and then aerodynamic damping could be identified.
The Hilbert transformation was proceeded on signal of conductor galloping
response ( )x t , as shown in Eq. (5).
1 ( )( )
x tx t d
t
(5)
The analytic signal corresponding to x(t) was z(t), as shown in Eq. (6).
00
0( ) ( ) ( ) di ttz t x t ix t A e e
(6)
In Eq. (5), 0 is system natural angular frequency, d is damping natural angular
frequency, is system damping ratio. 0
0 0ln( ) /t
d A e dt
and 0( ) /d dd t dt can
be obtained by respectively introducing logarithm and differential operator to amplitude 0
0
tA e
and phase angle 0d t in Eq. (6). Expression of system natural frequency and
system damping ratio could be got by plugged 0 and d into 2
0= 1d , as
shown in Eq. (6) and Eq. (7). 2 2
0
0
( ) ( )
2
df
(7)
2
0
2 2
0
( )
( ) ( )d
(8)
5.1 Aerodynamic damping of Den Hartog and Nigol galloping mechanism

When conductor model produced pure vertical galloping in the wind tunnel test,
based on Den-Hartog mechanism, theoretical expression of vertical aerodynamic
damping ratio which was expressed by logarithmic attenuation relationship at the start
stage of galloping was available, as shown in Eq. (9).
, ,
1( ) / ( )
8
L
y Den Aero D y
CUD C mf
(9)
When Den Hartog coefficient was less than 0, system aerodynamic damping ratio may
be less than 0, which would lead to conductor vertical galloping. When conductor model
produced torsional galloping, based on Nigol mechanism, the theoretical expression of
torsional aerodynamic damping ratio which was expressed by logarithmic attenuation
relationship at the start stage of galloping was available, as shown in Eq. (10). 2
, ,
1= / ( )
8
M
Nigol Aero
CURD Jf
(10)
When Nigol coefficient was less than 0, system aerodynamic damping ratio may be less
than 0, which would lead to conductor torsional galloping. But for vertical-torsional,
torsional-horizontal or vertical-horizontal–torsional coupled galloping, due to the
coupling effect between multiple degrees of freedom, whose mechanism was more
complicated, so it would be difficult to provide an explicit expression of aerodynamic
damping ratio of a single degree of freedom.
5.2 Aerodynamic damping identified by tested galloping response
As it was different from theoretical aerodynamic damping ratio, aerodynamic
damping identified by tested galloping response was the equal of averaging processing
the aerodynamic damping which was changing constantly for some time after the start
stage of galloping. In order to make aerodynamic damping comparable under different
working conditions and different wind speed, this paper provided for following
regulations on interception range of galloping response signal in identifying
aerodynamic damping: identifying total duration was derived from a set interval since
initial moment of galloping to the moment when galloping basically reached the
maximum amplitude.
Galloping of D-shape iced 6-bundled conductors would happen under three wind
attack angles which were listed in Tab. 2, both two aerodynamic damping ratio were
listed in Tab. 8~10, the one which was identified by galloping time history response
based on galloping test and numerical calculation respectively, the other one was
calculated by traditional galloping mechanism. Vertical motion was mainly stimulated
under 70° and 170° wind attack angle because of Den Hartog galloping mechanism,
therefore only aerodynamic damping ratio of vertical response signal was identified; and
torsional motion was mainly stimulated under 85° wind attack angle because of Nigol
galloping mechanism, therefore only aerodynamic damping ratio of torsional response
signal was identified.
Tab. 8 Vertical aerodynamic damping of iced 6-bundled conductors at wind attack angle 70°(Den<0,Nigol>0)

/y
f f
Measured wind speed
(m/s)
Vertical aerodynamic damping ratio(%)
Experimental value
Calculate value
Den Hartog theoretical value
1.35
2.24 -0.211 -0.380 -0.209
3.76 -0.230 -0.371 -0.351
4.99 × -0.357 -0.465
5.99 × × -0.558
6.75 × × -0.630
1.00
2.28 -0.645 -0.442 -0.213(NG)
3.86 -0.753 -0.543 -0.360(NG)
5.02 × -0.516 -0.468
5.99 × × -0.559
6.79 × × -0.633
0.89
2.24 -0.662 -0.571 -0.209
3.76 -1.394 -1.205 -0.351
4.99 -1.792 -1.949 -0.465
5.99 -2.139 -2.388 -0.558
6.75 -2.236 -2.580 -0.630
0.80
2.24 -0.553 -0.613 -0.209
3.76 -1.036 -1.158 -0.351
4.99 -1.476 -1.569 -0.465
5.99 -2.008 -2.050 -0.558
6.75 -2.448 -2.408 -0.630
0.65
2.24 -0.524 -0.578 -0.209
3.76 -0.988 -1.008 -0.351
4.99 -1.270 -1.329 -0.465
5.99 -1.605 -1.696 -0.558
6.75 -1.998 -1.989 -0.630
7.52 -2.335 -2.287 -0.701 Note: “×” means no galloping; “NG” means no galloping theoretically because the sum of Den aerodynamic damping ratio and structure damping ratio is greater than 0.
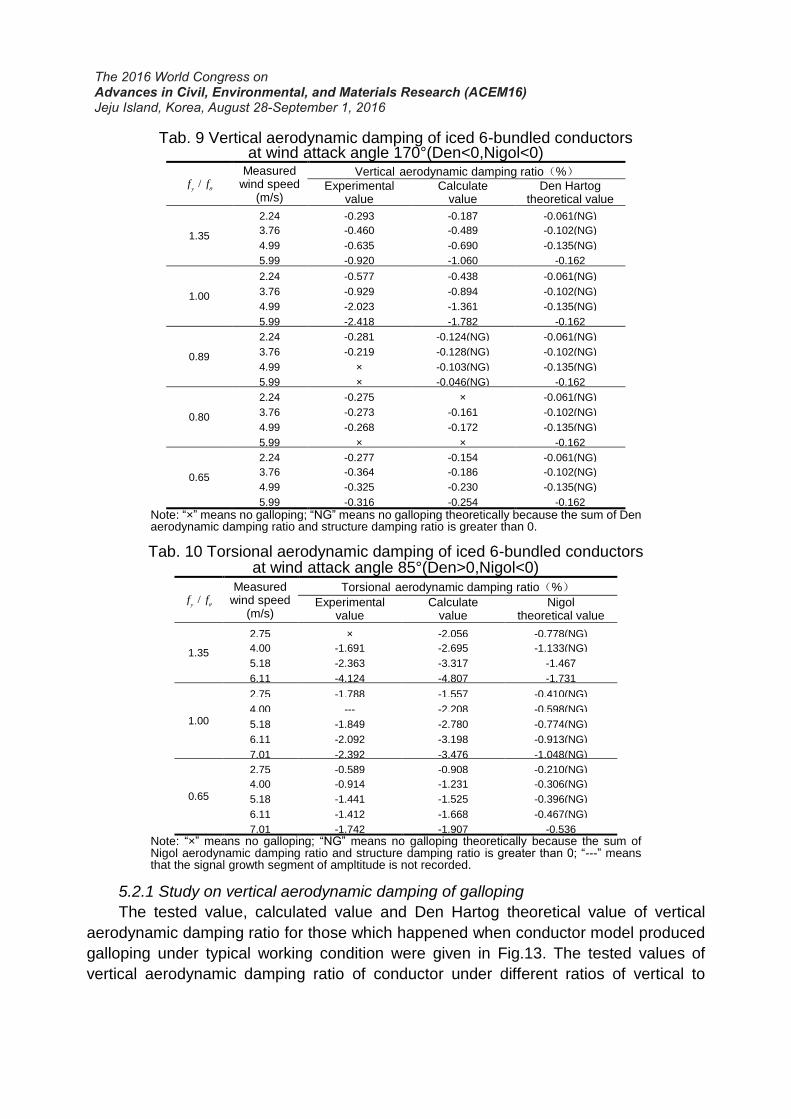
Tab. 9 Vertical aerodynamic damping of iced 6-bundled conductors at wind attack angle 170°(Den<0,Nigol<0)
/y
f f
Measured wind speed
(m/s)
Vertical aerodynamic damping ratio(%)
Experimental value
Calculate value
Den Hartog theoretical value
1.35
2.24 -0.293 -0.187 -0.061(NG)
3.76 -0.460 -0.489 -0.102(NG)
4.99 -0.635 -0.690 -0.135(NG)
5.99 -0.920 -1.060 -0.162
1.00
2.24 -0.577 -0.438 -0.061(NG)
3.76 -0.929 -0.894 -0.102(NG)
4.99 -2.023 -1.361 -0.135(NG)
5.99 -2.418 -1.782 -0.162
0.89
2.24 -0.281 -0.124(NG) -0.061(NG)
3.76 -0.219 -0.128(NG) -0.102(NG)
4.99 × -0.103(NG) -0.135(NG)
5.99 × -0.046(NG) -0.162
0.80
2.24 -0.275 × -0.061(NG)
3.76 -0.273 -0.161 -0.102(NG)
4.99 -0.268 -0.172 -0.135(NG)
5.99 × × -0.162
0.65
2.24 -0.277 -0.154 -0.061(NG)
3.76 -0.364 -0.186 -0.102(NG)
4.99 -0.325 -0.230 -0.135(NG)
5.99 -0.316 -0.254 -0.162
Note: “×” means no galloping; “NG” means no galloping theoretically because the sum of Den aerodynamic damping ratio and structure damping ratio is greater than 0.
Tab. 10 Torsional aerodynamic damping of iced 6-bundled conductors at wind attack angle 85°(Den>0,Nigol<0)
/y
f f
Measured wind speed
(m/s)
Torsional aerodynamic damping ratio(%)
Experimental value
Calculate value
Nigol theoretical value
1.35
2.75 × -2.056 -0.778(NG)
4.00 -1.691 -2.695 -1.133(NG)
5.18 -2.363 -3.317 -1.467
6.11 -4.124 -4.807 -1.731
1.00
2.75 -1.788 -1.557 -0.410(NG)
4.00 --- -2.208 -0.598(NG)
5.18 -1.849 -2.780 -0.774(NG)
6.11 -2.092 -3.198 -0.913(NG)
7.01 -2.392 -3.476 -1.048(NG)
0.65
2.75 -0.589 -0.908 -0.210(NG)
4.00 -0.914 -1.231 -0.306(NG)
5.18 -1.441 -1.525 -0.396(NG)
6.11 -1.412 -1.668 -0.467(NG)
7.01 -1.742 -1.907 -0.536 Note: “×” means no galloping; “NG” means no galloping theoretically because the sum of Nigol aerodynamic damping ratio and structure damping ratio is greater than 0; “---” means that the signal growth segment of ampltitude is not recorded.
5.2.1 Study on vertical aerodynamic damping of galloping
The tested value, calculated value and Den Hartog theoretical value of vertical
aerodynamic damping ratio for those which happened when conductor model produced
galloping under typical working condition were given in Fig.13. The tested values of
vertical aerodynamic damping ratio of conductor under different ratios of vertical to

rotational natural frequency were given in Fig.14. It could be found, for vertical
aerodynamic damping ratio, the one which was identified by test tended to be
approximate to the one which was identified by calculation of galloping response,
moreover, the one which was identified by test tended to be larger than the theoretical
value which was calculated by Den Hartog galloping mechanism. And it also could
explain some galloping phenomenon which couldn’t be predicted by Den Hartog
galloping mechanism.
(a) wind attack angle=70°, 0.65yf f (b)wind attack angle=170°, 1.35yf f
Fig. 13 Vertical aerodynamic damping of iced 6-bundled conductors
(a) wind attack angle=70° (b) wind attack angle=170°
Fig. 14 Tested vertical aerodynamic damping of iced 6-bundled conductors at different ratios of vertical to rotational mode frequency
Combining with Tab.8、Fig.13(a) and Fig.14(a) could discover, under the specific
wind attack angle when Den Hartog coefficient was negative and Nigol coefficient was
positive, the vertical aerodynamic damping which was identified by test had no
significant change with the wind speed variation when / 1.0yf f , and there was only
one wind speed range existed while the absolute value of negative aerodynamic
damping was greater than structure damping (i.e. galloping wouldn’t happen). This
galloping wind speed range coincided with the existing actual observation phenomenon,
but it couldn’t be predicted by the Den Hartog galloping mechanism, because according
to the Eq.(9), the absolute value of negative aerodynamic damping would increase with
wind speed increasing when Den Hartog coefficient was nagetive.When / 1.0yf f , the

the absolute value of negative aerodynamic damping which was identified by test
increased exponentially with wind speed increasing, it was not increasing linearly
according to Den Hartog galloping mechanism.
Combining with the Tab.9、Fig.13(b) and Fig.14(b) could discover, under the
specific wind attack angle when both Den Hartog coefficient and Nigol coefficient were
negative, the vertical aerodynamic damping which was identified by test increased first
and then inclined to stable value or firstly increased then decreased with wind speed
increasing when / 1.0yf f . It also indicated that there was only one wind speed range
existed while the absolute value of negative aerodynamic damping was greater than
structure damping. It was important to note that when / =0.89yf f , probably due to the
range of galloping wind speed was too small or it was more sensitive to changes in the
vicinity of this ratio of vertical to rotational natural frequency, so galloping motion was
failed to be simulated and calculated, but the change rule between identified vertical
aerodynamic damping and wind speed also supported those above conclusions. When
/ 1.0yf f , the absolute value of negative aerodynamic damping which was identified by
test increased exponentially with wind speed increasing, and it was significantly greater
than Den Hartog theoretical value, and galloping phenomenon could also be observed
actually under a specific wind speed when , en0
y y D
气动 , which further illustrated the
disadvantages of Den Hartog galloping mechanism with single degree of freedom.
5.2.1 Study on torsional aerodynamic damping of galloping
The tested value, calculated value and Nigol theoretical value of torsional
aerodynamic damping ratio for those which happened when conductor model produced
galloping under typical working condition were given in Fig.15. The tested values of
torsional aerodynamic damping ratio of conductor under different ratios of vertical to
rotational natural frequency were given in Fig.16. It could be found, for torsional
aerodynamic damping ratio, the one which was identified by test tended to be
approximate to the one which was identified by calculation of galloping response,
moreover, the one which was identified by test tended to be larger than the theoretical
value which was calculated by Nigol galloping mechanism. Took a further comparison
between the aerodynamic damping which was calculated by Nigol galloping mechanism
and model structure damping, it could be found that when ,0
Nigol
气动 , torsional
galloping of conductor model could still be observed in the test, this showed that there
were some deviations existed when the torsional aerodynamic damping ratio of
conductor was calculated by Nigol galloping mechanism. The abuse of Nigol galloping
mechanism with single degree of freedom was also revealed.
Combining with Tab.10, Fig.15 and Fig.6 may discover, under the specific wind
attack angle when Den Hartog coefficient was positive and Nigol coefficient was
negative, the absolute value of negative aerodynamic damping of conductor model
increased with the ratio of vertical to rotational natural frequency increasing, and
increased exponentially with wind speed increasing.
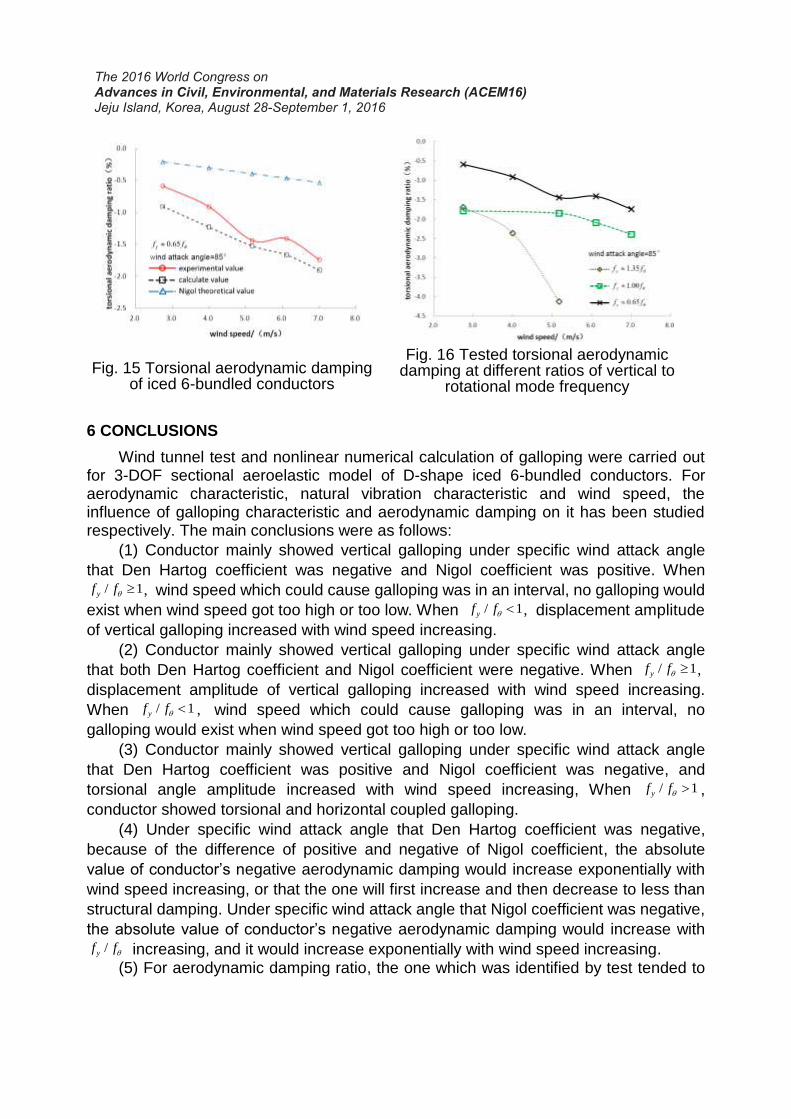
Fig. 15 Torsional aerodynamic damping of iced 6-bundled conductors
Fig. 16 Tested torsional aerodynamic damping at different ratios of vertical to
rotational mode frequency
6 CONCLUSIONS
Wind tunnel test and nonlinear numerical calculation of galloping were carried out for 3-DOF sectional aeroelastic model of D-shape iced 6-bundled conductors. For aerodynamic characteristic, natural vibration characteristic and wind speed, the influence of galloping characteristic and aerodynamic damping on it has been studied respectively. The main conclusions were as follows:
(1) Conductor mainly showed vertical galloping under specific wind attack angle
that Den Hartog coefficient was negative and Nigol coefficient was positive. When / 1yf f , wind speed which could cause galloping was in an interval, no galloping would
exist when wind speed got too high or too low. When / 1yf f , displacement amplitude
of vertical galloping increased with wind speed increasing.
(2) Conductor mainly showed vertical galloping under specific wind attack angle
that both Den Hartog coefficient and Nigol coefficient were negative. When / 1yf f ,
displacement amplitude of vertical galloping increased with wind speed increasing.
When / 1yf f , wind speed which could cause galloping was in an interval, no
galloping would exist when wind speed got too high or too low.
(3) Conductor mainly showed vertical galloping under specific wind attack angle
that Den Hartog coefficient was positive and Nigol coefficient was negative, and
torsional angle amplitude increased with wind speed increasing, When / 1yf f ,
conductor showed torsional and horizontal coupled galloping.
(4) Under specific wind attack angle that Den Hartog coefficient was negative,
because of the difference of positive and negative of Nigol coefficient, the absolute
value of conductor’s negative aerodynamic damping would increase exponentially with
wind speed increasing, or that the one will first increase and then decrease to less than
structural damping. Under specific wind attack angle that Nigol coefficient was negative,
the absolute value of conductor’s negative aerodynamic damping would increase with /yf f increasing, and it would increase exponentially with wind speed increasing.
(5) For aerodynamic damping ratio, the one which was identified by test tended to

be approximate to the one which was identified by calculation of galloping response, moreover, the one which was identified by test tended to be larger than the theoretical value which was calculated by Den Hartog or Nigol galloping mechanism. Using galloping mechanism of single degree of freedom to predict three freedom coupled galloping had great defects, and it was not safe.
REFERENCES
[1] Den Hartog J P. Transmission line vibration due to sleet[J]. American Institute of Electrical Engineers, Transactions of the, 1932,51(4):1074-1076.
[2] Nigol O, Buchan P G. Conductor Galloping Part I Den Hartog Mechanism[J]. Power Apparatus and Systems, IEEE Transactions on, 1981, (2):699-707.
[3] Nigol O, Buchan P G. Conductor Galloping-Part II Torsional Mechanism[J]. Power Apparatus and Systems, IEEE Transactions on, 1981, (2):708-720.
[4] Shimizu M, Ishihara T, Pham Van P. A wind tunnel study on quasi-steady and unsteady forces of ice accreted four bundled and single conductor transmission lines [R]. Japan: Abiko Research Laboratory, 2004(in Japanese)
[5] Keutgen R, Lilien J L. Benchmark cases for galloping with results obtained from wind tunnel facilities validation of a finite element model[J]. Power Delivery, IEEE Transactions on, 2000,15(1):367-374.
[6] Muhammad B W, Takashi I, Muhammad W S. Galloping response prediction of ice-accreted transmission lines[C]. 4th Advances in Wind and Structures (AWAS’08), 2008, 876-885.
[7] Lou Wenjuan, Wang Xin, Xu Fuyou. A wind tunnel study on galloping of an aeroelastic iced conductor model[J]. China Civil Engineering Journal, 2011, 44(11): 18-23.
[8] Liu Xiaohui. Nonlinear Numerical Simulation Method and Wind Tunnel Test for Galloping of Iced Conductor[D]. Chongqing University, 2011.
[9] SUN Zhenmao. Analysis of Transmission Line Galloping and Research on Anti-galloping Technology[D]. Zhejiang University, 2010.
[10] Wang Xin, Lou Wenjuan, Shen Guohui, Aerodynamic damping identification for iced transmission line galloping[J]. Journal of Vibration and Shock, 2011,30(10):160-164.
[11] LIN Wei. Wind Tunnel and Numerical Study on Aerodynamic Characteristics of Ice Accreted Transmission Lines[D]. Zhejiang University, 2012.
[12] Wang Xin, Lou Wenjuan. Numerical Approach to the Galloping of Iced Conductor[J]. Engineering Mechanics, 2010, 27(1): 290-310