wind turbine shroud design - · pdf file10.05.2010 · wind turbine shroud design...
TRANSCRIPT

Wind Turbine Shroud Design
Ashdin Medhora
Joshua D’Souza
Vandad Rad
David Quach
Khoa Le
Faculty Advisor: Dr. Dragos-Stefan Dancila
University of Texas at Arlington
Mechanical Engineering Capstone Senior Design Project
5/10/2010

ii | P a g e W i n d m i l l G e n e r a t o r S h r o u d D e s i g n
Abstract: Continuing from last semesters work, this semester’s project is about building and
testing a wind turbine shroud that demonstrated the best Computational Fluid Dynamic results.
Testing of the windmill shroud is conducted to justify the means of adding a shroud around a
windmill to increase the speed of the airflow, thus generating more energy from the wind
turbine blades. At a wind speed of 10 mph, the shrouded configuration resulted in a power
increase over the non-shrouded configuration by a factor 2.4819. The cut-in speed of the
shrouded configuration was 0.9 mph lower than that of the non-shrouded configuration. This
means the shrouded configuration began generating power at slower wind speeds than the
non-shrouded configuration. The power increase calculated by the CFD testing was 7.51% larger
than the power increase achieved through physical testing, most likely due to the inaccuracies
during construction of the shroud.
Project Personnel: Ashdin Medhora:
Phone number: (281)-250-6648 Email: [email protected]
Vandad Rad:
Phone number: (972)-849-3766 Email: [email protected]
Khoa Le:
Phone number: (682)-234-0671 Email: [email protected]
Joshua D’Souza:
Phone number: (817)-371-7156 Email: [email protected]
David Quach:
Phone number: (817)-521-8840 Email: [email protected]
Client: Dr. Dragos-Stefan Dancila:
Phone number: (817)-272-0833 Email: [email protected]

iii | P a g e W i n d m i l l G e n e r a t o r S h r o u d D e s i g n
Table of Contents
Introduction ............................................................................................................................................ 1
Design ..................................................................................................................................................... 2
Fabrication & Assembly .......................................................................................................................... 7
Testing .................................................................................................................................................. 12
Results .................................................................................................................................................. 16
Conclusion ............................................................................................................................................ 20
Bibliography .......................................................................................................................................... 21

1 | P a g e W i n d m i l l G e n e r a t o r S h r o u d D e s i g n
Introduction
Renewable energy has become an important topic in recent years because of how fossil
fuels affect the environment and how they’re being used faster than they are created. One
major form of renewable energy is wind. Wind power is growing at a rate of 30% annually, so
increasing the potential of the windmill is very important.
The current design of the windmill turbine has three large blades that spin slowly, which
spins a shaft, which is connected to a gearbox to increase the rotational speed. Some torque is
lost through the use of a gearbox. By increasing the rotational speed of the wind turbine, the
gearbox and its torque losses can be eliminated from the design. Using higher density and
smaller turbine blades allows for higher rotational speeds and a lower cut-in speed than the
current low density three blade design. A venturi-like shroud will be placed around the turbine
blades, increasing the velocity of the fluid where the pipe diameter decreases. This
combination of a smaller, high-density blade and a venturi-like shroud allows for more power to
be generated at any given wind speed and eliminates the need for a gearbox.
Last semester the design team researched how to increase the speed of the wind using
a shroud covering the windmill turbine. Research was also conducted on how the actual
windmill turbine would be built. Our research from the first semester concluded with the
design shown in Figure 1.
Figure 1: Windmill shroud from first semester’s research.
The shroud is designed to imitate a Venturi pipe. The air flow would increase in the
section where the pipe diameter decreases. The outlet of the shroud design has two functions.
One is to vary the outlet diameter to control the pressure inside the shroud in order to increase
the wind speed whenever it is low. The inner outlet diffuser ensures the air flow stays in

2 | P a g e W i n d m i l l G e n e r a t o r S h r o u d D e s i g n
contact with the walls of the shroud upon exiting. A fin attached to the top of the shroud helps
guide the windmill turbine to face the wind at all times.
Due to a two hundred and fifty dollar budget limit, the shroud design from last semester
has changed so that the shroud can feasibly be built within the funds available. This semester’s
purpose is to focus on designing and building only the shroud itself, and not a variable-diameter
diffuser or the capability of rotation. We will do physical testing to compare the power output
of a shrouded windmill and a non-shrouded windmill to see if using the shroud makes a
noticeable power output difference. The computational fluid dynamics (CFD), using the
software FLUENT, is continued from last semester to iterate a design that suits our needs. A
prototype shroud will be designed, built, and tested. This shroud will be made of a wooden
frame wrapped with Marmoleum (a type of vinyl). This report will cover the design, assembly,
testing, and results phases of the project.
Design
The computational fluid dynamics done this semester was continued from last
semester. Last semester’s CFD did not include a pressure jump condition that was needed to
simulate the fan blades and get accurate results. This semester’s CFD work has included the
pressure jump condition. To test the designs in FLUENT, a sketch was made in Pro Engineer of
half of the shroud. Because the analysis done in FLUENT is axis symmetrical, only the top half of
the shroud needed to be sketched. A few sketches were made to test different designs to find
the best one.
The design had to meet certain criteria. One of the criteria was when the flow entered
the shroud, the flow would need to increase in speed in the section where the shroud diameter
is the smallest. The other criterion was that the flow should not separate from the walls upon
exiting the shroud.
The initial phase of performing the computational fluid dynamics analysis last semester
primarily consisted of learning how to use two programs, GAMBIT 2.3.16 and FLUENT 6.3.26.
GAMBIT was used to create a 2-dimensional axisymmetric setup in order to develop a
conformal mesh and state key boundary conditions as stated in Table 1. It was also used to
further refine the mesh to validate and improve the CFD results within FLUENT. The drawing
was exported from Pro-E as an IGES file that could be conveniently imported into GAMBIT. It
was then exported as a MESH file into FLUENT. The main key requirement once the meshed
drawing was imported into FLUENT was that the grid check passed and that a realistic volume
was observed. Once this was achieved, the next task was making sure the boundary conditions
transferred over successfully. Upon achieving this, a model solver had to be stated. The case

3 | P a g e W i n d m i l l G e n e r a t o r S h r o u d D e s i g n
was treated as a pressure based, axisymmetric problem with green-gauss cell selected as the
gradient option. The rest were left at default conditions. The remainder of the options such as
formulation, time, velocity formulation and porous formulation were left at default settings as
seen in Figure 2.
Figure 2: Model Solver specifications
The next requirement was to setup a viscous solver. After many consultations regarding
which one to pick, the spalart-allmaras was decided to be the best option. The material fluid
selected was air at default settings with a density of 1.225 kg/m3, viscosity of 1.79e-05 kg/m-s,
and an operating pressure of 101325 Pascal. The next phase was stating the boundary condition
variables. An inlet velocity of 10 mph, or 4.47m/s, was set and a pressure jump of -16.5 Pascal
was used. This inlet velocity was chosen according to the standard operating conditions the
wind turbine would be operating under. Since the testing would be conducted in Arlington,
Texas, the area’s average wind speed of 10 mph was used. The pressure jump was calculated
theoretically using Betz’ law and Bernoulli’s incompressible flow equation.
Defining the solution controls, initialization, and residual monitors was the next step.
Figures 3, 4 and 5 display the specifications used. The problem was then set to iterate 1000
times. This resulted in a fairly accurate result, based off the convergence of the residual
monitors. Once the 1000 iterations were completed, the process was done again with a refined
mesh to compare results. After which the contour pressure and velocity vectors were graphed.
Figure 3: Solution Controls Specifications Figure 4: Solution Initialization Specifications

4 | P a g e W i n d m i l l G e n e r a t o r S h r o u d D e s i g n
Figure 5: Residual Monitors Specifications
The CFD performed last semester lacked an integral boundary condition of a pressure
jump. Without the pressure jump, the readings acquired were irrelevant since it was merely
airflow through and around a shroud without the simulation of a fan within the throat.
Therefore, this semester the primary goal with regard to CFD was figuring out how to
incorporate the pressure jump into the shroud. This goal was successfully achieved by being
able to place the pressure jump at any point in the throat and specify its coefficient. Now came
the second phase of finding a feasible and easy-to-manufacture design. The design came down
to two iterations, the shroud with and without a diffuser. The final decision was made based on
if it was feasible to include a diffuser and if the speed increase was enough to invest in. Based
on the results acquired from CFD, it seemed unnecessary to include the diffuser since the
benefits were not worthy enough.
As seen in the figures below, it is apparent in the shroud without the diffuser that there
is a significant increase in wind velocity from 4.47 m/s to 6.2 m/s. Whereas, in the shroud with
the diffuser there isn’t. In fact however, there is a better outflow due to the diffuser, which is
very desirable since the faster the air exits, the faster it enters into the shroud.
Figure 6: Velocity vectors for Shroud with no diffuser (6.2 m/s in throat) &
Figure 7: Velocity vectors for Shroud with diffuser (4.8 m/s in throat)
5 | P a g e W i n d m i l l G e n e r a t o r S h r o u d D e s i g n
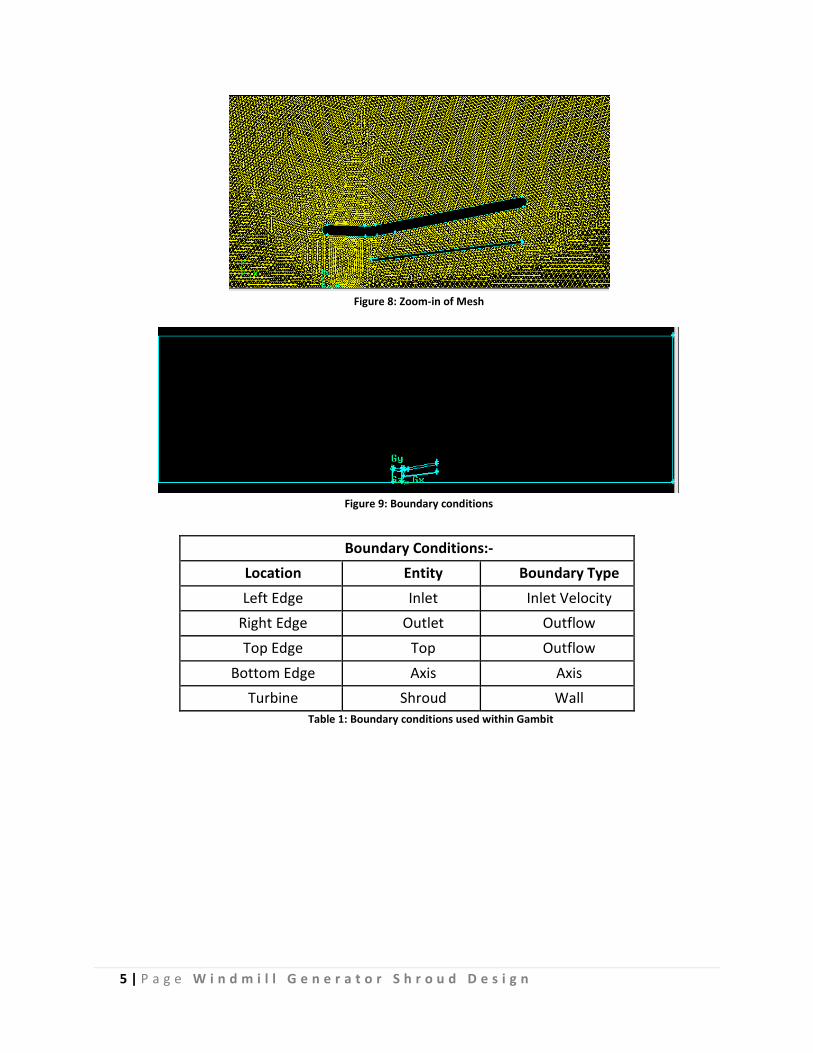
Figure 8: Zoom-in of Mesh
Figure 9: Boundary conditions
Boundary Conditions:-
Location Entity Boundary Type
Left Edge Inlet Inlet Velocity
Right Edge Outlet Outflow
Top Edge Top Outflow
Bottom Edge Axis Axis
Turbine Shroud Wall
Table 1: Boundary conditions used within Gambit
6 | P a g e W i n d m i l l G e n e r a t o r S h r o u d D e s i g n
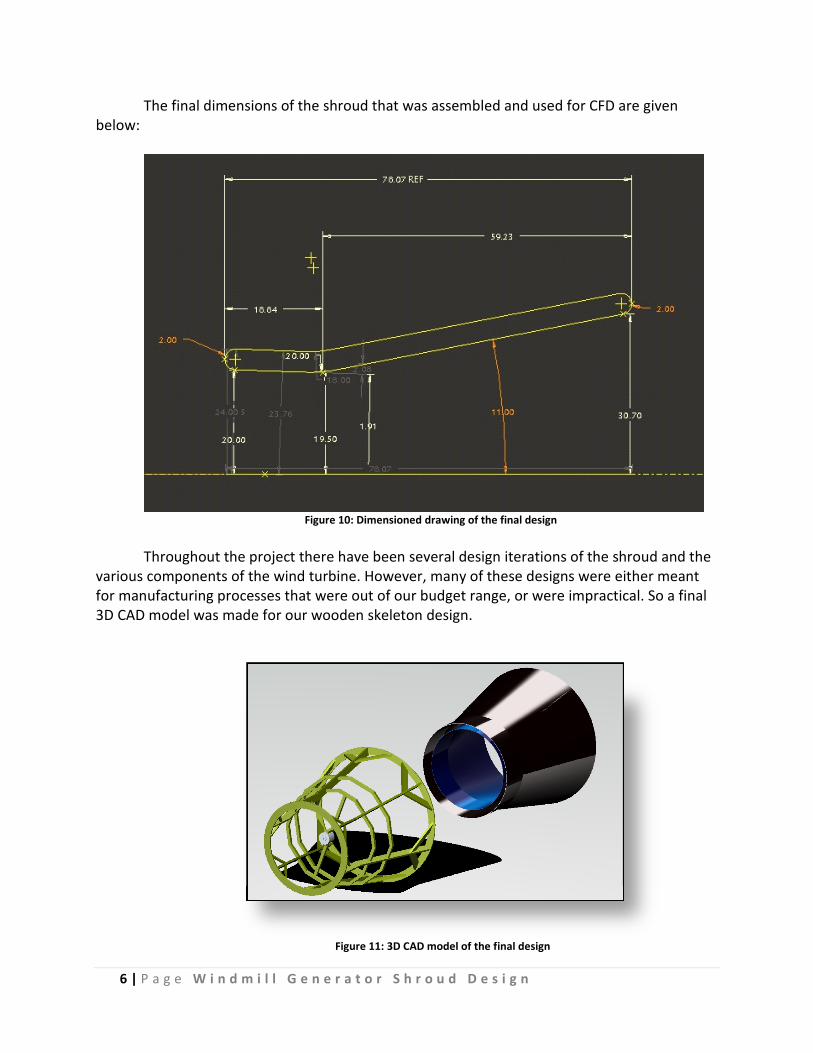
The final dimensions of the shroud that was assembled and used for CFD are given
below:
Figure 10: Dimensioned drawing of the final design
Throughout the project there have been several design iterations of the shroud and the
various components of the wind turbine. However, many of these designs were either meant
for manufacturing processes that were out of our budget range, or were impractical. So a final
3D CAD model was made for our wooden skeleton design.
Figure 11: 3D CAD model of the final design

7 | P a g e W i n d m i l l G e n e r a t o r S h r o u d D e s i g n
Fabrication & Assembly
In this section the fabrication of the shroud’s components and its assembly will be
described step by step. The process can be broken down into three major steps; the
construction of the shroud frame, wrapping the frame in a Marmoleum skin, and mounting the
generator and blades within the shroud. The first step, building a frame for the shroud out of
wood, was designed to hold the shape of the shroud as well as to act as a support for mounting
the generator and blades. This frame consisted of two concentric rings joined by 1”x 4” wooden
runners. Along these runners, various supporting pieces were attached to increase the strength
of the structure.
The rings, which were cut from 5/8” thick plywood, were traced out using a custom
made compass and cut out with a jigsaw. The outlet diameter was larger than could be cut from
a standard 4 foot wide piece of plywood, so it was cut in quarters and later attached using
metal plates. Figure 12 shows one of the quarters of the outlet diameter being cut from
plywood.
Figure 12: Process of cutting the quarters of the outlet circular ring.
Figure 13: Brackets holding the quarter pieces together.
The runners, which joined the inlet and outlet rings, were cut from 1”x4” pieces of pine.
These were done in two pieces to match the profile and angles of the shroud. These pieces
were attached using metal plates and the overall runner was attached to the rings using right
angle metal brackets. Six of these runners were used and spaced 60˚ apart. When attaching

8 | P a g e W i n d m i l l G e n e r a t o r S h r o u d D e s i g n
both ends of the shroud to the runners, a method for assuring their concentricity was utilized. A
string was tied across the inlet ring and another string was hung from the center. This string
was then matched to the center of the outlet ring.
Figure 14: The basic frame with runners attaching the inlet and outlet rings.
To increase the strength of the structure, additional supporting pieces were attached on
the sides of the runners at 45˚ to both the inlet and outlet rings. In addition to this, an
additional two rings were added near the center of the shroud. These rings both increased the
strength of the frame as well as served as attachment points for the Marmoleum skin. One was
placed at the center of mass of the shroud and the other was placed about 1.5 feet away from
the first. This made sure that the skeleton did not twist or bend once the windmill and
generator were placed inside the shroud. Also, these rings would be where the pole or
mounting structure may be attached.
Figure 15: Ring Braces

9 | P a g e W i n d m i l l G e n e r a t o r S h r o u d D e s i g n
Figure 16: 45˚ Runner support
Figure 17: Final Skeleton
The Marmoleum skin of the shroud was attached using drywall screws. Each sheet was
screwed in along the sides of the rings and all the way along the length of the runners. The
sheets were cut to the approximate shape and size of each section and then screwed into place.
Once this was done, the sheets were cut flush against the wood. In order to shape the
Marmoleum into a smooth round surface, long screws were driven through the sheet into the
rings of the frame. These screws acted as ties to pull the material into a tight smooth shape.
Tape was used to smooth the joint locations where the different sheets met.

10 | P a g e W i n d m i l l G e n e r a t o r S h r o u d D e s i g n
Figure 18: Skeleton with the Marmoleum attached
After the inside of the shroud was covered, the generator and windmill blades were
installed. The blades were purchased online and came with a Lexan hub and screws to attach
the blades to the hub. Each blade is 18 inches in length and 3 inches wide. The hub is 6 inches in
diameter. Each blade was placed on the hub for a total of 6 blades. The total diameter is 39
inches. Black electrical tape was used to cover up manufacturing holes near the end of the
blades.
Figure 19: Windmill blades
The DC-540 Low Wind Permanent Magnet Alternator from WindBlue Power is the
alternator being used, and was attached to the hub and blades.

11 | P a g e W i n d m i l l G e n e r a t o r S h r o u d D e s i g n
Figure 20:The Permanent Magnet Alternator
Figure 21: The blades attached to the alternator
The generator, two light bulbs, and two multimeters were wired together to form a
circuit for taking voltage and amperage readings. This setup will be further explained in the
testing section of this report. To mount the blades and generator within the shroud it was
essential that they be placed at the appropriate location, in the center, and on a fully rigid
structure. The center was found using a piece string tied to the center of strings running across
the diameter of each ring, creating a cord along the center axis of the overall shroud. The
shroud was then placed upright and a 2”x4” was attached at the desired location. The
2”x4”position was adjusted using a standard bubble level.
Figure 22: The wooden beam that generator is going to be mounted on
Due to the use of low precision equipment and tolerance stack up from low grade
materials, there will be discrepancies between the CFD results and the results of testing. The
primary source of discrepancy will be found from the Marmoleum skin. When covering the
shroud, it was very difficult to remove all of the bubbles and creases in the Marmoleum. It was
a fairly difficult material to work with as it was not intended for this type of application. It
lacked in the appropriate balance of rigidity and formability. This will create an irregular surface
around and inside the shroud. Another discrepancy is that the inlet and outlet rings should have

12 | P a g e W i n d m i l l G e n e r a t o r S h r o u d D e s i g n
a rounded surface rather than a flat surface. The only reason that we are unable to fix this is
budgetary constraints.
Testing
The end goal of this project is to compare the power generation of the non-shrouded
turbine configuration with the shrouded turbine configuration in a real world environment. In
order to do so, each configuration will need to be tested in order to get the measurements
needed to calculate the power produced by the alternator at various wind speeds.
The ideal environment to test the power output of a wind turbine is a space where the
speed and direction of the wind are as consistent as possible. The wind speeds should vary
from 0 mph to at least the average wind speed in the area the turbine will operate in, which in
the case of Arlington, Texas, is 10 mph. This range of wind speeds allows for the opportunity to
observe the cut-in speed, which is the wind speed at which the turbine begins to spin with
usable power generation, and to observe how the turbine and generator perform at standard
operating conditions. The turbine should ideally be faced exactly into the wind so that the
energy harvested from the wind can be maximized.
The values that will be measured and recorded are voltage, current, and wind speed.
The alternator used produces and outputs alternating current (AC), but also has a built in
rectifier that converts the AC to direct current (DC) output. The DC outputs were hooked in
series to two 14 volt, 4.6 Watt light bulbs that acted as a load to get usable current and voltage
readings. One multimeter was added in series to measure the current in the circuit, and
another multimeter was added in parallel to the alternator to measure the voltage. These two
measurements are used to obtain values for power with the use of the following equation:
� = � ∗ �
Where: P = Power (Watts)
I = Current (Amperes)
V = Voltage(Volts)
The wind speed was measured using a handheld anemometer, which was kept facing in
the direction the wind turbine was facing. These three measurements are used to create a
Power vs Wind Speed plot for each configuration, which can then be analyzed and compared.
The first test conducted was for the non-shrouded configuration. The turbine blades
and hub assembly were mounted onto the alternator. This assembly was then mounted onto
an 8 foot long, 2” by 4” wooden post. The alternator mounting holes on the wood were
measured and drilled, and the alternator was secured to the wood using two bolts.

13 | P a g e W i n d m i l l G e n e r a t o r S h r o u d D e s i g n
Figure 23: The blades and alternator mounted onto the wooden piece

14 | P a g e W i n d m i l l G e n e r a t o r S h r o u d D e s i g n
The alternator was then hooked into the circuit as mentioned above. The testing site was in a fairly
open portion of a neighborhood which provided consistent winds at a variety of wind speeds. The
wooden post was held upright into the wind, while a video camera recorded the screens of the
anemometer and the two multimeters, providing us with simultaneous current, voltage, and wind speed
readings. This was done until a sufficient amount of data was recorded for various wind speeds. The
wind speeds ranged from 0 mph to 17.5 mph and were consistent enough to provide good data. A
string was attached to the post to show the direction of the wind, so that the turbine could be manually
turned into the wind constantly.
Figure 24: A snapshot of the video recording the testing data readings for the non-shrouded configuration. The light
bulbs pictured here are the ones being powered by the alternator.
The second test conducted was for the shrouded configuration. The alternator and blade
assembly were removed from the wooden post and installed onto the shroud. The wires from the
alternator were secured to the alternator mounting beam, fed through a hole made through the walls of
the shroud, and finally attached to the testing equipment. The shroud and testing equipment were
moved to the same testing site as the first test. Ideally, the shroud should be mounted at least 8 or 10
feet high into the air with little obstruction from the mounting assembly, and should be able to freely
rotate into the direction of the wind. Because the shroud is very large and heavy, it was not feasible to
mount it on a post or pole as was done for the non-shrouded configuration. Instead the shroud was
placed about two feet high onto a table. The inlet was elevated with wooden blocks so it did not slant
downward. The shroud could only be pointed in one direction, so it was pointed in the direction that
the majority of the wind was blowing at that point in time. This is not the ideal mounting setup to test
the shroud, but we had a fairly good representation of the behavior of the shroud.
15 | P a g e W i n d m i l l G e n e r a t o r S h r o u d D e s i g n
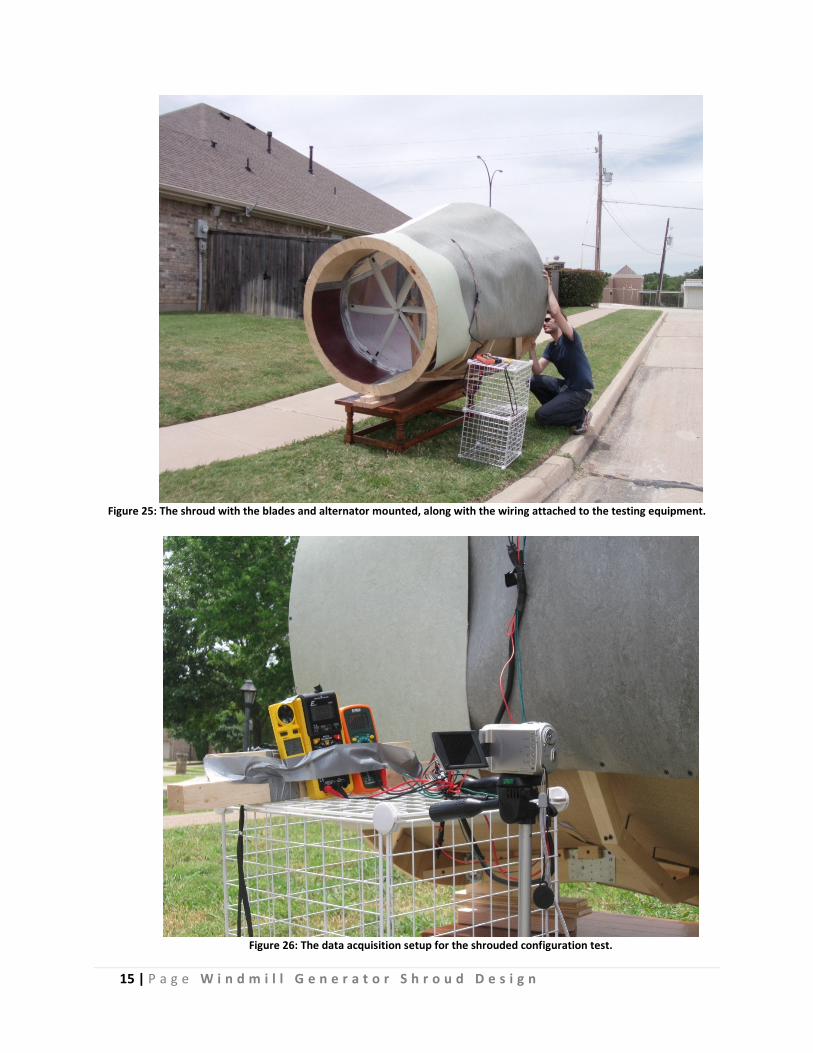
Figure 25: The shroud with the blades and alternator mounted, along with the wiring attached to the testing equipment.
Figure 26: The data acquisition setup for the shrouded configuration test.

16 | P a g e W i n d m i l l G e n e r a t o r S h r o u d D e s i g n
The blades were allowed to rotate and the video camera recorded the anemometer and
multimeter readings. The wind speeds ranged from 0 mph to 12.9 mph and were consistent enough for
good data measurements. It is important to note that the anemometer was reading the environment
wind speeds, and not the speed of air inside the shroud.
Figure 27: A snapshot of the video recording the testing data readings for the shrouded configuration.
Results
The data acquisition videos were reviewed in order to write down the current and voltage
conditions for various wind speeds. The anemometer used had about a one second delay in displaying
its readings. So in order to retrieve the voltage and current numbers at a certain wind speed, the
anemometer reading needed to be steady (unchanging) for at least a couple seconds. This is why
consistent wind speeds were needed for testing. The data points used for analysis were only taken from
steady wind speed readings. The current, voltage, and wind speed data were collected into an Excel
spreadsheet. The data collected for each configuration are as shown below:
17 | P a g e W i n d m i l l G e n e r a t o r S h r o u d D e s i g n
Non-Shrouded Configuration
Wind Speed
(mph)
Voltage
(Volts)
Current
(Amps)
Power
(Watts)
7.5 8.96 0.12 1.0752
9.4 15 0.2 3
14 28.41 0.33 9.3753
14.7 26.51 0.38 10.0738
16 35.91 0.38 13.6458
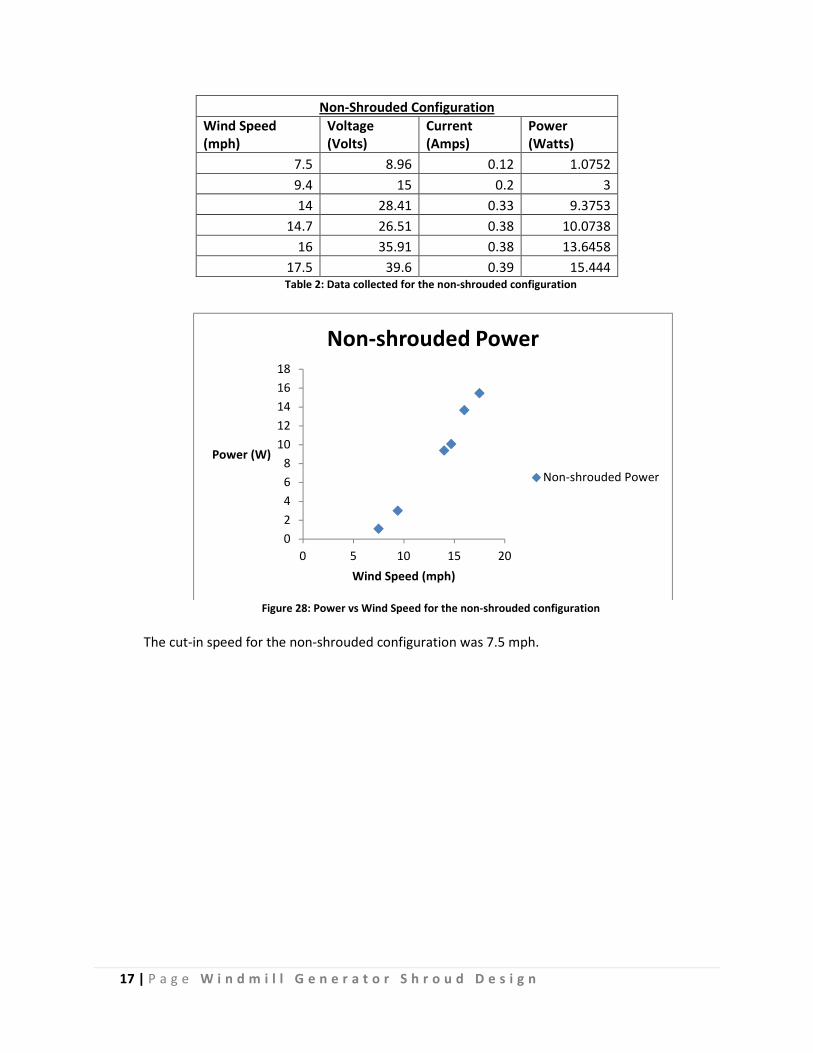
17.5 39.6 0.39 15.444 Table 2: Data collected for the non-shrouded configuration
Figure 28: Power vs Wind Speed for the non-shrouded configuration
The cut-in speed for the non-shrouded configuration was 7.5 mph.
0
2
4
6
8
10
12
14
16
18
0 5 10 15 20
Power (W)
Wind Speed (mph)
Non-shrouded Power
Non-shrouded Power

18 | P a g e W i n d m i l l G e n e r a t o r S h r o u d D e s i g n
Shrouded Configuration
Wind Speed (mph)
Voltage
(Volts)
Current
(Amps)
Power
(Watts)
6.6 10.17 0.19 1.9323
9.7 32.47 0.35 11.3645
11.1 34.8 0.36 12.528
12.9 40 0.4 16 Table 3: Data collected for the shrouded configuration
Figure 29: Power vs Wind Speed for the shrouded configuration
The cut-in speed for the shrouded configuration was 6.6 mph, a 0.9 mph decrease from the non-
shrouded configuration.
0
2
4
6
8
10
12
14
16
18
0 5 10 15
Power (W)
Wind Speed (mph)
Shrouded Power
Shrouded Power

19 | P a g e W i n d m i l l G e n e r a t o r S h r o u d D e s i g n
The data was then fit with a linear curve fit to be able to compare power output at any wind
speed between the two configurations.
Figure 30: Power vs Wind Speed for the non-shrouded and shrouded configurations, along with linear trend lines
for each configuration
The R2 values for the shrouded and non-shrouded linear curve fit configurations are 0.9608 and
0.9858 respectively. This means the shrouded curve fit line is 96.08% accurate to its data points, and
the non-shrouded curve fit is 98.58% accurate to its data points, both of which are good enough for
using as a comparison to each other. It can be seen that the shrouded configuration did increase the
power output for any given wind speed compared to the non-shrouded configuration.
The CFD results concluded that shroud speeded up the airflow from the environment to the
blades from �� = 4.47 �/ (10 mph) to � = 6.2 �/ (13.869 mph). This results in velocity increase
coefficient of:
��������� ��� = ��� = � 6.2 � ⁄
4.47 � ⁄ � = 1.387
where�� is the environment air velocity and �is the velocity of the air just before the turbine
blades.Since power is proportional the cube of velocity, �~�!, then the theoretical power increase
coefficient from the CFD results is:
��������� ��� = �! = 2.6683
y = 1.4521x - 10.375
R² = 0.9858
y = 2.2151x - 11.861
R² = 0.9608
0
2
4
6
8
10
12
14
16
18
0 5 10 15 20
Power (W)
Wind Speed (mph)
Non-shrouded and Shrouded Power vs Wind
Speed
Non-shrouded Power
Shrouded Power
Linear (Non-shrouded
Power)
Linear (Shrouded Power)

20 | P a g e W i n d m i l l G e n e r a t o r S h r o u d D e s i g n
To check how the CFD power increase compared to the physical testingpower increase, the
power output of the non-shrouded and shrouded configurations are compared at 10 mph (4.47 m/s). At
10 mph, using the linear curve-fit equations from above, the non-shrouded configuration produced
4.146 Watts and the shrouded configuration produced 10.29 Watts. So the power increasecoefficient
from the non-shrouded configuration to the shrouded configuration is:
��������� "#$����% = & ��#�'()��'�*�#�'()+ = &10.29 .4.146 .+ = 2.4819
This physical testing increase is slightly below the CFD power increase.
The error of the CFD power increase compared to the physical testing power increase can be
calculated by:
��������� ��� − ��������� "#$����%��������� "#$����% = (2.6683 − 2.4819)2.4819 = 0.0751 = 7.51%
So the power increase calculated by the CFD testing is 7.51% larger than the power increase
achieved through physical testing. This error is most likely due to the inaccuracies during construction
of the shroud which were caused by tolerance stack up and the workability of the materials used.
Conclusion
The objective of this project was to design and build a shroud, in which a wind turbine will be
placed inside of, in order to speed up the airflow and thus generate more power. Using computational
fluid dynamics, many designs were tested, and a final design that fit our budget was created. The
proposed design was constructed and tested, and then the results were compared to the test results of
the non-shrouded blades.
At a wind speed of 10 mph, the shrouded configuration resulted in a power increase over the
non-shrouded configuration by a factor 2.4819. This proves that a shrouded wind turbine, when
designed properly, does produce more power than a non-shrouded wind turbine using the same
diameter blades and same wind speed. The cut-in speed of the shrouded configuration was 0.9 mph
lower than that of the non-shrouded configuration. This means the shrouded configuration began
generating power at slower wind speeds than the non-shrouded configuration. The power increase
calculated by the CFD testing was 7.51% larger than the power increase achieved through physical
testing, most likely due to the inaccuracies during construction of the shroud. If one has the right
materials and tools available, a more ideal and precise design could be built with even larger power
increases, so this idea should definitely be pursued and more fully researched in the future.

21 | P a g e W i n d m i l l G e n e r a t o r S h r o u d D e s i g n
Bibliography
1.) Compressible Flow in a nozzle
Fluent Tutorials
Rajesh Bhaskaran
Copyright 2002.
Cornell University
Sibley School of Mechanical and Aerospace Engineering. http://courses.cit.cornell.edu/fluent/nozzle/index.htm
2.) 7.22 Porous Jump Boundary Conditions
ANSYS FLUENT
Fluent Inc. 2006-09-20
http://my.fit.edu/itresources/manuals/fluent6.3/help/html/ug/node288.htm