windlab limited company overview · windlab limited company overview ... wind technology wind...
TRANSCRIPT


WINDLAB LIMITED 2
Windlab Limited (Windlab) is an Australian based, international renewable energy development company, listed on the Australian Securities Exchange under the code WND
Windlab is headquartered in Canberra, with offices in the USA and Southern Africa
Windlab was established in 2003 to commercialise a leading atmospheric modelling and wind energy assessment technology, WindScape, developed by the Windlab’s founders at the CSIRO
Windlab applies science to develop better wind energy locations, more efficiently and with much greater certainty
Windlab is developing over 7,000 MW of potential wind energy capacity, across nearly 50 projects on three continents
Introduction
Completes first project from inception to financial close, exiting the project
at financial close
2005 20172011
Established to commercialise
WindScape
Internalised WindScape for exclusive use of Windlab and its partners
ASX listed. The ability to access capital to continue to grow project ownership stakes
Production and sale of WindScape wind maps to
third party developers
Pure wind farm developer where entire equity stakes in projects were sold to partners and
third parties before financial close
Integrated operator across the full wind farm lifecycle with asset management contracts and ownership interests in operating wind farms
2003
THE EVOLUTION OF WINDLAB’S BUSINESS MODEL

WINDLAB LIMITED 3
Company highlights
Strong industry fundamentals and regulatory dynamics
Management team with extensive technical and commercial experience
WindScape provides a distinct technological competitive advantage in wind farm site prospecting, design and optimisation
Growing earnings base incorporating recurring revenues from asset management and ownership / commercial interests in operating wind farms
Diversified portfolio and project pipeline across multiple jurisdictions
Proven track record of wind farm development
Completed17 projects580 MW
Total development
pipeline
48 projects7,000 MW
Near term development
pipeline
10 projects1,333 MW
Capacity under management 290 MW
FY2017(F)Revenue /
EBITDA
$23.2 m /$14.7 m
History of strong profitability and growth
Note 1: Includes Kiata Wind Farm which was developed by Windlab and is currently under construction

WINDLAB LIMITED 4
What we doWindlab has transitioned from a pure developer to a business operating across the full wind farm life cycle with growing recurring earnings through the addition of operating and asset management revenues
WIND FARM PROJECT LIFECYCLE

WINDLAB LIMITED 5
Revenue model
HOW DOES WINDLAB GENERATE REVENUE? DEVELOPMENT MARGIN EXTRACTION:
Development margins from the sale or part sale of projects at or near financial close
1
Success fees from previously sold or partnered projects. Success fees are typically received on completion of certain development milestones and / or when a project reaches financial close
2
Asset management fees for wind farm management of both Windlab developed and third party owned projects
3
Equity or other commercial interests in operating projects retained beyond financial close
4
Development margin
Target: $250,000 / MW, which
typically equates to 8% – 12% of
total capex
Received through a combination of
cash and carried interests
Windfarm capex
Wind turbines, including the cost of
transport to the site
Civil works
Site preparation
Concrete foundations for wind
turbines
On-site electrical worksD
evel
op
men
t m
argi
nW
ind
far
m c
apex
Net
pre
sen
t v
alu
e o
f fu
ture
pro
ject
cash
flo
ws
at f
inan
cial
clo
se
WINDLAB LIMITED 6
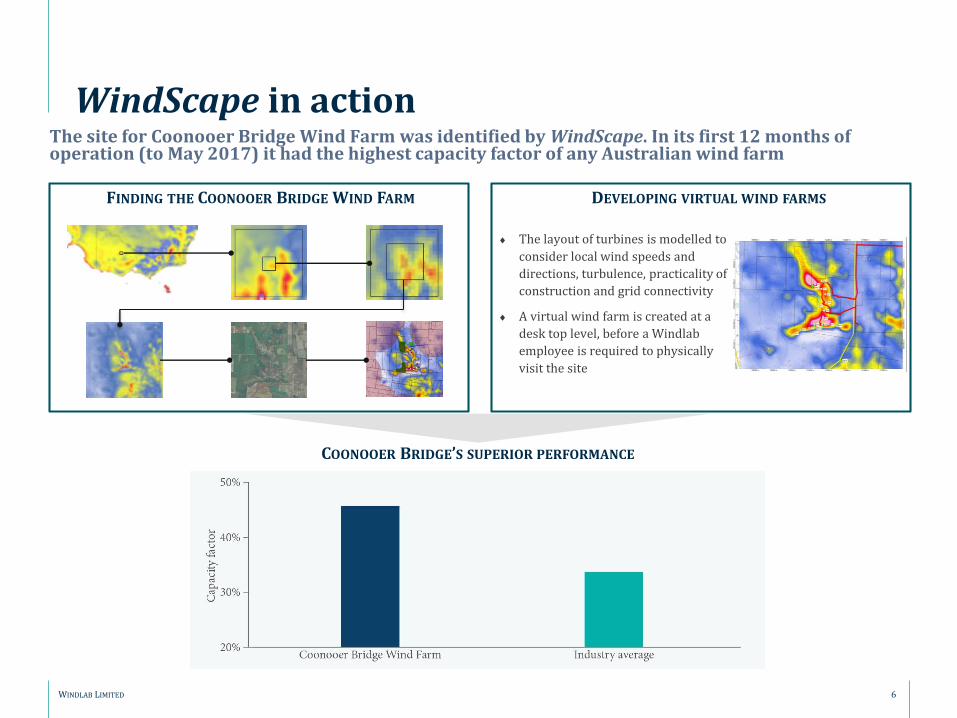
WindScape in actionThe site for Coonooer Bridge Wind Farm was identified by WindScape. In its first 12 months of operation (to May 2017) it had the highest capacity factor of any Australian wind farm
The layout of turbines is modelled to
consider local wind speeds and
directions, turbulence, practicality of
construction and grid connectivity
A virtual wind farm is created at a
desk top level, before a Windlab
employee is required to physically
visit the site
DEVELOPING VIRTUAL WIND FARMSFINDING THE COONOOER BRIDGE WIND FARM
COONOOER BRIDGE’S SUPERIOR PERFORMANCE

WINDLAB LIMITED
7
WindScape – the technologyWindScape has been tested and demonstrated to be effective in modelling wind characteristics across Australia, North America and Africa
WIND DIRECTION
WIND SPEED
WINDSCAPE VS. ACTUAL MEASUREMENTS
In the course of its development work Windlab has erected and maintained in excess of 50 meteorological masts. This has provided an invaluable opportunity to compare WindScape estimates to wind data collected on site by metrological masts. WindScape’s design allows its output to be compared to wind speed and direction measurements – on an hour by hour basis
7
0
5
10
15
20
0 50 100 150 200 250 300 350 400 450 500 550 600 650 700 750 800 850 900 950
Win
d s
pe
ed
(m
/s)
Hours
WindScape Measurement
0
60
120
180
240
300
360
0 50 100 150 200 250 300 350 400 450 500 550 600 650 700 750 800 850 900 950
Win
d d
ire
ctio
n (
de
gre
es)
Hours
WindScape Measurement

WINDLAB LIMITED 8
WindScape – a competitive advantage
TRADITIONAL METHODS
WindScape is a proprietary, industry leading atmospheric wind modelling and wind energy assessment technology. WindScape is used by Windlab to identify high quality wind resources and develop these opportunities in a manner
which optimises electricity generation and economic returns
WINDSCAPE
Maps vast areas for wind speed, time of day anddirection at a high resolution of 100 square meters orbetter. Can be used to prospect for wind farmsanywhere in the world
O
During prospecting, Windlab builds site specificvirtual wind farms at a desktop level. Windlab canrank competitiveness of all potential wind farmlocations in a given area
For sites which are being pursued Windlab canaccurately estimate project configuration and energyoutput
Low resolution wind maps of between three and tenkilometres. At this resolution, topographic featuresthat accelerate wind are often hidden. Prospectorstypically then travel to the region to search for landformations that may indicate a good wind resource
Erect a metrological mast to collect weather data.Both expensive and time consuming
Outdated and inaccurate extrapolation models toestimate wind resource at potential turbine locations
O
O
O The process is speculative and opportunisticRapid, efficient and targeted development

1Market Overview
99WINDLAB LIMITED

WINDLAB LIMITED
Market Overview
Wind technologyWind turbine technology has advanced to enable larger turbines, taller hub heights, and bigger generators
Larger turbines and rotor diameters
Bigger generatorsTaller hub heights
Wind turbines make up the largest capex component of an onshore wind project. Continued advances in technology are driving increased capacity factors and lower costs
Source: International Energy Agency, “Technology Roadmap: Wind energy, 2013 edition”.
10

WINDLAB LIMITED 11
Market Overview
Cost of energy generationIn a large number of markets including Australia, wind energy is the cheapest way of adding new generation capacity. Further long term cost improvements are anticipated due to technology advancements, scale and manufacturing efficiencies
LCOE IN AUSTRALIA
Source: Bloomberg New Energy Finance.
Investment in renewable energy generation globally has been concentrated towards wind and solar technologies, both of which have experienced rapid reductions in the levelised cost of energy (LCOE).
LCOE is a measure of the average cost of producing electricity from a specific generating technology, representing the cost per MWh of building and operating a generating plant in order to breakeven over an assumed financial life.

WINDLAB LIMITED
STATE/TERR
TARGET YEAR MECHANISM
QLD 50% 2030 Partial reverse auctions (further announcements expected)
ACT 100% 2020 Reverse auctions (completed)
SA 50% 2025 None (ambition only)
VIC 40% 2025 To be decided – reverse auction likely
12
Market Overview
Increasing Australian regulatory supportAustralia’s national and state base renewable energy targets drive demand for wind generation projects
RENEWABLE ENERGY TARGET
Target of 33,000 GWh from renewables by 2020, equating
to 23.5% of Australia’s electricity demand
The Clean Energy Regulator estimated that by 2020,
approximately 6,000 MW of new large-scale generation
capacity will need to be constructed, through a mix of
approximately 25% solar and 75% wind
STATE TARGETS
FINKEL REVIEW
The reliability of the NEM should be underpinned by an orderly
energy mix transition. Finkel’s key recommendations for this
transition:
At the scheduled end of the RET in 2020, a Clean Energy
Target is implemented
All large generators provide three years’ notice of closure, to
signal investment opportunities for new generation, and
provide community awareness
New renewable generators installed in regions with a very
high proportion of variable renewable energy are
complemented by dispatchable capacity such as battery
storage
Source: Clean Energy Regulator, Windlab.
Under the Paris Agreement, Australia has committed to target a reduction in greenhouse gas emissions of 26-28% on 2005 levels by 2030. Australia’s renewable energy target (RET) and various state government policy initiatives drive immediate and mid-term demand for renewables. The Finkel Review provides recommendations for Australia’s long term transition in energy mix

WINDLAB LIMITED 13
Market Overview
Australia’s changing energy mix
CAPACITY BY REGION
AGE OF COAL GENERATION CAPACITY
Source: AEMO. Data is current at 19 May 2017.
Source: Bloomberg New Energy Finance.
CURRENT MIX IN THE NEM FUTURE SOLUTION
The Australian energy market is projected to continue to transition away from fossil fuel generation towards renewable generation, particularly solar and wind
The increase in wind and solar generation has affected the viability ofsome existing thermal generation, and in recent years several coalgenerators have been retired or closed. Further closures are expected asthe cost of refurbishing, retrofitting, rebuilding, or running old coal powerstations is not competitive with building new renewable generation

WINDLAB LIMITED 14
Market Overview
Africa
Source: Bloomberg New Energy Finance.
CURRENT SITUATION FORECAST RENEWABLES CAPACITY
SUB SAHARAN AFRICA (EXCLUDING SOUTH AFRICA)
Sub Saharan Africa (SSA) is the most electricity poor region in the world
Windlab operates in or has identified pipeline projects in Tanzania, Mozambique,
Zambia, Ethiopia and Kenya
These countries are home to more than 300 million people
Increases in energy demand have severely outstripped capacity growth with millions
experiencing frequent black outs
Government support for immediate and substantial investment in electricity
generation projects to meet the fourfold increase in demand expected by 2040
SOUTH AFRICA
Coal currently supplies 77% of the country’s electricity generation1
Regular electricity shortages
National renewable energy target of 17,800 MW capacity by 2030
Rapid developments in the wind energy industry place South Africa among the
leading new wind markets globally due to the government’s Renewable Energy
Independent Power Producer Procurement Program (REIPPPP)
Economic downturn and subsequent reduced demand, coupled with political
interference has stalled the current procurement program. Management believes
fundamentals for renewables are strong with aging coal plant replacement and
demand growth
Africa is the most electricity poor region in the world. Rapid population and economic growth is driving demand for electricity, much of which is expected to be met by renewables
SSA (EXCLUDING SOUTH AFRICA)
SOUTH AFRICA
Note 1: Global Wind Energy Council, “Global Wind 2016 Report”.

2Projects
1515WINDLAB LIMITED

WINDLAB LIMITED 16
Projects
Track record – completed and sold
NAME LOCATION CAPACITY TURBINES SITE
IDENTIFIED
OPERATIONAL DETAILS
OaklandsHill
Victoria, Australia 63 MW 32 2005 2012 Windlab completed the development in partnership initially with Investec, and later AGL. Windlab supplied the site along with the wind engineering expertise and key support for the planning process
Collgar Western Australia, Australia
206 MW 111 2006 2012 Project jointly developed with Investec
Amakhala Emoyeni (Phase 1)
Eastern Cape, South Africa
134 MW 56 2009 2016 In 2011, Windlab executed a sale agreement with Cennergi, a JV between Exxaro and India's Tata Power Company to acquire Phase 1 of the project on award of a PPA. The project received a 20 year PPA with South Africa's national utility Eskom
Bull Creek Alberta, Canada 29 MW 17 2007 2015 Windlab sold 100% of its interests in the project to BluEarth Renewables in December 2011
OAKLANDS HILL COLLGAR AMAKHALA EMOYENI (PHASE 1) BULL CREEK
Windlab has developed and sold its interests in four projects which have subsequently been constructed and are now fully operational
WINDLAB LIMITED 17
Projects
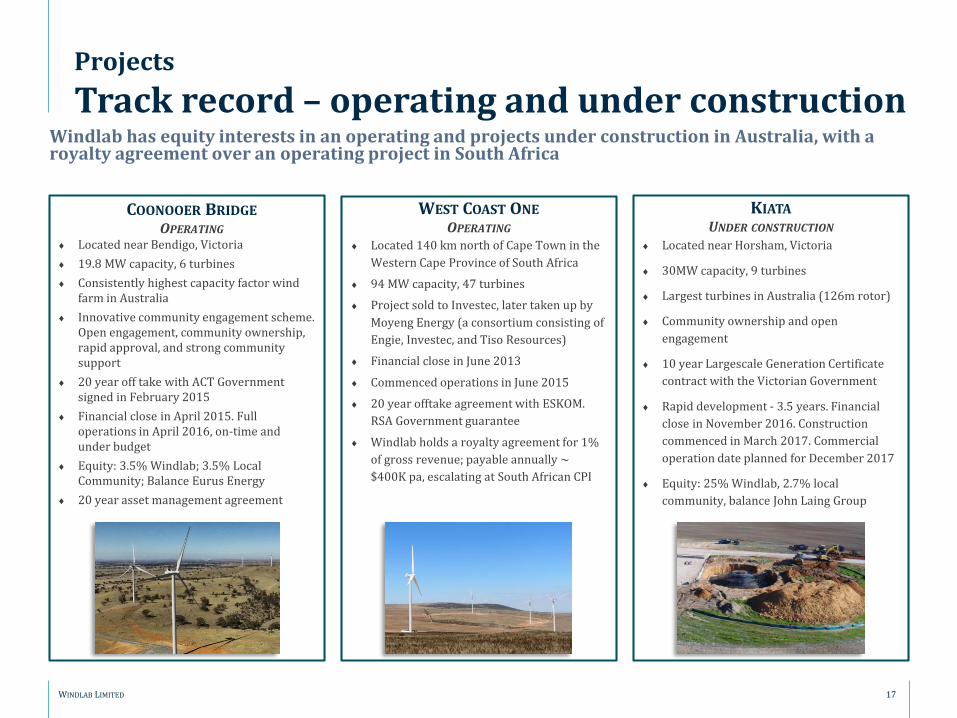
Track record – operating and under construction
COONOOER BRIDGE
OPERATING
Windlab has equity interests in an operating and projects under construction in Australia, with a royalty agreement over an operating project in South Africa
WEST COAST ONE
OPERATING
KIATA
UNDER CONSTRUCTION
Located near Bendigo, Victoria
19.8 MW capacity, 6 turbines
Consistently highest capacity factor wind farm in Australia
Innovative community engagement scheme. Open engagement, community ownership, rapid approval, and strong community support
20 year off take with ACT Government signed in February 2015
Financial close in April 2015. Full operations in April 2016, on-time and under budget
Equity: 3.5% Windlab; 3.5% Local Community; Balance Eurus Energy
20 year asset management agreement
Located 140 km north of Cape Town in the
Western Cape Province of South Africa
94 MW capacity, 47 turbines
Project sold to Investec, later taken up by
Moyeng Energy (a consortium consisting of
Engie, Investec, and Tiso Resources)
Financial close in June 2013
Commenced operations in June 2015
20 year offtake agreement with ESKOM.
RSA Government guarantee
Windlab holds a royalty agreement for 1%
of gross revenue; payable annually ~
$400K pa, escalating at South African CPI
Located near Horsham, Victoria
30MW capacity, 9 turbines
Largest turbines in Australia (126m rotor)
Community ownership and open
engagement
10 year Largescale Generation Certificate
contract with the Victorian Government
Rapid development - 3.5 years. Financial
close in November 2016. Construction
commenced in March 2017. Commercial
operation date planned for December 2017
Equity: 25% Windlab, 2.7% local
community, balance John Laing Group

WINDLAB LIMITED 18
Projects
Asset Management
EXISTING ASSET MANAGEMENT AGREEMENTS
PROJECT SIZE CONTRACT TERMS
Coonooer Bridge 20 MW 20 years, CPI indexed. Commenced in 2016
Ararat 240 MW 10 years, CPI indexed. Commenced in 2016
Kiata 30 MW Construction, plus 5 years, CPI indexed, with 5 year option
Windlab provides wind farm management services for projects through construction and operations
During construction: stake holder and construction management via oversight of the Engineering and Procurement Contract
During operations: electricity market operations, contract management, performance management, on-going community engagement and back
office services
Windlab provides asset management services to both Windlab developed third party owned projects (Ararat)
Forecast FY2017 revenue of $2.7 million from asset management fees
Windlab’s intention is to retain asset management rights for projects which it develops in Australia and South Africa. For example, in relation to the
Kennedy Energy Park, management expect to retain asset management rights for the project throughout construction and commercial operations
Windlab is actively pursuing asset management opportunities for third party renewable energy projects in Australia

WINDLAB LIMITED 19
Projects
Development pipeline summaryWindlab has a geographically diverse development portfolio of 48 projects at various stages of development which represent an estimated potential capacity of more than 7,000 MW
20182017
Coopers Gap
Kennedy Phase 1 Lakeland
SUMMARY OF DEVELOPMENT PIPELINE
EXPECTED TIMING OF KEY DEVELOPMENTS
COUNTRY ACQUISITION VALIDATIONAPPROVALS AND
PERMITTING
OFFTAKE AND
FINANCINGTOTAL
Australia 3 4 3 3 13
North America - 3 1 2 6
South Africa - 3 1 5 9
SSA (excluding South Africa)
18 1 1 - 20
Total 21 11 6 10 48
2019 2020
Kennedy Phase II
VerdigreIshwati
Emoyeni
Umsinde Emoyeni
GreenwichMsenge
Emoyeni
Iziduli Emoyeni

WINDLAB LIMITED 20
Projects
Development pipeline – late stage
NAME LOCATION CAPACITY2DEVELOPMENT
APPROVAL ORPERMIT
OWNERSHIP
BEYONDFINANCIAL CLOSE
ASSET
MANAGEMENT
Kennedy Energy Park Phase I Queensland, Australia 58 MW
Coopers Gap Queensland, Australia 460 MW x x
Lakeland Queensland, Australia 100 MW Underway
Greenwich Ohio, USA 60 MW x x
Verdigre Nebraska, USA 230 MW3 x x
Msenge Emoyeni Western Cape, South Africa 140 MW
Ishwati Emoyeni Karoo region, South Africa 140 MW
Umsinde Emoyeni (Phase I & II) Karoo region, South Africa 280 MW
Iziduli Emoyeni Karoo region, South Africa 82 MW
Ten projects with a combined capacity of 1,333 MW1 hold a development approval or permit.Additionally, the Lakeland project in Queensland has an approval underway and is expected to reach financial close in FY2018
Notes 1. Nine of the projects (including both phases of Umsinde Emoyeni) with a combined approved capacity of 1,300 MW are shown above (also see notes 2 and 3). Another project which
Windlab previously developed and sold has approval to increase installed capacity by 32 MW. Windlab will receive an ongoing royalty payment in relation to this extension 2. Likely maximum installed capacity3. Verdigre has an approved capacity of 80 MW, however is likely to be upgraded to a maximum capacity of 230 MW as shown in the table above

WINDLAB LIMITED 21
Projects
Kennedy Energy Park Phase I
LocationHughenden, North Queensland, in land from Townsville. Part of Windlab’s Kennedy energy precinct
Ownership
The project is being developed under a JV with the Eurus Energy Holdings Corporation. It is currently anticipated that Windlab and Eurus will each invest approximately $25 million1 into Kennedy Energy Park Phase I at financial close to maintain their respective 50% equity interests in the project
Type
Wind (41 MW)
Solar (15 MW)
Battery storage (2 MW / 4 MWh)
Funding$18 million ARENA funding – zero coupon repayable grant
Status Fully approved
TimelineFinancial close: Q3 2017
Commercial operations: Q4 2018
An innovative hybrid renewable energy project with world class solar and wind resources
GENERATION PROFILE
THE PROJECT ADDRESSES MANY OF FINKEL’S RECOMMENDATIONS
Source: Windlab; AEMO.
PROJECT SUMMARY
Increasing penetration of
renewables
Combining of complementary wind and solar
Storage for reliability,
frequency support and synthetic inertia
1. Approximate equity contribution

WINDLAB LIMITED 22
Projects
Kennedy Energy Park Phase II
Location80 kilometres north of Kennedy Energy Park Phase I
Ownership Windlab – 100%
Type
Land is large enough to support more than 1,200 MW of wind energy generation and additional solar generation and on-site storage
Status
Extensive wind and solar resource
monitoring and assessment complete
A number of environmental studies
complete
Indigenous land use agreement has been
finalised with the local Yirrandali people
Full development application expected to
be submitted to the State Government in
late 2017
In June 2017 the Queensland government unveiled plans to build a new transmission line in North Queensland to support the development of Kennedy Phase II and other renewable energy projects
POWERING NORTH QUEENSLAND PLAN
In June 2017 the Queensland Government unveiled its “Powering North
Queensland Plan”
Includes a proposal to build a new 500 kilometre transmission line in
the north of the state to unlock barriers to more than 2,000 MW of large
scale wind, solar and hydro projects, and create 5,000 jobs
The Queensland government announced the decision on the basis that it
is now cheaper to build new wind and solar than new coal plants
Windlab will be a major beneficiary of this government proposal as the
Company controls the 1,200 MW wind and solar park, Kennedy Phase II
PROJECT SUMMARY
Source: Queensland Government Department of Energy and Water Supply.
At 1,200 MW, Kennedy Energy Park Phase II is likely to be Australia’s largest wind farm project

WINDLAB LIMITED 23
Projects
Australia
See notes on following page

WINDLAB LIMITED 24
Projects
Africa and North America
Notes: 1. Early stage developments are not shown due to commercial sensitivity.2. Windlab is likely to retain a carried equity interest in this project upon financial close of between 15%
and 25% through the partial reinvestment of development margin received.3. Coopers Gap project is no longer owned by Windlab however ongoing technical wind services are
provided at the site, for which Windlab receives various milestone payments.
4. Windlab has entered into an option agreement to sell the Greenwich project for US$4 million, paid as success fees on financial close and commercial operation.
5. Verdigre is no longer owned by Windlab but Windlab retains a contractual right to success fees when the project reaches financial close and commercial operation.
6. WIndlab is likely to retain a carried equity interest in these projects upon financial close of between 12% and 20% through the partial reinvestment of development margin received.
3Financials
2525WINDLAB LIMITED

WINDLAB LIMITED 26
Financials
Historical and forecast profit and lossStrong historical and forecast revenue and EBITDA growth with a CAGR of 65% and 119% respectively between 1 January 2014 and 31 December 2017, including a growing stream of annuity cashflows coming from asset ownership and management
5,137
9,099
17,082
23,232
1,395 2,029
9,923
14,654
-
5,000
10,000
15,000
20,000
25,000
FY2014 FY2015 FY2016 FY2017 (F)
A$
'00
0
Revenue Operating EBITDA
The revenue forecast for FY2017 includes:
$4.0 million already received in April
2017 in relation to the Moyeng
portfolio, and $0.3 million received in
May in relation Greenwich
$5.0 million to be received as a result of
the financial close for Kennedy Energy
Park Phase I
$10.3 million to be received in relation
to the third and final milestone
payment for Coopers Gap
FY = fiscal year end 31 December.

WINDLAB LIMITED 27
Financials
Profit and loss and balance sheet
SUMMARY PRO FORMA PROFIT AND LOSS
$’000 Pro Forma HistoricalPro Forma
Forecast
December year end FY2014 FY2015 FY2016 FY2017
Revenue 5,137 9,099 17,082 23,232
Gross margin 4,604 5,113 13,642 20,031
Operating EBITDA 1,395 2,029 9,923 14,654
Impairment of projects (241) (490) (4,400) -
EBITDA after significant items 1,154 1,539 5,523 14,654
EBIT 748 1,185 5,244 14,354
PBT 654 1,185 4,861 14,290
NPAT 688 1,193 3,267 9,301
NPAT (before significant items) 929 1,683 7,667 9,301
BALANCE SHEET
$’000
As at 31 December 2016 Audited Pro Forma
Assets
Current assets
Cash and cash equivalents 8,593 31,060
Trade and other receivables 1,040 1,040
Inventory 5,302 5,302
Other current assets 168 168
Total current assets 15,103 37,570
Non current assets
PPE 304 304
Investments 13,883 13,883
Inventory 5,103 5,422
Deferred tax asset – 761
Total non current assets 19,290 20,370
Total assets 34,393 57,940
Liabilities
Current liabilities
Trade and other payables 2,169 2,169
Provisions 904 904
Total current liabilities 3,073 3,073
Non current liabilities
Provisions 179 179
Borrowings 15,008 4,565
DTL 2,729 2,729
Total non current liabilities 17,916 7,437
Total liabilities 20,989 10,546
Net assets 13,404 47,394
Shareholders equity
Issued capital 19,016 54,440
Accumulated losses (7,485) (9,183)
Reserves 706 970
NCI 1,167 1,167
Total shareholder’s equity 13,404 47,394

4Board and Management
2828WINDLAB LIMITED
WINDLAB LIMITED 29
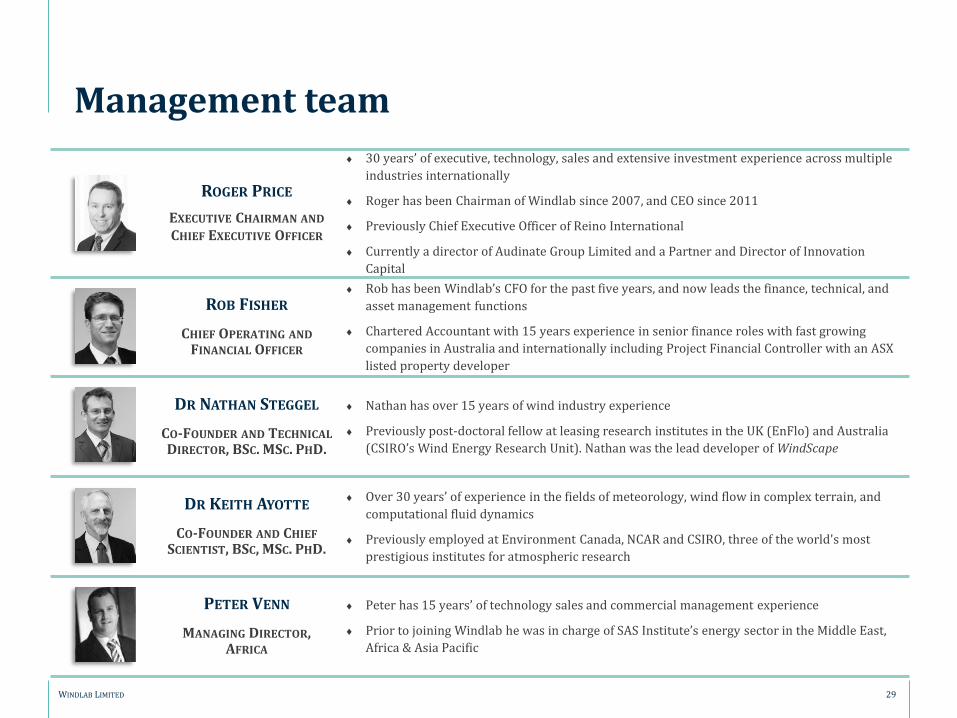
Management team
ROGER PRICE
EXECUTIVE CHAIRMAN AND
CHIEF EXECUTIVE OFFICER
30 years’ of executive, technology, sales and extensive investment experience across multiple
industries internationally
Roger has been Chairman of Windlab since 2007, and CEO since 2011
Previously Chief Executive Officer of Reino International
Currently a director of Audinate Group Limited and a Partner and Director of Innovation
Capital
ROB FISHER
CHIEF OPERATING AND
FINANCIAL OFFICER
Rob has been Windlab’s CFO for the past five years, and now leads the finance, technical, and
asset management functions
Chartered Accountant with 15 years experience in senior finance roles with fast growing
companies in Australia and internationally including Project Financial Controller with an ASX
listed property developer
DR NATHAN STEGGEL
CO-FOUNDER AND TECHNICAL
DIRECTOR, BSC. MSC. PHD.
Nathan has over 15 years of wind industry experience
Previously post-doctoral fellow at leasing research institutes in the UK (EnFlo) and Australia
(CSIRO’s Wind Energy Research Unit). Nathan was the lead developer of WindScape
DR KEITH AYOTTE
CO-FOUNDER AND CHIEF
SCIENTIST, BSC, MSC. PHD.
Over 30 years’ of experience in the fields of meteorology, wind flow in complex terrain, and
computational fluid dynamics
Previously employed at Environment Canada, NCAR and CSIRO, three of the world's most
prestigious institutes for atmospheric research
PETER VENN
MANAGING DIRECTOR, AFRICA
Peter has 15 years’ of technology sales and commercial management experience
Prior to joining Windlab he was in charge of SAS Institute’s energy sector in the Middle East,
Africa & Asia Pacific

WINDLAB LIMITED 30
Board
ROGER PRICE
EXECUTIVE CHAIRMAN AND
CHIEF EXECUTIVE OFFICER
See previous page
JOSEPH O’BRIEN
INDEPENDENT NON-EXECUTIVE DIRECTOR
20 years’ experience within the energy-supply industry, spanning electricity supply across
infrastructure and trading markets
Previously CEO of Hill Michael
Currently serves as the Executive Chairman of VisIR, a specialist private-equity investor
PIPPA DOWNES
INDEPENDENT NON-EXECUTIVE DIRECTOR
Over 25 years of experience in global financial services organisations
Previously Managing Director and Equity Partner at Goldman Sachs in Australia
Currently serves on the boards of the Infotrack Group, Sydney Olympic Park Authority and
ALE Property Group
CHARLES MACEK
INDEPENDENT NON-EXECUTIVE DIRECTOR
Over 15 years’ experience on the boards of companies in diverse industries
Previously on the boards of both Wesfarmers and Telstra
Currently the chair of the boards of Vivid Technology Limited, chair of the Remuneration and
HR Committee of Vicinity Ltd., consultant to the Investment Committee of Unisuper Ltd., and a
Senior Corporate Advisor to the MMC group
JOHN COOPER
INDEPENDENT NON-EXECUTIVE DIRECTOR
Over 10 years’ experience on the boards of companies in both executive and non-executive
roles in the engineering, mining and construction industries
Previously CEO and managing director of CMPS&F and non-executive director of Murray &
Roberts International
Currently a member of the board of Aurizon Holdings and Sydney Motorway Corporation.
Formerly a non-executive director of UGL Group

WINDLAB LIMITED 31
This document has been prepared solely for the purpose of providing potential investors with information about Windlab Limited (WND, Windlab, or the Company). The information
contained in this document does not purport to contain all of the information that a potential investor may need or desire. Potential investors should conduct their own investigation and
analysis of WND and of the information contained in this document and should rely solely on their own judgement, review and analysis in deciding whether to invest in WND. This document
is not intended to be financial product or investment advice nor is it a recommendation to acquire any securities. This document has been prepared without taking into account the
objectives, financial situation or needs of individuals. Before making any investment decision, potential investors are recommended to seek their own legal, taxation and financial advice
appropriate to their individual circumstances.
This document does not constitute an offer, invitation or recommendation to any person to acquire securities. Neither the information contained in this document nor any further
information made available by WND in connection with a potential investment in WND will form the basis of, or be construed as, an offer to acquire securities. This presentation is for
information purposes only and is not a prospectus, product disclosure statement, pathfinder document for the purposes of section 734(9) of the Corporations Act 2001 (Cth) (“Corporations
Act”) or other offer document under Australian law or the law of any other jurisdiction. This presentation does not constitute an invitation to apply for or purchase securities and does not
contain any application form for securities.
The information contained in this document has not been independently verified. This document includes certain forward looking statements, estimates and projections that involve
subjective views of the anticipated future performance of WND that may or may not be correct. Such forward looking statements, estimates and projections are not guarantees of future
performance and involve known and unknown risks, uncertainties and other factors, many of which are outside the control of WND. WND and its representatives and associates may amend
or replace the document at any time and are not obliged to provide the recipient with any additional information, or to update or correct any inaccuracies which may become apparent in this
document.
To the maximum extent permitted by law, WND and each of its representatives and associates make no representations or warranties whether express or implied as to the currency,
accuracy, reliability or completeness of any information provided to the recipient about WND or any potential investment in WND (including this document and any other written or oral
communication about WND or any potential investment in WND) (Information). WND and each of its representatives and associates are not responsible for, and will not be liable for, any
claim, loss, damage, cost or expense, whether direct, indirect, consequential or otherwise (including in negligence) out of or in connection with the Information.
The distribution of this document outside of Australia may be restricted by law and any such restrictions should be observed. This document may not be distributed or released to any person
in the United States.
Disclaimer