window glass analysis approaches
DESCRIPTION
Analysis of historic glass windows in buildingsTRANSCRIPT

Technical Briefs in hisTorical archaeology, 2009, 4: 29–40
ABSTRACT
The measurement of the thickness of window glass to determine relative dates for historic-structure sites has been practiced by historical archaeologists for 40 years, yet much could be done to understand this research tech-nique better. a number of different approaches to analysis exist, each with its own strictures, date ranges, and regions of application. for this study six of these methods were reviewed, compared, and tested on eight historic window glass collections in an attempt to reduce confusion on the topic and provide researchers with a tool for choosing the most appropriate method.
Introduction
Window glass, by its shear ubiquity at historic sites, de-serves attention as a potential source of valuable dating information. Window glass analysis constitutes a serious attempt to make use of that resource. Despite the long application of this technique, the results of window glass analyses are often considered to have dubious legitimacy. Much of the problem stems from a lack of information or an investigator not knowing more recent and sophis-ticated methods. in recognition of these challenges, this article has three goals: first, to explain briefly the premise of window glass analysis and why it is believed to work; second, to compare concisely six methods developed for conducting window glass analysis; and third, to present the practical insights gained by testing those methods so that archaeologists can evaluate the utility of window glass analysis, or at the very least, better understand the results of window glass analyses they find in the reports of other investigators.
Window Glass Analysis
Window glass analysis is a process of determining a relative initial construction date for historic structures in north
america by recording the thickness of the window glass—produced by the cylinder glass manufacturing technique—found on location and then analyzing the resulting data in modes, or by inserting the mean of the thickness data into a regression formula. The process of conducting window glass analysis involves using a micrometer to measure the thickness of a sample of window pane fragments and recording other information pertinent to the method of window glass analysis being employed.
This dating method is thought to work because during the first part of the 19th century the process of window glass production called cylinder glass became the predomi-nant method of window glass manufacture (Davis 1949), and this form of window glass became gradually thicker over the next 70 to 100 years.
although there were variations in the process, in gen-eral these steps were followed: a skilled laborer produced a long cylinder of glass by blowing a molten ball of glass, or “gather,” into a sphere and “swinging” the molten glass into a cylinder shape. The ends of the cylinder were cut off and the cylinder was cut along its length while the glass was still semi-malleable. The resulting large curved pane was then flattened, cooled, and cut into smaller panes (Douglas and frank 1972). What later proved serendipitous for archae-ologists was that this manufacturing technique produced glass of highly uniform thickness. The manufacturing tech-nique popular immediately prior to cylinder glass, often referred to as crown glass, does not produce a pane of glass uniform in thickness across a sheet.
as the 19th century progressed, americans wanted larger and larger window panes. larger windows neces-sitated thicker glass (roenke 1978). as a result, cylinder glass increased in thickness steadily, if not uniformly. This thickening continued until as late as the first few decades of the 20th century. after that time, skilled laborers were almost completely replaced by machine production (Douglas and frank 1972) and the thickness of glass was
A Comparison and Review of Window Glass Analysis Approaches in Historical Archaeology
Jonathan Weiland
30 Technical Briefs in hisTorical archaeology
a coMparison anD revieW of WinDoW glass analysis approaches in hisTorical archaeology
more or less standardized at 3.0 to 3.3 mm (Walker 1971; Moir 1987).
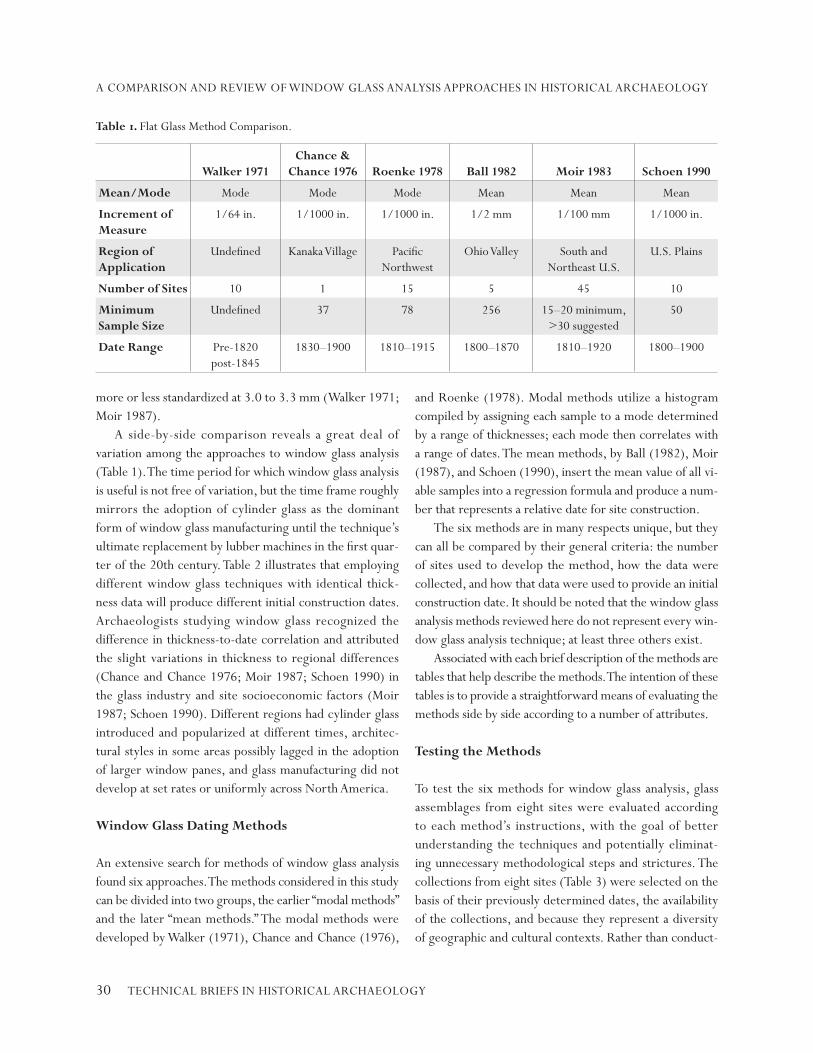
a side-by-side comparison reveals a great deal of variation among the approaches to window glass analysis (Table 1). The time period for which window glass analysis is useful is not free of variation, but the time frame roughly mirrors the adoption of cylinder glass as the dominant form of window glass manufacturing until the technique’s ultimate replacement by lubber machines in the first quar-ter of the 20th century. Table 2 illustrates that employing different window glass techniques with identical thick-ness data will produce different initial construction dates. archaeologists studying window glass recognized the difference in thickness-to-date correlation and attributed the slight variations in thickness to regional differences (chance and chance 1976; Moir 1987; schoen 1990) in the glass industry and site socioeconomic factors (Moir 1987; schoen 1990). Different regions had cylinder glass introduced and popularized at different times, architec-tural styles in some areas possibly lagged in the adoption of larger window panes, and glass manufacturing did not develop at set rates or uniformly across north america.
Window Glass Dating Methods
an extensive search for methods of window glass analysis found six approaches. The methods considered in this study can be divided into two groups, the earlier “modal methods” and the later “mean methods.” The modal methods were developed by Walker (1971), chance and chance (1976),
and roenke (1978). Modal methods utilize a histogram compiled by assigning each sample to a mode determined by a range of thicknesses; each mode then correlates with a range of dates. The mean methods, by Ball (1982), Moir (1987), and schoen (1990), insert the mean value of all vi-able samples into a regression formula and produce a num-ber that represents a relative date for site construction.
The six methods are in many respects unique, but they can all be compared by their general criteria: the number of sites used to develop the method, how the data were collected, and how that data were used to provide an initial construction date. it should be noted that the window glass analysis methods reviewed here do not represent every win-dow glass analysis technique; at least three others exist.
associated with each brief description of the methods are tables that help describe the methods. The intention of these tables is to provide a straightforward means of evaluating the methods side by side according to a number of attributes.
Testing the Methods
To test the six methods for window glass analysis, glass assemblages from eight sites were evaluated according to each method’s instructions, with the goal of better understanding the techniques and potentially eliminat-ing unnecessary methodological steps and strictures. The collections from eight sites (Table 3) were selected on the basis of their previously determined dates, the availability of the collections, and because they represent a diversity of geographic and cultural contexts. rather than conduct-
Table 1. flat glass Method comparison.
Walker 1971Chance &
Chance 1976 Roenke 1978 Ball 1982 Moir 1983 Schoen 1990
Mean/Mode Mode Mode Mode Mean Mean Mean
Increment of Measure
1/64 in. 1/1000 in. 1/1000 in. 1/2 mm 1/100 mm 1/1000 in.
Region of Application
Undefined Kanaka village pacific northwest
ohio valley south and northeast U.s.
U.s. plains
Number of Sites 10 1 15 5 45 10
Minimum Sample Size
Undefined 37 78 256 15–20 minimum, >30 suggested
50
Date Range pre-1820 post-1845
1830–1900 1810–1915 1800–1870 1810–1920 1800–1900

Technical Briefs in hisTorical archaeology 31
JonaThan WeilanD
Table 2. arbitrary Dating results of Methods by Thickness.
0.01mm 0.001 in. 1/64 in.Walker
1971Chance &
Chance 1976 Roenke 1978 Ball 1982Moir 1983
Schoen 1990
0.75 0.030 2 <18450.80 0.031 3 <18450.85 0.033 3 <18450.90 0.035 3 <18450.95 0.037 3 <18451.00 0.039 3 <1845 1800.01.05 0.041 3 <1845 1801.71.10 0.043 3 <1845 1803.5 1799.91.15 0.045 3 <1845 1830–1840 1820–1835,1835–1845 1805.2 1809.6 1803.31.20 0.047 4 >1845 1830–1840 1820–1835,1835–1845 1807.0 1813.8 1806.61.25 0.049 4 >1845 1830–1840 1820–1835,1835–1845 1808.7 1818.0 1810.01.30 0.051 4 >1845 1830–1840 1820–1835,1835–1845 1810.5 1822.2 1813.41.35 0.053 4 >1845 1830–1840 1820–1835,1835–1845 1812.2 1826.4 1816.71.40 0.055 4 >1845 1835–1845 1810–1825,1820–1835,1835–1845 1814.0 1830.6 1820.11.45 0.057 4 >1845 1835–1845 1810–1825,1820–1835,1835–1845 1815.7 1834.8 1823.51.50 0.059 4 >1845 1835–1845 1810–1825,1820–1835,1835–1845 1817.5 1839.0 1826.91.55 0.061 4 >1845 1835–1845 1810–1825,1820–1835,1835–1845 1819.2 1843.2 1830.21.60 0.063 5 >1845 1835–1845 1810–1825,1820–1835,1835–1845 1821.0 1847.5 1833.61.65 0.065 5 >1845 1840–1850 1845–1855 1822.7 1851.7 1837.01.70 0.067 5 >1845 1840–1850 1845–1855 1824.5 1855.9 1840.31.75 0.069 5 >1845 1840–1850 1845–1855 1826.2 1860.1 1843.71.80 0.071 5 >1845 1840–1850 1845–1855 1828.0 1864.3 1847.11.85 0.073 5 >1845 1840–1850 1845–1855 1829.7 1868.5 1850.51.90 0.075 5 >1845 1850–1860 1850–1865 1831.5 1872.7 1853.81.95 0.077 5 >1845 1850–1860 1850–1865 1833.2 1876.9 1857.22.00 0.079 6 >1845 1850–1860 1850–1865 1835.0 1881.1 1860.62.05 0.081 6 >1845 1850–1860 1850–1865 1836.7 1885.4 1864.02.10 0.083 6 >1845 1850–1860 1850–1865 1838.5 1889.6 1867.32.15 0.085 6 >1845 1855–1885 1855–1885 1840.2 1893.8 1870.72.20 0.087 6 >1845 1855–1885 1855–1885 1842.0 1898.0 1874.12.25 0.089 6 >1845 1855–1885 1855–1885 1843.7 1902.2 1877.42.30 0.091 6 >1845 1855–1885 1855–1885 1845.5 1906.4 1880.82.35 0.093 6 >1845 1855–1885 1855–1885 1847.2 1910.6 1884.22.40 0.094 7 >1845 1855–1885 1855–1885 1849.0 1914.8 1887.62.45 0.096 7 >1845 1870–1990 1870–1990 1850.7 1919.0 1890.92.50 0.098 7 >1845 1870–1990 1870–1990 1852.4 1923.3 1894.32.55 0.100 7 >1845 1870–1990 1870–1990 1854.2 1897.72.60 0.102 7 >1845 1870–1990 1870–1990 1855.9 1901.02.65 0.104 7 >1845 1870–1990 1870–1990 1857.72.70 0.106 7 >1845 1900–1915 1859.42.75 0.108 7 >1845 1900–1915 1861.22.80 0.110 8 >1845 1900–1915 1862.92.85 0.112 8 >1845 1900–1915 1864.72.90 0.114 8 >1845 1900–1915 1866.42.95 0.116 8 >1845 1868.23.00 0.118 8 >1845 1869.93.05 0.120 8 >1845 1871.73.10 0.122 8 >18453.15 0.124 8 >18453.20 0.126 9 >1845

32 Technical Briefs in hisTorical archaeology
a coMparison anD revieW of WinDoW glass analysis approaches in hisTorical archaeology
ing six tests on each of the eight sites, the data from all the methods were collected in a database once, and that database was filtered according to the strictures for each of the six methods (Table 4).
a problem is immediately obvious to anyone familiar with this dating technique. as previously mentioned, most window glass analysis methods are explicitly designed for certain non-overlapping regions of the United states. some of the sites used in this comparison also violate other stric-tures, such as the schoen and Moir method requirement to exclude structures from upper socioeconomic-class sites. such violations are unavoidable, as the site selection criteria for these methods make it impossible for a single site to be viable for all methods. This means that the results from this testing of dating techniques have questionable legitimacy when it comes to reviewing the overall accuracy of the meth-ods. nonetheless, this approach allowed for a comparative review of how the methods differ in a number of aspects,
such as sample size, the effectiveness of strictures, and to a certain extent, how time-consuming the methods are.
in addition to the brief discussion of each method, a table is supplied to present pertinent information in order to provide an easy basis for comparisons of how each meth-od of window glass analysis is conducted. in some cases, especially with older methods, it is entirely possible that all the details of the investigation were not explicit in the original study. nevertheless the studies were presented in identical format even if they were written in a way that did not lend them to this process. These tables are no substitute for reviewing the entire reports by the various authors.
Walker
published in 1971, Walker’s window glass study (Table 5) is the earliest reviewed in this article, and is referenced by later investigators as the original attempt to create a
Table 3. Tested sites.
LocationTotal Pieces of
Glass (n)Documented
Occupation Dates Site Type
Bailey Brick House chesterton, indiana 1,717 1800–present Domestic structure
Boston House (33SU270) Boston county, ohio 1,747 1836–present general store
Burch Lot (13SG1328) springfield, illinois 161 1840–1900 Domestic structure
Carrigan Lot (13SG1327) springfield, illinois 115 1840–1880 Domestic structure
Freeman School (25GA90) gage county, nebraska 13 1870–present school
Freeman Cabin (25GA91) gage county, nebraska 29 1800–? homestead cabin
Lawnfield Mentor, ohio 1,045 1800–present Domestic structure
Miller House (11SG1318) springfield, illinois 215 1800–present Domestic structure
Table 4. Thickness analysis results.
Walker 1971Chance &
Chance 1976 Roenke 1978 Ball 1982 Moir 1983 Schoen 1990
Bailey Brick House post-1845 1870–1900 1870–1900 1854.93 1903.95 1883.87
Boston House (33SU270) pre-1845 1850–1860 1850–1865 1850.94 1909.05 1889.45
Burch Lot (13SG1328) post-1845 1850–1860 1850–1865 1853.90 1902.34 1877.55
Carrigan Lot (13SG1327) post-1845 1835–1845 1850–1870 1831.92 1857.71 1839.07
Freeman School (25GA90) post-1845 1870–1900 1870–1900 1804.69 1869.79 1866.63
Freeman Cabin (25GA91) post-1845 1855–1885 1855–1885 1864.27 1903.64 1900.97
Lawnfield post-1845 1870–1900 1870–1900 1843.99 1888.15 1861.65
Miller House (11SG1318) post-1845 1870–1900 1870–1900 1834.59 1855.69 1843.69

Technical Briefs in hisTorical archaeology 33
JonaThan WeilanD
window glass dating method (roenke 1978; Moir 1983; schoen 1990). The analysis is only a small part of a larger report on the excavations at the arkansas post Branch Bank in southeast arkansas; in fact the topic of window glass is covered in just two pages. Due to the brevity of the write-up, many details found in other window glass studies are not available in Walker’s study.
little can be stated specifically about the Walker meth-od as a result of the present study. in every test the dating scheme accurately showed a great deal of activity after 1845, but the modal distribution of glass for all eight of the tested sites was more complex than the sample collected by Walker, and there are no clear directions on how to adjust for this complexity. The Walker method also includes glass that would almost certainly be excluded by later methods of window glass analysis. half the samples were partially melted or warped by fire to an undefined degree. Melted and warped glass was measured for thickness while evaluat-ing the methods, and those pieces of glass varied in thick-ness noticeably as a result of being burned.
The significance of Walker’s work is not in the sophis-tication of his techniques, but the pioneering aspect of his investigation. his three-mode scale was groundbreaking work upon which other archeologists expanded.
Chance and Chance
David and Jennifer chance published a window glass dating method in 1976 as an appendix to an excavation report, Kanaka Village Vancouver Barracks 1974. The chance and chance method (Table 6) is also a modal method describ-ing one large site, fort vancouver/Kanaka village, which is split into 12 assemblages from both structures and strata within the site. This site provided an excellent opportunity to illustrate the gradual increase in glass thickness over time because of two factors: the site’s strata were relatively undisturbed, and the large multistructure site probably received most of its glass through bulk orders from distant manufacturers, resulting in considerable continuity in glass thickness across the site.
Table 5. Walker Method, 1971.
Mean/Mode Mode
Applicable Date Ranges 1800 to post-1845
Number of Sites Used to Produce Method
10
Location of Sites arkansas, arizona, north Dakota, south Dakota, Texas, virginia
Increment and Number of Measurements
1/64 in.;1 measurement per piece assumed (unstated)
Region of Application southeast arkansas (arkansas post Bank), thickness data taken from 8 sites around the country (north Dakota, south Dakota, virginia, arizona, Texas)
Sample Sizes arkansas collection, 384 pieces;The sample sizes from the additional sites are not listed
Strictures and Exclusions Window glass 6/64 in. and thicker was considered too thick to be window glass;Modern window glass was determined to be 8/64 in. (3.175 mm) and thicker;partially melted and warped glass was still measured for thickness
Data Processing Take the thickness data collected from each piece of glass and compile histogram;Take the first major mode of thickness and evaluate that mode according the Walker timescale
Dating Scale 2/64 in. (0.794 mm) sites occupied by 1820 and no longer occupied by 1840
3/64 in. (1.191 mm) sites built or occupied prior to 1845
4/64 in. (1.587 mm) or greater sites dating after 1845
6/64 in. (2.381 mm) Thickness exceeds historic context
8/64 in. (3.175 mm) or greater Modern glass thickness

34 Technical Briefs in hisTorical archaeology
a coMparison anD revieW of WinDoW glass analysis approaches in hisTorical archaeology
one of the strengths of the chance and chance modal method is that the results are based on the primary mode. The use of a primary mode to determine a site construc-tion date results in a “built-in” filter for the occasional piece of misidentified bottle glass, mirror fragment, or any win-dow glass of unusual thickness. This study provides clear evidence that glass does indeed get thicker over time at a fairly consistent rate, but given that window glass analysis is a regional dating method and this is a study of one site, later window glass analysis methods probably represent more viable options for archaeologists.
Roenke
roenke’s 1978 method (Table 7) was developed as the focus of an extensive study of window glass, with sections describing historical methods of window manufacturing, and explanations of glass color and chemical composition. This method was developed on a much larger scale then
prior investigations, using 21,965 pieces of glass from 15 different sites. The roenke method and the chance and chance method bear strong resemblances to one other. This is unsurprising since roenke included the data from Kanaka village in developing his chronology and often references the work of David and Jennifer chance in his publication.
roenke’s report also gave extensive instruction on con-ducting window glass analysis, and was the first to have a complex sampling strategy. The roenke method is also the first to advocate the analysis of means and median values—dealing with every collected piece of window glass—as a tool for evaluating a site’s reuse.
The assemblages tested by the roenke method showed modal distributions nearly identical to those of the chance and chance method. This similarity is probably due to the two methods use of the same relatively broad increments of measurement and modal divisions. The strong similar-ity also indicates that measuring each piece three times,
Table 6. chance & chance Method, 1976.
Mean/Mode Mode
Applicable Date Range 1830 to 1900
Number of Sites Used to Produce Method 1 site (12 assemblages)
Location of Sites Kanaka village, southwest Washington
Increment and Number of Measurement
1/1000 in.;1 measurement (assumed)
Region of Application pacific northwest
Sample Sizes sample sizes range from 37 to 378 pieces of window glass
Strictures and Exclusions smallest sample size given is 37 pieces, the largest is 378 pieces;Test the entirety of smaller collections;it is acceptable to subsample larger collections, no specific area (i.e., structure outline, privy, etc.) is mentioned as most valuable for subsampling
Data Processing Distribute glass measurements into 0.005 in. modes and compare with dating scale;The primary mode is the likely date of construction;secondary and tertiary modes may represent repairs or modification
Dating Scale 0.045 in.(1.143 mm) 1830–1840
0.055 in. (1.397 mm) 1835–1845
0.065 in. (1.651 mm) 1840–1850
0.075 in. (1.905 mm) 1850–1860
0.085 in. (2.159 mm) 1855–1885
0.095 in. (2.413 mm) 1870–1900

Technical Briefs in hisTorical archaeology 35
JonaThan WeilanD
as opposed to just once for the roenke method, does not have a significant impact on the results. This was the only example of a method’s strictures being ignored without skewing the final results. The dates that the two approaches produced are not similar, however, because roenke ad-justed the chronological scale after adding the data from 14 other sites.
The roenke method subsampling criteria for large col-lections is to select opaque bags of window glass from each
stratigraphic layer rather than testing the entire collection of glass. This method could not be reproduced, since col-lections for this study were sorted and stored in transpar-ent bags, and roenke based his random selection approach on the fact that his window glass was stored in opaque bags. it was possible, however, to use a random selection func-tion in the measurement database to reduce the sample size of each stratigraphic layer by roughly 75%, and the results from the reduced sample were virtually unchanged.
Table 7. roenke Method, 1978.
Mean/Mode Mode
Applicable Date Range 1810 to 1915
Number of Sites Used to Produce Method
15
Location of Sites 13 in Washington, 2 in the idaho panhandle
Increment and Number of Measurements
1/1000 in., with a fowler dial gauge micrometer;3 for each piece, once at each end, and once in the middle;The middle value was used in the modal representation
Region of Application pacific northwest
Sample Sizes sample sizes range from 78 to 5,819 pieces of glass
Strictures and Exclusions sampling approaches will be dictated by site:small collections should be sampled entirely whenever possible;larger collections can be subsampled by randomly selecting glass from each arbi-trary or stratigraphic level;largest collections can be sampled by testing all pieces excavated from specific structures, and selection should consider the excavation techniques employed at those structures
Data Processing Distribute glass measurements into 0.005 in. modes and compare with dating scale;The primary mode is the likely date of construction;secondary and tertiary modes may represent repairs or modification;augment dating with research into other cultural material, and historical research;Use mean and median with mode and distribution of thickness to consider difference between sites;Means can be used as a single number value for sites with smaller collections
Dating Scale 0.055 in. (1.397 mm) 1810–1825
0.055 in. (1.397 mm) 1820–1835
0.045 in. (1.143 mm) 1830–1840
0.045–0.055 in. (1.43 mm –1.397 mm) 1835–1845
0.065 in. (1.651 mm) 1845–1855
0.075 in. (1.905 mm) 1850–1865
0.085 in. (2.159 mm) 1855–1885
0.095 in. (2.413 mm) 1870–1900
0.105 in. (2.667 mm) 1900–1915

36 Technical Briefs in hisTorical archaeology
a coMparison anD revieW of WinDoW glass analysis approaches in hisTorical archaeology
Ball
Ball’s work is a more recent approach to window glass analysis (Table 8), in which the mean value of window glass thickness is inserted into a regression formula to produce a relative date. his study also touched on dating glass by color and published the Basic program code for applying the method’s regression formula.
no great insights resulted from the testing of the Ball method; it does not have a complex sampling model or any strictures, aside from suggesting that 3 mm thick glass is modern glass. given the previously mentioned problems with cross-testing the accuracy of the various methods, the Ball method often produced dates significantly different from the other methods.
The Ball method, like the Walker method, represents an early attempt at a new process. Ball, in his report, wel-comed further development of window glass analysis and accurately predicted that both modification and refinement were inevitable.
Moir
Moir, who has written extensively on this topic (Moir 1982, 1983, 1987), in producing his method of window glass analysis, utilized the largest number of sites, two regions with “essentially the same relationship between
thickness and time” (Moir 1987), and a rigorous set of strictures. The Moir method (Table 9) places emphasis on reducing the sample size to include only glass that is reli-ably window glass. another important aspect of the Moir method is that it was intentionally developed to exclude sites containing upper-class structures, since those sites tended to have thicker window glass due to larger win-dow panes and were more likely to use more expensive “double thickness” glass. The higher level of sampling complexity stipulated by the Moir method reflects the greater necessity with mean window glass analysis meth-ods of efforts to eliminate samples that would produce erroneous results.
The many strictures of the Moir method permit a large reduction in the amount of glass measurement necessary for analysis, which in turn reduces the time investment for conducting the experiment. also, the testing showed that the strictures set forth in the Moir method are reliable ways to exclude flat glass that is not window glass. The collections used to conduct the current test were already separated into bags by artifact type, but the Moir method strictures still identified many pieces of glass that were not window glass. Two strictures were specifically useful: lay-ing the glass on a flat surface and attempting to “rock” it to determine if the glass is actually slightly curved, and closely inspecting glass that is pink and perfectly clear for signs the artifact is not window glass.
Table 8. Ball Method, 1982.
Mean/Mode Mean
Applicable Date Range 1800 to 1870
Number of Sites Used to Produce Method
5 sites, 1 thickness date estimate borrowed from the roenke method (ohio site used to establish modern glass thickness)
Location of Sites 2 in Kentucky, 1 in alabama, 1 in arkansas, 1 in ohio
Increment and Number of Measurements
0.5 mm;number of measurements unreported, assumed to be 1
Region of Application ohio valley
Sample Sizes 1 sample reported (linville Kentucky), 256 pieces
Strictures and Exclusions no stated exclusions;3.0 mm thickness represents modern glass
Data Processing averaged thickness data from each piece of measured glass and inserted value into Ball regression formula
Dating Equation Date = [(M – 1.00 mm) / 0.0286] + 1800 where M = mean thickness in 0.5 mm

Technical Briefs in hisTorical archaeology 37
JonaThan WeilanD
Schoen
The final and most recent study explored is a mean method of window glass analysis for the plains region of the U.s. The schoen method (Table 10) was developed with the advantage of access to already-established window glass analysis techniques, as the methodology of the schoen method reflects. The Moir method specifically was crucial in developing schoen’s method, as one of the schoen’s stated goals was to test Moir’s research.
Testing schoen’s method with the additional data col-lected for this research provided valuable insights. schoen’s method dictates that only pieces with an edge longer than one inch be measured, and that those pieces be measured three times. These strictures reduce the size of the sample and have a profound effect on the final mean of the glass samples. of the 5,032 window glass samples measured in the research for the current study, only 45% of those samples (2,283) were greater than one inch in diameter. pieces larger than 1 in. were also thicker, by about 0.011 in.
Table 9. Moir Method, 1982.
Mean/Mode Mean
Applicable Date Range 1810 to 1920
Number of Sites Used to Produce Method
45
Location of Sites south and northeast U.s., Texas
Increment of Measurement 0.01 mm;1 measurement (assumed)
Region of Application south and northeast U.s., many sites in Texas
Sample Sizes 15 to 20 pieces of glass can produce viable results, above 30 pieces is recommended for reliable results; largest sample noted was 659 pieces
Strictures and Exclusions select best possible context of glass from site, as opposed to seeking larger samples:foundation lines are best;scatters immediately next to walls are acceptable;
only when glass from foundation lines or in scatters next to walls is not available should other glass be used;exclude glass from trash pits;confirm the structure was built after 1800 and before 1920;confirm the glass is flat by placing the glass on a flat surface and attempting to “rock” it back and forth by placing light pressure on opposite edges;confirm the glass is flat by letting light play across it;Make sure the sample is window glass by eliminating potential bottle glass, mirror, or decorative glass shards:
confirm glass is actually flat on both surfaces;confirm that glass bears no ripple marks which would indicate it was made in a bottle mold;confirm glass shards do not have beveled edges which would indicate the glass was decorative;confirm glass does not have silver backing indicating it is from a mirror;closely inspect glass that is pink or perfectly clear as it has a high probability of not being window glass;
Discard data when all pane thicknesses are greater than 3.2 mm
Data Processing collect measurements from a subsample of site according to sampling criteria, average all the values and insert that value in place of the TH variable in Moir’s regression formula
Dating Formula ID = 84.22 (TH) + 1712.7where ID = date of site construction (±7 years)TH = thickness in 0.01 mm

38 Technical Briefs in hisTorical archaeology
a coMparison anD revieW of WinDoW glass analysis approaches in hisTorical archaeology
This seemingly small difference in thickness would result in a dating difference of 18.22 years if applied to schoen’s formula. consequently, schoen’s formula should not be ap-plied to samples with an edge less than one inch in length.
Discussion
The investigation into the various window glass analysis methods produced a number of insights that should help historical archaeologists conduct similar research, or at the very least better understand and evaluate the results of
window glass analysis if they are present in older investiga-tion reports.
There are many situations in which window glass analy-sis, if done properly, can make a useful contribution to an archaeological investigation. Window glass is a common and durable artifact type, and in the event of a paucity of other chronological indicators window glass analysis can provide some results inexpensively. The process is espe-cially useful on low-income, short-occupation structure sites, but can provide valuable data in other circumstances, such as providing a relative construction date for small
Table 10. schoen Method, 1990.
Mean/Mode Mean
Applicable Date Range 1800 to 1900
Number of Sites Used to Produce Method
10, all thickness data was collected for this investigation
Location of Sites 6 sites in nebraska, 3 in north Dakota, 1 in south Dakota
Increment of Measurement 0.001 in., with starett micrometer
Region of Application “plains region”
Sample Sizes schoen used no sample smaller than 100 shards;samples that were large (large, e.g., is 3,000 pieces) were sampled by arbitrarily selecting opaque bags from each stratigraphic layer at a site;Bags selected from each arbitrary or stratigraphic level randomly;50 shards is suggested as a viable minimum sample
Strictures and Exclusions four site selection criteria:sites must be from the central and northern plains;sites must represent lower- or middle-class occupations, or be utilitarian in nature (trading posts, forts, stage stations);sites must have been a short-term occupation;sites must be 19th century;
Whenever possible, collect sample from foundation lines associated with the initial construction and occupation of a site;Measure pieces of glass that are longer than 1 in. along the longest axis;Three measurements are made for each piece of glass;Measure thickness to 0.001 in.;exclude trash dumps and privies as sources of window glass if at all possible
Data Processing Take three thickness measurements along the longest axis of artifact, then average them into a single value; average the mean value of each piece of glass into a single value for the entire assemblage;insert the assemblage mean value into the schoen method linear regression formula to predict the date of the initial construction/occupation of the site;also record and consider the mode and median data from the site data as a means of evaluating reconstructions and refurbishments
Dating Equation Y = 1725.7 + 1713.0 (X) where X = thickness in 0.001 in.Y = initial occupation date (±6.2 years)

Technical Briefs in hisTorical archaeology 39
JonaThan WeilanD
structures at sites that lack documentation, or for out-buildings (of historic structures) that may not be noted in records. also, while the dating accuracy of window glass analysis is less reliable on sites outside a region where a study took place, the methods provide excellent criteria for identifying window glass and collecting glass thickness data. Thickness data can be used to help determine the temporal relationships between closely related sites or structures without the benefits of a dating scheme.
properly assessing the results of window glass analysis requires an understanding of the weaknesses inherent in this research technique. it became evident to many of archaeologists who studied window glass that thick-ness varied slightly by region (roenke 1978; Moir 1987; schoen 1990). There are several possible explanations for this regional variance but no present technique for how to adjust the methods or results from those methods so that utilizing a dating method outside of the region where it was developed will not skew the results.
The length of time a site was occupied is another serious consideration for window glass analysis. short occupations are best since they are less likely to result in replacements of panes and the introduction of thicker glass to the site. sometimes introduction of new window glass caused by renovation events can be seen in modal distribu-tions, but the gradual replacement of windows as they are broken under normal circumstances would result in glass of multiple thicknesses with no clear second mode. The mean methods are not designed to cope with these later introductions of window glass.
Window glass can also be easily confused with a num-ber of other sources of flat glass: mirrors, decorative glass, flat panel bottles, etc. identifying and excluding flat glass that is not window glass is especially important for meth-ods that rely on mean measurements rather than modes. chance and chance took time to mention in brief that their dating technique was developed and dependent on the as-sumption that the glass used on the Kanaka village site was not recycled from earlier structures, but manufactured and purchased at a date very contemporary with the construc-tion of fort vancouver. The likelihood of recycled window panes is difficult to estimate but certainly possible. This problem can be understood as a form of deposition lag. finally, window glass analysis is, like many other relative dating methods, best used in concert with other dating
methods such as bottle manufacturing methods, ceramic styles, dated marks, and documentary information, rather than by itself.
Time consumption should be a serious consideration when choosing a method of window glass analysis. it is sug-gested that a mean method be employed as long as it is pos-sible to meet the mean-method strictures. The sample sizes required by Moir’s and schoen’s methods can be honed to the point that from start to finish the process should take only a few hours and the data still be considered reliable, while other methods that suggest using an entire collection could, by contrast, take days of commitment.
a valuable piece of information that resulted from test-ing the analysis methods is that with few exceptions, the strictures have such a significant effect on the resulting data that failing to observe them would most likely cause er-roneous results. collecting data from the same collections according to each method’s strictures produced different average thicknesses and slightly different modal distribu-tions, with the exception of the chance and chance and roenke methods, which are very closely related. This also means that attempting to use thickness data gathered ac-cording to one methodology with a different dating scheme or regression formula will often produce poor results. The investigators employed different sampling methods, mea-surements, and strictures to gather the data that were used to construct their methods. as a result, the methods are dependent on their specific methodology. This is especially true in mean-based methods (Table 2).
Conclusion
The study of window glass can produce valuable informa-tion about historic sites, and if approached correctly these studies can be conducted in an efficient fashion. That being stated, one single method of window glass analysis does not represent the best choice in every circumstance, espe-cially given regional constraints, and the results should be contextualized by other types of dating methods whenever possible.
after reviewing and testing each method on eight sites and over 5,000 pieces of glass, the three methods that stood out as the most thorough and well researched are conveniently the three most easily accessible. These are the roenke, Moir, and schoen methods. When the context of

40 Technical Briefs in hisTorical archaeology
a coMparison anD revieW of WinDoW glass analysis approaches in hisTorical archaeology
the glass is very reliably from a specific structure, the mean methods by Moir and schoen can be employed in a small amount of time to produce good results. if the context of the glass is less reliable, the archaeologist should consider roenke’s modal method. it is strongly recommended that in conducting window glass analysis the researcher obtain the article describing the method to be employed. each has been published in some form of serial. The details can be found in the references to this article.
ACkNOWLEDGMENTS
i would like to thank erin Dempsey, Jeff richner, christopher schoen, Kathryn McBride, and most of all Doug scott, for their guidance, feedback, and editorial work on this article. also, this study could not have oc-curred were it not for the willingness of the Midwest archaeological center staff to let students work with the extensive collections housed there.
REFERENCES
Ball, Donald B.1982 chronological implications of Window glass Thickness and coloration at the linville site (15BK12), Bracken county, Kentucky. Manuscript, office of state archaeology, University of Kentucky, lexington.
chance, David h., and Jennifer v. chance1976 Kanaka Village Vancouver Barracks 1974. office of public archaeology, University of Washington, seattle.
Davis, pearce1949 The Development of the American Glass Industry. har-vard University press, cambridge, Ma.
Douglas, ronald W., and susan frank1972 A History of Glassmaking. Whitefriars press, lon-don, UK.
Moir, randall W.1982 Windows and pane fragments: sources of chronological Data for historic archaeologists. Manu-script, Department of anthropology, southern Methodist University, Dallas, TX.
1983 Windows to our past: a chronological scheme for the Thickness of pane fragments from 1635–1982. Manuscript, corning Museum of glass, corning, ny.
1987 socioeconomic and chronometric patterning of Window glass. in Historic Buildings, Material Culture, and People of the Prairie Margin: Architecture, Artifacts, and Synthesis of Historic Archaeology, richland creek Technical series, vol. 5, David h. Jurney and randall Moir, editors, pp. 73–81. southern Methodist University, Dallas, TX.
roenke, Karl g.1978 Flat Glass: Its Use as a Dating Tool for Nineteenth Cen-tury Archaeological Sites in the Pacific Northwest and Elsewhere. northwest anthropological research notes, Memoir no. 4, Moscow, iD.
schoen, christopher M.1990 Window glass on the plains: an analysis of flat glass samples from Ten nineteenth century plains his-toric sites. Central Plains Archaeology 2(1):57–90.
Walker, John W.1971 excavation of the arkansas post Branch of the Bank of the state of arkansas: arkansas post national Memorial, arkansas. Manuscript, southeast archeological center, national park service, Tallahassee, fl.
Jonathan Weiland770 n. Dodge avenueapartment 20Tucson, aZ 85716