wine economics research centre working paper no. 0112 · wine economics research centre working...
TRANSCRIPT
Wine Economics Research Centre
Working Paper No. 0112
Rural Development in Georgia:
What Role for Wine Export Growth?
Kym Anderson
Revised June 2012
University of Adelaide
SA 5005 AUSTRALIA
www.adelaide.edu.au/wine-econ
2
WINE ECONOMICS RESEARCH CENTRE
The Wine Economics Research Centre was established in 2010 by the School of
Economics and the Wine 2030 Research Network of the University of Adelaide, having
been previously a program in the University's Centre for International Economic Studies.
The Centre’s purpose is to promote and foster its growing research strength in the area
of wine economics research, and to complement the University's long-established
strength in viticulture and oenology.
The key objectives for the Wine Economics Research Centre are to:
publish wine economics research outputs and disseminate them to academia,
industry and government
contribute to economics journals, wine industry journals and related publications
promote collaboration and sharing of information, statistics and analyses between
industry, government agencies and research institutions
sponsor wine economics seminars, workshops and conferences and contribute to
other grape and wine events
Contact details:
Wine Economics Research Centre
School of Economics
University of Adelaide
SA 5005 AUSTRALIA
Email: [email protected]
Centre publications can be downloaded at: www.adelaide.edu.au/wine-econ/
ISSN 1837-9397
3
WINE ECONOMICS RESEARCH CENTRE
WORKING PAPER NO. 0112
Rural Development in Georgia:
What Role for Wine Export Growth?
Kym Anderson
Wine Economics Research Centre
School of Economics
University of Adelaide
Adelaide SA 5005 Australia
Phone +61 8 8303 4712
Revised June 2012
Paper revised following a World Bank Seminar in Tbilisi, Georgia, 9 March 2012. The author is grateful
for many helpful comments from seminar participants, for discussions with many other people in
Georgia, and for financial support from the World Bank and Australia’s Grape and Wine Research and
Development Corporation. The views expressed are the author’s alone.

4
Executive summary
Despite having an open economy and well-educated labor force, Georgia is one of the poorest
CIS countries, and has among the highest income inequality and poverty incidence. To
address its relatively slow rates of economic growth and poverty alleviation, the government
has introduced a series of market-friendly structural and institutional reforms. Since almost
half the workforce lives in farm households and is engaged in low-productivity activities
(crop yields are less than half the global averages), and since the vast majority of the poor are
in rural areas where earnings are a small fraction of urban wages, agricultural and rural
development is crucial if those reforms are to successfully meet their objectives.
Within Georgia’s rural economy the wine industry is dominant: most Georgian
farmers grow winegrapes, even if only for wine self-consumption with family and friends;
most non-farm households consume wine, even if mostly purchased in bulk rather than as
labeled bottles; many visitors to Georgia indulge in wine tourism to some extent; and wine
export volumes and prices grew rapidly over the decade to 2005.
How might the wine industry contribute more to Georgia’s economic growth, export
earnings, income redistribution and poverty alleviation over the next decade or two?
Russia has been Georgia’s main market for wine and spirits over the past two
centuries, but in late March 2006 it placed a ban on beverage imports from Georgia. In mid-
2012 that embargo was still in place. As a consequence, wine’s share of Georgia’s goods and
services exports fell from 5.4 to 1.3 percent between 2005 and 2011; and the share of
Georgia’s wine production volume (including non-commercial supplies) that is exported,
which grew rapidly over the first half of the past decade to nearly 50 percent, collapsed to just
7 percent by 2007 and has yet to return to the country’s 1995-99 average of 14 percent. That
shock (compounded by the short war with Russia in August 2008) has required Georgian
wine exporters to develop non-Russian markets, a task made considerably more difficult by
the emergence of the global financial crisis from 2008. Thus so far they have sold mostly to
other CIS countries, especially Ukraine, Kazakhstan and Belarus. Nonetheless, the recent
experience of several other small countries in rapidly expanding their wine exports is
encouraging, as is the fact that the average price of Georgia’s wine exports rose from US$1 a
litre in the late 1990s to just under US$2 during 2000-05, to $3.50 by 2008 and, despite the
global financial crisis, was as high as $3.20 in 2011.
It needs to be recognized, though, that key indicators suggest Georgia is already
exploiting heavily its comparative advantage in wine. One indicator is agricultural crop land
5
under vines: as of 2009, Georgia was ranked fourth in the world at 8 percent, after Portugal,
Chile and Italy and ahead of Moldova and Spain at 6 percent and Macedonia and France at 4
percent – and far ahead of the New World exporters which average just 0.3 percent. Georgia
is also ranked second in the world, after Moldova, in terms of wine’s share of total
merchandise exports. True, its share of crop area under vine may have been twice as high in
the early 1980s. However, much of those former vineyards may not be suitable for high-
quality winegrape production destined for Western markets. In addition, the fact that Georgia
is currently exporting less than one-eighth of its total production hides the reality that, of its
commercially labelled bottled wine, it may be already exporting all but one-eighth (which is
higher than the wine export propensity of Chile or New Zealand).
Domestic wine sales are already very high given Georgia’s per capita income level,
and as incomes grow there may be a substitution in domestic demand from quantity to
quality. In that case an expansion in the wine industry’s output will require growth in wine
exports.
With the dissolution of the Soviet Union and even more so Russia’s ban on imports of
Georgian wine since 2006, Georgia suddenly has an unusually large degree of freedom to
influence its comparative advantage in wine for the decades to come. A key question is:
which market segments, in which destinations, to target?
About one-third of the volume of global wine imports is non-premium (average
export unit value of US$0.90/litre) and half is commercial premium (average export unit
value of US$3.25/litre). The remainder (7 percent each) is equally split between super-
premium still wine (average price $6.50) and sparkling wine. Thus Georgia’s exports
currently are priced mostly in the commercial premium range ($2.50 to $7.50). There is also
scope to sell into the large non-premium market for bulk wine sales, particularly in China and
Germany, should there be a need to dispose of (unplanned?) low-quality wine. However,
there are two risks in the non-premium market. One is that it is chronically over-supplied
globally, and much of the commercial premium segment has become extremely competitive
with very low margins thanks to the supermarket revolution on the buyer side and, on the
seller side of the market, the economies of large scale possible in commodity wine production
in the New World. The other risk is that importers can bottle this low-quality wine and (as in
Ukraine currently) label it as Wine of Georgia, thereby lowering the quality image of
Georgia’s own bottled exports.
As for varieties, Georgia has been blessed with more than 500 indigenous varieties, in
addition to imported international winegrape varieties. Many of the indigenous varieties have
6
names that western consumers would struggle to remember, and have flavor profiles that may
be either insufficiently or too different from those of international varieties to be easily
marketable. Even the key indigenous varieties considered most likely to succeed abroad, such
as red Saperavi and white Rkatsiteli, are produced in styles that Western consumers may find
not immediately approachable. Some wineries are therefore modifying the styles somewhat,
while others are blending those varieties with international varieties. If the latter name is
placed first on the label of a 50:50 blend, there is the additional advantage that the foreign
consumer may be less hesitant to try it once and more likely to enjoy it enough to remember
the label when returning to the wineshop for more of the same (or of the adjacent bottle with
only the indigenous variety).
Most New World countries have found that they initially became famous for just one
or two varieties, as has Austria since its recent resurgence as a wine exporter. Even so, they
have found it is wiser to market the country rather than its signature varietal(s), lest the
consumer tire of the latter.
If Georgia is to meet its President’s desire for a rapid expansion in wine exports, it
needs to both attract productive investors and expand the demand abroad for their outputs.
While there may appear to be under-utilized capacity in Georgia’s wineries and vineyards at
present, much of it is unsuitable for producing wines of sufficient quality to compete in
Western markets. Most small vineyards would require substantial upgrading before they
could produce the grapes needed by a modern export-focused winery. Denser spacing of
vines might be needed to raise grape quality, different varieties or even different clones may
be needed before a contract is offered by a winery to a grower, and the winery may require
changes in management practices to ensure the grapes suit the style of wine being targeted.
As for larger firms, there is an evident shortage of skilled viticulturalists, winemakers, and
wine marketers capable of working together, and possibly also with independent
grapegrowers, to ensure a saleable product can be delivered on time and at the right price
point to prospective markets abroad.
In addition to financing investment needs of private firms for building or upgrading
wineries and planting or renovating vineyards, funds are required at an industry level for
investing in collective goods. These include targeted training programs in viticultural,
winemaking and wine marketing plus and leadership skills development, grape and wine
research and development (R&D), and more statistical data collection and up-to-date
dissemination so that would-be investors know how much expansion is already under way
7
(not least to avoid the problem of excessive exuberance on the part of investors that some
New World countries have faced recently).
A strong R&D base is needed not just for innovation but also to adapt technologies
adoptable from abroad. There are some researchers available locally, but additional ones will
need to be recruited from the global pool and/or created by providing scholarships for
promising students to undertake post-graduate studies in one or other of the world’s major
wine universities. The latter strategy not only will help build links for future international
collaboration in R&D but also will provide a pool of lecturers for teaching undergraduate
grape and wine science courses in Georgian universities.
Who should fund such R&D and scholarships? Most wine firms in Georgia are likely
to be too small to justify their own R&D facility. If the government feels this activity would
have too few spillover benefits beyond the wine industry to justify full public funding, then
one possibility is to collect a small levy on all exported wine. That levy process could then
also be used to help fund generic promotion and to cover the cost of inspecting a sample of
each wine destined for export (to ensure that only bottled wine of sufficient quality is allowed
to carry the words ‘Made in Georgia’ on its label, and to avoid low-quality bulk wine
undermining the country’s reputation).
To date the few dozen wineries exporting to new markets have signed up relatively
few growers and have instead planted their own vineyards so as to be able to have full control
of the winegrape production part of the supply chain. The hundreds of thousands of small
winegrape growers mostly produce grapes for home-processing for their own consumption
and for informal sales to friends. To sell grapes to export-oriented wineries they would have
to allow the commercial winery to determine the varieties grown, production techniques used,
harvest time, sugar content, etc. Alternatively, independent growers may wish to form
cooperatives and develop their own winery. Experience in Western Europe, however, would
caution against that, as cooperatives tend to not penalize low-quality grapegrowers enough to
prevent the delivery of fruit that can be used only for non-premium wine or for industrial
alcohol. As well, cooperatives do not appear to be able to successfully export super-premium
wines. Nor have they been able to compete well in the international market, especially against
the very large exporting firms of the New World, in supplying large quantities of consistent
commercial premium wines for the major chain stores and supermarkets. Cooperatives are
therefore not likely to be the answer for engaging more small growers in Georgia’s wine
export drive.

8
Of the wineries that do attempt to expand production for export markets, studies
suggest the firms that succeed in growing exports will be the most productive and largest
ones who segment their markets and sell the highest quality to high-income countries. Given
also how crucial it is to understand market niches and the distribution system in each country
of destination, a rapid expansion of wine exports is likely to require attracting foreign
investors already very familiar with selling into those markets – especially since such
experienced firms also are more likely to be at the technological frontier in viticulture,
oenology and wine marketing and to be able to access the substantial upfront finance that is
required to plant vineyards, construct or renovate a winery, and invest abroad in brand
development.
Expanding the demand abroad for Georgian wines in the markets of Western Europe,
North America and East Asia requires major promotional investments. Firms are capable of
developing their own brands according to their competitive advantages and points of
difference, but there is also a key role for generic promotion to accompany and support such
private-sector efforts.
The experiences of other small economies such as Chile, New Zealand and Austria
provide guidance as to what works well. All three countries have sought to associate their
wines with their country, and to emphasize the clean, green image of their beautiful vineyards
against a background of snow-capped mountains – something Georgia can surely emulate.
Georgia’s generic promotion initially should be country-wide rather than stress
regions. However, just as the Marlborough region now has 75 percent of New Zealand’s
winegrape area, so Kakheti has a similar proportion in Georgia. Hence that region will tend to
become the best known, especially if it continues to also be the region where wine tourism
develops fastest.
Experience in New World countries suggests there are economies of size for a small
country to combine the roles of promotion, R&D and regulatory oversight in one industry-
owned organization, as in New Zealand (and probably also in Australia by the end of 2013).
Then the prospective returns from further investments in those three activities can be
compared and the budget divided so as to maximize its overall return to the industry (and to
the government, if it also is a financial stakeholder). As to how much should be spent on
generic promotion and on R&D, Australia and New Zealand each spend close to 1 US
cent/litre on generic promotion and associated regulatory functions, while Australia spends
about 2 cents/litre on R&D (compared with about 1 cent in New Zealand). So if Georgia were
to emulate that spending pattern, with its annual production near 100ML per year that would
9
suggest an annual budget of $1million/year on generic promotion and $1-2million/year on
R&D and related extension activities initially. Even if non-commercial production is
excluded from the base, about half those budgets would be required by 2015 if the President’s
aim of trebling the volume of exports between 2011 and 2015 is realized.
The potential for wine tourism in Georgia to contribute to wine export growth is very
considerable. A start has been made, with some wineries offering cellar-door tastings, but
many other components are needed: more hotels with internet access, brewed coffee and
dependable hot water, similar-quality restaurants (with at least some offering a supra
experience), more sealed roads connecting key sites, better road signage with a wine route
symbol, wine route maps and booklets in English and other key languages with sample
itineraries and winery contact details, acceptance of major credit cards, and comprehensive
multilingual websites to facilitate pre-tour planning. To minimize travel times between
venues, a clustering of cellar doors would help greatly, especially if the cluster included or
was nearby accommodation and dining and also near historic sites such as Tsinandali Estate
or Alaverdi Monastery. Given the heavy concentration of wine production in Kakheti, it
would make sense to concentrate public infrastructure expansion in that area initially.
The construction of tourism infrastructure and facilities will require large amounts of
low-skilled rural labor. Once built, wineries, cellar door outlets, restaurants and hotels also
require, on an on-going basis, large numbers of employees over the full spectrum of skills.
This can thus provide more part-time off-farm earning opportunities for farm households.
The potential for wine export growth is very real and, along with it, in-bound wine
tourism. This is not to deny the many challenges to be faced, such as the small number of
large wineries, the wide range of qualities and varieties of grapes and wines currently being
produced, and the poor infrastructure that is hampering the development of wine tourism.
To realize this potential for wine export growth in Georgia, inputs are required not
only from the private sector but also from the government. Invest in Georgia has a role in
attracting investor interest in the industry and in associated tourism opportunities. The
diaspora is an obvious target group, but so too are the large wine corporations that are already
well established in the export markets to be targeted. The Georgian National Tourism Agency
also has a major role to play in developing in-bound tourism, for which the food-and-wine
focus provides a major hook. The government also has a key role in supporting investments
in grape and wine R&D, in the tertiary education of viticulturalists, oenologists and wine
marketers, and in the post-secondary-school training of workers for the industry and for the
wine tourism sector. Finally, if the industry is to be able to continue to produce even in dry
10
seasons, it needs more-reliable access to irrigation. Currently the irrigation infrastructure is
very run down. Getting the right institutions and policies in place for that to happen in a
major challenge, but it will have a high social payoff as it would help not only the wine
industry but also the producers of all fruits and vegetables. Since the horticultural industries
are very labor-intensive, that would add to the expansion of jobs in rural areas.
Finally, the Government could assist the industry’s effort to upgrade the quality of its
wine by phasing out its current program of providing a floor price for buying sub-standard
grapes from growers unable to sell to commercial wineries and processing them in state-
owned wineries (for eventual sale in bulk or for converting to industrial alcohol). Apart from
the fiscal wastage of such a program (since costs are likely to exceed sales revenue of such
state-owned wineries), it provides a disincentive for below-average growers to raise the
quality of their product to a level acceptable to commercial wineries. That fiscal expenditure
could instead be used more productively to directly support poor farm families either to
upgrade their winegrape production or to restructure towards more profitable activities.
Rural Development in Georgia:
What Role for Wine Export Growth?
1. Introduction
Following Russia’s ban on wine imports from Georgia in 2006, a key challenge for
Georgia’s government has been to ensure the long-established wine industry
restructures so that it can again contribute to Georgia’s economic growth, export
earnings, income redistribution and poverty alleviation. Despite having a very open
economy with a well-educated labor force, Georgia remains the poorest country in its
neighborhood apart from Moldova, has among the highest income inequality, and has by far
the highest incidence of poverty (with one-third of the population below $2 a day). Its present
government, in place since 2004, has in motion a program of market-friendly structural and
institutional reforms aimed at addressing the country’s relatively slow rates of economic
growth and poverty alleviation. With almost half the workforce in farm households, and the
vast majority of the poor living in rural areas, the success of that reform effort necessarily
requires faster agricultural and rural development. A key to that is the wine industry. Most
Georgian farmers grow winegrapes, even if only for wine self-consumption with family and
friends; most non-farm households consume wine, even if mostly purchased in bulk rather
than as labeled bottles; and many visitors to Georgia indulge in wine tourism to some extent.
However, over the past two centuries most of the industry’s exports have been bottled wine to
Russia – until it placed a ban on wine imports from Georgia in late March 2006. That shock
(compounded by the short war with Russia in August 2008) has required Georgian wine
exporters to develop non-Russian markets, a task made considerably more difficult by the
emergence of the global financial crisis from 2008. Nonetheless, the new Minister of
Agriculture announced in November 2011 that he wanted to see a near-trebling of wine
exports by 2015.
The analysis in this chapter concludes that the potential for growth in wine
exports from Georgia and in in-bound wine tourism is very real, but to realize that

2
potential will require the following government actions, bearing in mind the small
number of large wineries, the wide range of qualities and varieties of grapes and wines
currently being produced, and the poor infrastructure that is hampering the
development of wine tourism:
The national investment agency, Invest in Georgia, has a role in attracting investor
interest in the industry and in associated tourism opportunities. That agency, together
with the Georgian Wine Association, can build awareness among prospective
investors both domestically and abroad, beginning with not only the diaspora but also
large wine corporations that are already well established in Western markets.
The Georgian National Tourism Agency clearly also has a major role to play, in
developing in-bound tourism with a food-and-wine focus. The linkage between the
promotion of Georgian wine regions and Georgia as a tourist destination makes a
strong economic case for government co-funding of wine promotion in selected
markets abroad. The construction of tourism infrastructure and facilities will require
large amounts of low-skilled rural labor. Once built, wineries, cellar door outlets,
restaurants and hotels will require, on an on-going basis, large numbers of employees
over the full spectrum of skills, thus providing more part-time off-farm earning
opportunities for farm households.
The government also has a key role in supporting investments in grape and wine
R&D, in the tertiary education of viticulturalists, oenologists and wine marketers, and
in the post-secondary-school training of workers for the industry and for the wine
tourism sector. The strong economic case for government co-funding of agricultural
research in general (without which there inevitably will be under-investment because
the private sector is unable to capture all of society’s gains from such investments) is
even stronger for grape and wine research in Georgia because it has the potential to
expand dramatically the revenue from the low-performing grapevines of many low-
income farm households – and even to encourage the re-planting of vineyards that
were pulled out from the mid-1980s.
If the industry is to be able to continue to produce even in dry seasons, it needs
reliable access to irrigation. Currently the irrigation infrastructure is very run down,
but getting the right institutions and policies in place will have a high social payoff as
it would help not only the wine industry but also the producers of all fruits and
vegetables. Since both viticulture and horticulture, and associated processing and
3
transport activities, are very labor-intensive, that would add to the expansion of jobs
in rural areas and thus to the alleviation of income inequality and poverty.
The Government’s current program of providing a floor price for buying sub-standard
grapes from growers unable to sell to commercial wineries, and processing them in
state-owned wineries (for eventual sale in bulk or for converting to industrial alcohol),
is not helpful. Apart from the fiscal wastage of such a program (since costs are likely
to exceed sales revenue of such state-owned wineries), it provides a disincentive for
below-average growers to raise the quality of their product to a level acceptable to
commercial wineries. That fiscal expenditure could instead be used more productively
to directly support poor farm families either to upgrade their winegrape production or
to restructure towards more profitable activities.
The structure of this chapter is as follows. It begins in Section 2 with a brief
description of key indicators of Georgia’s economy relative to those of its neighbors,
highlighting the importance of the agricultural sector. In Section 3 the role of wine within the
economy is summarized. That provides some of the background needed to assess the
potential for growth in Georgia’s wine production and exports, which is the focus of Section
4. Realizing that potential will require investments in numerous areas, however. Those
necessary conditions are drawn out in Section 5, based on the experience of other countries
that have expanded their wine exports in the past two decades. The final section summarizes
the paper’s findings and lists several implications for policy, not least for ensuring that
poverty is reduced as exports expand and the economy grows.
2. Key indicators of Georgia’s economy
The economy of Georgia is very open and by far the easiest economy in the region in
which to do business. Its exports plus imports of goods and services amounted to 90 percent
of its GDP in 2006 (compared with 63 percent for other developing countries), and was still
87 percent in 2010 despite the global financial crisis. In terms of ease of doing business,
according to the World Bank (2011a) it is ranked 16th
out of the 183 countries surveyed and
was the most-improved in the world over the past five years.
Yet apart from Moldova, Georgia has the lowest national income per capita of
the non-EU countries in the region bordering the Black and Caspian seas, and has one
of the region’s most skewed distributions of income and the largest proportion of
4
households in poverty (columns 1-6 of Table 1). Almost half the population lives in rural
areas, and a little over half the workforce is employed in agriculture. Being mountainous, this
small country has very little agricultural land and, with Armenia, has the region’s smallest
endowment of arable land per capita. Nonetheless, after Moldova it has the region’s largest
share of merchandise exports coming from agriculture (columns 7-12 of Table 1).
Georgia is still an agrarian economy in terms of where people live and work. This
is despite the facts that agriculture’s share of GDP has fallen from one-third in 1996 to one-
fifth in 2002 and just 7 percent in 2010, and that its share of exports has fallen from more
than half in the early and late 1990s to one-quarter during 2006-10.
However, the productivity of labour in Georgian agriculture is exceptionally low,
as agriculture’s share of GDP is only one-sixth its share of employment. This is the
lowest ratio in the region (columns 12-13 of Table 1). A key reason for this low productivity
is the limited use of purchased inputs on farms, as indicated by the fact that such items
account for less than one-third of the gross value of agricultural production (compared with
twice that share in high-income countries). That low use of intermediate inputs also lowers
farm land productivity: cereal yields in Georgia are well below half the global average of
around 3.5 tons/ha, and grape yields are one-third the global average. Rural non-farm labour
also is not very productive: it accounts for 12 percent of the workforce but only 6.5 percent of
GDP.
Agricultural wages are around one-third of those of non-farm workers, and the
incidence of poverty is nearly twice as high in rural as in urban areas. This is not
surprising given that the farm sector is dominated by small private farms with an average size
of 1.2 hectares (93 percent are less than 2 ha.) and an average of 2.3 plots per farm. Even so,
semi-subsistence agriculture, which accounts for three-quarters of rural employment, is the
main source of income for the majority of rural households, together with public transfers
(World Bank 2009).
Clearly, there is considerable scope for improvement in farm and rural non-farm
labour productivity, which could have a major impact in raising rural household
incomes and lowering national income inequality and poverty. It could also raise the
international competitiveness of Georgian farmers and related agribusinesses, and hence
boost export earnings.
3. Wine’s place in Georgia’s economy
5
Despite its poverty, this small country in the South Caucasus is renown for its ancient
cultural traditions, beautiful landscape and stunning architecture, and its famous
cuisine and wine. Winegrapes have been cultivated and wine made in Georgia for at least
8000 years (McGovern 2003, 2009; Kharbedia 2010), and wine has been embedded in
Georgian life for millennia. A cross formed of vine branches was the ancient symbol of
Christianity when that religion was adopted by the country from around 330 AD. It has also
been an exporter of wine, especially to Russia where Georgian wine has been highly regarded
for centuries.
Within the rural economy of Georgia the wine sector plays a major role.1 Most
farmers have a vineyard and produce wine for self-consumption with family and friends, and
some small and medium farm enterprises also sell grapes to commercial wineries, often under
contract. Between 92 and 95 percent of the country’s grapes are grown on family farms, and
they account for around two-fifths of the volume of all fruit produced in Georgia. All but 8
percent of grapes are used for wine (the rest for table grapes). The value of Georgia’s wine
output, including for subsistence consumption, amounted in 2009 to 0.7 percent of GDP,
which is similar to that in Argentina and South Africa, only a little below France and
Portugal’s 0.9 percent and Chile’s 1.2 percent, but well below Moldova’s 4.6 percent (based
on data in Anderson and Nelgen 2011, Tables 86 and 159). On average during 1995-99, in
both Georgia and Moldova grapes accounted for between 7 and 8 percent of the gross value
of agricultural output. During 2000-05, however, those shares diverged: Georgia’s grape
share fell to 4 percent while Moldova’s rose to 14 percent. They then converged somewhat,
averaging 6 percent in Georgia and 11 percent in Moldova in 2006-09 (FAO 2011).
Most non-farm households in Georgia also consume wine as their alcoholic drink
of choice. Although it is commonly purchased from bulk containers rather than in labeled
bottles, an expanding number of private wineries are developing brands and selling labeled
bottles in both domestic and export markets. During 2006-10, exports comprised almost one-
fifth of total wine production, and nearly two-thirds of labeled bottles. Domestic wine
consumption per adult, including from self-production, is estimated to be around 17 litres in
2009. Wine is thus a non-trivial part of domestic household spending on food, beverages and
tobacco, which in 2010 accounted for 46 and 39 percent of rural and urban household
expenditure, respectively.
1 Unless otherwise indicated, data from this section are drawn from NSO (2011a, b).
6
Wine contributes to all three key sectors of the economy: primary production
(grape growing), manufacturing (grape processing into wine and also brandy and
chacha/grappa) and services (transporting of grapes and wine, marketing of wine, and
the various activities associated with wine tourism). Commercial wine tourism is not
something that Georgians spend much time and money on (since it has long been
mainstreamed into the culture), but many international visitors to Georgia indulge in (food
and) wine tourism activities to some extent and so this component of the wine-producing
industry is beginning to take off as a services export revenue earner.
Georgia’s exports of wine are shipped mainly in bottles and, over the past two
centuries, have mostly gone to Russia. In the ten years to 2005, for example, three-quarters
of the country’s wine export earnings came from Russia, and Ukraine boosted that share to 90
percent. More than two-thirds of the earnings from exports of distilled spirits (brandy and
chacha) also came from Russia.
The decision by Russia in late March 2006 to ban imports of alcoholic beverages
and bottled water from Georgia was therefore a major shock to the country’s overall
economy, particularly to its rural areas and especially to its wine industry.2 As of mid-
2012, that embargo was still in place.
The impact of the Russian trade ban on beverage exports can be seen clearly
from trade data. That product group’s share of the total value of merchandise exports had
grown from 11 to 15 percent in the first half of the past decade, but in the last 3 years it was
only half that share. Water exports also halved. Wine’s share of all goods and services
exports fell from 5.4 to 1.3 percent between 2005 and 2010, and wine’s share of just alcohol
exports fell from 73 percent in 2005 to 33 percent in 2007, before recovering slightly to 40
percent in 2010. Much of what would have been exported as wine was distilled, and exports
of distilled alcohol doubled between 2005 and 2008. Meanwhile, over the past five years
hazelnuts and tangerines have become the next most important agricultural exports (Table 2
and Figure 1).
A striking feature of the Russian embargo is that Georgia’s wine exports, while
declining initially in quantity, have risen markedly in quality since 2006. Wine’s average
export price was only US$1 per litre in the late 1990s and $2 during 2000-05, but by 2008 it
2 This was preceded by two previous shocks: the anti-alcoholism campaign launched by Mikhail Gorbachev in
1985 led to nearly three-quarters of Georgia’s vineyards being uprooted; and the economic collapse of the early
independence years post-1991 damaged the industry further via widespread counterfeiting of Georgian wine in
Russia.
7
averaged $3.50 and, despite the global financial crisis, was as high as $3.20 in 2011 (Figure
2).
Since the Russian embargo, the other CIS countries have dominated as
destinations for Georgian wine exports. By 2010 half the exports were still going to
Ukraine and another one-quarter to other CIS members (Figure 3). Poland and the three
Baltic former Soviet states account for another one-eighth while the United States and China
each have a 2 percent share and most of the rest goes to other EU members.
The current trade situation leaves a great deal of scope for diversifying Georgia’s
wine export destinations. The whole of Central and Eastern Europe plus the CIS (excluding
Russia) accounted in 2005-09 for less than 7 percent of the volume of global wine imports,
compared with more than 90 percent of wine exports from Georgia. The four key global
markets, collectively accounting for half of the world’s wine import volume, are Germany,
the United Kingdom, the United States and Belgium/Luxembourg (Figure 4).
4. Potential for growth in Georgia’s wine production, and for export diversification
Of relevance in assessing growth prospects for Georgia’s grape and wine industry are
likely changes both in domestic wine demand (where there is a strong home-product
bias) and in the country’s comparative advantage in producing wine for export. Of
particular importance in the export market will be its firms’ international competitiveness
over the coming years, bearing in mind that global wine consumption is not growing. Indeed,
since the 1960s wine’s share of the world’s alcohol beverage market has been shrinking.
With non-premium wine especially becoming less popular, competition is extremely strong in
the next rung up the quality ladder, namely the commercial premium market.
4.1 Domestic demand
There is still some scope for domestic wine consumption volumes to rise with income
and population growth. True, Georgians are a wine-loving people who spend a larger share
of their income on wine than virtually any other country in the world except Moldova (whose
per capita income is only three-fifths that of Georgia), and their wine consumption per adult
is slightly above the average for New World wine-exporting countries (and Moldova).
However, it is only half the average for the EU15, which is 35 litres per year (Figure 5).

8
Moreover, domestic demand is heavily focused on non-premium wine (defined to be priced
pre-tax at less than US$2.50 per litre) and only a small fraction is super-premium (above
US$7.50 wholesale pre-tax). In the rest of Central and Eastern Europe and the former Soviet
Union, as in Western Europe’s four main wine-exporting countries, about half their domestic
wine consumption is non-premium, whereas that share in Georgia is around five-sixths
(Figure 6). Together those data suggest room for raising the quantity of domestic sales over
time.
Much more difficult to predict is what will happen over time to Georgians’
demand for higher- versus lower-priced wines. Currently much time is spent preparing and
participating in lavish and lengthy feasts (supra) that involve many toasts lead by a
toastmaster (Tomada). The toasting beverage of choice is invariably wine, and mostly that
wine is procured or purchased from bulk supplies on the day of the feast: less than 2 percent
of domestic sales are in labelled glass bottles (GWA 2011, p. 11). It is not uncommon for
caterers to budget on two or more litres per adult for such a function, notwithstanding the fact
that bulk wine spoils if not consumed shortly after purchase. As per capita incomes and hence
the value of people’s time rise, will the volume of wine consumed in this way diminish, and
will at least urban consumers increasingly look to buy smaller quantities of higher-quality
labelled 750ml bottles of wine rather than large quantities of bulk wine? If so, that will
expand the domestic demand for commercial wine sales, and hence wineries’ demand for
grapes of sufficient quality to meet that demand, while possibly diminishing the demand for
bulk wines and the grapes used to produce them, other things equal. There is, however, the
possibility also that urban consumers will move somewhat more toward beverages other than
wine. In 2009 wine accounted for 56 percent of Georgia’s total consumption of 4.8 litres of
alcohol per adult, compared with beer and spirit shares of 19 and 25 percent. This contrasts
with the other transition countries of Europe and Central Asia, where wine’s share of their
alcohol consumption of 8.4 litres per adult is only 12 percent while beer and spirits account
for 42 and 46 percent, respectively (Anderson and Nelgen 2011, Tables 21-31).
Since no other country is closely comparable with Georgia in terms of wine
consumption habits, it is difficult to be guided by international historical experience.
Even so, it is worth noting that in most Western wine-producing countries there has been a
substantial substitution of quality for quantity of wine consumed over recent decades. In
Europe’s four main wine-exporting countries, for example, the volume of wine consumption
per capita has fallen from more than 100 litres per year prior to the 1970s to less than 40 litres

9
today. The extent of decline has been even greater (more than two-thirds) in Argentina and
Chile, which now consume 26 and 14 litres per capita, respectively.
The other component of domestic wine sales that has the potential to grow in
Georgia is that associated with foreign tourists. While they are expected to mostly
consume commercial wine from labelled bottles, their share of total domestic demand is
currently very small. Hence this will not be a major source of direct demand growth in the
next few years, even though it could be important indirectly through stimulating demand for
Georgian wines in markets abroad (see Section 5 below).
To date virtually all wine consumed in Georgia is Georgian, with imports
accounting for less than 1 percent of domestic sales (GWA 2011, p. 11). That situation is
unlikely to change very rapidly not only because of the acquired taste for and low cost of the
local product but also because it goes to well with the local cuisine.
4.2 Determinants of comparative advantage in wine production for exportation
There are numerous determinants of a country’s comparative advantage in wine
production, but of particular importance for wine are the three T’s of terroir, tradition,
and technology. International competitiveness and thus trade patterns also are affected by the
trade policies of one’s own country and (as Georgia knows only too well) those of its trading
partners.
Terroir refers to various pertinent aspects of climate, topography, soils, geology,
etc. that determine the quality of the vine’s growing conditions. Vineyard site selection
therefore is crucial. Experience has determined the best sites and most-suitable grape
varieties in long-established regions, whereas in new regions science has to be used to speed
the process of approaching the potential of any region to produce quality winegrapes
(Gladstones 1992). Clearly Georgia has many suitable regions for growing various winegrape
varieties and styles for its traditional markets, namely for home consumption and for exports
to Russia.
Traditions determine not only how a product is produced but also the extent of
local consumer demand. This is important for wine because typically local demand is the
easiest and least costly for producers to satisfy: there are relatively high fixed costs of entry
into new export markets (Friberg, Paterson and Richardson 2011), especially with unfamiliar
styles and varieties. In Georgia, where the tradition of drinking (mostly unlabelled) wine with
meals is already pervasive, domestic demand absorbs much of the grapes produced,
10
diminishing what has been available for processing into labelled commercial wine for export
– and past exports have been almost exclusively to the larger Soviet ‘home’ market which
again demanded a unique style of semi-sweet red wine. Those two ‘home market’ biases thus
have not provided Georgia’s wineries with experience in producing for bottled wine markets
elsewhere that are finer than or different from their traditional markets.
Consumer traditions can and do change over time though. One famous example is
what happened in Islamic regions following Mohamed’s decree against alcohol. Another is in
New World regions following waves of immigrants from southern Europe. Drinking
conditions are currently changing in Asia in favour of wine too, as students and business
travellers return from wine-consuming countries with a wish to consume such exotic products
in their home country.
Traditional technologies of production, processing, entrepreneurship and
marketing always have the potential to be improved, be that by the trial and error of
practitioners over the generations or via formal investment in private and public
research and development (R&D). The New World wine-producing countries have been
more dependent on newly developed technologies than have producers in Western Europe,
although both sets of countries have made major R&D investments – and expanded
complementary tertiary education in viticulture, oenology and wine marketing – over the past
half-century (Giuliana, Morrison and Rabellotti 2011).
How important modern technologies are relative to terroir in determining
comparative advantage is a moot point. One recent statistical study suggests terroir is not
as dominant as is commonly assumed – even in regions as established as Bordeaux (Gerguad
and Ginsburg 2008). Another study, of vineyard sale values in Oregon, finds that while
appellation reputation has some economic value, each location’s physical attributes are not
closely related to wine prices (Cross, Plantinga and Stavins 2011). A recent book by Lewin
(2010) begins its section on wine regions with the New World rather than the Old World, to
emphasize the point that wines almost everywhere are manipulated by winemakers as they
endeavour to make use of available knowledge to produce the products most desired by their
customers. What they choose to produce is increasingly being affected by how they can
maximize profits through satisfying consumer demand.
New technologies in agriculture have long tended to be biased in favor of saving
the scarcest factor of production, as reflected in relative factor prices. Hayami and
Ruttan (1985) emphasize that the focus of R&D investments thus has been driven in part by
changes in factor prices, and in particular by the rise in real wages. That has resulted in the

11
development and/or adoption of labour-saving technologies such as mechanical harvesters
and pruners for vineyards and super-fast bottling/labelling equipment for wineries in land-
abundant, labour-scarce countries such as Australia. The adoption of labour-saving
technologies has helped countries with rapidly rising real wages retain their comparative
advantage in what traditionally had been labour-intensive industries. This in turn means
poorer countries need to find sources of comparative advantage other than just low wages.3
In Georgia, where real farm wages have remained relatively low, labour-
intensive technologies such as qvevri-based production, in addition to hand pruning and
harvesting, have persisted. This is not inconsistent with Hayami and Ruttan’s induced
innovation theory, but it does mean Georgia’s traditional wine technology is very different
from – and not necessarily more internationally competitive than – that of higher-wage wine-
exporting countries.
Relative factor endowments also affect the comparative advantage of a country
in terms of the quality of its exported products. New trade theory suggests richer, capital-
abundant countries will export higher priced, higher-quality goods (Fajgelbaum, Grossman
and Helpman 2011; Nayak 2011). Relatively poor Georgia is therefore exceptional in
exporting wine at an average price equal to or slightly above that for the world as a whole
over the past five years.
A further set of influence on comparative advantage that can be important at
certain times relates to currency exchange rate movements. A macroeconomic shock such
as Argentina’s devaluation by two-thirds in late 2001, or a doubling in the Australian-US
dollar exchange rate over the past decade due largely to Australia’s mining boom, have had
major (and opposite) impacts on the international competiveness of wineries in those two
Southern Hemisphere countries.
4.3 Georgia’s wine comparative advantage
For Georgia, terroir and tradition have been the key domestic influences on its
comparative advantage in wine production. Even so, there was some importation of exotic
3 R&D can and is also contributing to the spread of viticulture outside the traditional growing band between the
30th
and 50th
degrees latitude north and south of the equator. More importantly, R&D is also being harnessed to
help producers respond to climate change which, while it may help some wine areas and even create new ones,
is probably going to add to costs in most winegrape-growing regions not just from warming but also from
increased severity and perhaps frequency of extreme weather events.

12
technologies and varieties from Western Europe in the 19th
century, and has been again
following independence in 1991.
The international competitiveness of its wineries also has been heavily influenced
by its long-established trade relations with Russia. Somewhat in contrast to the nineteenth
century’s bilateral trade experience, during the Soviet era the choice of both technologies and
grape varieties was focused on Russian demands for maximum quantities of semi-sweet, low-
quality, mostly red wines (Kharbedia 2010).
With the dissolution of the Soviet Union and even more so Russia’s ban on
imports of Georgian wine since 2006, the country has an unusually large degree of
freedom to influence its future comparative advantage in wine. The new Minister of
Agriculture announced in November 2011 that he wants to see a near-trebling of wine exports
by 2015, to 40 million bottles (30ML). That would require not just a one-quarter increase in
total winegrape production but a near-trebling in commercial bottled wine output. To
examine what will be needed to meet that export goal in a sustainable way, it is helpful to
review where Georgia is currently relative to other wine-exporting countries and especially
those that have enjoyed rapid export growth over the past decade or two.
Trade data of the past decade reveal that Georgia’s strong comparative
advantage in wine is second only to Moldova. The indicator shown in Table 3 is wine’s
share of national merchandise exports relative to its share of global exports. The high value
for Georgia has slipped a lot since the Russian import embargo though, while those of several
other countries (most notably New Zealand and Argentina) have risen a lot during the past
decade. That is also reflected in the share of Georgia’s wine production volume (including
non-commercial supplies) that is exported: it grew rapidly over the first half of the past
decade to nearly 50 percent, but then fell sharply with the Russian ban and has yet to return to
its 1995-99 average of 14 percent (Figure 7). Those exports represent perhaps 85-90 percent
of Georgian wine sold in labelled 750 ml bottles.
Georgia’s potential for vineyard expansion may be not very great. The country’s
wine comparative advantage is driven in large part by having ample terroir for winegrapes,
and by having got to know that terroir very well through utilizing it for millennia. Unlike
elsewhere in the former Soviet Union, Georgia’s vineyards were not decimated following the
Union breakup: between 1992 and 1998 its wine production fell just 16 percent, compared
with almost 60 percent for Russia and Moldova (Noev and Swinnen 2004). One quick way of
guessing the potential for expanding further is to look at the share of agricultural crop land
under vines. As of 2009, Georgia was ranked fourth in the world at 8 percent, after Portugal,

13
Chile and Italy and ahead of Moldova and Spain at 6 percent and Macedonia and France at 4
percent – and far ahead of the New World exporters at just 0.3 percent (Figure 8). True,
Georgia’s vineyard area was 2.5 times greater at its peak just before the Soviet anti-alcohol
push in the mid-1980s to remove vines, but the quality of many of those vineyards was low.
As well, the irrigation infrastructure has been run down, and so would not be able to support
production in dry years as much as in the past unless/until major investment funds are
committed to restore that infrastructure.
It needs to be recognized too that, leaving aside the Russian market, Georgia is a
relative latecomer to the tidal wave of wine export growth that has accompanied the
past two decades of globalization. One symptom of that is the rise in the share of wine
exported by both Western Europe and the New World. The share of EU wine exported has
risen from one-sixth to more than one-third since the late 1980s. Far more dramatic, however,
is the rise in that share for the New World, from just 2 percent to almost 40 percent
(Anderson 2004). Hence one-third of the world’s wine is now consumed outside its country
of production (Figure 9). For Georgia, its share of just over 10 percent is much lower than for
most of its East European wine-producing neighbours (Figure 10).
Being a latecomer to Western markets can have some benefits, in addition to
well-known challenges. Recent history shows that it has been possible for several New
World countries simultaneously to enjoy rapid growth in wine exports (Figure 11), and from
very low bases in most cases (Figure 12). In Argentina’s case, the value of their wine exports
(in current US dollars) has grown at more than 20 percent per year since 2001, and New
Zealand’s at 25 percent, following Australia’s 19 percent per year growth during the 1990s
(Anderson and Nelgen 2011, Tables 63 and 127). Those experiences suggest that it would be
technically possible for Georgia to rapidly expand its exports, if enough other supportive
conditions are in place (see Section 5 below).
The recent New World history also reveals that output expansion is not the only
way to achieve export growth. The export growth in Argentina, Chile and South Africa, for
example, was possible without greatly expanding production initially. This is because it was
accompanied by stagnant or falling domestic demand for wine. In New Zealand, production
switched from low-quality wine for domestic consumers to high-quality wine mostly for
export, while local demand was met largely by a doubling over the past decade in wine
imports: less than 10 percent of New Zealand consumption was from imports in the 1970s
and 1980s, but that had risen to more than half by the mid-1990s. As for Australia, its export
surge in the 1990s was preceded by a period of gradual decline in production which meant
14
there was idle capacity ready and waiting to be utilized when the Australian dollar fell in
value in the mid-1980s -- as was also the case for Argentina following its devaluation in late
2001 (Figure 13).
Georgia may well be in a somewhat comparable position now to that which
Australia was in the mid-1980s and Argentina was in 2001, in the sense that both
vineyards and winery capacity have been underutilized in Georgia since the imposition
in 2006 of the Russian trade embargo. Its wine industry shrunk greatly from the mid-1980s,
as in other parts of the CIS in response to the Soviet anti-alcohol push: the area of Georgian
vineyards fell by three-fifths between 1985 and 2004 (GWA 2011, p. 5).4 The Russian trade
embargo, which occurred just as new plantings and vineyard restoration were getting under
way, reduced utilization again, which means there is capacity there to allow rapid growth
once conditions are ripe. Nor has the industry come under as much domestic competitive
pressure from an export boom in other parts of its economy as has occurred in Central and
East European economies (Figure 14).
Currently Georgia is more like Hungary and Bulgaria in having a small share of
its wine production exported, rather than like Moldova and Macedonia where export
sales dominate domestic sales – but it has a much higher average price for its exports.
Figures 10 and 15 reveal the export propensity of these countries, while Figure 16 shows how
very different Georgia is from all four of those countries in terms of the average price for its
exports. Indeed the unit value of Georgia’s wine exports in 2009 US$3.33 per litre was above
the global average of $2.92 and within 4 cents of the EU15 average. While that is not as high
as those of France or New Zealand, it is among the highest in the world and well above those
of other New World exporters and transition economies. It is also far above Georgia’s earlier
averages of $1.05 and $1.92 per litre in 1995-99 and 2000-05, respectively (see Figure 2). Its
bottled still wine export price is only slightly higher (since Georgia normally has exported
very little in bulk), but if inflated by the global average 8.3 percent to allow for freight (the
gap between fob and cif prices) it amounts to an average import price at destination of $3.96
in 2009. That is very close to that year’s global average unit value of bottled still wine
imports of $4.05 per litre. However, that world average is dominated by the large low-priced
UK and German markets: most other significant importing countries have an average import
price for bottled still wine well above $4 per litre (Figure 17).
4 At that mid-1980s peak, Georgia had around 120,000 hectares of grapevines. That is comparable with the area
in the early 2000s in Australia, Bulgaria, Chile, Greece, Moldova and South Africa, and greater than in (East
plus West) Germany.

15
That brings us to the core questions of whether/how Georgia can build on its present
position to become a significantly greater exporter of wine (the next section), and what that
would do to boost the country’s rural development and poverty alleviation (the final section
of the paper).
5. What is needed to realize Georgia’s full potential as a wine exporter?
Georgia has many natural advantages that could be further exploited in marketing its
wine abroad. It has, for example:
a history of 8000 vintages, longer than any other country;
more than 500 unique Vitis vinifera winegrape varietals;
a wide diversity of terroirs in which winegrapes can thrive;
a unique and ancient organic production method (qvevri), possibly to be nominated
for UNESCO cultural heritage protection in 2012;
low-cost labor and viticultural land by Western standards;
low chemical and water applications even in its more-modern styles of production;
a unique and authentic food/wine/hospitality culture;
a reputation (especially in Russia and among diaspora elsewhere) for approachable
semi-sweet red wine and for high-quality brandy and chacha (grappa); and
beautiful mountain-backed landscapes and stunning historical architecture at the
eastern edge of Europe to add to the attractions for food-and-wine tourists.
While those advantages on their own are not enough to guarantee sales in new
markets,5 they can certainly be used to capture the initial attention of foreign wine
writers, importers and consumers via a generic ‘Wine of Georgia’ marketing campaign.
The advantage of still having the ancient qvevri production style, for example, is a genuine
point of difference (as highlighted in the new DVDs by Kokochasvili 2011 and Lambert and
Finlay 2011) even if the shares of qvevri wine in Georgia’s labelled wine production and
exports remain small.
A pre-requisite for launching a major generic or brand marketing campaign is to
have products ready in sufficient volume to be able to be well-positioned in clearly
5 Italy, for example, has had more than 2000 vintages, has 227 ‘main’ winegrape varieties grown in a wide range
of terroirs in very attractive settings, and is well-known globally and appreciated for its food-and-wine culture.
See http://ec.europa.eu/agriculture/markets/wine/facts/varieties_en.pdf

16
defined market segments. In their Export Market Development Action Plan, the Georgian
Wine Association (GWA 2011) has identified at least three broad quality segments in foreign
markets for dry light still wine:
non-premium wine, typically sold in bulk;
popular premium wine that newcomer consumers often find attractive, mostly retailed
in bottles (or bag-in-box, but increasingly over recent years New World wineries have
exported in bulk before they or a supermarket bottle it in its destination country); and
super-premium or fine wine, always exported in bottles.
According to Anderson and Nelgen (2011, Tables 158, 169 and 170), these three segments in
2009 accounted for 37, 50 and 7 percent of the volume of global wine imports, respectively
(with sparkling wine making up the remaining 6 percent), and for 11, 58 and 16 percent of
the value of global wine imports, respectively (plus sparkling wine for the remaining 15
percent). The average export unit values per litre thus escalate across that range, from around
US$0.90 for non-premium to $3.25 for commercial premium, $6.50 for super-premium and
$8.10 for sparkling wine (or $4.45 if French Champagne is excluded). The challenge for
Georgian winemakers is to be cost competitive in supplying into one or more of those market
segments – and at something less than those average prices, so as to entice newcomers to try
their wine.
5.1 Which market segments, which destinations to target, which varieties to focus on?
Since Georgia already has a strong reputation in Russia, other CIS countries and
among ex-Soviet diaspora for its semi-sweet red wine and for its brandy and chacha, it
will be able to build on that in non-CIS countries, beginning in cities/areas where the
diaspora have congregated. It will also be able to quickly return to the Russian market when
that re-opens, should wineries so choose – although that market is slowly changing as it gets
exposed to wines from non-CIS countries (Scholes 2011). The focus of discussion here,
though, is on what is, or could be, Georgia’s comparative advantages in the above three dry
still wine segments outside of Russia, and therefore which countries should its wineries
target.
The Georgian Wine Association has identified six markets it believes are worth
targeting initially. Apart from the smallest of them (Poland), they are listed in Table 4. They
comprise the world’s three largest wine importers (the UK, the US and Germany) plus

17
Ukraine and China. Around half of the import volume of Germany and China is non-
premium (as is also the case for Russia), compared with just one-quarter for the other three.
However, the average price of Georgian exports is a little above the average of the
commercial premium category, and Table 5 suggests that finer wine segment (‘super
premium’) comprises a very small share of each of those markets – less than 5 percent – apart
from the US where it was 8 percent by volume and 18 percent by value in 2009.
There are marked differences between Western markets. The Wine Association’s
Development Action Plan (GWA 2011) recognizes this, and suggests the price points,
varieties and styles of Georgian wines that might best be targeted in each market. Consistent
with many other analysts, it suggests aiming for the low end of super-premium sales in all six
countries, plus also the diaspora market in the US and Germany. It recognizes also the large
size of the non-premium market for bulk wine sales in China and Germany, presumably as a
way of disposing of (unplanned?) low-quality wine. But it also suggests sales of commercial
premium wines in China, Poland and Ukraine, perhaps as a way of dealing with planned
super-premium wine that did not quite reach that standard following difficult vintages.
Deloitte Consulting (2011), like many others, point out that the non-premium market is
chronically over-supplied globally and that the commercial premium segment has become
extremely competitive with very low margins thanks to the supermarket revolution on the
buyer side and, on the seller side of the market, the economies of large scale possible in
commodity wine production in the relatively lightly populated New World. Differentiated
products, by contrast, not only enjoy higher margins but are more recession-proof (see
Gopinath, Itskhoki and Neiman 2011).
As for varieties, Georgia has been blessed with more than 500 indigenous
varieties, of which more than half are currently still in production and others are in
nurseries. In addition, Georgia imported western winegrape varieties and production and
processing technologies as long ago as the 1820s (Kharbedia 2010, p. 33), and more have
been planted over the past decade or so. Many of the indigenous varieties have names that
western consumers would struggle to remember, and have flavor profiles that may be either
insufficiently or too different from those of international varieties to be easily marketable.
Even the key indigenous varieties considered most likely to succeed abroad, such as red
Saperavi and white Rkatsiteli, are produced in styles that Western consumers may find not
immediately approachable. Some wineries are therefore modifying the styles somewhat,
while others are blending those varieties with international varieties. If the latter name is
placed first on the label of a 50:50 blend, there is the additional advantage that the foreign

18
consumer may be less hesitant to try it once and more likely to enjoy it enough to remember
the label when returning to the wineshop for more of the same (or of the adjacent bottle with
only the indigenous variety).
Most New World countries have found that they initially became famous for just
one or two varieties – as has Austria since its recent resurgence as a wine exporter.6 The
head of Austria’s generic wine marketing agency warns that it is wiser to market the country
rather than its signature varietal, lest the consumer tire of the latter (Carter 2011). Argentina
is aware of that risk, but its export success with Malbec has been so phenomenal that for the
moment it continues to ride the wave. In 2010, Argentina exported more than 4 million cases
of Malbec to the United States, 20 times the amount it sent in 2002 and nearly double its
2008 volume. Malbec, which now represents 60 percent of Argentina’s exports to the US,
was a rustic red with little appeal outside the country prior to the surge in foreign investment
following its devaluation by three-quarters at the end of 2001. However, the style has been
transformed over the past decade to broaden hugely its appeal as a food wine even when
drunk young. Wines of Argentina, the country’s generic marketing agency, is now advancing
its message by communicating directly to the consumer with events such as Malbec World
Day. Having the cover story of the December 2011 issue of the US magazine Wine Spectator
(see Wesley 2011)further boosted their sales in 2012.
How might Georgia first expand its grape and wine outputs for such export
markets, and then expand the demand for the final products in time for when they
would be ready for shipping? Bearing the GWA’s Plan in mind, the key challenges are
considered in turn below, drawing where appropriate on the experiences of other wine-
exporting countries, before also considering the contribution that wine tourism could make.
5.2 What is needed to expand export supplies?
While there appears to be under-utilized capacity in Georgia’s wineries and vineyards
at present, that may be more apparent than real. Old Soviet winemaking equipment was
designed for large-scale production of low-quality semi-sweet red wine for the Russian
market, and much of it is unsuitable for producing wines of sufficient quality to compete in
6 This shows up in varietal intensity indexes, defined as the share of plantings to a variety in a country relative to
its share globally. In 2000 Australia’s Shiraz index was 9 (and Australia accounted for 4% of global planting of
Shiraz), Argentina’s Malbec index was 14 (6% of global planting), New Zealand’s Savignon blanc was 19 (4%
of global planting), and Austria’s Grüner Veltliner was 81 (9% of global planting – see Anderson 2010).

19
Western markets. Even qvevri production methods may need to be modified to ensure they
meet the demanding health standards of wine-importing countries.
Most small vineyards would require substantial upgrading before they could
produce the grapes needed by a modern export-focused winery. For example, denser
spacing of vines might be needed to raise grape quality; different varieties or even different
clones may be needed before a contract is offered by a winery to a grower; and even then the
winery may require a change in management practices to ensure the grapes suit the style of
wine for which they are to be targeted. The fact that so many Georgian farmers are struggling
to sell their surplus grapes and yet new wineries are planting their own vineyards is an
indication that the current grape output of smallholders is not meeting the needs of export-
focused wineries.
Even more importantly, there is an evident shortage of skilled viticulturalists,
winemakers, and especially wine marketers capable of working together with
grapegrowers. Yet that collaboration is essential if small growers are to deliver winegrapes
than can lead to a saleable product on time and at the right price point to prospective markets
abroad.
On top of that, the irrigation infrastructure also needs major improvements if it is
to support production in dry years.
The fact that more investment is needed if Georgia’s exportable surplus of wine
is to expand substantially is similar to the situation faced by all the New World
countries that chose to rapidly expand their wine exports over the past decade or two. In
Australia’s case, the industry attracted the required investment funds by developing a shared
30-year vision for the industry’s future called Strategy 2025 (AWF 1995). At the time the
targets in that document were considered by many observers as rather optimistic, since they
involved a three-fold increase in the real value of wine production, 55 per cent of it for the
export market. Yet so convincing was that document, and so intense and rapid was the
subsequent investment, that the industry was more than half-way towards most of its 30-year
targets in just six vintages (leading to excessive production in the subsequent decade – see
Anderson 2011).
Investment funds are required for altering or upgrading existing vineyards or
planting new ones. They are needed even more immediately than for the building or
upgrading wineries, bearing in mind that it takes a few years before grapes from new
vineyards are available for producing the desired wine.

20
Funds are needed also to finance the non-trivial costs of planning and then
executing a marketing program for those wines. Those funds are required prior to, as well
as when, the wines become ready to export to virgin markets.
In addition to finance for those investment needs of private firms, funds are
required at an industry level for investing in collective goods and services. These include
targeted viticultural, winemaking and wine marketing education plus extension and
leadership skills development, grape and wine research and development (R&D), generic
promotion of ‘Wines of Georgia’ (see next sub-section), and more statistical data collection
and up-to-date dissemination. Data are especially needed on the pace and nature of expansion
in vineyard and winery capacity, as an aid to investors and so as to avoid the excessive
exuberance in expanding that Australia experienced in the ten years following the release of
its 30-year plan, which contributed to the subsequent decline in its average export price (see
Figure 18).
It would be a mistake to assume that an expansion of grape and wine R&D
investment is something that Georgia can postpone. This is despite the fact that its
traditional production methods are well know, having been passed down through the
generations, and that the published results of the many research institutes abroad concerning
alternative production methods can be readily accessed via the internet. The reason is that,
apart from the qvevri method, there is almost no such thing as natural wine. On the contrary,
there is great scope to alter styles to suit various markets (Lewin 2010). Since Georgia will
target market niches requiring styles different from other suppliers, it needs its own R&D
capability. In addition, there is clear evidence that a strong R&D base is needed not just for
innovation but also to adapt technologies adoptable from abroad (Griffiths, Redding and van
Reenen 2004). It is therefore laudable that in November 2011 President Saakashvili launched
the Georgia Wine Institute in Tsinandali, Kakheti.
There are some researchers available locally, but additional ones will need to be
recruited from the global pool and/or created by providing scholarships for promising
students to undertake post-graduate studies in one or other of the world’s major wine
universities. There are two important additional benefits from such training: it will build
links for future international collaboration in R&D; and it will provide a pool of lecturers for
teaching undergraduate grape and wine science courses in Georgian universities.
To fund such R&D expansion and scholarships, a levy might be required. Most
wine firms in Georgia are too small to justify their own R&D facility. If foreign assistance
grants are insufficient, and if the government feels this activity would have too few spillover

21
benefits beyond the wine industry to justify full public funding, then one possibility is to
collect a small levy on all exported wine. That levy process could then also be used to help
fund the generic promotion proposed in the next sub-section. It could also be used to cover
the cost of inspecting a sample of each wine destined for export – an essential activity
required to ensure that only wine of sufficient quality is allowed to carry the words ‘Made in
Georgia’ on its label.
Small winegrape growers are unlikely to contribute to exports without having to
agree to management disciplines. Currently there are hundreds of thousands of small
winegrape growers and only a few dozen export-capable wineries. While those smallholders
mostly produce grapes for home-processing for their own consumption and for informal sales
to friends, they could expand their sales to wineries if there was a demand. To do so,
however, they would need to forego their reluctance to allow the commercial winery to
determine the varieties grown, production techniques used, harvest time, sugar content, etc.
More than that, they may be required to enter into a formal contract that would further limit
their independence and flexibility, and even then there may be considerable uncertainty as to
the final price they would receive for their grapes.7 To date wineries exporting to new
markets have signed up relatively few growers and have instead planted their own vineyards
so as to be able to have full control of the winegrape production part of the supply chain. This
issue matters from a rural poverty alleviating perspective, but it will also affect the optimal
path of institutional innovation.
Experience in the rest of the world provides some guidance as to how the firm
structure of the industry might evolve in Georgia. In all the New World wine-exporting
countries, the firm structure is very skewed: the largest winery in each of those countries is
responsible for between one-fifth and one-third of all domestic sales, and the four largest for
about three-fifths of domestic sales and an even larger share of export sales. By contrast, in
Western Europe apart from Portugal, the top four firms are responsible for only between 4
and 20 percent of domestic sales (Table 5). The Old World continues to be dominated by a
large number of cooperatives, many of which do not penalize low-quality grapegrowers
enough to prevent the delivery of fruit that can be used only for non-premium wine or for
industrial alcohol – hence the EU’s history of wine lakes since the advent of its Common
7 In California both high-quality and lower-quality winegrapes tend to be subject to contracts, with the former
more likely to include provisions regarding the production process while the latter more likely to focus just on
product attributes such as sugar content (Goodhue et al. 2003, Goodhue 2011). Contracts are being used
increasingly in Europe’s transition economies to assist vertical coordination across agri-food supply chains. See,
Dries et al. (2009) and Gorton, Dumitrashko and White (2006) for examples from the dairy industry.
22
Agricultural Policy in the early 1960s. In particular, many cooperatives do not appear to be
able to successfully export super-premium wines. Nor are they able to compete well in the
international market, especially against the very large exporting firms of the New World, in
supplying large quantities of consistent commercial premium wines for the major chain stores
and supermarkets. Cooperatives are therefore not likely to be the answer for engaging more
small growers in a wine export drive – not to mention that many Georgian farmers remain
wary of returning to any form of collective.
The recent experience of New World wine countries suggests that the firms that
survive and thrive as exporters are the larger and more-productive ones. This is
consistent with empirical evidence from the international economics literature for
manufacturers in general. That literature also reveals that the most-productive exporters of
differentiated (branded) goods tend to be those who segment their markets and upgrade the
quality of the products they sell to high-income countries (Bastos and Silva 2010; Flach
2011). These findings suggest small local firms such as Pheasant’s Tears may be the
exception rather than the norm among successful wine exporters – although in southern
hemisphere countries there are some smaller wineries, which have been under family
ownership for several generations, that have emerged as successful exporters.8
Given also how crucial it is to understand market niches and the distribution
system in each country of destination, a rapid expansion of wine exports from Georgia
to the West is likely to require attracting foreign investors already very familiar with
selling into those markets. This is especially so because such experienced firms also are
more likely to be at the technological frontier in viticulture, oenology and wine marketing
and to be able to access the substantial upfront finance that is required to plant new
vineyards, construct or renovate a winery, and invest abroad in brand development.
In aspiring to expand production, it should be remembered that there is such a
thing as expanding too rapidly. As already mentioned in connection with Figures 13 and
18, Australia’s vineyard area and consequent wine production grew so fast from the mid-
1990s that marketers simply could not find enough outlets for it all once the wine from new
vines became available for sale – especially when the financial crisis hit the United States and
the EU from 2007. The subsequent discounting and sales in bulk rather than in branded
bottles is reflected in the rapid decline over the past decade in the unit value of Australian
exports shown in Figure 18. This led to a commensurate drop in grape prices (by more than
8 See, for example, www.australiasfirstfamiliesofwine.com.au

23
one-third for Shiraz between 2008 and 2011 vintages). The same happened to New Zealand
from 2007: the unit value of its wine exports fell from US$6.65 in 2007 to $4.93 in 2010
(Anderson and Nelgen 2011, Table 79), with bulk wine’s share of exports rising from 5 to 30
percent (NZW 2011). One way to reduce the risk of over-supply is to collect and promptly
disseminate accurate and comprehensive data on nursery sales, new plantings, vineyard
renovations and winery crushing and bottling capacity.
5.3 How to expand export demand?9
There is a major role for generic promotion to accompany and support private-sector
promotion. Certainly firms are capable of developing their own brands according to their
competitive advantages and points of difference but, especially in markets unfamiliar with the
country’s wines, attention first needs to be drawn to what the nation has to offer in general.
Empirical evidence supports this view for products in general,10
and it is even more so for
credence goods such as wine.
The experiences of other small economies provide guidance as to what generic
promotion works well. Chile (www.winesofchile.com) and New Zealand
(www.nzwine.com) are good examples. So too is Austria (www.austrianwine.com), a country
in which, like Georgia, the majority of winegrape growers have less than 1 hectare of vines.
All three countries have sought to associate their wines with their country, and to emphasize
the clean, green image of their beautiful vineyards against a background of snow-capped
mountains – something Georgia can surely emulate.
Austria provides a lesson on the importance of protecting the generic reputation
of a country’s wine quality. In 1985, a small proportion of Austrian wine was found to have
been adulterated with a harmless but illegal additive to add body and sweetness. Austrian
wine exports plummeted by four-fifths within a year, and took more than a decade to recover.
That recovery process has been characterized by raising the quality as well as image of
Austria’s exports (Carter 2011). As a consequence, during the past decade the unit value of
those exports has nearly trebled (Figure 19). This underscores the importance of Georgia
9 Demand for Georgian wines in the CIS countries is already well established, so attention in this section is
focused on promoting Georgian wines in non-traditional markets in Western Europe, North America and East
Asia. 10
According to a recent cross-country study by Lederman, Olarreaga and Payton (2009), covering all exports
not just wine, a 10 percent increase in the budget for generic export promotion on average leads to between a 0.6
and a 1.0 percent increase in exports. They also find diminishing returns to such expenditures, so the returns are
even higher for those countries just beginning to grow their budget for such activities.

24
having in place sound procedures for testing the quality before approving the export of wines
labeled ‘Made in Georgia’.
New Zealand has done well in promoting images of its countryside even though
most of its customers in the northern hemisphere have not visited such a distant place.
That is good news for Georgia because, even though it is on the edge of Europe, to those
living near the north Atlantic it is still considered remote (infrequent flights, unfamiliar
airlines, troubled borders). If images can substitute for reality, they can buy time for Georgia
to build its wine tourism (see next sub-section).
In the first decade of its export boom, Australia’s generic promotion was
considered highly successful. It promoted the idea of ‘sunshine in a bottle’, of bold up-front
fruity styles that appealed very much to newcomers to wine who were the target of
supermarkets. But consumers – or at least wine columnists and other opinion leaders –
gradually tired of the uniformity of styles. The reputation of Australian wine has gradually
slipped over recent years as a consequence. This is ironic, because it occurred just as many
Australian winemakers were moving to more elegant, restrained styles to accompany fine
foods (Hooke 2011, 2012). As with Austria, the lesson is that while it is a slow process to
build a strong generic reputation, the dismantling of that reputation can be swift. Australia is
now investing heavily in rebuilding its reputation but with a focus on finer wines as well
(www.apluswines.com).
Georgia can emphasize numerous points of difference to attract attention to its
wines. Those differences, listed at the start of this section, include its wines’ history,
diversity, uniqueness, and authenticity. Its qvevri technology is especially appealing to wine
enthusiasts. It could also appeal to a much wider clientele if it could be demonstrated that
qvevri wine is healthier than wine as conventionally produced in the west. There is already
some preliminary scientific evidence to support that claim (Shalashvili et al. 2010; Diaz
2011). If such studies were to be replicated and supplemented by other scientists, particularly
in the countries which are to be targeted as export markets, they could be drawn on by wine
writers in their reviews of Georgian wines. Meanwhile, some producers in Italy and Germany
have been experimenting with the qvevri technology (Newsweek, 31 Oct 2011, pp.50-51).
Rather than being concerned about this development, it should be encouraged: imitation is the
best of compliments and, as with that coverage in Newsweek, it can generate additional – and
free – publicity for Georgia.
Georgia’s generic promotion initially should be country-wide rather than also
stressing specific regions. However, just as the Marlborough region now has 75 percent of

25
New Zealand’s winegrape area, so Kakheti has a similar proportion in Georgia. Hence that
region will tend to become the best known, especially if it continues to also be the region
where wine tourism is developing fastest. It is thus helpful that in 2011 the European Union
agreed to legally protect Georgia’s geographical appellations. Other countries importing
Georgian wine will now be able to be encouraged to follow suit. This is particularly
important in countries where there is a risk of counterfeit wine, as it provides not only
recognition but also legal protection.
A single industry body could undertake generic promotion as well as administer
generic R&D funds. Experience in New World countries suggests there are economies of
size for a small country to combine the roles of promotion, R&D and regulatory oversight in
one industry-owned organization, as in New Zealand (NZW 2011, p. 21) and probably also in
Australia by the end of 2013 (WFA 2012). That allows the returns from those three activities
can be compared and the budget divided so as to maximize its overall return to the industry
(and to the government, if it also is a financial stakeholder).
The budget for generic promotion and R&D should be in the millions of dollars.
Australia and New Zealand each spend close to 1 US cent/litre of wine produced on generic
promotion (and associated regulatory functions), while Bordeaux spends more than 3 cents.
Australia spends about 2 cents/litre on R&D, compared with about 1 cent in New Zealand. So
if Georgia were to emulate Australia’s spending pattern, with its annual production near
100ML per year that would suggest an annual budget of $1million/year on generic promotion
and $2million/year on R&D and related extension activities initially (and to grow in parallel
with the industry’s output). Even if one were to exclude non-commercial production for the
home market from the base of the calculus, about half those budgets would be required by
2015 if the President’s aim of trebling the volume of exports between 2011 and 2015 is
realized.
5.4 What role for wine tourism?
The potential to build wine tourism in Georgia is enormous, as eloquently explained by
Taber (2009). A start has been made, with some wineries offering cellar-door tastings, but
many other components need to be added. They include more hotels ranging up to 4- if not 5-
star (with internet access, brewed coffee and dependable hot water), similar-quality
restaurants with English-language waiters who know how to serve wine with food (with some
at least offering a supra experience), more sealed roads connecting key sites, better road
26
signage with a wine route symbol, information bays/kiosks, wine route maps and booklets in
English and other key languages (with sample itineraries and contact details and opening
times of each winery’s cellar door and each major restaurant), acceptance of major credit
cards, and comprehensive multilingual websites to facilitate pre-tour planning. Recently two
excellent DVDs have been produced to explain the uniqueness of what Georgia has to offer
(Kokochasvili 2011, Lambert and Finlay 2011). If they are circulated widely, through being
given to opinion-shaping visitors to take home and share with friends and colleagues, a better
understanding of what Georgia has to offer can spread much faster than just via word of
mouth.
To minimize travel times between venues, a clustering of cellar doors would help
greatly. This is especially so if the cluster included or was nearby accommodation and dining
and also near historic sites such as Tsinandali Estate or Alaverdi Monastery.11
Given the
heavy concentration of wine production in Kakheti, it would make sense to concentrate
public infrastructure expansion in that area initially.
Investment finance is needed to build the infrastructure and facilities expected
by today’s international tourists from high-income countries, and then the construction
phase can employ many low-skilled workers. This will thereby provide a major expansion
in part-time off-farm earnings for farm households.
Once built, wineries, cellar door outlets, restaurants and hotels also require, on
an on-going basis, large numbers of employees over the full spectrum of skills. To build
those skills, post-secondary school training opportunities need to be created, such as in
hospitality, vineyard management, winery tasks and cellar door skills. Then wine tourism
could be a major supplement to the employment- and income-creating opportunities that will
be provided by expanding grape and wine production in Georgia.
6. Implications for policy and poverty alleviation
The potential for wine export growth in Georgia is very real and, along with it, in-
bound wine tourism. This is not to deny, though, that there are many challenges to be faced,
such as the small number of large wineries, the wide range of qualities and varieties of grapes
11
For more-detailed suggestions from a visiting group of opinoin-shapers, see Deloitte Consulting (2011).

27
and wines currently being produced, and the poor infrastructure that is hampering the
development of wine tourism.
To realize that potential, inputs are required not only from the private sector but
also from the government, beginning with the national investment agency. That agency,
Invest in Georgia, has a role in attracting investor interest in the industry and in associated
tourism opportunities. In conjunction with the Georgian Wine Association’s Development
Action Plan (GWA 2011), Invest in Georgia can build awareness among prospective
investors both domestically and abroad. The diaspora is an obvious target group, but so too
are the large wine corporations that are already well established in the target markets.
The Georgian National Tourism Agency clearly also has a major role to play in
developing in-bound tourism. The food-and-wine focus provides a major hook though, so
the industry needs to work with the Tourism Agency to reap mutual benefits. This linkage
between the promotion of Georgian wine and Georgia as a tourist destination makes a strong
economic case for government co-funding of wine promotion in selected markets abroad.
The government also has a key role in supporting investments in grape and wine
R&D, in the tertiary education of viticulturalists, oenologists and wine marketers, and
in the post-secondary-school training of workers for the industry and for the wine
tourism sector. A strong economic case can be made for government co-funding of
agricultural research in general, without which there inevitably will be under-investment
because the private sector is unable to capture all of society’s gains from such investments
(Alston and Fulton 2012). The case is even stronger for grape and wine research in Georgia,
given the contribution it could make to expand dramatically the revenue from the low-
performing grapevines of many low-income farm households (and even to encourage the re-
planting of vineyards that were pulled out from the mid-1980s).
If the industry is to be able to continue to produce even in dry seasons, it needs
reliable access to irrigation. Currently the irrigation infrastructure is very run down. Getting
the right institutions and policies in place for that to happen in a major challenge (see, e.g.,
Young 2010), but it will have a high social payoff as it would help not only the wine industry
but also the producers of all fruits and vegetables. Since the horticultural industry is very
labor-intensive, that would add to the expansion of jobs in rural areas. If it too became more
export-focused, the jobs would include packing, processing and transport activities. As such
countries and Chile and Peru have found over the past two decades, this can provide a great
boost to rural development and to the alleviation of poverty.

28
Finally, the Government’s current program of providing a floor price for buying
sub-standard grapes from growers unable to sell to commercial wineries, and
processing them in state-owned wineries (for eventual sale in bulk or for converting to
industrial alcohol), needs reforming. Apart from the fiscal wastage of such a program
(since costs are likely to exceed sales revenue of such state-owned wineries), it provides a
disincentive for below-average growers to raise the quality of their product to a level
acceptable to commercial wineries. If the resulting accumulation of low-quality wine is then
exported in bulk to neighboring countries, there is the risk that (as has apparently already
happened in Ukraine) it will be bottled and sold as Wine of Georgia and thus diminish the
reputation of bottled wine exported directly from Georgia. That fiscal expenditure could
instead be used more productively to directly support poor farm families either to upgrade
their winegrape production or to restructure away from grape growing and towards more
profitable activities.
References
Alston, J.M. and M. Fulton (2012), ‘Sources of Institutional Failure and Underinvestment in
Levy-Funded Agricultural Research’, Invited paper for the 56th
AARES Annual
Conference, Fremantle, Western Australia, 8-10 February.
Anderson, K. (ed.) (2004), The World’s Wine Markets: Globalization at Work, Cheltenham
UK: Edward Elgar.
Anderson, K. (2010), ‘Varietal Intensities and Similarities of the World’s Wine Regions’,
Journal of Wine Economics 5(2): 270-309, Winter.
Anderson, K. (2011), ‘Contributions of the Innovation System to Australia’s Wine Industry
Growth’, Ch. 4 in E. Giuliana, A. Morrison and R. Rabellotti (eds.), Innovation and
Technological Catch-up: The Changing Geography of Wine Production, Cheltenham
UK: Edward Elgar.
Anderson, K. and S. Nelgen (2011), Global Wine Markets, 1961 to 2009: A Statistical
Compendium, Adelaide: University of Adelaide Press, accessible as an e-book at
www.adelaide.edu.au/press/titles/global-wine and as Excel spreadsheets at
www.adelaide.edu.au/wine-econ/databases/GWM/
29
AWBC and WFA (2007), Wine Australia: Directions to 2025, An Industry Strategy for
Sustainable Success, Adelaide: Australian Wine and Brandy Corporation and
Winemakers’ Federation of Australia, May.
AWF (1995), Strategy 2025: The Australian Wine Industry, Adelaide: Winemakers’
Federation of Australia for the Australian Wine Foundation.
Bastos, P. and Silva, J. (2010), ‘The Quality of a Firms' Exports: Where You Export to
Matters’, Journal of International Economics 82(2): 99-111, November.
Carter, F. (2011), ‘Austrian Maverick: An Interview with Willi Klinger’, Meininger’s Wine
Business International 6(5): 30-33, October.
Cross, R., A.J. Plantinga and R.N. Stavins (2011), ‘The Value of Terroir: Hedonic Estimation
of Vineyard Sale Prices’, Journal of Wine Economics 6(1): 1-14.
Deloitte Consulting (2011), ‘Wine Opinion-Shapers’ Visit to Georgia: Compilation of Trip
Reports’, Tbilisi: USAID Georgia, November.
Diaz, C. (2011), ‘Studies of Traditional Winemaking Methods Based on Spontaneous
Fermentation’, Paper presented at the 1st Qvevri Wine Symposium, Georgia, 15-18
September.
Dries, L., E. Germenji, N. Noev and J.F.M. Swinnen (2009), ‘Farmers, Vertical Coordination,
and the Restructuring of Dairy Supply Chains in Central and Eastern Europe’, World
Development 37(11): 1742-58.
Fajgelbaum, P., G.M. Grossman and E. Helpman (2011), ‘Income Distribution, Product
Quality and International Trade’, Policy Research Working Paper 5843, World Bank,
Washington DC, October.
FAO (2009), Agribusiness Handbook on Grapes and Wine, Rome: Food and Agriculture
Organization, accessible at www.eastagri.org
FAO (2011), FAOSTAT, Rome: Food and Agriculture Organization, accessible at
http://faostat.fao.org/site/613/default.aspx#ancor
Flach, L. (2011), ‘Quality Upgrading and Price Heterogeneity: Evidence from Brazilian
Manufacturing Exporters’, paper presented to the 10th
Annual Postgraduate
Conference, University of Nottingham, 14-15 April. www.nottingham.ac.uk/gep/news-
events/conferences/2011/postgrad-conf-14-04-11.aspx
Friberg, R., R.W. Paterson and A.D. Richardson (2011), ‘Why is there a Home Bias: A Case
Study of Wine’, Journal of Wine Economics 6(1): 37-66.

30
Griffiths, R., S. Redding and J. van Reenen (2004), ‘Mapping the Two Faces of R&D:
Productivity Growth in a Panel of OECD Industries’, Review of Economics and
Statistics 86(4): 883-95, December.
GWA (2011), Sector Export Market Development Action Plan (SEMDAP): Wine Sector,
Tbilisi: Georgian Wine Association.
Gerguad, O. and V. Ginsburg (2008), ‘Natural Endowments, Production Technologies and
the Quality of Wines in Bordeaux: Does Terroir Matter?’ Economic Journal
118(529): F142-57, June. Reprinted in Journal of Wine Economics 5(1): 3-21, 2010.
Giuliana, E., A. Morrison and R. Rabellotti (eds.) (2011), Innovation and Technological
Catch-up: The Changing Geography of Wine Production, Cheltenham UK: Edward
Elgar.
Gladstones, J. (1992), Viticulture and Environment, Adelaide: Winetitles.
Goodhue, R.E. (2011), ‘Food Quality: The Design of Incentive Contracts’, Annual Review
of Resource Economics 3: 119-40.
Goodhue, R.E., D.M. Heien, H. Lee and D.A. Sumner (2003), ‘Contracts and Quality in
the California Winegrape industry’, Review of Industrial Organization 23(3-4):
267-82, December.
Gopinath, G., O. Itskhoki and B. Neiman (2011), ‘Trade Prices and the Global Trade
Collapse of 2008-2009’, NBER Working Paper 17594, Cambridge MA, November.
Gorton, M., M. Dumitrashko and J. White (2006), ‘Overcoming Supply Chain Failure in the
Agri-food Sector: A Case Study from Moldova’, Food Policy 31: 90-103.
Hayami, Y. and V.W. Ruttan (1985), Agricultural Development: An International
Perspective, Baltimore MD: Johns Hopkins University Press.
Hooke, H. (2011), ‘Australia is the Most Under-Appreciated Wine Country’, Decanter, 27
September.
Hooke, H. (2012), ‘Cool, Calm and Respected’, The Sydney Morning Herald, 12 June.
www.smh.com.au/executive-style/top-drop/cool-calm-and-respected-20120609-
2028m.html
Kharbedia, M. (2010), Georgia: Cradle of Wine, Tbilisi: Wine Club.
Kokochasvili, M. (2011), The Cradle of Wine [DVD], Tbilisi: Young Directors Union New
Studio.
Lambert, D. and J. Finlay (2011), That Crazy French Woman ... in Georgia [DVD], London:
That Crazy French Woman Productions.
31
Lederman, D., M. Olarreaga and L. Payton (2009), ‘Export Promotion Agencies Revisited’,
Policy Research Working Paper 5125, World Bank, Washington DC, November.
Lewin, B. (2010), Wine Myths and Reality, San Francisco: Wine Appreciation Guild.
McGovern, P. (2003), Ancient Wine: The Search for the Origins of Viticulture, Princeton NJ:
Princeton University Press.
McGovern, P. (2009), Uncorking the Past: The Quest for Wine, Beer, and Other Alcoholic
Beverages, Berkeley CA: University of California Press.
Nayak, A. (2011), ‘Does Variety Fit the Quality Bill? Factor-Endowments Driven
Differences in Trade, Export Margins, Prices and Production Techniques’, mimeo,
Purdue University, West Lafayette IN, May. www.auburn.edu\~azn0018
Noev, N. and J.F.M. Swinnen (2004), ‘Eastern Europe and the Former Soviet Union’, Ch. 9
in Anderson, K. (ed.), The World’s Wine Markets: Globalization at Work,
Cheltenham UK: Edward Elgar.
NSO (2011a), Agriculture of Georgia 2010, Tbilisi: National Statistical Office of Georgia.
www.geostat.ge
NSO (2011b), Households’ Income and Expenditure 2010, Tbilisi: National Statistical Office
of Georgia. www.geostat.ge
NSO (2011c), External Trade of Georgia, Tbilisi: National Statistical Office of Georgia.
www.geostat.ge
NZW (2011), New Zealand Winegrowers Strategic Review, Auckland: New Zealand
Winegrowers, November.
Patchell, J. (2011), The Territorial Organization of Variety: Cooperation and Competition in
Bordeaux, Napa and Chianti Classico, Farnham UK: Ashgate.
Scholes, E. (2011), ‘Russia’s Emerging Wine Culture’, Meininger’s Wine Business
International 6(4): 33-35, September.
Shalashvili, A., D. Ugrekhelidze, I. Targamadze, N. Zambakhidze and L. Tsereteli(2010),
‘Comparison of Wines of Georgian (Kakhethian) and European Types According to
Quantitative Content of Phenolic Compounds and Antiradical Efficiency’, Paper
presented to the 33rd
OIV World Congress, Tbilisi, 20-27 June.
Simpson, J. (2011), Creating Wine: The Emergence of a World Industry, 1840-1914,
Princeton NJ: Princeton University Press.
Taber, G.M. (2009), ‘Kakheti, Georgia – the Last Frontier’, Ch. 13 in his In Search of
Bacchus: Wanderings in the Wonderful World of Wine Tourism, New York: Scribner.

32
Veseth, M. (2011), Wine Wars: The Curse of the Blue Nun, the Miracle of Two Buck Chuck,
and the Revenge of the Terroirists, New York: Rowman and Littlefield.
Wesley, N. (2011), ‘Malbec’s Moment: How a Forgotten Red Grape has Revived Argentina
and Taken America by Storm’, Wine Spectator, 15 December.
WFA (2012), ‘Industry Bodies Seek Merger of Statutory Authorities’, Winemakers’
Federation of Australia, Adelaide, 21 February. www.wfa.org.au/merger.aspx
World Bank (2009), Georgia: Agriculture and Rural Enterprise Development, Washington
DC: World Bank, December.
World Bank (2011a), Doing Business 2011, Washington DC: World Bank.
www.doingbusiness.org/rankings
World Bank (2011b), World Development Indicators, Washington DC: World Bank.
http://data.worldbank.org/data-catalog/world-development-indicators
Young, M. (2010), Environmental Effectiveness and Economic Efficiency of Water Use in
Agriculture, Paris: OECD.
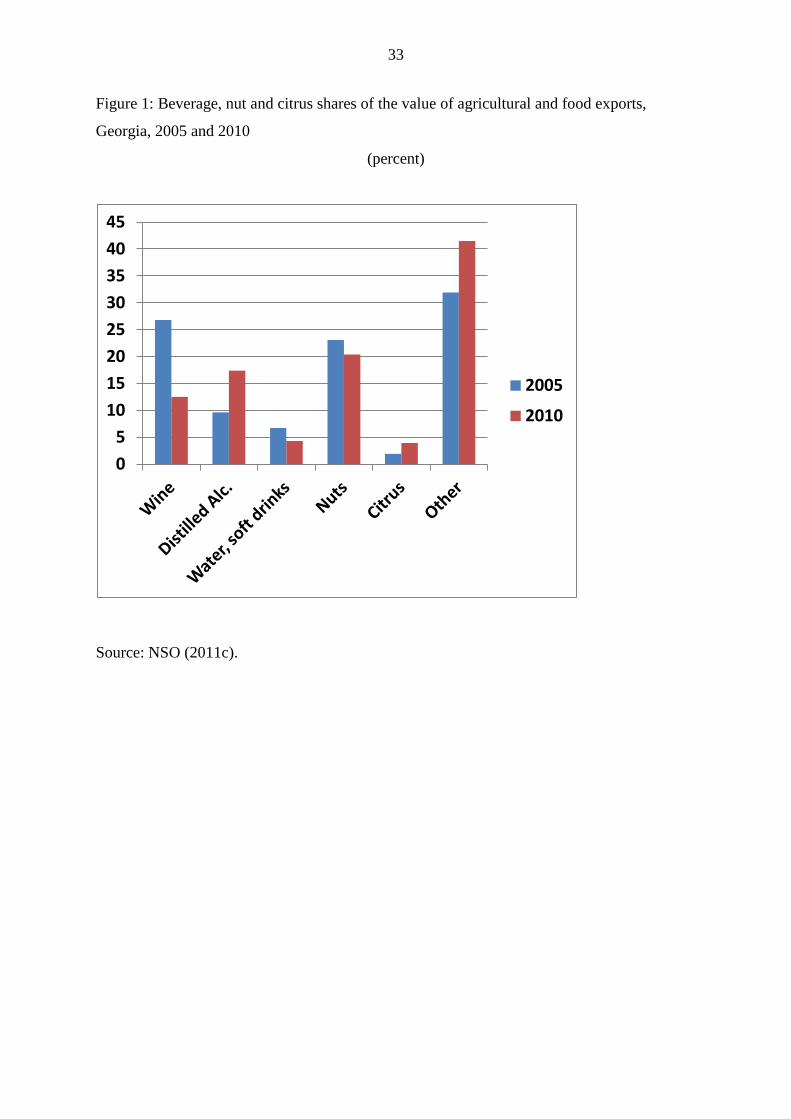
33
Figure 1: Beverage, nut and citrus shares of the value of agricultural and food exports,
Georgia, 2005 and 2010
(percent)
Source: NSO (2011c).
0
5
10
15
20
25
30
35
40
45
2005
2010

34
Figure 2: Wine export volume, value and average price, Georgia, 1995 to 2011
Source: GWA (2011) and Geostat.
0
10
20
30
40
50
60
70
80
90
0
0.5
1
1.5
2
2.5
3
3.5
4 1
99
5
19
96
19
97
19
98
19
99
20
00
20
01
20
02
20
03
20
04
20
05
20
06
20
07
20
08
20
09
20
10
20
11
ML(RH axis)
US$m(RH axis)
US$/litre (LH axis)
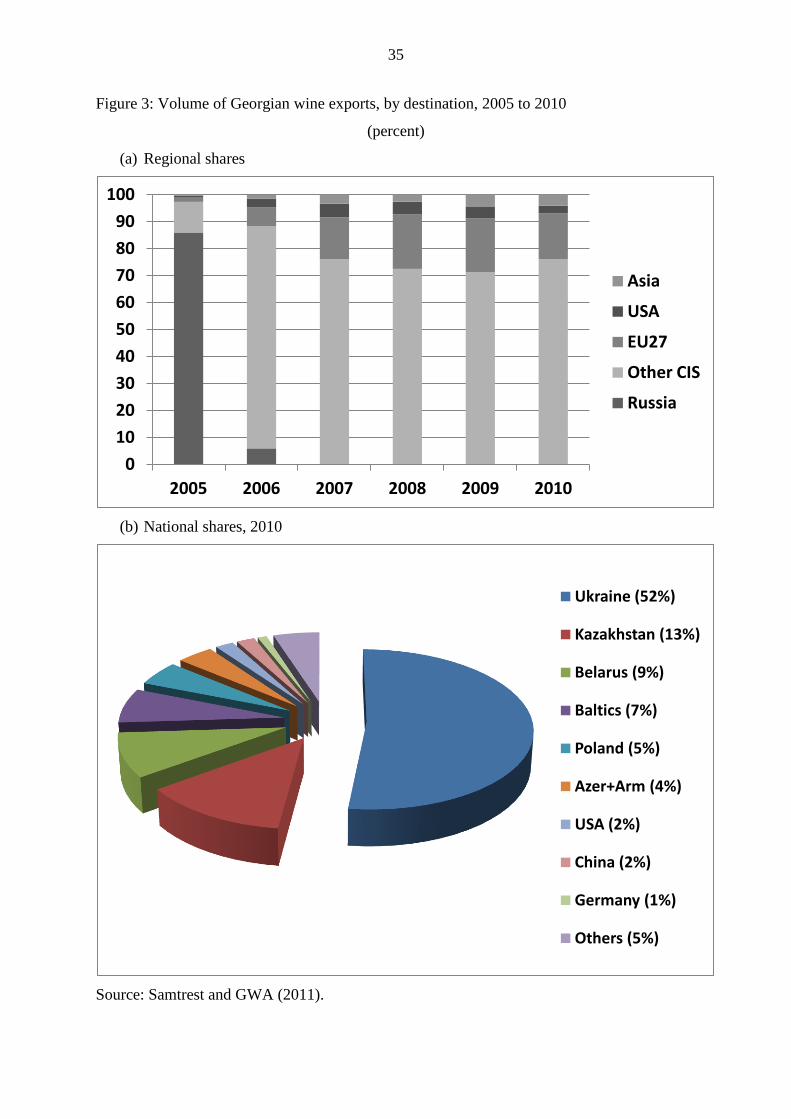
35
Figure 3: Volume of Georgian wine exports, by destination, 2005 to 2010
(percent)
(a) Regional shares
(b) National shares, 2010
Source: Samtrest and GWA (2011).
0
10
20
30
40
50
60
70
80
90
100
2005 2006 2007 2008 2009 2010
Asia
USA
EU27
Other CIS
Russia
Ukraine (52%)
Kazakhstan (13%)
Belarus (9%)
Baltics (7%)
Poland (5%)
Azer+Arm (4%)
USA (2%)
China (2%)
Germany (1%)
Others (5%)
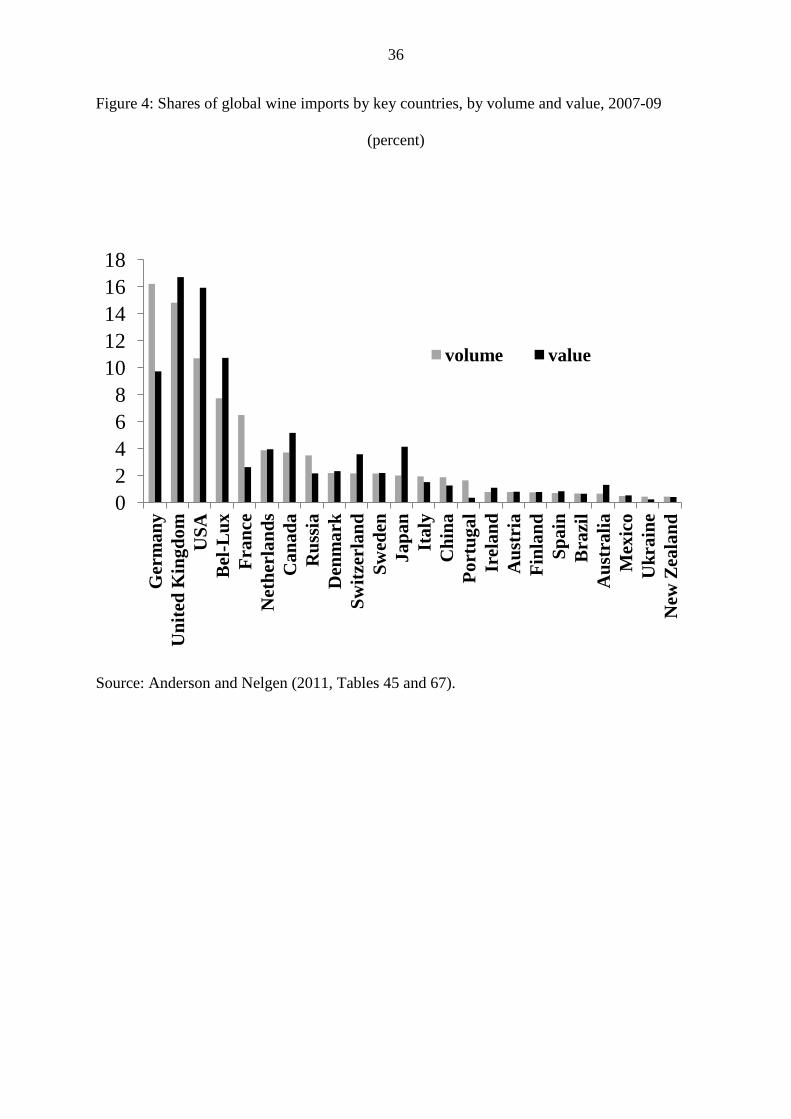
36
Figure 4: Shares of global wine imports by key countries, by volume and value, 2007-09
(percent)
Source: Anderson and Nelgen (2011, Tables 45 and 67).
0
2
4
6
8
10
12
14
16
18
Ger
ma
ny
Un
ited
Kin
gd
om
US
A
Bel
-Lu
x
Fra
nce
Net
her
lan
ds
Ca
na
da
Ru
ssia
Den
ma
rk
Sw
itze
rlan
d
Sw
eden
Ja
pa
n
Ita
ly
Ch
ina
Po
rtu
ga
l
Irel
an
d
Au
stri
a
Fin
lan
d
Sp
ain
Bra
zil
Au
stra
lia
Mex
ico
Uk
rain
e
New
Zea
lan
d
volume value

37
Figure 5: Wine consumption (including non-commercial) per adult, selected regions, 2009
(litres)
Source: Modified from data in Anderson and Nelgen (2011) to include non-commercial
consumption.
0
5
10
15
20
25
30
35
40
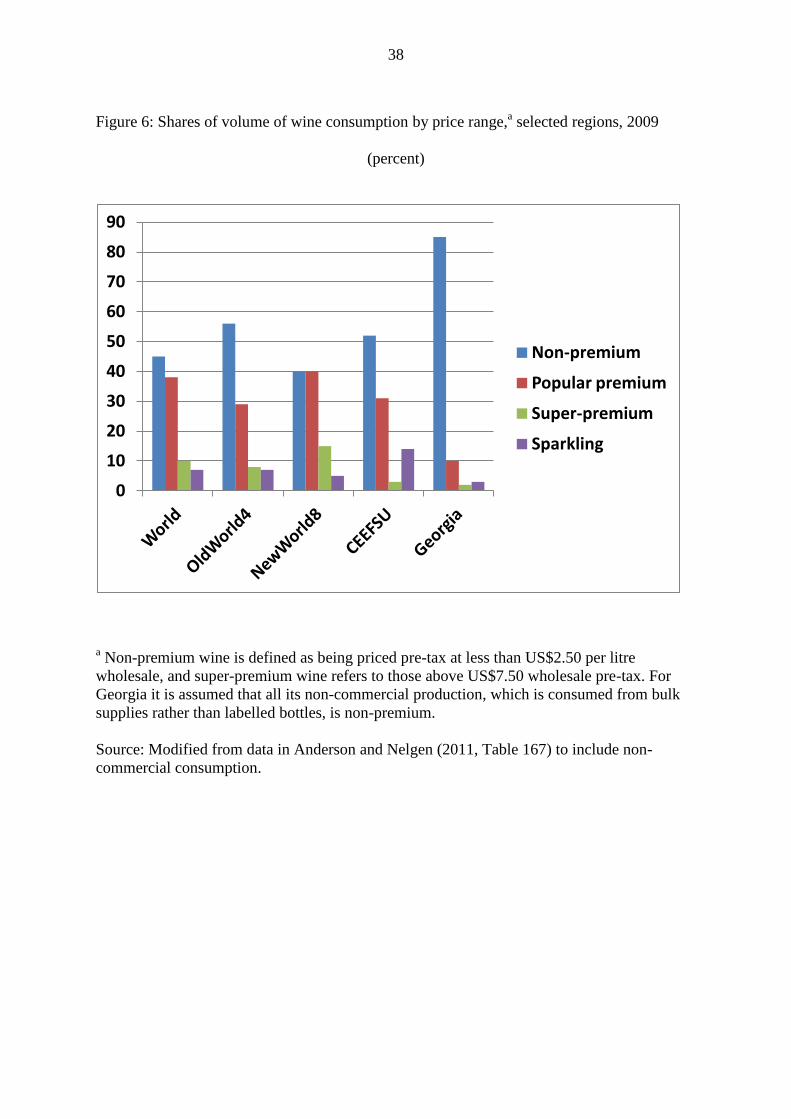
38
Figure 6: Shares of volume of wine consumption by price range,a selected regions, 2009
(percent)
a Non-premium wine is defined as being priced pre-tax at less than US$2.50 per litre
wholesale, and super-premium wine refers to those above US$7.50 wholesale pre-tax. For
Georgia it is assumed that all its non-commercial production, which is consumed from bulk
supplies rather than labelled bottles, is non-premium.
Source: Modified from data in Anderson and Nelgen (2011, Table 167) to include non-
commercial consumption.
0
10
20
30
40
50
60
70
80
90
Non-premium
Popular premium
Super-premium
Sparkling
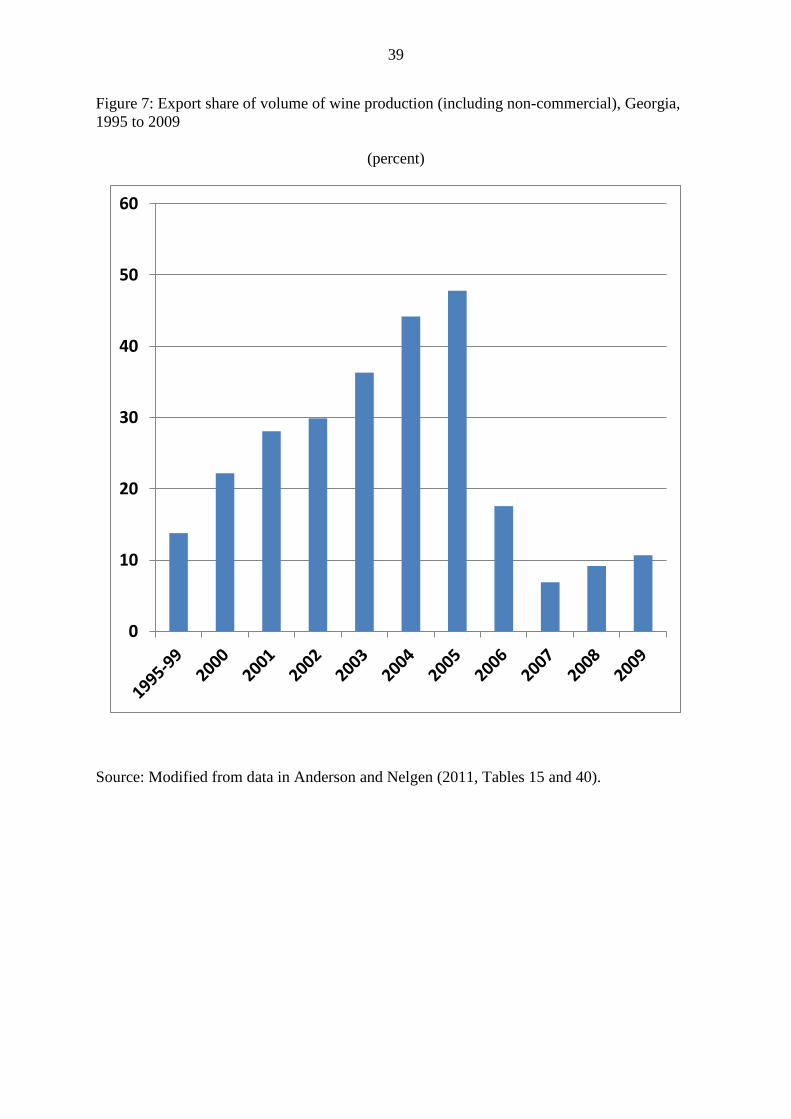
39
Figure 7: Export share of volume of wine production (including non-commercial), Georgia,
1995 to 2009
(percent)
Source: Modified from data in Anderson and Nelgen (2011, Tables 15 and 40).
0
10
20
30
40
50
60

40
Figure 8: Share of crop land under vines, selected regions, 2009
(percent)
Source: Anderson and Nelgen (2011, Table 6).
0 2 4 6 8
10 12 14 16
Po
rtu
gal
Ch
ile
Ital
y
GEO
RG
IA
Mo
ldo
va
Spai
n
EU1
5
Mac
ed
on
ia
Fran
ce
Bu
lgar
ia
Ro
man
ia
Hu
nga
ry
Wo
rld
Ch
ina
New
Wo
rld

41
Figure 9: Share of wine production volume exported, EU15, New World and global average,
1985 to 2009
(percent)
Source: Anderson and Nelgen (2011, Table 79).
0
10
20
30
40
1985-89 1995-99 2007-09
EU-15
New World
WORLD

42
Figure 10: Share of wine production volume exported, selected regions, 2009
Source: Modified from data in Anderson and Nelgen (2011, Table 51).
0
10
20
30
40
50
60
70
80
90

43
Figure 11: Georgian and New World wine exports, 1995 to 2011
(US$million)
Source: Updated from Anderson and Nelgen (2011, Table 63).
0
500
1000
1500
2000
2500
3000
Australia
Chile
United States
South Africa
Argentina
New Zealand
Georgia
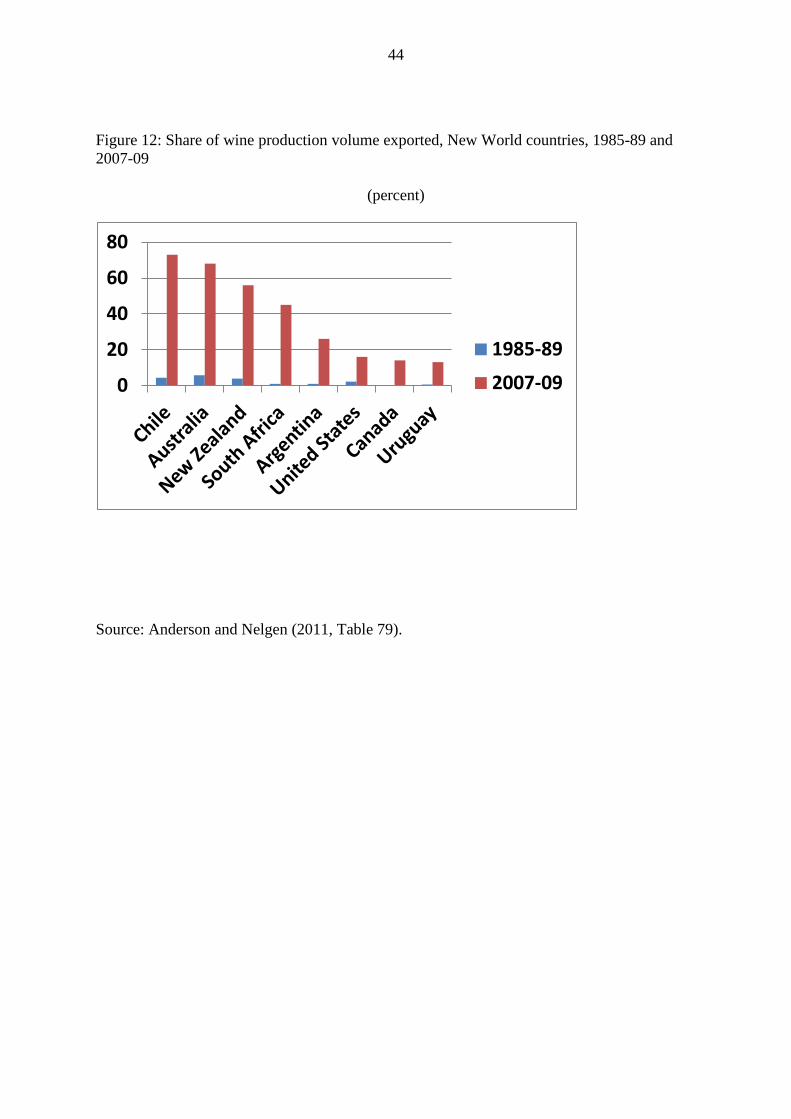
44
Figure 12: Share of wine production volume exported, New World countries, 1985-89 and
2007-09
(percent)
Source: Anderson and Nelgen (2011, Table 79).
0
20
40
60
80
1985-89
2007-09

45
Figure 13: Wine production in New World countries, 1961 to 2009
(million litres)
Source: Anderson and Nelgen (2011, Table 99).
0
500
1000
1500
2000
2500
3000
19
61
-64
19
65
-69
19
70
-74
19
75
-79
19
80
-84
19
85
-89
19
90
-94
19
95
-99
20
00
-04
20
05
-09
Australia
USA
Argentina
South Africa
Chile
New Zealand

46
Figure 14: Wine production in transition economies, 1961 to 2009
(million litres)
Source: Anderson and Nelgen (2011, Table 99).
0
500
1000
1500
2000
2500
3000
3500
4000
19
61
-64
19
65
-69
19
70
-74
19
75
-79
19
80
-84
19
85
-89
19
90
-94
19
95
-99
20
00
-04
20
05
-09
CEEurope
Other CIS
Georgia
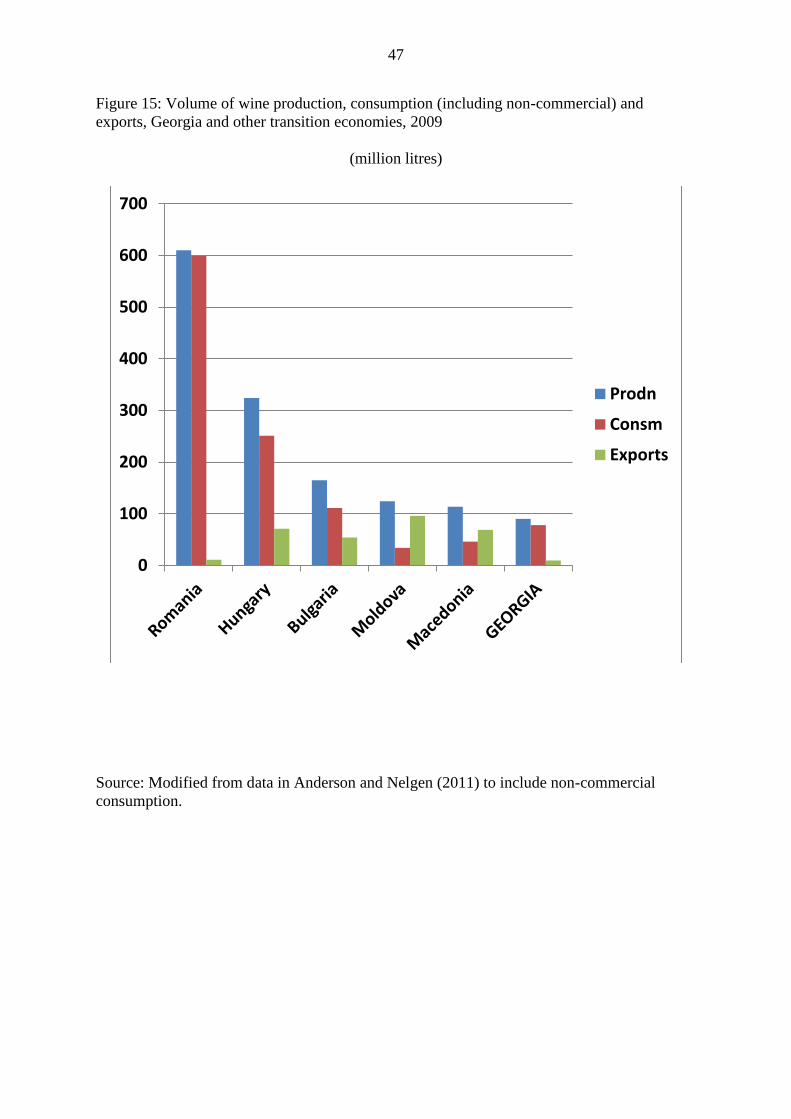
47
Figure 15: Volume of wine production, consumption (including non-commercial) and
exports, Georgia and other transition economies, 2009
(million litres)
Source: Modified from data in Anderson and Nelgen (2011) to include non-commercial
consumption.
0
100
200
300
400
500
600
700
Prodn
Consm
Exports

48
Figure 16: Average price of wine exports, selected countries, 2009
(US$/litre)
Source: Anderson and Nelgen (2011, Tables 76 and 79).
0.0
1.0
2.0
3.0
4.0
5.0
6.0
7.0
Fran
ce
Ne
w Z
eala
nd
Geo
rgia
Po
rtu
gal
WO
RLD
Ger
man
y
Au
stri
a
Ro
man
ia
Ital
y
Au
stra
lia
USA
Arg
en
tin
a
Ch
ile
Spai
n
Sou
th A
fric
a
Mo
ldo
va
Bu
lgar
ia
Hu
nga
ry
Still wine, bottled
all wine
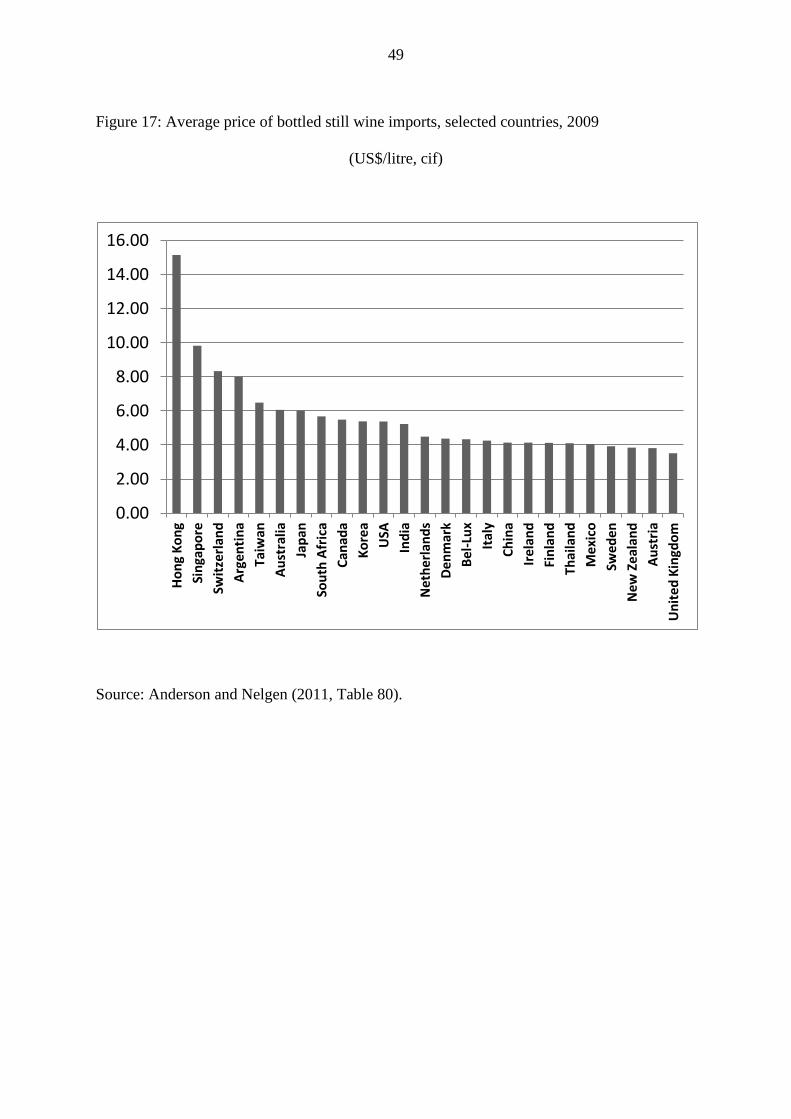
49
Figure 17: Average price of bottled still wine imports, selected countries, 2009
(US$/litre, cif)
Source: Anderson and Nelgen (2011, Table 80).
0.00
2.00
4.00
6.00
8.00
10.00
12.00
14.00
16.00
Ho
ng
Ko
ng
Sin
gap
ore
Swit
zerl
and
Arg
en
tin
a
Taiw
an
Au
stra
lia
Jap
an
Sou
th A
fric
a
Can
ada
Ko
rea
USA
Ind
ia
Ne
the
rlan
ds
De
nm
ark
Be
l-Lu
x
Ital
y
Ch
ina
Ire
lan
d
Fin
lan
d
Thai
lan
d
Me
xico
Swe
de
n
Ne
w Z
eal
and
Au
stri
a
Un
ite
d K
ingd
om

50
Figure 18: Wine export volume and average price, Australia, 1985-86 to 2010-11
(million litres and Aust. cents/litre)
Source: Derived from data at the WINEFACTS part of www.wineaustralia.com
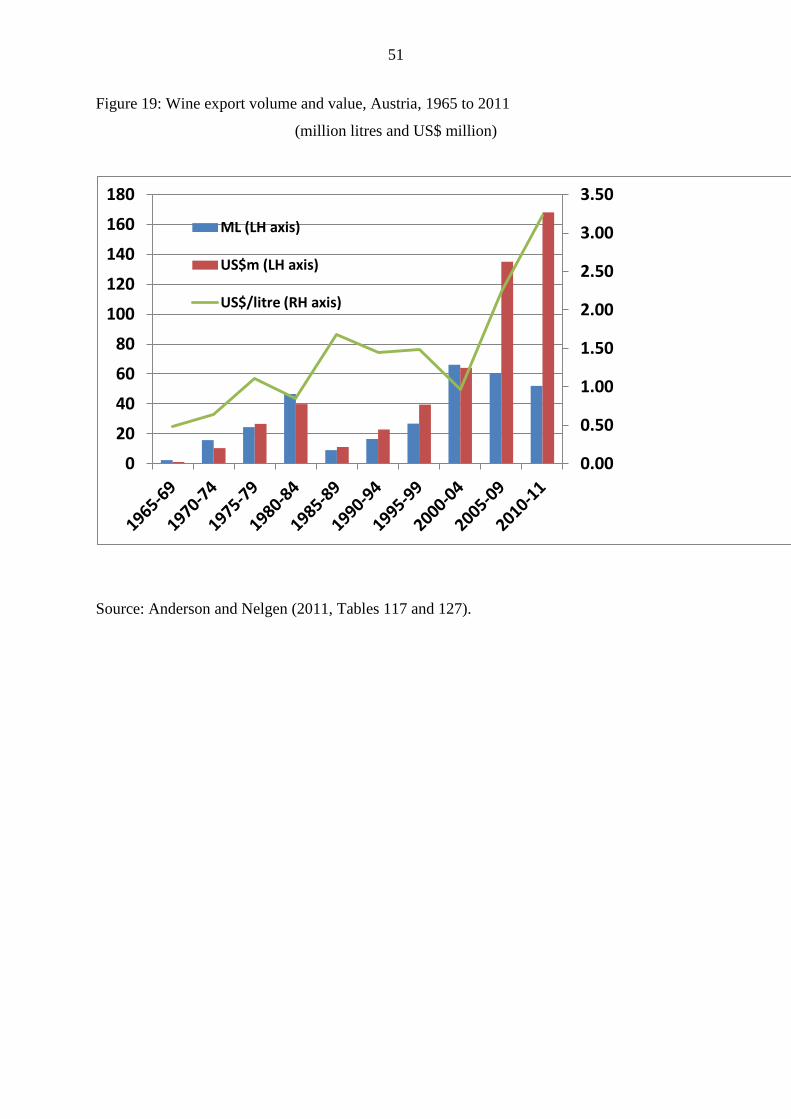
51
Figure 19: Wine export volume and value, Austria, 1965 to 2011
(million litres and US$ million)
Source: Anderson and Nelgen (2011, Tables 117 and 127).
0.00
0.50
1.00
1.50
2.00
2.50
3.00
3.50
0
20
40
60
80
100
120
140
160
180
ML (LH axis)
US$m (LH axis)
US$/litre (RH axis)

Table 1: Selected economic indicators for Georgia and its neighbors
Ease of
doing
business
(world
rank,
max. is
182),
2011
National
income
per
capita
(US$PPP)
2010
Share
of
pop’n
below
$2/day,
%
2008
Gini
coeff-
icient,
%,
2008
% of
national
income
by
lowest
20%,
2008
% of
national
income
by
highest
10%,
2008
Total
popul-
ation,
million,
2010
% of
popul-
ation
in
rural
areas,
2010
Agric-
ultural
land,
‘000
sq
kms.,
2010
Hectares
of
arable
land per
100
people,
2003-05
Agric-
ulture’s
share
of
exports,
%,
2009
Agric-
ulture’s
share of
employ-
ment,
%,
2008
Agric-
ulture’s
share
of
GDP,
%,
2009
Georgia 16 4960 32 41 5 31 4.4 47 25 18 28 53 9
Armenia 55 5450 12 34 9 25 3.1 36 17 16 19 44 20
Azerbaijan 66 9050 8 37 8 27 9.2 48 48 22 3 38 8
Iran 144 11400 na 38 9 na 74.0 31 182 24 5 21 10
Kazakhstan 47 10610 2 34 9 25 16.0 42 227 149 4 29 5
Moldova 81 3340 13 33 7 30 3.6 59 25 47 48 31 10
Russia 120 19190 0 40 6 34 143.0 27 1229 85 7 9 5
Turkey 71 15180 na 44 na na 72.6 30 266 33 11 23 9
Turkmenistan na 7350 na 41 na na 5.0 51 24 47 na na 12
Ukraine 152 6560 0 28 9 23 45.4 32 334 68 25 16 8
Sources: World Bank (2011a, b).

2
Table 2: Beverage and other merchandise export values,a Georgia, 2000 to 2010
(current US$ million and percent)
2000 2001 2002 2003 2004 2005 2006 2007 2008 2009 2010
Wine + vermouth (2204+2205) 29 32 33 43 49 82 42 31 40 34 42
Distilled alcohol (2207+2208) 4 6 6 14 19 29 30 58 59 54 55
Bottled Water (2202) 4 4 3 12 14 20 23 29 8 11 13
Sub-total, beverages (2201-09) 37 42 42 69 82 131 95 118 107 99 110
Hazelnuts, etc. (0802) 19 10 7 13 18 70 57 65 32 70 64
Tangerine, etc. (0805) 2 2 2 2 3 6 3 5 4 16 12
Total, all agriculture, food,
beverages & tobacco (01-24)
93
84
105
165
202
304
235
299
250
316
314
Beverages as % of all
merchandise exports
11 13 12 15 13 15 10 10 7 9 7
All agricultural goods as % of
all merchandise exports
28 26 29 36 31 35 25 24 17 28 20
a Harmonized System (HS) Codes are shown in parentheses.
Source: NSO (2011c).

Table 3: Index of revealed comparative advantage in wine,a Georgia and 12 other top
countries, 2000 to 2009
2000-05 2006-09
Moldova 96.1 45.9
Georgia 40.4 15.2
New Zealand 4.5 10.3
Chile 13.1 9.9
Macedonia 9.6 9.3
France 7.0 8.0
Portugal 8.2 7.8
Australia 8.5 7.0
Italy 4.4 5.0
South Africa 4.5 4.8
Argentina 2.7 4.6
Spain 4.4 4.4
Bulgaria 4.5 2.7
a Share of wine in value of national merchandise exports divided by share of wine in global
merchandise exports.
Source: Anderson and Nelgen (2011, Table 75).

2
Table 4: Volume, value and unit value of wine imports, and shares by quality,a selected
countries, 2009
(a) Volume, value and unit value of wine imports
Volume (ML) Value (US$m) Unit Value (US/litre)
China 173 457 2.65
Germany 1411 2770 1.96
Ukraine 17 47 2.77
United Kingdom 1277 4258 3.33
United States 927 4190 4.52
(b) Share of volume, and value, of imports by qualitya (percent)
Non-
premium
Commercial
premium
Super
premium
Sparkling All wines
China
--volumes 46 50 3 1 100 --values 14 75 8 3 100
Germany
--volumes 52 41 2 5 100 --values 18 59 6 17 100
Ukraine
--volumes 27 67 1 5 100 --values 7 79 3 11 100
United Kingdom
--volumes 24 67 4 5 100
--values 8 69 7 16 100 United States
--volumes 25 62 8 5 100
--values 5 65 18 12 100 WORLD
--volumes 37 50 7 6 100 --values 11 58 16 15 100
a The boundaries between the three still wine categories are US$2.50 and $7.50 per litre pre-
tax at the border. The global average import unit values per litre thus escalate across that
range, from around US$0.90 for non-premium to $3.60 for commercial premium and $7.25
for super-premium (and $8.20 for sparkling wine, or $4.50 if French Champagne is
excluded).
Source: Anderson and Nelgen (2011, Section VI).
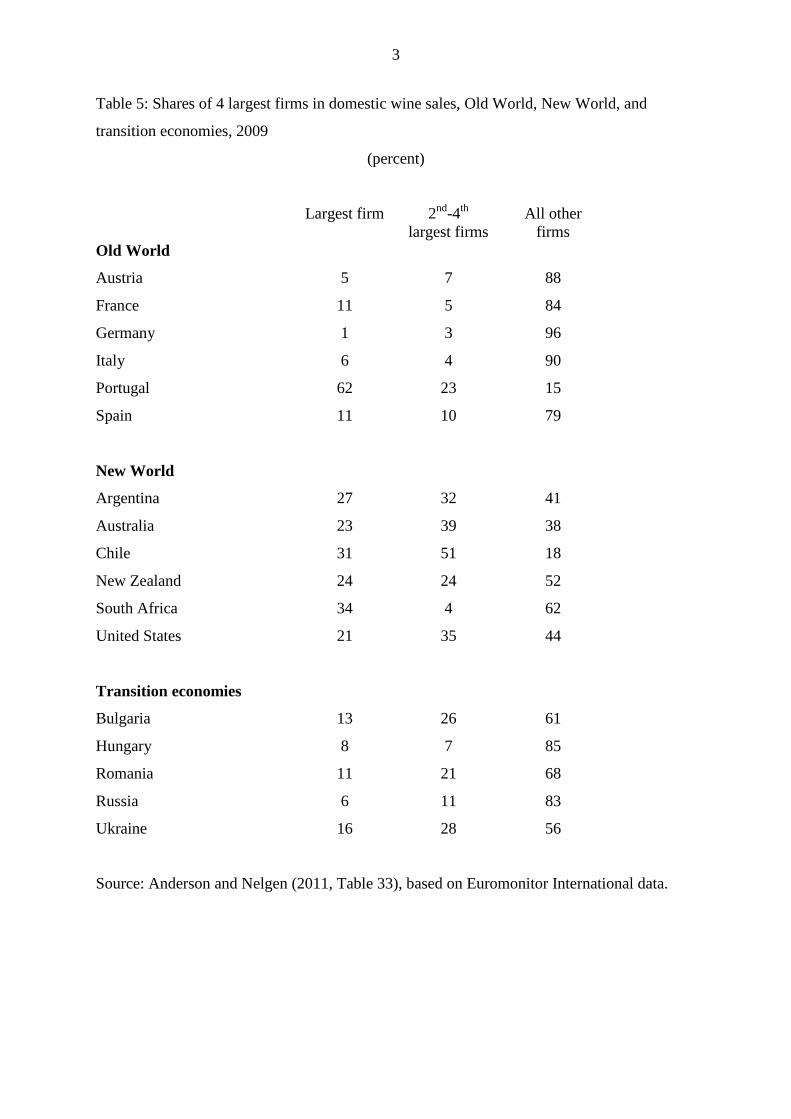
3
Table 5: Shares of 4 largest firms in domestic wine sales, Old World, New World, and
transition economies, 2009
(percent)
Largest firm 2nd
-4th
largest firms
All other
firms
Old World
Austria 5 7 88
France 11 5 84
Germany 1 3 96
Italy 6 4 90
Portugal 62 23 15
Spain 11 10 79
New World
Argentina 27 32 41
Australia 23 39 38
Chile 31 51 18
New Zealand 24 24 52
South Africa 34 4 62
United States 21 35 44
Transition economies
Bulgaria 13 26 61
Hungary 8 7 85
Romania 11 21 68
Russia 6 11 83
Ukraine 16 28 56
Source: Anderson and Nelgen (2011, Table 33), based on Euromonitor International data.