winery energy management project: cape mentelle audit mentelle report.pdf · barrel storage air...
TRANSCRIPT

Cape Mentelle Winery energy audit: Funded by GWRDC: Managed by WIAWA: Developed by Perth Region NRM
Page 1
Table of Contents
Winery Energy Management Project:
Cape Mentelle Audit May 2010.

Cape Mentelle Winery energy audit: Funded by GWRDC: Managed by WIAWA: Developed by Perth Region NRM
Page 2
Table of Contents
Introduction.................................................................................................................3
1.0 Site Description……………………………………………………………………………………….…..…..….3
2.0 Methodology ……………………………………………………………………………………………..……....4
2.1 Review of billing data…………………………………………………………………..............5
2.2 Data collection / equipment audit…………………………………………….…............5
2.3 Staff interview…………………………………………………………………………….…......….5
2.4 Data analysis……………………………………………………………………………….……….….5
3.0 Results and discussion............................................................................................6
3.1 Energy use by location…………………………………………………………….………..…....6
3.1.1 Refrigeration………………………………………………………………..………….....7
3.1.2 Plant room…………………………………………………………………….…......……7
3.1.3 Cellars……………………………………………………………………….…….…....…...7
3.1.4 Barrel storage……………………………………………………………….…….........8
3.1.5 Product transfer…………………………………………………………….…....….….8
3.2 Energy use by process................................................................................8
3.2.1 The fermentation process………………………………………….…...…...….…8
3.2.2 Hot water generation………………………………………………..………..........9
3.2.3 Seasonal variations ………………………………………………….….……….…...9
3.2.4 Vineyard water use……………………………………………….…………...........10
3.3 Consumption and green house gas emissions……………….……………..…..…….11
3.4 Peak / Off peak energy use…………………………………………………….....…..........12
3.5 Benchmarking energy use…………………………………………………….….……..........12
4.0 Energy saving opportunities…………………………………………………………….…………….……12
4.1 Practice change………………………………………………………………………….…….......12
4.2 Refrigeration………………………………………………………………………………...….……12
4.2.1 Refrigeration plant…………………………………………………………...…….……13
4.2.2 Refrigeration system………………………………………………………..…….......13
4.3 Hot water supply………………………………………………………………………..............14
4.4 Nitrogen generator and irrigation system…………………………..………….………15
4.5 Lighting………………………………………………………………………………..………...……..15
4.6 Compressed air supply ……………………………………………………………….….........16
5.0 Conclusion………………………………………………………………………………………………..……....16

Cape Mentelle Winery energy audit: Funded by GWRDC: Managed by WIAWA: Developed by Perth Region NRM
Page 3
Introduction
This energy audit is funded by the Grape Wine Research Development Corporations (GWRDC) Regional’s program.
The Regional’s WA program is managed by the Wine Industry Association of WA (WIAWA) and includes the winery
energy management project which aims to help producers reduce the energy component of their production
costs.
Cape Mentelle Vineyards (CMV) are one of three wineries that are receiving level 2 energy audits. These audits are
aimed at developing the knowledge and understanding of how much and where energy is used in a typical winery.
The aim of this is to develop case studies that can be used by other wine producers of different sizes and assist
them in reduce their energy use.
Cape Mentelle Vineyards (CMV) are based in Margaret River and process approximately 1300 tonnes of fruit to
produce over 120,000 cases a premium wine each year for domestic and export markets.
Since 1970 when they released their first wines CMV have been widely recognised as a producer of premium wines
and as an industry leader. This position has been reinforced recently when CMV become the first producer in WA
to gain both the EntWine winery environmental certification and EntWine viticulture environmental certification
codes. Energy management is one of the platforms within the EntWine winery code and for certification the
producer is also required to complete the wine industry greenhouse gas calculator (or NGERS).
The CMV site where this audit was conducted is where all the winemaking processes from harvesting to bottling
are carried out as well as where the vineyards are managed from, finished wine is warehoused and the cellar door
is located.
1.0 Site Description
Cape Mentelle Winery energy audit: Funded by GWRDC: Managed by WIAWA: Developed by Perth Region NRM
Page 4
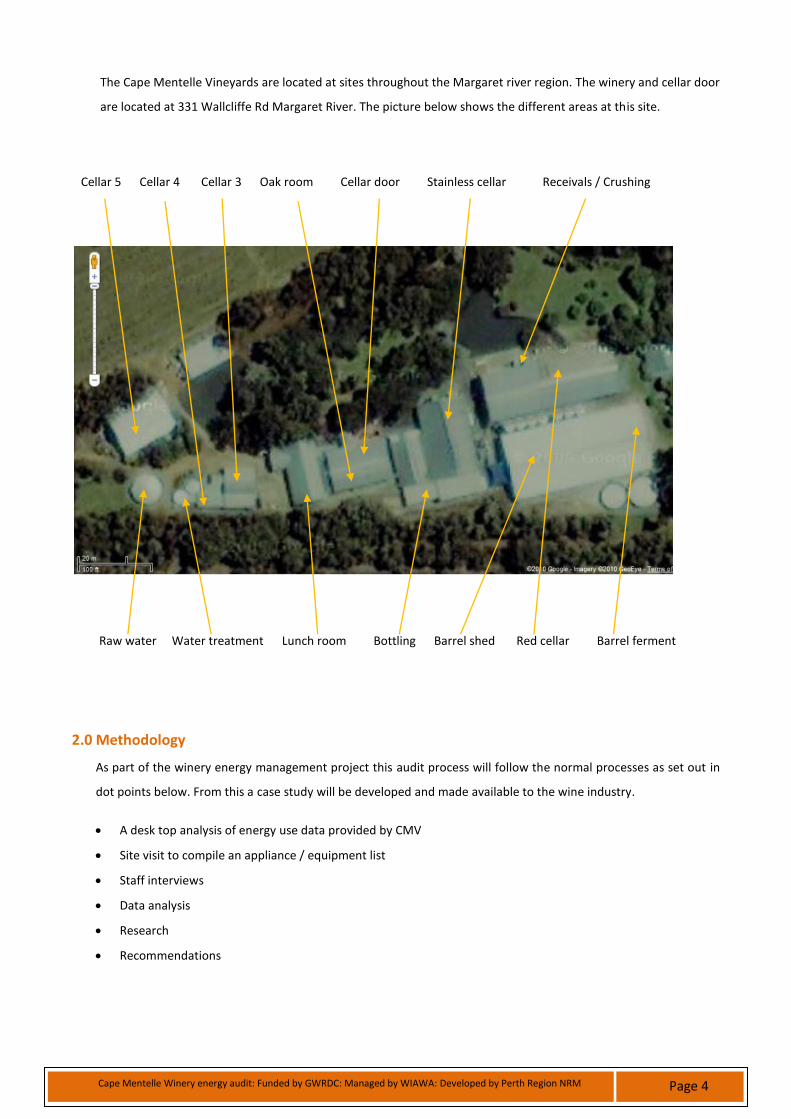
The Cape Mentelle Vineyards are located at sites throughout the Margaret river region. The winery and cellar door
are located at 331 Wallcliffe Rd Margaret River. The picture below shows the different areas at this site.
Cellar 5 Cellar 4 Cellar 3 Oak room Cellar door Stainless cellar Receivals / Crushing
Raw water Water treatment Lunch room Bottling Barrel shed Red cellar Barrel ferment
2.0 Methodology
As part of the winery energy management project this audit process will follow the normal processes as set out in
dot points below. From this a case study will be developed and made available to the wine industry.
A desk top analysis of energy use data provided by CMV
Site visit to compile an appliance / equipment list
Staff interviews
Data analysis
Research
Recommendations

Cape Mentelle Winery energy audit: Funded by GWRDC: Managed by WIAWA: Developed by Perth Region NRM
Page 5
2.1 Review of Billing Information
Prior to the site visit a review of the previous 12 months of energy billing data was analysed to determine energy
usage patterns. This data included Vintage 2009 which was considered as a fairly normal vintage, though it should
be noted that there is always variation between vintages in regard to tonnes of fruit processed and temperature
patterns which will also impact on energy use.
2.2 Data Collection / Equipment Audit
A list of energy consuming equipment and appliances and their nominal power rating was compiled during an on-
site audit. Winemaking and maintenance staff were also interviewed to ascertain the pattern and frequency of use
for this equipment. This information was used to estimate the proportion of energy used by this equipment and for
each of the production processes and work areas. This list is separate to this audit report and will be supplied to
CMV in XL format for future use.
2.3 Staff Interviews
Staff interviews (on-site, phone & email) have been conducted to develop a good understanding of CMV specific
wine making practices and the production processes involved in these.
2.4 Data Analysis
The use of the Synergy data combined with the equipment audit and staff interviews provided a good
understanding of how much energy is consumed in each of the production areas / processes. Graphs were created
to yield the following information:
Electricity and LPG use
Greenhouse gas emissions
Peak / Off peak energy use and cost analysis
Energy use by CMV site locations

Cape Mentelle Winery energy audit: Funded by GWRDC: Managed by WIAWA: Developed by Perth Region NRM
Page 6
3.0 Results and discussion
Although energy efficiency opportunities may be made across the board, more effort should be directed to where
the most energy is used. Identified opportunities have been developed through analysis of the audit data and the
production processes. As energy is also linked to water and waste management these should also be incorporated
in the same continuous improvement program.
3.1 Energy use by location
A total of 650,000 kWh were used throughout the 12 month energy audit / review period. Chart 1 provides details
on where energy is used throughout the CMV site based on the audit of equipment at CMV and staff interviews.
Chart 1
3.1.1 Refrigeration: 58%
CMV has a typical air cooled brine refrigeration system designed to chill the brine (water and 24% ethanol) down to
minus 7°C. The chilled brine is circulated throughout the winery through a network of brine lines. The heat transfer
process occurs when the brine is allowed to pass through a tanks brine jacket or when both the product and the
brine pass through a separate heat exchanger. After this the now warmed brine returns to the brine tank for more
refrigeration. Some of this refrigeration energy is also used to provide air space cooling in the barrel shed.
1%
4%
1%
58%
15%
1%
2%1%
13%
1%
0.6%
3%
Breakdown of where energy is used at CMV
CELLAR DOOR : 1.4%
BAREL STORAGE: 3.6%
PRODUCT TRANSFER: 1.2%
REFRIGERATION / CHILLER: 57.6%
PLANT / EQUIP: 14.7%
EXTERIOR: 0.8%
AMENITIES: 1.8%
CRUSHING: 1.2%
CELLARS: 12.6%
OFFICE / ADMIN: 1.3%
LABORATORY: 0.6%
BOTTLING: 3.1%
Note: LPG usage for generating hot water not included
Cape Mentelle Winery energy audit: Funded by GWRDC: Managed by WIAWA: Developed by Perth Region NRM
Page 7
3.1.2 Plant Room: 15%
The following plant equipment items have been combined to represent plant room energy use:
Air compressors: 56% of plant room machinery.
The predominant use of compressed air at CMV is to provide air to the three rotary presses during vintage,
with the supply requirement being high volume low pressure. At peak times there are two 37kW
compressors in operation to meet demand.
Nitrogen compressor: 36% of plant room machinery.
Nitrogen gas is injected under low pressure into the tanks head space to protect the wine from exposure to
atmospheric oxygen. Nitrogen is also used for a similar purpose during the bottling process.
CO2 bulk storage: 4% of plant room machinery.
The compressor on this bulk storage cylinder is used to keep the CO2 chilled under pressure as liquid. CO2 is
then decanted from the bulk storage cylinder in the dry ice format. Dry ice is used in the tanks head space
when transferring wine to prevent exposure to atmospheric oxygen as it’s heavier than air. It’s worth noting
that 1 kg of dry ice converts to 540 litres of gas.
External cool room / sea container: 4% of plant room machinery.
This has been used to store vine cuttings and for short term fruit storage during vintage.
3.1.3 Cellars: 12.6%
Cellars (stainless cellar, red cellar and cellars 3 to 5) energy use includes:
Heating Ventilation Air Conditioning (HVAC) - 60%.
Lighting -30%
Equipment (other than pumps) - 9%
3.1.4 Barrel storage: 3.6%
Barrel storage air space cooling comes from a fan coil unit using chilled brine from the main refrigeration system.
Energy use for this has been included in the refrigeration calculations. In this barrel shed there is a separate barrel
ferment section that also uses a fan coil unit combined with hot water for air space warming. The two main energy
items in the barrel shed are:
Lighting - 60%
Electric forklift charger - 30%
3.1.5 Product transfer: 1.2%
Energy use from transfer pumps totals approximately 7800kWh per annum. This has been based on 13 ML juice /
wine transferred; Average pump size of 4kW; Average transfer rate of 7kL /h + cleaning time.
3.2 Energy use by processes
3.2.1 Fermentation process
The largest portion of CMV energy use occurs as a result of the winemaking processes during the vintage period. In
particular, it is the fermentation process where juice is converted into wine that uses the refrigeration energy in
the cooling phases and hot water in the warming phases of this process. The flow chart over-page follows the
heating / cooling processes involved in converting 100 tonnes of fruit into finished wine.

Cape Mentelle Winery energy audit: Funded by GWRDC: Managed by WIAWA: Developed by Perth Region NRM
Page 8
Linking white wine fruit processing with temperature management at CMV in Margaret River
Cape Mentelle process 600 tonne (450,000 L/t) of whites each vintage (February – May)
≈ 3,500 (5%) litres of juice removed to yeast inoculation tank which is
then warmed to 19°C with ≈ 80°C warming water to promote growth of
introduced yeast. Some chilling required to limit heat generation from
yeast activity (juice kept below 22°C)
The initial juice tanks may in this time have warmed up to ≈8°C and are
now artificially warmed to 16°C, before the yeast inoculated wine is
reintroduced back into these tanks.
100 tonne of fruit chilled from ambient temp (night time 15°C) down to
3°C. After de-stemming & pressing left with ≈ 60,000 L/t of free run and
≈ 15,000 L/t of pressings juice (total 75,000 L/t)
degrees
Cold stabilising or chilling to -2°C is required to remove tartrates and
possibility of secondary ferment
≈ 79,000 L/t of white wine is stored for 9 months in 350 oak barrels.
Barrel shed cooled to 15°C by central brine / refrigeration system.
Wine in stainless storage tanks also held at 15°C
stainless tanks also held at 15°C
After ≈24 hours cooling is applied to control fermentation. Process takes
7 – 8 days with brine jacket cooling on ≈ 50% of the time
Wine is warmed to 18°C for bottling ……….which often occurs within
weeks of cold stabilising
Free run juice chilled and held in a tank for 7 days at 5°C. Pressings held at 0°C for 7 days (settling of solids in the juice)
20% of ferments are chilled to 0°C to artificially stop ferment and retain
residual sugars

Cape Mentelle Winery energy audit: Funded by GWRDC: Managed by WIAWA: Developed by Perth Region NRM
Page 9
3.2.3 Hot Water: 26.5 tonnes LPG
Calculations are based on 26. 5 tonnes of LPG purchased with 90% of this used for generating hot water.
23.8 tonnes of LPG (90%) is equal to 47,000 litres of gas (1 tonne: 1975 ltr). 47,000 litres of gas converts to
313,000 kWh of energy. This has not been included with the appliance / equipment list as different greenhouse
gas accounting formula apply for LPG.
Hot water is required for cleaning barrels, tanks and for the warming of juice in the fermentation process.
3.2.3 Seasonal variations to energy use
Table 1 highlights the
increases in both peak and off
peak energy use for the
vintage months, when vintage
energy use peaks at 116,000
kWh in March. The hottest
months as seen in table 2 start
in December and coincide with
the commencement of
irrigation scheduling in the
vineyards and finish just prior
to the end of vintage.
Air conditioner energy usage in
this time frame is mainly in the
cellars. The mean min / max
temperature chart for this
region (table 2) highlights the
fact that air conditioning for
cooling is not required for
most of the year. Temperature
controlled ventilation fans
would be appropriate to take
advantage of night time
cooling potential.
-
20,000
40,000
60,000
80,000
100,000
120,000
140,000
Jul Aug Sep Oct Nov Dec Jan Feb Mar Apr May Jun
PEAK KWH OFF PEAK KWH TOTAL KWH
0
5
10
15
20
25
30
Jul Aug Sep Oct Nov Dec Jan Feb Mar Apr May Jun
MAX MEAN TEMP MIN MEAN TEMP
Table 1
Table 2

Cape Mentelle Winery energy audit: Funded by GWRDC: Managed by WIAWA: Developed by Perth Region NRM
Page 10
3.2.4 Vineyard water / energy use
CMV have 200 ha of vineyards and irrigate at a rate of 0.6 – 0.9 ML per ha, with some double handling of water
(bore to storage then storage to vineyard). Energy use for vineyard irrigation has not been included in the scope of
this audit but it is worth noting that it has a noticeable impact on total energy use. Chart 1 is a representation of
Synergy billing data and highlights the fact that 19% of CMVs total energy use is at these vineyard locations.
Energy use for lawns irrigation at the CMV audit site is included in the C722 (81%) figure and will contribute to the
pre vintage (December – January) spike in energy use at CMV.
Chart 1
3.3 Energy consumption and green house gas emissions at CMV
Chart 2 Chart 3
3%
81%
1%
2% 1%4%
6%
1% 1% TOTAL KWH
257 NOAKES RD
UA 10530 BUSSELL HWY
C722 WALLCLIFFE RD
UA 10437 BUSSELL HWY
C2787 NOAKES RD
C2807 SHERVINGTON AVE
C2787 NOAKES RD
C721 ROXBURGH RD
C2184 BUSSELL HWY
C721 WALLCLIFFE RD
67%
33%
Total energy use (LPG converted to kWh)
Electricity: 650,000 kWh
LPG: 26 tonne = 313,000 kWh
88%
12%
Greenhouse gas emissions
Electricity: 546 tonne CO2-e
LPG: 76 tonne CO2-e

Cape Mentelle Winery energy audit: Funded by GWRDC: Managed by WIAWA: Developed by Perth Region NRM
Page 11
3.4 Peak / Off Peak energy use and Synergy tariffs
Chart 5 shows the breakdown costs associated with peak / off peak energy use for the next 12 months (based on
1/7/10 - R3 tariff and existing energy usage patens). This highlights the need to switch energy use to off peak
where possible and as mentioned in 3.3.4 does not include vineyard irrigation energy use.
Chart 4 Chart 5
Table 3: Synergy R3 tariff and charges- Time–of-use periods: (from Synergy web site)
Period Day Time
Peak Mon-Fri 8:00am-10:00pm
Off-peak Mon-Fri After 10:00pm and before 8:00am: All weekend
Synergy R3 tariff charges (GST inclusive)
Tariff Charges July 2008 Current From 1 July 2010
R3
Supply charge - $ per day 1.62 1.79
Electricity charge - cents per unit for:
Peak rate charge 19. 28.46 31.31
Off-peak rate charge 6.1 8.76 9.64
65%
35%
Comparison of peak / off peak energy use
Peak tariff
Off peak tariff
79%
21%
Cost of electricity at CMV - $139,940.
Elecitricity costs peak tariff
Elecitricity costs OFF peak tariff

Cape Mentelle Winery energy audit: Funded by GWRDC: Managed by WIAWA: Developed by Perth Region NRM
Page 12
3.5 Benchmarking energy use
This is useful when comparing your winery with wineries of similar size, production methods, product quality,
climatic conditions etc. More importantly its value is in benchmarking for continual improvement. Medium sized
premium producers tend to be the most inefficient in regard to energy use as they don’t have economies of scale
that larger producers have and usually don’t have the business owner/s on site providing more direct
accountability that the smaller producers have.
The preferred wine industry benchmark for quantifying energy use is kWh per litre of wine produced.
CMV use 1.06 kWh/L (LPG & Electricity combined).
Though limited, existing benchmarks suggests that similar producers to CMV range between 0.75 and 2.0 kWh/L.
4.0 Energy saving options
Energy saving options range from low cost in house strategies to the higher cost options that require longer term
financial planning, logistical planning and specialist technical advice. CMV have good staff engagement practices in
place which can be fine tuned for improving energy management by:
Discussing the drivers for reducing energy use with staff such as: EntWine; marketing; environmental; financial
etc and how this impacts on all staff.
Engaging staff and developing energy management ideas and strategies.
Setting achievable targets.
Implementing practice change strategies and.
Ensuring that the process for continuous improvement is sustainable.
4.1 Practice Change
The importance of practice change cannot be underestimated as a low or no cost solution for achieving significant
reductions in energy use, unfortunately it can also be one of the hardest things to achieve and maintain. The
benefits of achieving real practice change are realized when staff / management are actively participating in energy
reduction practices and find the solutions for continuous improvement in energy management. Practice change is
more sustainable when starting with the more achievable changes such as turning of appliances when not in use,
setting appropriate equipment to energy save mode or reprogramming or installing timers to reduce hours of use.
Another benefit is that these practices changes are often repeated by staff within their own homes
4.2 Refrigeration
Refrigeration at CMV uses approximately 360,000 kWh a year which works out to over half of the wineries energy
use. With the new tariff this will cost of over $74,000 for the next 12 months (without further tariff increases and
assuming same peak / off peak usage). Setting an initial though achievable energy reduction target of 25% for this
system will save over $18,000. This figure is an approximation only and more accurate data will come with the
installation of a sub-meter.
For this audit report refrigeration has been separated into refrigeration plant and refrigeration system.

Cape Mentelle Winery energy audit: Funded by GWRDC: Managed by WIAWA: Developed by Perth Region NRM
Page 13
4.2.1 Refrigeration Plant
This air cooled Carrier system was installed at CMV in 1998 and requires the support of an older Luke Chiller during
vintage to meet demand. Identified issues with this unit include:
Not performing to task requirements.
Does not have the control systems in place to achieve
optimum efficiencies.
High cost of maintenance.
In need of major expenditure for repairs (see condenser
damage in figure 2). The efficiency of the system is
measured by the co-efficient of performance (COP). This
is measured in kilowatts and is the ratio of cooling output
compared with energy input - the higher the COP, the
more efficient the system. The ability of this unit to
achieve a good COP is limited unless these repairs are
achieved.
Though it has good air movement to and from the unit, it
would also benefit from shading to reduce heat load on
this unit
Backup system is even older and also in need of
maintenance
There is already justifiable planning in place to replace this
unit. This process should involve working with the local
refrigeration engineers who would be responsible for the
servicing and maintenance of the new unit and where
applicable incorporate recommendations from the GWRDC
funded refrigeration efficiencies project. Investigating the
potential for preheating water should be included in this
process.
Sub-metering would be an important energy management
tool for this unit or if this unit was replaced.
4.2.2 Refrigeration System
Issues with the refrigeration system include:
One brine tank: It has been assumed that there is no
partition in this tank to separate chilled brine from the
warmed return brine. A second tank allows warmed brine to return to one tank from where it can be more
efficiently chilled, before returning to the chilled brine tank for winery use.
Figure 1: Refrigeration plant
Figure 2: Damaged and blocked condenser
Figure 3: Brine tank
Cape Mentelle Winery energy audit: Funded by GWRDC: Managed by WIAWA: Developed by Perth Region NRM
Page 14
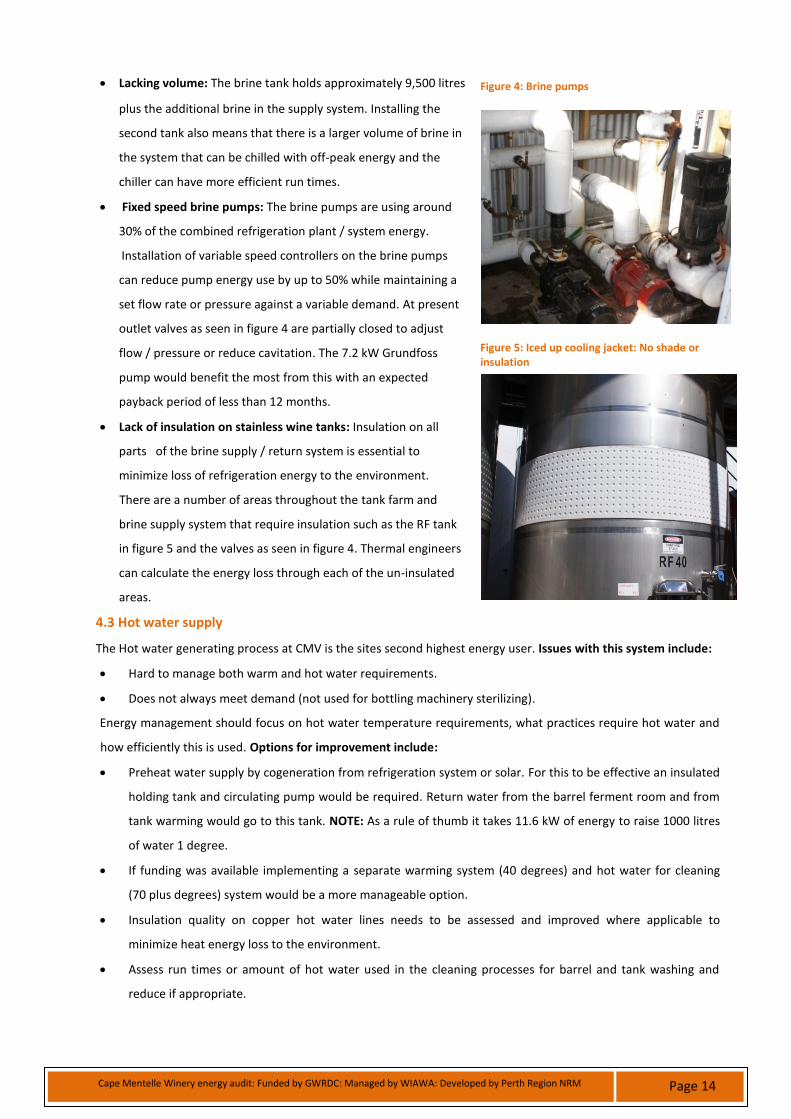
Lacking volume: The brine tank holds approximately 9,500 litres
plus the additional brine in the supply system. Installing the
second tank also means that there is a larger volume of brine in
the system that can be chilled with off-peak energy and the
chiller can have more efficient run times.
Fixed speed brine pumps: The brine pumps are using around
30% of the combined refrigeration plant / system energy.
Installation of variable speed controllers on the brine pumps
can reduce pump energy use by up to 50% while maintaining a
set flow rate or pressure against a variable demand. At present
outlet valves as seen in figure 4 are partially closed to adjust
flow / pressure or reduce cavitation. The 7.2 kW Grundfoss
pump would benefit the most from this with an expected
payback period of less than 12 months.
Lack of insulation on stainless wine tanks: Insulation on all
parts of the brine supply / return system is essential to
minimize loss of refrigeration energy to the environment.
There are a number of areas throughout the tank farm and
brine supply system that require insulation such as the RF tank
in figure 5 and the valves as seen in figure 4. Thermal engineers
can calculate the energy loss through each of the un-insulated
areas.
4.3 Hot water supply
The Hot water generating process at CMV is the sites second highest energy user. Issues with this system include:
Hard to manage both warm and hot water requirements.
Does not always meet demand (not used for bottling machinery sterilizing).
Energy management should focus on hot water temperature requirements, what practices require hot water and
how efficiently this is used. Options for improvement include:
Preheat water supply by cogeneration from refrigeration system or solar. For this to be effective an insulated
holding tank and circulating pump would be required. Return water from the barrel ferment room and from
tank warming would go to this tank. NOTE: As a rule of thumb it takes 11.6 kW of energy to raise 1000 litres
of water 1 degree.
If funding was available implementing a separate warming system (40 degrees) and hot water for cleaning
(70 plus degrees) system would be a more manageable option.
Insulation quality on copper hot water lines needs to be assessed and improved where applicable to
minimize heat energy loss to the environment.
Assess run times or amount of hot water used in the cleaning processes for barrel and tank washing and
reduce if appropriate.
Figure 4: Brine pumps
Figure 5: Iced up cooling jacket: No shade or insulation
Cape Mentelle Winery energy audit: Funded by GWRDC: Managed by WIAWA: Developed by Perth Region NRM
Page 15
4.4 Nitrogen generator and irrigation system
The main issue with this unit is that, though it has the capacity to do so it does not meet site demand
requirements. Nitrogen is a difficult gas to use for head space protection as it’s a light gas and there needs to be
some venting mechanism in the head space area to allow for contraction / expansion within the tank.
Options to reduce nitrogen loss include:
Check for leaks in the system and ensure lids are secure.
Ensure tanks are isolated when empty or when doing
additions from the top.
Check regulator pressure though as it’s a very low pressure
that’s required this may be hard to adjust. The tank vent
needs to vent at a higher pressure than the nitrogen
regulator to avoid continual flow through of nitrogen. This
also raises the question of how does nitrogen force out the
heavier oxygen in the head space air.
Argon gas. Argon is a heavy inert gas that can be dosed into
the head space and has proven to be more cost effective while providing better protection to the wine. Cost
of leasing nitrogen generator to be factored in.
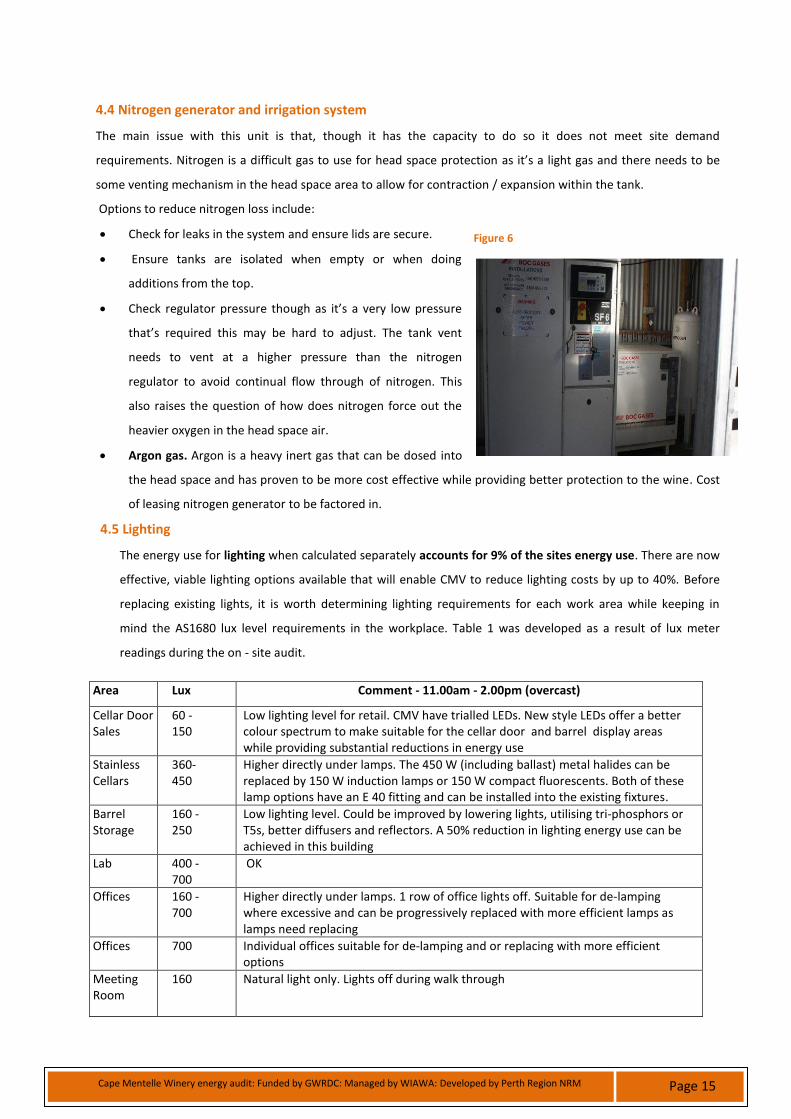
4.5 Lighting
The energy use for lighting when calculated separately accounts for 9% of the sites energy use. There are now
effective, viable lighting options available that will enable CMV to reduce lighting costs by up to 40%. Before
replacing existing lights, it is worth determining lighting requirements for each work area while keeping in
mind the AS1680 lux level requirements in the workplace. Table 1 was developed as a result of lux meter
readings during the on - site audit.
Area Lux Comment - 11.00am - 2.00pm (overcast)
Cellar Door Sales
60 - 150
Low lighting level for retail. CMV have trialled LEDs. New style LEDs offer a better colour spectrum to make suitable for the cellar door and barrel display areas while providing substantial reductions in energy use
Stainless Cellars
360-450
Higher directly under lamps. The 450 W (including ballast) metal halides can be replaced by 150 W induction lamps or 150 W compact fluorescents. Both of these lamp options have an E 40 fitting and can be installed into the existing fixtures.
Barrel Storage
160 -250
Low lighting level. Could be improved by lowering lights, utilising tri-phosphors or T5s, better diffusers and reflectors. A 50% reduction in lighting energy use can be achieved in this building
Lab 400 - 700
OK
Offices 160 - 700
Higher directly under lamps. 1 row of office lights off. Suitable for de-lamping where excessive and can be progressively replaced with more efficient lamps as lamps need replacing
Offices 700 Individual offices suitable for de-lamping and or replacing with more efficient options
Meeting Room
160 Natural light only. Lights off during walk through
Figure 6

Cape Mentelle Winery energy audit: Funded by GWRDC: Managed by WIAWA: Developed by Perth Region NRM
Page 16
4.6 Compressed air supply
The two 37kW air compressors meet supply demand. One unit should be enough to meet supply demand though
this would involve installing a large air receiver in or near the press area. The rapid on / off cycling of the
compressors that was apparent during site visit will be minimised with the installation of a second air receiver.
This action will reduce start up energy use, improve run time efficiencies and improve the compressors life cycle.
Other energy saving measures include:
Reduce set point pressure (was at 710kpa during site visit) as a rule of thumb……..a 14 kPa reduction in
pressure results in a 1% reduction in energy use. As presses require high volume low pressure the installation
of a large air receiver near the presses means that the pressure set point can be reduced with energy saving of
up to 20%.
Turning off on weekends or when not required. May be viable to replace one 37kW unit with a small non –
vintage compressor.
Check for leaks at a time when the workplace is quite.
Take note of supply system pressure at the end of the day and first thing in the morning on a regular basis to
determine compressed air loss rates. Air leaks often account for 20 - 30% of compressed air energy use.
5.0 Conclusion
This report has identified a number of energy saving opportunities at CMV and provides the foundations for
ongoing energy management at this site.
In all areas, energy efficiency improvements can be achieved at no or low cost. Behavior changes such as better
work scheduling and turning off equipment that is not in use can be embedded in staff training and induction.
These can be put into action as soon as possible for early results.
Lower cost actions such as equipment or system repairs can be implemented as part of the general maintenance
program. It is a case of scheduling and prioritizing these actions to ensure cost effective outcomes.
Longer- term actions require careful planning which needs to keep potential energy savings in context with
financial outlay and the life cycle costs of alternative options. When replacing plant or equipment it is important
to minimise the demand on the system first. For example if replacing the refrigeration plant it would be logical to
minimise demand or energy loss by improving the refrigeration system first. This can also lead to financial savings
on plant / equipment purchase costs as a smaller replacement may then be more appropriate.
Sub-metering of major energy using items, benchmarking energy use and setting achievable energy reduction
targets are important aspects to a sustainable, continuous improvement program.