wines and wineries of california's central coast - …small northern california towns, such as...
TRANSCRIPT

1 1
OVERVIEWFrom Indigenous
Stewardship to Mi l lennial Cr is is
Asmus08_Part I.indd 1 12/18/08 11:12:42 AM
Copyrighted Material

O V E R V I E W2
OVER 400 MILLION years ago, tectonic plates that shaped the earth’s crust started to rock and roll in California. In some areas, earthquakes caused a dramatic reshuffl ing in land formations, carving mountains, valleys, rivers, and lakes. Shifting rock and sands left their marks on a landscape we can now only imagine, but whose history is captured in the geological record. Various organic materials, including early forms of life, would get trapped. Volcanoes erupted and then sat still, only to explode again when there was no other way to release the pressure.
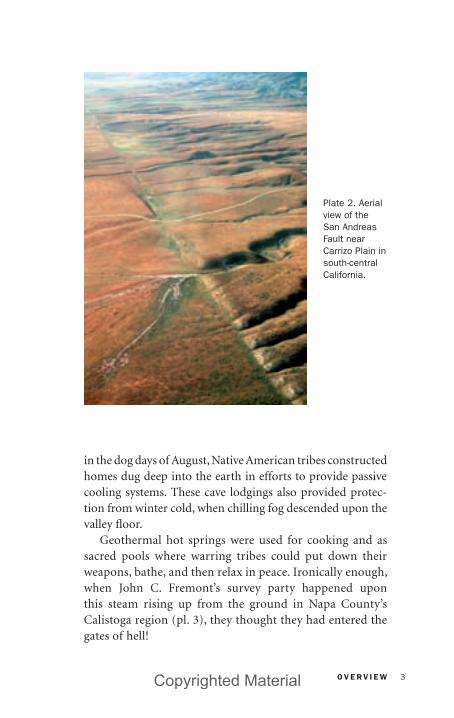
The San Andreas Fault (pl. 2), which creates the earth-quakes that still keep some people from settling in California, is only 30 million years old, and it runs nearby my Marin County home. This earthquake fault, whose most visible mark to an observer high up in an airplane is the slender Tomales Bay in the Point Reyes National Seashore, is respon-sible for the Coastal Range as well as the mighty Sierra Nevada approximately 200 miles to the east. There was no place to go but up as the North American Plate collided with the Pacifi c Plate, and the San Andreas Fault system was formed. This fundamental geological framework contin-ues to shape today’s search for energy by Californians, who would ultimately learn how to tap a bounty of diverse and abundant energy sources.
California’s indigenous peoples were relatively good energy stewards. They were, by and large, sedentary and could survive by relying upon local resources. Because of the kindness of the weather and the ridiculously fertile land, the state’s Native Americans could afford to be frugal when it came to energy. The moderate winters and long growing seasons limited their demand for energy too. Hunting and gathering activities were suffi cient to provide the food—also energy—for survival. There was suffi cient wood readily available for light, heat, and cooking. They tapped renewable resources when they dried salmon with the sun. In the Cen-tral Valley, where temperatures can soar to over 100 degrees F
Asmus08_Part I.indd 2 12/18/08 11:12:44 AM
Copyrighted Material
O V E R V I E W 3
in the dog days of August, Native American tribes constructed homes dug deep into the earth in efforts to provide passive cooling systems. These cave lodgings also provided protec-tion from winter cold, when chilling fog descended upon the valley fl oor.
Geothermal hot springs were used for cooking and as sacred pools where warring tribes could put down their weapons, bathe, and then relax in peace. Ironically enough, when John C. Fremont’s survey party happened upon this steam rising up from the ground in Napa County’s Calistoga region (pl. 3), they thought they had entered the gates of hell!
Plate 2. Aerial view of the San Andreas Fault near Carrizo Plain in south-central California.
Asmus08_Part I.indd 3 12/18/08 11:12:44 AM
Copyrighted Material

O V E R V I E W4
California Native American tribes, such as the Yokuts and Maidu, used petroleum not as a source of mechani-cal energy, but for ritual fi res and recreation. Other uses of these fossil fuels by tribes included paving, roofi ng, and waterproofi ng of dwellings, for which they used the very thick oil, now called “asphaultum,” found oozing from sur-face natural tar seeps. These oil-based materials held their canoes together too.
The Spanish who began to settle California in the 1760s, fi rst settling in San Diego and then Monterrey, introduced new energy technologies that slowly increased energy use patterns. It was Father Junipero Serra, a Franciscan mis-sionary, who helped pave the way for early immigrant set-tlements that reached as far north as the city of Sonoma. These missionaries employed Native Americans as man-ual laborers as they tried to convert them to Christianity. With the help of modern metal tools, wood fuel- gathering
Plate 3. Calistoga’s “Old Faithful” Geyser in Napa County.
Asmus08_Part I.indd 4 12/18/08 11:12:45 AM
Copyrighted Material

O V E R V I E W 5
operations expanded dramatically during this time. In the process, these early energy development efforts left their mark on California’s ecosystems. As was common in Europe, the Spanish introduced domestic horses and don-keys to the land, employing these animals in tasks rang-ing from simple transportation to cattle management and other agricultural chores. Manipulating streams, ponds, and lakes for crop irrigation also expanded energy capture and corresponding consumption.
California remained at the edge of civilization until the mid-nineteenth century, when Russian fur traders set-tled in Fort Ross on the Sonoma coast. John Sutter, hail-ing from Switzerland, founded “New Helvetia” in what is now Sacramento, one of California’s fi rst large human settlements, a haven for weary immigrants who survived the treacherous climb over the great Sierra Nevada. It was no accident that early settlers would declare this wonder-ful valley spot their home, as it sat at the confl uence of the American and Sacramento Rivers in the middle of an enor-mously fertile valley.
At this point in time, California’s total population was less than 100,000 people. Within 10 years, that number grew fourfold before surpassing the one-million-resident mark by 1890. To support these increases in population, California’s early residents would begin to investigate ways to tap fresh sources of energy to fuel agricultural enter-prises and other activities deemed necessary for human progress.
Gold Miners Shape Early Energy Development
Perhaps the largest impact on California’s growth in pop-ulation and early economic development was the discovery
Asmus08_Part I.indd 5 12/18/08 11:12:46 AM
Copyrighted Material

O V E R V I E W6
of gold in 1848—the same year that California joined the United States. It was the famed ’49ers, who descended upon the golden hills of California in search of instant riches, who shaped California’s first large-scale energy develop-ments. Ironically enough, the hydraulic knowledge and technologies employed to provide power for gold mining set the stage for widespread hydroelectric development.
The Sierra Nevada—an enormous mountain range com-posed of granite that straddles the eastern border of the state, running north and south for a distance of 360 miles—initially served as an obstacle to the state’s economic health. However, it would soon prove to also be the basis for wealth and, later, energy innovations. With mountain peaks exceed-ing 14,000 feet, numerous deep river canyons cut through from east to west. These rivers—the Yuba, American, Pit, and others—are relatively short in length. Still, the steep grades allowed for multiple sites for productive dams and powerhouses. The Feather River (pl. 4) is only 70 miles in length, for example, yet this river ended up hosting so many electricity generators that it has been referred to as a “Stair-way of Power.”
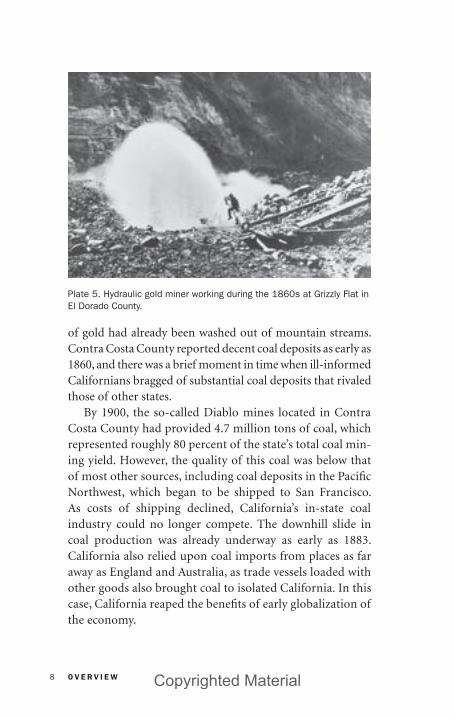
If you drive along Hwy. 49, which traverses the western side of the Sierra Nevada foothills, you are in the midst of the most notorious hydroelectric facilities in the world. Small northern California towns, such as Nevada City and Folsom, are sites of early breakthroughs when it comes to channeling the power of water for human use. Whereas the ’49ers imposed deep scars into the formerly pristine Sierra Nevada through giant hydraulic guns that literally scraped away entire hillsides (pl. 5), they also inadvertently left behind infrastructure that would serve as the under-pinnings of California’s early hydropower development. Indeed, some of the same ditches, fl umes, and dams once used to extract gold from the land were converted directly into hydroelectric power plants. As a result of knowledge
Asmus08_Part I.indd 6 12/18/08 11:12:46 AM
Copyrighted Material

O V E R V I E W 7
gained from the ’49ers, engineers soon transformed water cannons into nozzles used to direct high-pressure water onto waterwheels, which then generated electricity. Tech-niques used to drill and drive tunnels into the hard rock that composed much of the Sierra Nevada also played a key role in hydroelectric power.
Interestingly enough, early reports implied that California would have adequate coal supplies to fuel traditional forms of industry and other forms of economic development, including the extraction and processing of gold. There were actually a few signifi cant discoveries of coal within the state’s borders, many of them made by despondent former gold miners seeking other forms of wealth when the majority
Plate 4. A train follows the contour of the Feather River.
Asmus08_Part I.indd 7 12/18/08 11:12:46 AM
Copyrighted Material
O V E R V I E W8
of gold had already been washed out of mountain streams. Contra Costa County reported decent coal deposits as early as 1860, and there was a brief moment in time when ill-informed Californians bragged of substantial coal deposits that rivaled those of other states.
By 1900, the so-called Diablo mines located in Contra Costa County had provided 4.7 million tons of coal, which represented roughly 80 percent of the state’s total coal min-ing yield. However, the quality of this coal was below that of most other sources, including coal deposits in the Pacifi c Northwest, which began to be shipped to San Francisco. As costs of shipping declined, California’s in-state coal industry could no longer compete. The downhill slide in coal production was already underway as early as 1883. California also relied upon coal imports from places as far away as England and Australia, as trade vessels loaded with other goods also brought coal to isolated California. In this case, California reaped the benefi ts of early globalization of the economy.
Plate 5. Hydraulic gold miner working during the 1860s at Grizzly Flat in El Dorado County.
Asmus08_Part I.indd 8 12/18/08 11:12:47 AM
Copyrighted Material

O V E R V I E W 9
The last California coal mine was located in the Altamont Pass, just southeast of Oakland in Alameda and Contra Costa counties. Named after the great inventor Nikola Tesla, this mine (pl. 6) pioneered a coal briquet-ting process that relied upon the crushing of local coal deposits and then mixing this local lignite with superior coal imports brought in from San Francisco’s ports. The nation’s fi rst commercial coal briquetting plant was estab-lished at Tesla, but it was short-lived. By 1900, Californians used 35 percent less coal than the rest of the country and paid 40 percent more for it.
In the absence of a robust, regional supply of quality coal, California proceeded to tap fi rewood to meet the majority of its needs before hydropower matured into a fully commer-cial enterprise. Rampant deforestation fed the state’s appetite for energy, but it also caused early contamination of its air
Plate 6. The Tesla Coal Mine on eastern slope of Altamont Pass in Contra Costa County.
Asmus08_Part I.indd 9 12/18/08 11:12:48 AM
Copyrighted Material
O V E R V I E W10
quality, as smoke often fi lled the skies. As much as 90 percent of initial wood harvesting went to residences, but the rail-roads here were also wood-fi red. Then the gold rush came, which spurred on a massive and even more frenetic hunt for fuel wood. By 1870, it was estimated that as much as a third of the state’s entire inventory of forests had been harvested, hardly a sustainable approach to energy management. The strands of nonnative eucalyptus scattered throughout California are remnants from this period of our collective energy past. These eucalyptus groves now stand as reminders of the rampant reforestation that forever changed California. They were planted to reforest lands because of their ability to grow so rapidly and then be quickly harvested to feed the state’s expanding appetite for energy.
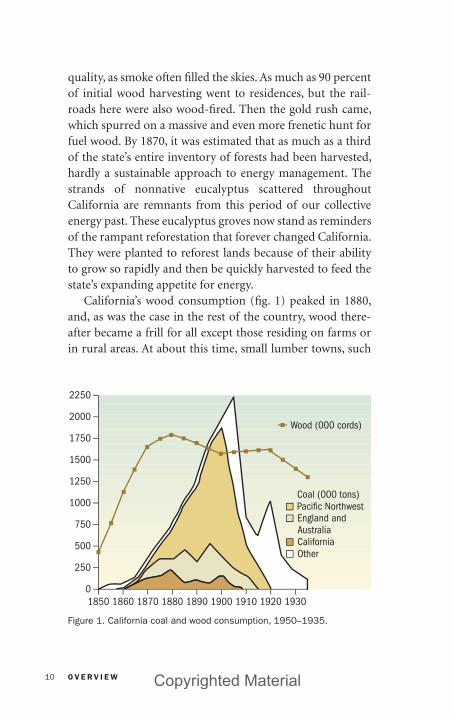
California’s wood consumption (fi g. 1) peaked in 1880, and, as was the case in the rest of the country, wood there-after became a frill for all except those residing on farms or in rural areas. At about this time, small lumber towns, such
Figure 1. California coal and wood consumption, 1950–1935.
2250
2000
1750
1500
1250
1000
750
500
250
01850 1860 1870 1880 1890 1900 1910 1920 1930
Wood (000 cords)
Coal (000 tons)Pacific Northwest England and
CaliforniaOther
Australia
Asmus08_Part I.indd 10 12/18/08 11:12:48 AM
Copyrighted Material
O V E R V I E W 11
as Scotia in Del Norte County near the Oregon border, were completely powered by wood-fi red plants that also provided steam and mechanical power to lumber mills. The nation’s fi rst stand-alone biomass power plant, for example, was built in the small town of Burney in Shasta County. Yet, for the great masses of people fl ocking to growing cities such as Sacramento, San Francisco, and then Los Angeles, depen-dence solely upon wood for energy was clearly not viable over the long term.
It is then easy to see why California looked to alternative fuels to meet its growing energy appetite, and water power—often considered a green, renewable resource—would rush in to fi ll in the gaps.
Making Hydro History
California’s hydroelectric system would evolve into some-thing substantially different than any other part of the coun-try. The brutally rugged topography of California’s Sierra Nevada, coupled with its unique seasonal rainfall patterns, required a sophisticated engineering approach that was quite different from anything used elsewhere. Instead of the typical combination of immense horizontal volumes of water drop-ping down relatively low elevations, California’s hydroelec-tric systems would feature smaller water volumes but steeper drops in elevation.
Another distinguishing feature of California’s elaborate approach to managing its hydro resources was the fact that virtually all of the state’s annual rainfall occurs in winter and spring. Because of this unique, yet consistent, weather pattern, the state’s humanly engineered hydropower system also irrigated agricultural operations throughout the entire Central Valley. Farmers in the eastern United States did not have to worry about such matters, since precipitation was
Asmus08_Part I.indd 11 12/18/08 11:12:48 AM
Copyrighted Material
O V E R V I E W12
scattered throughout the entire year. In California, this was not the case. The Sierra Nevada’s seasonally immense snow pack soon became recognized as a key fuel source. As temperatures increased every spring, this snow would melt, providing a con-tinuous fl ow of water during spring and summer.
Because of all of these factors, California’s hydroelectric plants evolved into some of the most advanced of the time. Only one of the Sierra Nevada’s western slope rivers, the Cosumnes, was not damned for power generation, a fact that underscores how thoroughly California looked to water and snow to fuel its growing economy. While many rivers would help fuel the growth of electricity consumption throughout California, it would be the Yuba River—fl owing through the heart of gold mining country—that would become the setting for some of the state’s most pivotal advances in hydroelectricity.
The Pelton water wheel (pl. 7)—invented by Lester Allan Pelton in 1878 in the Yuba County town of Camptonville—introduced a more effi cient method of extracting energy out of moving water, thereby accelerating hydroelectric develop-ment in California and throughout the world. This new twist on technology was particularly suited to the gushing streams of the Sierra Nevada. The smaller, lighter, and more com-pact wheel design split the water into two streams, taking advantage of the energy in rushing water without having the water fi ght itself. By changing the angle of the water’s impact against two cups instead of just one, power and effi ciency were greatly enhanced. It was also certainly convenient that this new power generation technology was also fi rst manu-factured in Nevada City at Allan’s Foundry, now known as the Miner’s Foundry and a preserved historical site.
In August 1887, the fi rst Pelton wheel was employed to generate electricity in Nevada County, among the very fi rst successful hydroelectric demonstrations. Two months later (October 1887), the Highgrove Plant was put in service to deliver direct current (DC) power for arc lights in Riverside
Asmus08_Part I.indd 12 12/18/08 11:12:49 AM
Copyrighted Material

O V E R V I E W 13
and Colton, utilizing a 50-foot drop in a canal. These early, small demonstrations generated DC. The hydroelectric busi-ness would not seriously develop until alternating current (AC) systems were developed.
The pioneering AC work in California took place in the Pomona–Riverside–San Bernardino area—fi rst with a single-phase AC plant on San Antonio Creek in November 1892 and then the fi rst three-phase AC plant in the west, Mill Creek No. 1, in September 1893. These plants demonstrated the most signifi cant technical concept that would launch the hydroelectric business on a large scale in California. This concept was done by using step-up transformers to allow power transmission at high voltage and then stepping down the voltage at delivery points.
Plate 7. Close-up of the Pelton water wheel, which featured separated cups that achieved higher effi ciency at higher water speeds than existing hydroelectric generation technologies.
Asmus08_Part I.indd 13 12/18/08 11:12:49 AM
Copyrighted Material

O V E R V I E W14
Because of the previously noted rampant deforestation and corresponding wood shortages, water power quickly became the most cost-effective source of power in the Sierra Nevada region and ultimately the rest of California. While California’s water power sources were extraordi-nary, they were far from the urban clusters of humanity such as San Francisco, which clung to California’s coastline approximately 150 miles to the west. Accessing these water power sources was not always easy and often required workers to drill through remnants of California’s natural history (pl. 8).
This distance between fuel sources and end-use custom-ers ultimately spawned major innovations in the devel-opment of technologies to transport electricity over long distances, yet another example of Californian ingenuity. To expand this source of water power to other regions of
Plate 8. Workers boring into rock to help build an early hydroelectric power plant in the Sierra Nevada.
Asmus08_Part I.indd 14 12/18/08 11:12:49 AM
Copyrighted Material

O V E R V I E W 15
the state would require major innovations in transmission of power. Sacramento would be the fi rst major munici-pality to receive long-distance transmission of hydroelec-tricity on July 13, 1895, when a hydro facility located on the American River at Folsom transmitted AC electricity at 11,000 volts over a 22-mile transmission line. Approxi-mately 30,000 people gathered later that year at the State Capitol to witness the miracle of electric lamps lighting up the rotunda and a lavish parade heralding the wonders of electric lighting.
Because of a drought in 1897 and 1898, however, the Folsom Powerhouse could not deliver enough electricity to power Sacramento’s electric trolley system, the dominant mode of public transit at that time. It just so happened, however, that entrepreneurs already in the hydro business in the Nevada County region, located approximately 60 miles to the east of Sacramento, would soon come to the rescue.
The Birth of Pacifi c Gas & Electric
Eugene J. de Sabla (pl. 9) was born in Panama to a family whose French ancestors were considered nobility because of their valiant defense of the king’s Parisian palace. The de Sabla family was deeply involved with the development of the Panama Canal and, later, with copper mines in the south-west. De Sabla, with a few partners who included Alfonso A. Tregidgo, had already begun developing small hydroelectric projects in the region as early as 1895. However, the situation in Sacramento would prompt them to think about new ways to grow their business.
De Sabla compatriots included John Martin, an agent for all kinds of hardware, including iron pipes and electricity-generating dynamos. Despite the fact that Martin knew
Asmus08_Part I.indd 15 12/18/08 11:12:50 AM
Copyrighted Material

O V E R V I E W16
virtually nothing about electricity or engineering, he had secured the rights to sell the new generators to be used in the fi rst power generation facilities developed by de Sabla and his other cohorts. The geographical origins of Pacifi c Gas & Electric (PG&E) can be traced back to a Nevada City bar, but the fi rst tangible results of partnerships that would slowly put into place the building blocks of PG&E were found in the so-called “Rome” powerhouse. The facility derived its name “Rome” as an oblique reference to Romulus Riggs Colgate, considered by some to be the rich uncle of the small pioneer fi rms that would eventu-ally merge and become PG&E. A descendent of the same Colgate family that gave us soap and toothpaste, Romulus would serve as the deep pocket of several early hydrogen-eration plants, typically taking a majority stake in each of these power generation facilities.
Plate 9. Eugene De Sabla.
Asmus08_Part I.indd 16 12/18/08 11:12:50 AM
Copyrighted Material

O V E R V I E W 17
The next power plant developed by the Martin–de Sabla–Colgate team was the Yuba Powerhouse in 1898. However, the most important of these early hydroelectric plants—if viewed from the perspective of the evolution of PG&E—was the Colgate Powerhouse (pl. 10), which was prompted by the power shortage in Sacramento.
Construction on Colgate began in March 1899 at a river crossing once cluttered with gold seekers. The facility ulti-mately was capable of generating 15.5 megawatts of electric-ity and began delivering power to Sacramento in September of the same year, just four days after Martin had promised his power-hungry Sacramento clients that it would be deliv-ered. This power plant’s greatest claim to fame, however, was when it transmitted electricity 142 miles to the west, across the Carquinez Straits all the way to the City of Oakland, an unprecedented feat fraught with unknown risks and fears. Many farmers, for example, worried that the super-charged, high-voltage transmission lines might fall and crush their
Plate 10. The Colgate Powerhouse was pivotal in the evolution of PG&E. This photo was taken in 1941.
Asmus08_Part I.indd 17 12/18/08 11:12:50 AM
Copyrighted Material
O V E R V I E W18
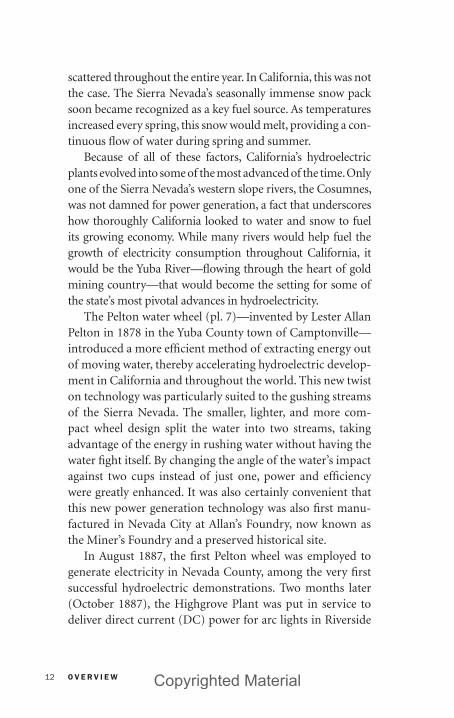
ANATOMY OF THE “ROME” HYDROELECTRIC PLANT
The fi rst step in creating this pioneering hydroelectric plant was to construct a crib-style wooden dam three-
and-a-half miles upstream. Next, fl umes (long wooden channels) over six feet wide and four-and-a-half feet deep were placed in an old mining ditch. The fl ume helped contour the water along a horizontal plane some three-and-a-half miles long in order to hold its grade until intersecting with the penstock, a steep tube that then dropped the water down 200 feet to the Pelton wheel generators housed in the powerhouse along the banks of the river. (This drop length is referred to as “the head” in the hydro business.) The original facility generated roughly 300 kilowatts of electricity, the rough equivalent to a 400-horsepower engine.
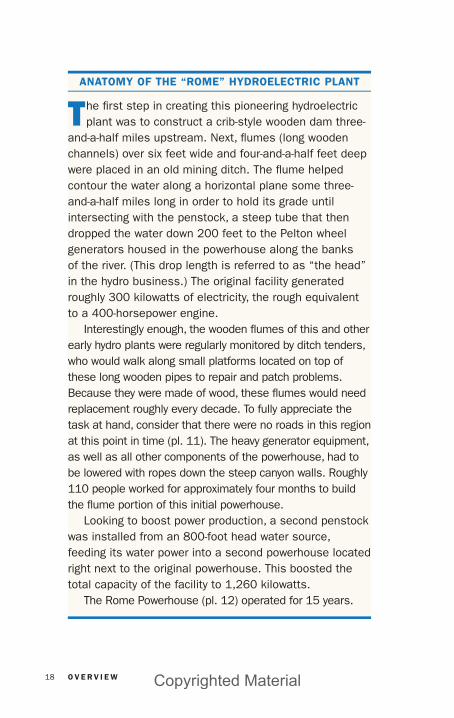
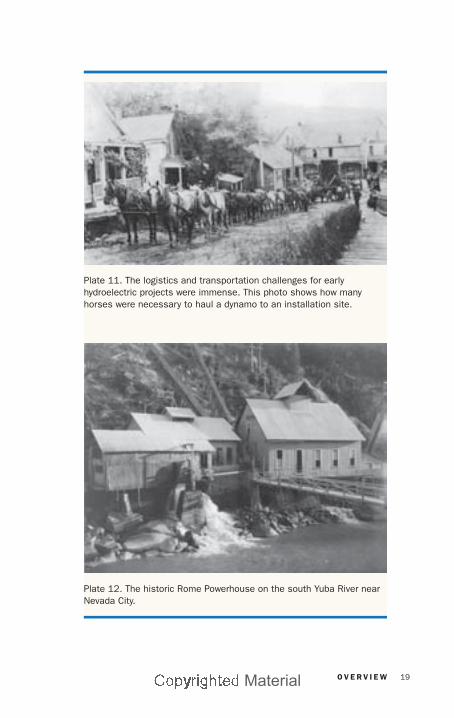
Interestingly enough, the wooden fl umes of this and other early hydro plants were regularly monitored by ditch tenders, who would walk along small platforms located on top of these long wooden pipes to repair and patch problems. Because they were made of wood, these fl umes would need replacement roughly every decade. To fully appreciate the task at hand, consider that there were no roads in this region at this point in time (pl. 11). The heavy generator equipment, as well as all other components of the powerhouse, had to be lowered with ropes down the steep canyon walls. Roughly 110 people worked for approximately four months to build the fl ume portion of this initial powerhouse.
Looking to boost power production, a second penstock was installed from an 800-foot head water source, feeding its water power into a second powerhouse located right next to the original powerhouse. This boosted the total capacity of the facility to 1,260 kilowatts.
The Rome Powerhouse (pl. 12) operated for 15 years.
Asmus08_Part I.indd 18 12/18/08 11:12:51 AM
Copyrighted Material
O V E R V I E W 19
Plate 12. The historic Rome Powerhouse on the south Yuba River near Nevada City.
Plate 11. The logistics and transportation challenges for early hydroelectric projects were immense. This photo shows how many horses were necessary to haul a dynamo to an installation site.
Asmus08_Part I.indd 19 12/18/08 11:12:51 AM
Copyrighted Material

O V E R V I E W20
precious cattle! However, like other California energy entre-preneurs, de Sabla and Martin pushed forward. It was this successful long-distance transmission of electricity that set the stage for a series of mergers that would piece together the now substantial service territory of what is now PG&E.
The most diffi cult chore facing these energy pioneers turned out to be fi nding investors for these new power gen-eration facilities. California’s fi nancing of power generation was hardly a mature business at this point in time. Unlike the industrialized eastern United States and Great Lakes regions, where coal, oil, and steam plants had been developed in densely populated urban clusters, California was rural and decentralized, making it diffi cult for power companies to grow and prosper. Without a track record of dependable revenues from existing customers, folks such as de Sabla had to forge new ground on the power plant fi nancing front, especially before Colgate came along. Most power plant entrepreneurs traveled all the way to New York City to sit down with Wall Street types. However, de Sabla turned to novel local sources of cash to supplement Colgate’s steady fi nancial support.
After all, he was operating smack dab in the middle of a part of California that had obtained tremendous wealth from gold that was found in the very same streams he now sought to tap for electricity! The risk-taking culture was emerging in California as a result of the gold rush, which encouraged investors to engage in this new potential gold mine.
While de Sabla and other investors worried about cus-tomers for their risky investments in this new form of energy, California’s population growth kept boosting the need for more power. By the time each of his power plants came online, demand for electricity exceeded its capacity (fi g. 2). By 1900, some 25 hydroelectric plants had been constructed in California, stretching from Eureka in the north down to the previously mentioned Mill Creek facility in the south (map 1).
As a result of hydropower being transmitted from the Sierra Nevada to coastal cities in the north and south, the
Asmus08_Part I.indd 20 12/18/08 11:12:51 AM
Copyrighted Material

O V E R V I E W 21
rural communities of the Central Valley became convenient customers to utilities seeking to run its power plants around the clock to boost revenues. By the mid-1920s, almost a quarter of California’s farmers had electricity, which was the highest percentage in the nation, while only 3 in 100 farms nationally were connected to the grid.
One of the fi rst widespread methods of generating elec-tricity in the United States, hydropower supplied 40 percent of the nation’s electricity in the early part of the twentieth century. In California, and throughout the west, hydropower provided roughly three-quarters of the total electricity sup-ply as late as World War II. In PG&E’s service territory, 98.5 percent of farms had electricity by 1950, underscoring the growing relationship between water, power, and farming as California’s economy expanded in response to this wide-spread reliance upon falling water for power generation.
Figure 2. California water power, 1850–1930.
18500
10,000
20,000
30,000
40,000
50,000
60,000
70,000
80,000
90,000
100,000
110,000
120,000
130,000
1860 1870 1880 1890 1900 1910 1920 1930
Manufacturing horsepowerMining horsepowerEquivalent tons of coal (000)
Asmus08_Part I.indd 21 12/18/08 11:12:52 AM
Copyrighted Material
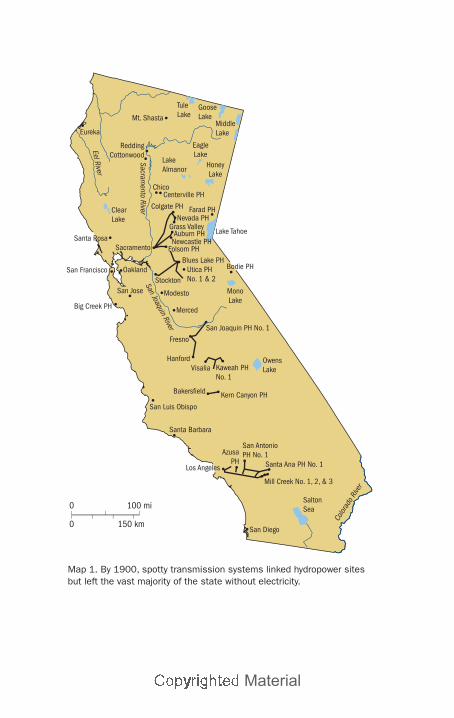
Map 1. By 1900, spotty transmission systems linked hydropower sites but left the vast majority of the state without electricity.
TuleLake
LakeAlmanor
HoneyLake
Lake Tahoe
EagleLake
ChicoCenterville PH
Farad PHColgate PH
Nevada PHGrass Valley
Auburn PHNewcastle PH
Folsom PHBlues Lake PH
Utica PHNo. 1 & 2
Bodie PH
MonoLake
Stockton
Modesto
Merced
Fresno
HanfordVisalia Kaweah PH
No. 1
OwensLake
Kern Canyon PHBakersfield
San Luis Obispo
Santa Barbara
Los Angeles
AzusaPH
San AntonioPH No. 1
Santa Ana PH No. 1
Mill Creek No. 1, 2, & 3
SaltonSea
San Diego
Color
ado
Rive
rEel River
San Joaquin PH No. 1
GooseLake
MiddleLake
Mt. Shasta
Eureka
ReddingCottonwood
ClearLake
Santa RosaSacramento
Sacramento River
OaklandSan Francisco
San Jose
San Joaquin River
Big Creek PH
0 100 mi
0 150 km
Asmus08_Part I.indd 22 12/18/08 11:12:52 AM
Copyrighted Material
O V E R V I E W 23
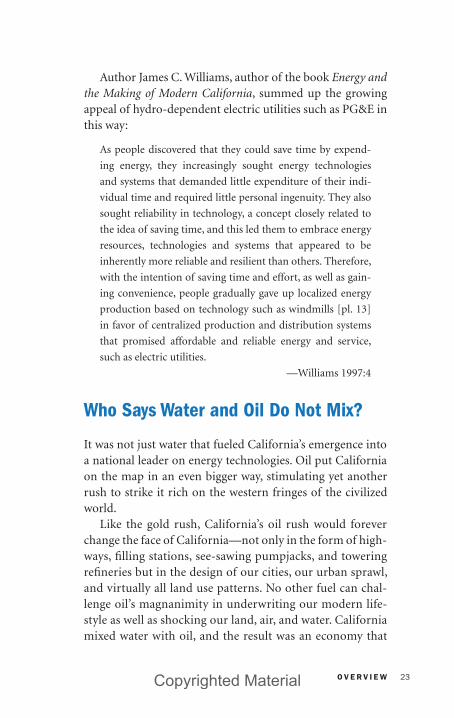
Author James C. Williams, author of the book Energy and the Making of Modern California, summed up the growing appeal of hydro-dependent electric utilities such as PG&E in this way:
As people discovered that they could save time by expend-
ing energy, they increasingly sought energy technologies
and systems that demanded little expenditure of their indi-
vidual time and required little personal ingenuity. They also
sought reliability in technology, a concept closely related to
the idea of saving time, and this led them to embrace energy
resources, technologies and systems that appeared to be
inherently more reliable and resilient than others. Therefore,
with the intention of saving time and effort, as well as gain-
ing convenience, people gradually gave up localized energy
production based on technology such as windmills [pl. 13]
in favor of centralized production and distribution systems
that promised affordable and reliable energy and service,
such as electric utilities.
—Williams 1997:4
Who Says Water and Oil Do Not Mix?
It was not just water that fueled California’s emergence into a national leader on energy technologies. Oil put California on the map in an even bigger way, stimulating yet another rush to strike it rich on the western fringes of the civilized world.
Like the gold rush, California’s oil rush would forever change the face of California—not only in the form of high-ways, fi lling stations, see-sawing pumpjacks, and towering refi neries but in the design of our cities, our urban sprawl, and virtually all land use patterns. No other fuel can chal-lenge oil’s magnanimity in underwriting our modern life-style as well as shocking our land, air, and water. California mixed water with oil, and the result was an economy that
Asmus08_Part I.indd 23 12/18/08 11:12:52 AM
Copyrighted Material

O V E R V I E W24
transformed this state into a cutting-edge global super power.
After the gold rush came and went, California turned increasingly to nonrenewable energy sources such as oil and natural gas. By the beginning of the twentieth century, roughly half of the energy consumed in California came from renewable sources such as water, wind, and the sun. Nevertheless, fossil fuels, especially oil, would soon surpass these renewable energy sources as the prime movers behind the state’s expanding economy.
As early as 1850, Californian settlers relied upon fossil fuels for energy, initially digging pits by hand in the Los Angeles area to produce fuel for primeval oil lamps at the San Fernando
Plate 13. Water-pumping windmills such as this one were an early form of renewable energy development in California and throughout the nation.
Asmus08_Part I.indd 24 12/18/08 11:12:52 AM
Copyrighted Material

O V E R V I E W 25
Mission. In 1854, the fi rst oil well was drilled manually way up in Humboldt County, but these efforts came up dry. One year after the end of the Civil War, crude oil was suc-cessfully tapped in Ventura County at Rancho Ojai in 1866 at a depth of 550 feet. Known as “Ojai 6,” this Ventura County oil well produced 15 to 20 barrels of oil per day, a signifi cant sum in those days (pl. 14).
In 1891, the state’s fi rst gusher in Adams Canyon near Santa Paula spewed 1,500 barrels of oil per day, most of it washing out to sea because of the lack of storage technolo-gies. Five years later, the fi rst steel-hulled oil tanker, dubbed George Loomis, began transporting as much as 6,500 barrels of oil from Ventura north to San Francisco, the dominant urban center of California because of its location as an attrac-tive West Coast port. In 1909, the famed “Midway Gusher”
Plate 14. Crude oil blowout at McNee #6 Tower in Taft in 1912.
Asmus08_Part I.indd 25 12/18/08 11:12:53 AM
Copyrighted Material
O V E R V I E W26
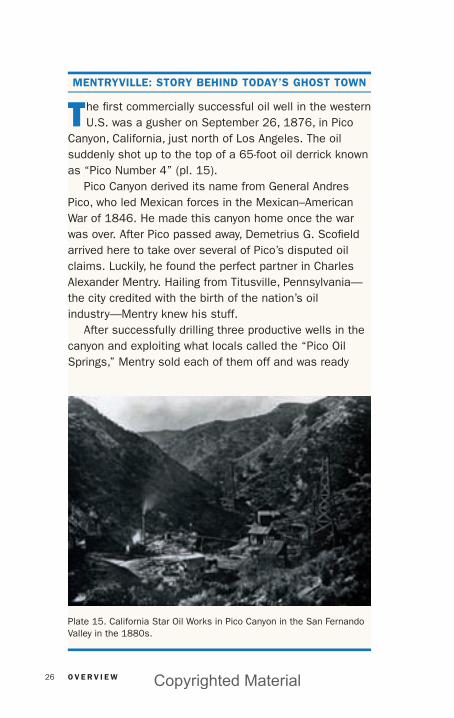
MENTRYVILLE: STORY BEHIND TODAY’S GHOST TOWN
The fi rst commercially successful oil well in the western U.S. was a gusher on September 26, 1876, in Pico
Canyon, California, just north of Los Angeles. The oil suddenly shot up to the top of a 65-foot oil derrick known as “Pico Number 4” (pl. 15).
Pico Canyon derived its name from General Andres Pico, who led Mexican forces in the Mexican–American War of 1846. He made this canyon home once the war was over. After Pico passed away, Demetrius G. Scofi eld arrived here to take over several of Pico’s disputed oil claims. Luckily, he found the perfect partner in Charles Alexander Mentry. Hailing from Titusville, Pennsylvania—the city credited with the birth of the nation’s oil industry—Mentry knew his stuff.
After successfully drilling three productive wells in the canyon and exploiting what locals called the “Pico Oil Springs,” Mentry sold each of them off and was ready
Plate 15. California Star Oil Works in Pico Canyon in the San Fernando Valley in the 1880s.
Asmus08_Part I.indd 26 12/18/08 11:12:54 AM
Copyrighted Material

O V E R V I E W 27
to move on to further adventures elsewhere. However, Scofi eld urged Mentry to stay on and keep drilling, applying his legendary striking skills to advance their mutual fi nancial interests. Using one of California’s fi rst steam-powered oil rigs, Mentry drilled down 300 feet and hit the big time on his fourth Pico Canyon well. Averaging 30 barrels of oil per day, this now famous well helped Scofi eld and Mentry become very rich men indeed.
However, getting the oil to the market proved to be diffi cult. At fi rst, Mentry relied upon a recent extension of the Southern Pacifi c Railroad line at the eastern end of the Santa Clarita Valley to transport his crude to refi neries. Mentry was not too happy, nonetheless, about the fees the railroad began charging, taking advantage of a monopoly on transportation options. In 1879, Mentry’s ingenuity paid off again. He constructed California’s fi rst oil pipeline. It was only two inches in diameter and fi ve miles in length, connecting his precious well in Pico Canyon to the state’s fi rst oil refi nery in Newhall.
Oddly enough, the pipeline never transported a drop of oil, because Southern Pacifi c responded to this creative end-around by dramatically lowering its shipping rates.
With a salary of $300 per month, a rather large sum at the time, Mentry built an extravagant Victorian mansion that can still be seen near the entrance of a public park. In October 1900, Mentry passed away unexpectedly. Once the oil wells ran dry, Scofi eld was long gone, and the migrant workers packed up their makeshift dwellings, leaving nothing but their footprints and stories behind.
The site of the Pico Number 4 strike has, unusually for an oil development site, been transformed into a public park, chronicling the story of how oil prospectors came and went in a tale of luck, skill, fortune, and death. Small oil springs can still be found in mountain streams that trickle through Pico Canyon to this very day.
Asmus08_Part I.indd 27 12/18/08 11:12:54 AM
Copyrighted Material
O V E R V I E W28
blew out near the town of Fellows in Kern County, foreshad-owing development of the billion-barrel Midway–Sunset oil fi eld, the largest producing fi eld in the entire continental United States!
Ultimately, California’s primary oil extraction regions would extend to the western edges of San Joaquin Valley in the north, where California’s oldest and best-traveled roads passed along a series of oil seeps, though exploration activities also occurred in Colusa, Santa Clara, San Mateo, Mendocino, Marin, and Contra Costa counties. Kern County, Los Angeles basin, and the Santa Barbara coast were the dominant oil-producing regions in the south and would serve as the pri-mary sources behind California’s increased reliance upon fossil fuels.
Legal Wars over Energy Resources Begin
Confl icting claims over the ownership rights to this precious black goop lying beneath the ground prompted the federal government to develop policies to shape the future develop-ment of oil throughout the nation. Because of California’s culture of embracing free enterprise, private industry gained the upper hand here. Westerners had little sentiment for nationalizing this precious commodity, as was the instincts of many lawmakers from the east.
During the early days of California’s oil rush, intense debate revolved around ownership issues. Who should reap the benefi ts of God’s gifts of nature? Laws on the books dating back to the nineteenth century sided with a “rule of capture” model, which implied that the owner of any sub-division or real estate lot had rights to whatever resources, including oil, that lay beneath the ground of their pri-vate property. As one can imagine, this dynamic set off a race to drill for oil to protect each landowner’s fair share
Asmus08_Part I.indd 28 12/18/08 11:12:54 AM
Copyrighted Material

O V E R V I E W 29
of the bounty seeping below the surface. Why? Since this “gold” was a liquid, the more straws that went into these underground basins, the faster this fi nite resource would be depleted. Wealth could literally slip out of your hands if you did not strike quickly.
During the nineteenth century, economic development was the top concern of most governments, an understand-able priority given the levels of poverty common at the time. Therefore, laws and regulations refl ected the belief that the United States was awash with “free” resources that just had to be harnessed and put to work for the good of individuals, and this free market would inevitably serve the higher purpose of generating economic well-being for anyone willing to work for their dream. Federal, state, and local governments were literally giving away natural resources for free (and, in many cases, still do). Land owned by the public sector served as the underwriter of services performed by government, as sales of public lands (and the resources located on these public lands) often funded the government. From that perspective, the whole system seemed to be working.
In the fi rst few decades of the twentieth century, how-ever, geologists and conservationists working for the gov-ernment began to espouse a different political view. The nation’s environmental movement was birthed on the watch of President Theodore Roosevelt, and his chief forester Gifford Pinchot played a key role in advancing notions of conservation and a new environmental ethic. In 1907, Roosevelt advocated that the federal govern-ment should retain its title to fuel sources, and one year later, federal government geologists argued that petroleum lands, particularly in California, should also follow this new model of government ownership and management to reduce competition that was driving development in the Wild West in ways that encouraged fraud and other unsa-vory manipulations.
Asmus08_Part I.indd 29 12/18/08 11:12:55 AM
Copyrighted Material

O V E R V I E W30
Disputes between private fi rms and the federal govern-ment over the rights to oil located under California’s crust continued for years to come. Then the now legendary Teapot Dome scandal came along, which revealed bribes for oil leases in California. The controversy boiled over and culminated with the passage of the federal Mineral Leasing Act in 1920. It was in that same year that oil was discovered under Signal Hill, a plot of land zoned for residential use near Long Beach. Speculation drove land parcel prices through the roof, and wooden oil derricks (pl. 16) popped up everywhere on the hill, creating a human-made forest . . . and an enormous potential fi re hazard!
Plate 16. Early Midway fi eld rig construction. The workers inside the rig provide a sense of scale.
Asmus08_Part I.indd 30 12/18/08 11:12:55 AM
Copyrighted Material
O V E R V I E W 31
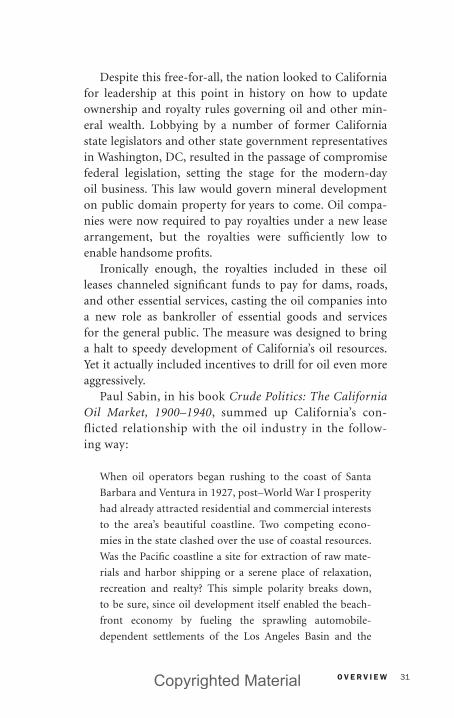
Despite this free-for-all, the nation looked to California for leadership at this point in history on how to update ownership and royalty rules governing oil and other min-eral wealth. Lobbying by a number of former California state legislators and other state government representatives in Washington, DC, resulted in the passage of compromise federal legislation, setting the stage for the modern-day oil business. This law would govern mineral development on public domain property for years to come. Oil compa-nies were now required to pay royalties under a new lease arrangement, but the royalties were suffi ciently low to enable handsome profi ts.
Ironically enough, the royalties included in these oil leases channeled signifi cant funds to pay for dams, roads, and other essential services, casting the oil companies into a new role as bankroller of essential goods and services for the general public. The measure was designed to bring a halt to speedy development of California’s oil resources. Yet it actually included incentives to drill for oil even more aggressively.
Paul Sabin, in his book Crude Politics: The California Oil Market, 1900–1940, summed up California’s con-flicted relationship with the oil industry in the follow-ing way:
When oil operators began rushing to the coast of Santa
Barbara and Ventura in 1927, post–World War I prosperity
had already attracted residential and commercial interests
to the area’s beautiful coastline. Two competing econo-
mies in the state clashed over the use of coastal resources.
Was the Pacifi c coastline a site for extraction of raw mate-
rials and harbor shipping or a serene place of relaxation,
recreation and realty? This simple polarity breaks down,
to be sure, since oil development itself enabled the beach-
front economy by fueling the sprawling automobile-
dependent settlements of the Los Angeles Basin and the
Asmus08_Part I.indd 31 12/19/08 3:18:37 PM
Copyrighted Material

O V E R V I E W32
state’s increasing auto tourism. But on the coast itself, the
two sets of interests clashed.
—Sabin 2005:56
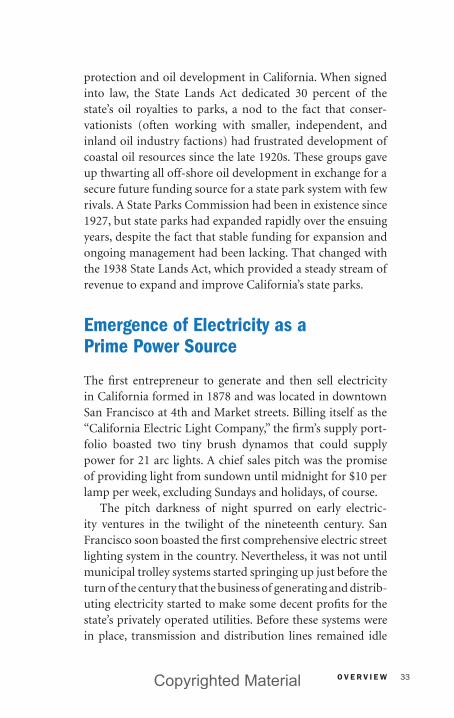
Those in favor of oil resource development gained the upper hand in early skirmishes, as oil derricks popped up right alongside beachfront residences in not only Long Beach but also Venice. It was not uncommon for people to sunbathe beneath the oil derricks in Huntington Beach (pl. 17). In 1932, however, a ballot measure put forth by oil industry heavyweights to expand exploitation to offshore reserves was rejected by voters, as a majority instead declared that beaches should be preserved for recreation. Supporters of the ballot measure were quick to highlight the tax revenues that would be generated, but California voters went with their eyes and hearts instead of their pocketbooks. A “Save the Beaches” movement began to grow in popularity. As a result of low prices, some oil companies with inland holdings also opposed offshore development, as they worried about maintaining higher margins in times of oversupply.
A deal was cut in 1938 by the state legislature that would forever cement an odd relationship between coastal
Plate 17. Oil derricks at Huntington Beach.
Asmus08_Part I.indd 32 12/19/08 3:18:37 PM
Copyrighted Material
O V E R V I E W 33
protection and oil development in California. When signed into law, the State Lands Act dedicated 30 percent of the state’s oil royalties to parks, a nod to the fact that conser-vationists (often working with smaller, independent, and inland oil industry factions) had frustrated development of coastal oil resources since the late 1920s. These groups gave up thwarting all off-shore oil development in exchange for a secure future funding source for a state park system with few rivals. A State Parks Commission had been in existence since 1927, but state parks had expanded rapidly over the ensuing years, despite the fact that stable funding for expansion and ongoing management had been lacking. That changed with the 1938 State Lands Act, which provided a steady stream of revenue to expand and improve California’s state parks.
Emergence of Electricity as a Prime Power Source
The fi rst entrepreneur to generate and then sell electricity in California formed in 1878 and was located in downtown San Francisco at 4th and Market streets. Billing itself as the “California Electric Light Company,” the fi rm’s supply port-folio boasted two tiny brush dynamos that could supply power for 21 arc lights. A chief sales pitch was the promise of providing light from sundown until midnight for $10 per lamp per week, excluding Sundays and holidays, of course.
The pitch darkness of night spurred on early electric-ity ventures in the twilight of the nineteenth century. San Francisco soon boasted the fi rst comprehensive electric street lighting system in the country. Nevertheless, it was not until municipal trolley systems started springing up just before the turn of the century that the business of generating and distrib-uting electricity started to make some decent profi ts for the state’s privately operated utilities. Before these systems were in place, transmission and distribution lines remained idle
Asmus08_Part I.indd 33 12/18/08 11:12:56 AM
Copyrighted Material

O V E R V I E W34
during much of the day. Once these trolleys and lighting sys-tems started relying upon the existing hardware employed to provide electrical power round the clock, demand for power increased dramatically and so did the profi ts of purveyors of this invisible and seemingly magical form of energy. Los Angeles proceeded to develop the country’s largest municipal electric streetcar system, known as the “Big Red Trolleys.”
After the great earthquake in San Francisco in 1906, the appeal of Los Angeles grew among the immigrants making the trek out west to California, and it soon surpassed its north-ern rival port in population. In the case of both of these large cities, impressive electric cable car and railway energy systems encouraged development on previously inaccessible land (map 2). Electric vehicles that could travel 100 miles between recharges had already been put on the market in 1900, but the lack of charging stations rendered them impractical for most of California. Gasoline was also about half the cost of electricity, which meant that many residents could not yet afford the con-venience of electric vehicles, let alone electricity in their homes.
The state’s oil industry, working hand-in-hand with Detroit’s auto industry, would deliver a stinging defeat to the state’s electric utilities. Car, tire, and oil companies
Map 2. Map depicting the rail lines of Pacifi c Electric Railway Company throughout the Los Angeles area.
Pacific Ocean
SAN FERNANDO
LOS ANGELES
SANTA ANA
SAN BERNARDINO
LONG BEACH
RIVERSIDE
PASADENA
Asmus08_Part I.indd 34 12/18/08 11:12:56 AM
Copyrighted Material
O V E R V I E W 35
collaborated to buy up and dismantle electric trolley sys-tems in Los Angeles as more modern roads were constructed, thereby increasing the demand for petroleum transportation fuels to staggering heights. Gas-powered motor vehicles, free to roam the open road, captured the imagination of almost everyone, especially in southern California.
As time would wear on, this would prove to be a rare vic-tory for oil over electricity in California. As transmission and distribution technologies improved, electricity would soon become the most popular purveyor of energy for a society increasingly plugged into new ways to add convenience and entertainment to their lives.
In the early twentieth century, competing electricity pro-viders each established their own transmission and distribu-tion lines. The end result of this entrepreneurial free-for-all was poles and wires strung about major cities like a maze of metal spaghetti. Not only was this unsightly, but compet-ing fi rms found it diffi cult to survive. A protégé of Edison, Samuel Insull, came up with a nifty solution to this dilemma. Claiming that the capital-intensive electricity business was too risky to leave to the forces of free enterprise, Insull—with the backing of Edison—proposed that exclusive franchises for the provision of electricity made far more sense and were in the best interests of consumers. Instead of local govern-ments regulating the business of electricity, he proposed state regulation. Once this basic business structure was approved by federal lawmakers, it paved the way for the creation of state-regulated utility monopolies that still carve up the country with exclusive franchises today.
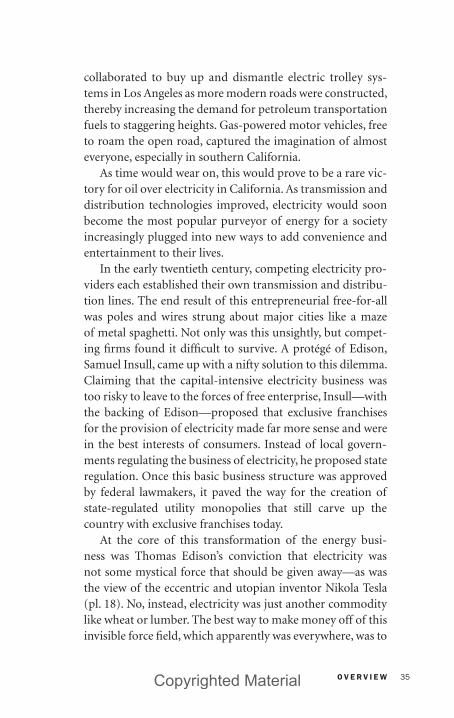
At the core of this transformation of the energy busi-ness was Thomas Edison’s conviction that electricity was not some mystical force that should be given away—as was the view of the eccentric and utopian inventor Nikola Tesla (pl. 18). No, instead, electricity was just another commodity like wheat or lumber. The best way to make money off of this invisible force fi eld, which apparently was everywhere, was to
Asmus08_Part I.indd 35 12/18/08 11:12:57 AM
Copyrighted Material

O V E R V I E W36
calibrate it and sell it in units, hence terms such as “kilowatt hours” that serve as the basis of your monthly electric bill.
In 1911, the state’s new Public Utilities Commission began to regulate electric utilities at the state level in California. These newly ordained geographic monopolies—entities that would become PG&E, Southern California Edison (SCE), and San Diego Gas & Electric (SDG&E)— developed business strategies to boost demand for their product. Armed with Edison’s patents on a variety of gadgets that ran
Plate 18. Nikola Tesla, the so-called “New Wizard of the West.”
Asmus08_Part I.indd 36 12/18/08 11:12:57 AM
Copyrighted Material
O V E R V I E W 37
on electricity, SCE was particularly adept at expanding each customer’s consumption of kilowatt hours of electricity through aggressive sales of vacuum cleaners, electric stoves, and other home appliances. While now under state regula-tion, critics of this new monopoly system emerged over time, claiming these now large and formidable business entities could charge virtually whatever they wanted to captive cus-tomers. In many parts of the country, they saw little profi t in serving sparsely populated rural regions, though this was not the case in California.
Southern California’s Energy History
Northern California dominated the state’s early industri-alization and corresponding path of energy development. Yet it would be southern California that would, over time, become the destination of choice for the majority of people migrating to the state, spurring new efforts to satisfy the state’s growing appetite for energy. Between 1880 and 1930, for example, southern California, with an increasingly cut-ting-edge Los Angeles serving as a migrant magnet, went from less than 10 percent to well over half of California’s population (fi g. 3).
Not only was oil developed on a massive scale in southern California, but natural gas and electric utility companies based here would rise into national prominence.
Did you know that early advances in lighting technol-ogy here trace back to concerns about the large number of gamblers, villains, and assorted kooks that roamed the small town of Los Angeles in the mid-1800s (pl. 19)? Consider that the total population of Los Angeles at this point in time was only 5,000 people. Approximately 40 gas lamps were installed along Main Street in 1867 by the Los Angeles Gas Company to make the streets safer at night for upstanding citizens. Initially deriving their gas from asphalt-like tars,
Asmus08_Part I.indd 37 12/18/08 11:12:58 AM
Copyrighted Material

O V E R V I E W38
these early gas providers soon turned to crude oil as their feedstock. Ironically enough, Thomas Edison’s light bulb put a major dent into this seemingly up-and-coming busi-ness here and elsewhere, forcing the gas companies to seek out new applications, introducing gas-fi red stoves and heat-ers to the local populace as a way to build demand for their fuel products.
A San Francisco–based fi rm eventually purchased the Los Angles Gas Company, and a familiar scenario of consolida-tion and mergers entailed. Though natural gas is often found in conjunction with crude oil, its benefi cial properties as an energy source were not fully appreciated until 1909. That is when a phenomenal natural gas fi eld was uncovered near Taft in Kern County. Because colorless, odorlessly burning natural gas has twice the heating value as the gaseous fuels derived from coal or oil, the company expanded its service
Figure 3. California Populations, North versus South, 1850–1990.
30,000
25,000
20,000
15,000
10,000
5000
0
1850
1870
1890
1910
1930
1950
1970
1990
SouthNorth
Thou
sand
s
Asmus08_Part I.indd 38 12/18/08 3:41:55 PM
Copyrighted Material

O V E R V I E W 39
Plate 19. Chinatown gamblers roaming Los Angeles at night.
territory by building pipelines to deliver this fuel throughout southern California. In 1941, the company introduced new storage techniques utilizing natural underground traps up to two miles beneath the earth’s surface. These sorts of inno-vations—and a surging population—allowed what soon became the Southern California Gas Company to grow into the largest supplier of natural gas in the country. Today, the Southern California Gas Company’s natural gas transporta-tion and distribution pipelines cover 49,000 miles and serve 19.8 million customers.
On the electric side of the energy equation, teeny-weeny fi rms with names like Ventura Land & Power and Visalia Electric Light & Gas Company began providing electric arc lighting to southern Californians about the same time oil was discovered in the state. The Civil War had just ended, and the nation turned its attention to rebuilding the econ-omy. Crafty San Francisco fi nanciers obtained a license from Thomas Edison—the president of General Electric (GE) Company—to use his name and patents to organize the Los Angeles Edison Electric Company (pl. 20). Hydroelectricity
Asmus08_Part I.indd 39 12/18/08 11:12:58 AM
Copyrighted Material

O V E R V I E W40
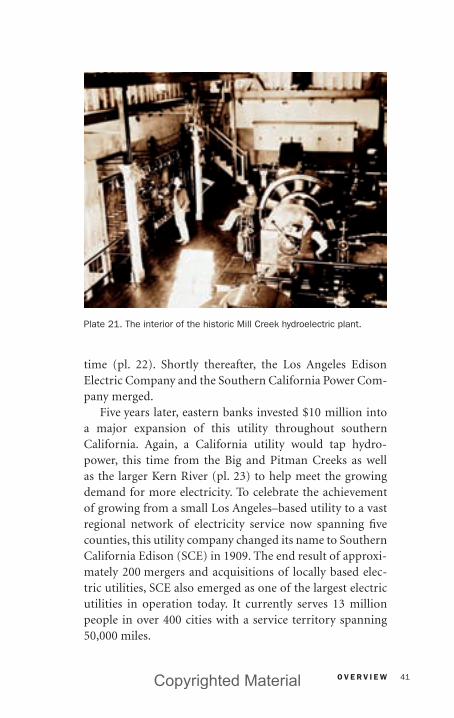
came to the rescue in the southern part of the state too. Perhaps the most celebrated of these hydroelectric facili-ties was the Mill Creek Plant, located near Redlands (pl. 21), which began delivering power in 1892. Its outstanding fea-ture was a three-phase form of AC that GE was pushing. This confi guration became a model for subsequent hydro plants, creating an instant market for GE’s electricity transmission technology.
By 1896, the population of Los Angeles had increased to 100,000 people, with most of the electricity being pro-vided by primitive steam engines located downtown. That same year, the Southern California Power Company began to build a power plant to tap hydropower on the upper Santa Ana River. When the hydro facility came online, elec-tric current at approximately 33,000 volts traveled 83 miles to downtown Los Angeles, a feat recognized as the longest high-voltage transmission in the country at this point in
Plate 20. Thomas Edison with dynamo.
Asmus08_Part I.indd 40 12/18/08 11:12:59 AM
Copyrighted Material
O V E R V I E W 41
time (pl. 22). Shortly thereafter, the Los Angeles Edison Electric Company and the Southern California Power Com-pany merged.
Five years later, eastern banks invested $10 million into a major expansion of this utility throughout southern California. Again, a California utility would tap hydro-power, this time from the Big and Pitman Creeks as well as the larger Kern River (pl. 23) to help meet the growing demand for more electricity. To celebrate the achievement of growing from a small Los Angeles–based utility to a vast regional network of electricity service now spanning fi ve counties, this utility company changed its name to Southern California Edison (SCE) in 1909. The end result of approxi-mately 200 mergers and acquisitions of locally based elec-tric utilities, SCE also emerged as one of the largest electric utilities in operation today. It currently serves 13 million people in over 400 cities with a service territory spanning 50,000 miles.
Plate 21. The interior of the historic Mill Creek hydroelectric plant.
Asmus08_Part I.indd 41 12/18/08 11:12:59 AM
Copyrighted Material

O V E R V I E W42
Meanwhile, further south, other smaller utilities also begin to link up to better compete with their larger northern rivals. The San Diego Gas Company, for example, traces its history back to 1881. Instead of hydro, its start-up fuel was gas derived directly from petroleum. With only 89 customers and an investment of $30,000, this fi rm also grew exponen-tially over time. Unfortunately, its fi rst fuel of choice—“oil gas”—clogged up the main generator with tar. The company then made the switch to coal gas.
The population of San Diego was a mere 4,000 in 1885, but a boom in real estate increased those numbers to 30,000 in just three years. It was electric lights and trolley
Plate 22. Modern transmission towers juxtaposed against the broken remnants of a farm cart.
Asmus08_Part I.indd 42 12/18/08 11:13:00 AM
Copyrighted Material

O V E R V I E W 43
systems that drove demand for electricity up. After the turn of the century, demand picked up more steadily, and the company improved technology to switch back from coal to oil (as California’s supplies of oil were far greater than those of coal). Meanwhile, the San Francisco–based Pacifi c Lighting Company, looking for markets for their newly invented Siemens gas lamp, looked south and saw prom-ising markets in the Los Angeles area. In 1889, three dif-ferent gas and electric fi rms in the region were purchased for $1 million and merged into the Los Angeles Lighting Company.
By 1930, Los Angeles led the nation in natural gas con-sumption, and Pacifi c Lighting, which purchased Southern California Gas Company in 1929, was the largest natural gas utility in the country. A series of mergers and nonenergy business transactions involving fi rms such as Thrifty drug-stores, then a bankruptcy in the early 1990s, and a radical reorganization are all a part of the history of a company that then merged with SDG&E to constitute Sempra Energy.
Plate 23. This hydroelectric facility, serving Southern California Edison, is located on the Kern River.
Asmus08_Part I.indd 43 12/18/08 11:13:01 AM
Copyrighted Material
O V E R V I E W44
This corporation also now owns Southern California Gas Company.
The Public Power Alternative
Among the critics of private utility monopolies that kept growing in size was New York Governor Franklin D. Roosevelt. Outraged that he had to pay ten times the price for electricity in his upstate resort as he did in the state capital of Albany, he pondered how to address this perceived inequity. At that point in time, only 10 percent of rural America had electric service. In contrast, European countries, such as Denmark, had extended electric service to 90 percent of its rural regions. (Of course, Denmark is a small peninsula, whereas the United States is a huge expanse of various types of real estate.) He ultimately came up with the idea that the state’s St. Lawrence River should be harnessed to generate hydroelectricity by a public agency, and the price would be the yardstick against which the prudence of state-regulated utility rates could be judged. As president of the United States, his response to the Great Depression of 1929, and the subsequent outbreak of World War II, would be to apply this state public power model to newly created federal agencies to construct some of the largest power generation facilities in the world and then reserve this low-cost supply to a new cadre of locally owned utility providers.
California’s municipal utilities (table 1) date back to 1887, when the cities of Alameda and Ukiah created munic-ipal lighting districts under the California Constitution’s municipal affairs doctrine. Until Roosevelt pushed hydro-power development by federal agencies, however, these typically small utilities had limited capacity to develop their own cost-effective power supplies to adequately compete against the larger and more sophisticated privately owned electric utilities.
Asmus08_Part I.indd 44 12/18/08 11:13:01 AM
Copyrighted Material

O V E R V I E W 45
TABLE 1 California’s Municipal Utilities
Member Population Established
Alameda 74,259 1887Anaheim 336,000 1895Azusa 45,000 1898Banning 26,000 1895Biggs 1,400 1904Burbank 100,300 1913Colton 17,631 1897Corona 142,000 2003Glendale 200,000 1913Gridley 4,000 1910Healdsburg 10,017 1909Hercules 2002Imperial Irrigation District 22,000 1936Industry 2003Lassen MUD 25,000 1987Lodi 58,850 1910Lompoc 43,284 1923Los Angeles DWP 3,800,000 1925Merced Irrigation District 120,000 1996Modesto Irrigation District 200,000 1923Moreno Valley 2003Needles 5,930 1983Palo Alto 61,500 1898Pasadena 134,800 1906Redding 80,000 1921Riverside 262,300 1911Roseville 83,200 1912SMUD 1,202,100 1947Santa Clara 102,985 1896Shasta Lake 4,000 1948Trinity PUD 15,000 1982Truckee Donner PUD 25,000 1948Turlock Irrigation District 185,839 1923City of Ukiah 15,000 1887
continued ➤
Asmus08_Part I.indd 45 12/18/08 11:13:02 AM
Copyrighted Material

O V E R V I E W46
The fi rst large Californian municipality to successfully abandon the service territory of a private utility was Los Angeles, but it was not easy. Public power advocates took their fi rst steps toward creating their own publicly owned utility way back in 1898, but did not purchase the infrastruc-ture assets of SCE located within its municipal boundaries until 1922. The Los Angeles Department of Water and Power is the largest “muni” in the United States, serving a popula-tion of 3.8 million people in a densely populated urban ser-vice territory of just 456 square miles.
Interestingly enough, San Francisco, which began receiv-ing federally subsidized water from the Hetch Hetchy reservoir around this same time period—and was mandated to create a public power agency—is still served by PG&E. A public power agency was created for San Francisco, but it only serves its municipal facilities. Repeated efforts to extend municipal electricity service to San Francisco residents and businesses have consistently failed, often after expensive referenda polit-ical campaigns. The most recent vote was in 2001, when a $2 million opposition campaign organized by PG&E and its
TABLE 1 (Continued)
Member Population Established
Victorville 69,077 2003City of Vernon 89 1933Co-ops: Anza Plumas–Sierra Co-op 11,000 1937 Surprise Valley Joint Power Agencies: Northern California Power Agency Southern California Power Agency TANC Total 7,483,561 36
Asmus08_Part I.indd 46 12/18/08 11:13:02 AM
Copyrighted Material

O V E R V I E W 47
business allies barely defeated two different ballot measures in an election marred by bizarre voting irregularities.
Sacramento petitioned to follow in the footsteps of Los Angeles and become a municipal utility in 1923. PG&E, however, refused to sell its distribution system even after Sacramento raised the bond money in the 1930s. Finally, after 12 years of litigation, PG&E sold its electric distribution system to the Sacramento Municipal Utility District (SMUD) for $13 million in 1946. Today, SMUD is the sixth largest municipal in the nation in terms of customer base, serving a population of 578,000 in a service territory encompassing 900 square miles. An effort to extend its municipal utility ser-vice to bordering Yolo County was also defeated after an even larger opposition campaign sponsored by PG&E in 2006. All told, roughly 25 percent of Californians receive their electric service from a public power entity, including other public power utility structures, such as public utility districts, irri-gation districts, and rural cooperatives (map 3).
For a detailed history of Sacramento’s history as a municipal utility—as well as additional background on the public power movement—please see the book I coauthored with former SMUD board member Ed Smeloff, titled Reinventing Elec-tric Utilities: Competition, Citizen Action and Clean Power (Smeloff and Asmus 1997). The focus of this book details the story of how SMUD is the only utility in the United States to close a nuclear reactor in response to a public referendum vote, but the book also discusses other utility experiences—both public and private—with nuclear power.
California’s current electricity supply is still dependent upon the federally subsidized hydropower. The Bonneville Power Administration (BPA)—a federal power marketer based in Portland, Oregon—began delivering electricity from the Bonneville Dam on the great Columbia River in 1938. Shortly thereafter, the Grand Coulee Dam was completed in 1941. Roosevelt did approve federal funding for what would become the backbone of the California irrigation system, the
Asmus08_Part I.indd 47 12/18/08 11:13:02 AM
Copyrighted Material

Map 3. California’s current electric service areas. Map shows utilities with retail sales.
Trinity
PCORP (Oregon)
Shasta Lake
Redding
Biggs
Roseville
Gridley
SUMD
Alameda Power &Telecom
LodiMID/PG&E
Expansion Boundary
MIDTID
MEID
Area is serviced by bothSurprise Valley & PCORP
Area served by bothLMUD & Plumas-Sierra
SurpriseValley
LMUD
Truckee-Donner Public Utility District
SPP (Nevada)Mountain Utilities
Valley
LADWP-Owens Valley
SCE
Colton
PasadenaBurbank
GlendaleAzusa
Riverside
Lompoc
Silicon ValleyPower
Palo Alto
Healdsburg
Ukiah
PG&E
LADWPVernon
Anaheim Anza Electric
Escondido
MorenoValley
SDG&EIID
Bear ValleyElectric Company
Banning
PG&E
Needles
Plumas-Sierra
0 100 mi
0 150 km
Asmus08_Part I.indd 48 12/18/08 11:13:02 AM
Copyrighted Material

O V E R V I E W 49
Central Valley Project, which also developed a series of hydro-electric dams on the upper portion of the Sacramento River.
California also receives federally subsidized hydropower from the Western Area Power Administration (WAPA), which broke away from the federal Bureau of Reclamation in 1977 to become the nation’s fourth federal power mar-keter. The U.S. Department of Interior also markets feder-ally subsidized hydropower from humongous dams such as the Hoover Dam on the lower Colorado River in Arizona, considered the world’s largest hydroelectric facility between 1939 and 1949.
Public power comes in many permutations. Beyond a municipal utility district, business structures available to deliver electricity include rural cooperatives as well as public utility districts and irrigation districts. All three of these util-ity structures are an outgrowth of efforts to provide services to parts of the country that were not attractive to profi t- seeking private utilities. Whereas rural cooperatives were authorized by federal laws passed in 1935, public utility dis-tricts and irrigation districts were created by the California Legislature. A public utility district is akin to a municipal utility district, except it can include more than one county and is typically created in rural regions. Likewise, irrigation districts are authorized by state government to provide water for farming communities. They are also authorized to gener-ate electricity to power their irrigation systems.
A rural cooperative is just like any other cooperative. It is a private business, but it is owned by its customers instead of shareholders.
The Colorful History of the Plumas–Sierra Rural Cooperative
Perhaps one of the most interesting rural cooperatives in California is the one established in 1937 in Plumas and Sierra Counties (pl. 24). (That same year, the Surprise Valley rural
Asmus08_Part I.indd 49 12/18/08 11:13:02 AM
Copyrighted Material
O V E R V I E W50
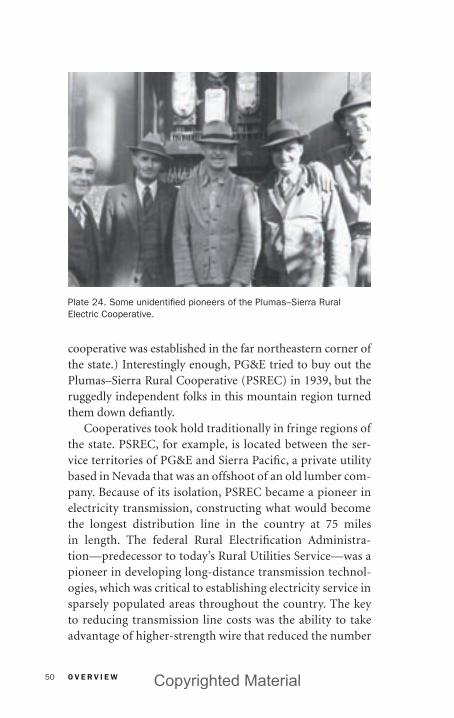
cooperative was established in the far northeastern corner of the state.) Interestingly enough, PG&E tried to buy out the Plumas–Sierra Rural Cooperative (PSREC) in 1939, but the ruggedly independent folks in this mountain region turned them down defi antly.
Cooperatives took hold traditionally in fringe regions of the state. PSREC, for example, is located between the ser-vice territories of PG&E and Sierra Pacifi c, a private utility based in Nevada that was an offshoot of an old lumber com-pany. Because of its isolation, PSREC became a pioneer in electricity transmission, constructing what would become the longest distribution line in the country at 75 miles in length. The federal Rural Electrifi cation Administra-tion—predecessor to today’s Rural Utilities Service—was a pioneer in developing long-distance transmission technol-ogies, which was critical to establishing electricity service in sparsely populated areas throughout the country. The key to reducing transmission line costs was the ability to take advantage of higher-strength wire that reduced the number
Plate 24. Some unidentifi ed pioneers of the Plumas–Sierra Rural Electric Cooperative.
Asmus08_Part I.indd 50 12/18/08 11:13:02 AM
Copyrighted Material
O V E R V I E W 51
of necessary poles per mile and to develop systems-wide planning rather than pole-by-pole additions. According to Bob Marshall, general manager of PSREC, “the Rural Elec-trifi cation Administration was one of the best government programs in history.” Despite this endorsement, Marshall’s acknowledged reliability was spotty. Word has it that in Plumas and Sierra counties, locals would say, “Hold up a candle to see if the light is on.” The morning meeting place for line workers was a local bar, and the struggling coopera-tive took 20 years to break even.
Marshall also freely admitted that his cooperative, as well as many others, had its fair share of skullduggery. “Our fi rst manager was found guilty of embezzling,” he pointed out with a chuckle. One of the more amusing episodes involved a subsequent buyout effort by PG&E prompted by the fact that, as Marshall put it, “our reliability was gar-bage.” In his words, the attitude of PG&E was something like “thank you for much, it’s now time for the profession-als to take over.”
Legend has it that the cooperative accounting clerk that was double-checking the votes on whether locals wanted to abandon the cooperative in lieu of PG&E kept stuffing the “sell” ballots into his shirt sleeves. “Rumor has it he had so many of the ballots hidden in his clothes, that he crinkled when he walked over to the bathroom,” claimed Marshall. Yet another challenge to the coopera-tive movement came in the 1950s and 1960s during the Red scare, when some Americans viewed rural coopera-tives as part of a Communist conspiracy. In fact, a pro-posed rural cooperative proposed in Twentynine Palms in southern California was defeated on those grounds, as the sentiment of a nearby Marine base shaped local opinion to reject that move.
Things began looking up for the cooperative when it was able to obtain low-cost hydroelectricity from the Central Valley Project up from the dam at Shasta, though
Asmus08_Part I.indd 51 12/18/08 11:13:03 AM
Copyrighted Material
O V E R V I E W52
PG&E fought these deliveries to the small cooperative for a decade. For a time, the cooperative could go back and forth between PG&E and Sierra Pacifi c for backup power, a situation the savvy cooperative took advantage of, admits Marshall.
After Marshall arrived in 1986, the cooperative plugged into new business ventures, including satellite TV and Inter-net service. “Where is our membership being underserved? That’s where our business opportunities lie,” said Marshall. Building upon the legacy of rural cooperatives and innova-tion in the wires side of the electricity business, the coopera-tive won an award from the Cooperative Research Network in 2007 for utilizing state-of-the-art telecommunications to synchronize and optimize its interconnections with PG&E and Sierra Pacifi c.
Among the other success stories at this cooperative is its geothermal heat pump program, the most successful program in the entire country. More than 30 percent of new homes in its service territories rely upon this renew-able energy source of heating and cooling. Because renew-able energy supply is cheaper in Nevada than in California, PSREC is looking to build 11 miles of new transmission lines to access a 22.5 megawatt wind farm. When completed, PSREC will become the smallest transmission utility in the nation, another feather in its big cap.
Populations Boom, Driving Energy Use Up and Up
We can blame World War II for the state’s ascent into a technological wonderland when it comes to energy, driven by rapid increases in demand, setting up a clash in values between energy and environment. That is when California’s population exploded (fi g. 4), and an enormous infl ux of humanity continued unabated through the 1980s. Between
Asmus08_Part I.indd 52 12/18/08 11:13:03 AM
Copyrighted Material
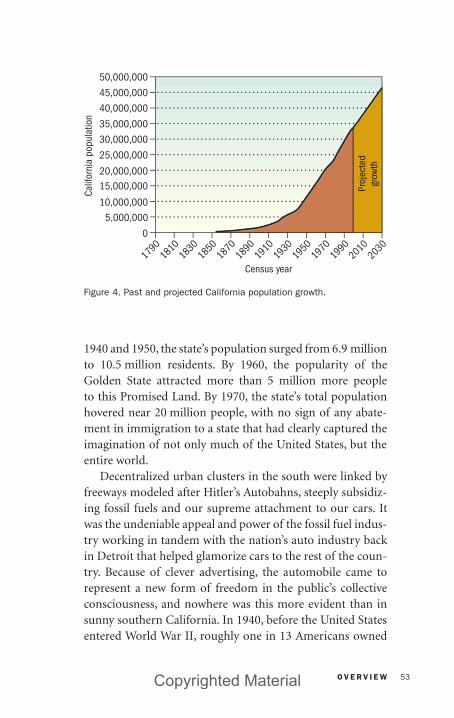
O V E R V I E W 53
1940 and 1950, the state’s population surged from 6.9 million to 10.5 million residents. By 1960, the popularity of the Golden State attracted more than 5 million more people to this Promised Land. By 1970, the state’s total population hovered near 20 million people, with no sign of any abate-ment in immigration to a state that had clearly captured the imagination of not only much of the United States, but the entire world.
Decentralized urban clusters in the south were linked by freeways modeled after Hitler’s Autobahns, steeply subsidiz-ing fossil fuels and our supreme attachment to our cars. It was the undeniable appeal and power of the fossil fuel indus-try working in tandem with the nation’s auto industry back in Detroit that helped glamorize cars to the rest of the coun-try. Because of clever advertising, the automobile came to represent a new form of freedom in the public’s collective consciousness, and nowhere was this more evident than in sunny southern California. In 1940, before the United States entered World War II, roughly one in 13 Americans owned
Figure 4. Past and projected California population growth.
5,000,000
Census year
0
1790
1810
1830
1850
1870
1890
1910
1930
1950
1970
1990
2010
2030
10,000,000
15,000,00020,000,000
25,000,000
30,000,000
35,000,000
40,000,000
45,000,000
50,000,000Ca
lifor
nia
popu
latio
n
Proj
ecte
dgr
owth
Asmus08_Part I.indd 53 12/18/08 11:13:03 AM
Copyrighted Material
O V E R V I E W54
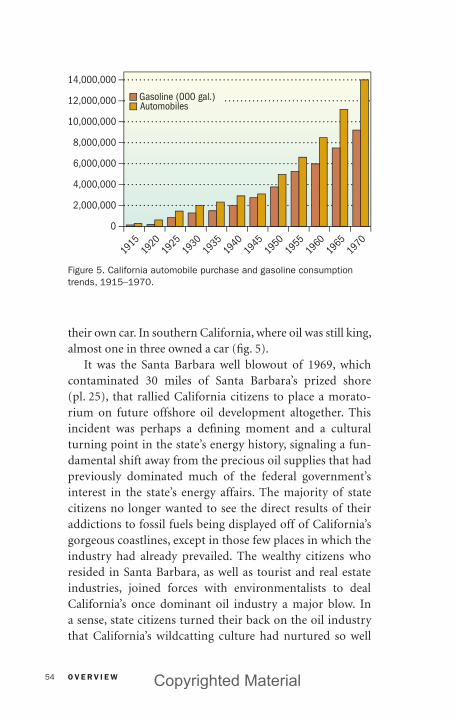
their own car. In southern California, where oil was still king, almost one in three owned a car (fi g. 5).
It was the Santa Barbara well blowout of 1969, which contaminated 30 miles of Santa Barbara’s prized shore (pl. 25), that rallied California citizens to place a morato-rium on future offshore oil development altogether. This incident was perhaps a defi ning moment and a cultural turning point in the state’s energy history, signaling a fun-damental shift away from the precious oil supplies that had previously dominated much of the federal government’s interest in the state’s energy affairs. The majority of state citizens no longer wanted to see the direct results of their addictions to fossil fuels being displayed off of California’s gorgeous coastlines, except in those few places in which the industry had already prevailed. The wealthy citizens who resided in Santa Barbara, as well as tourist and real estate industries, joined forces with environmentalists to deal California’s once dominant oil industry a major blow. In a sense, state citizens turned their back on the oil industry that California’s wildcatting culture had nurtured so well
Figure 5. California automobile purchase and gasoline consumption trends, 1915–1970.
14,000,000
12,000,000
10,000,000
8,000,000
6,000,000
4,000,000
2,000,000
0
1915
1920
1925
1930
1935
1940
1945
1950
1955
1960
1965
1970
Gasoline (000 gal.)Automobiles
Asmus08_Part I.indd 54 12/18/08 11:13:03 AM
Copyrighted Material

O V E R V I E W 55
in earlier times and that had helped feed the state’s rapid economic fortunes.
The offshore oil derricks near Santa Barbara are stark reminders that ecological and recreational concerns did not always win in California’s schizophrenic relationship to energy. Drive around on California’s maze of freeways in southern California, and you can fi nd ample evidence of our collective energy past, with oil wells still pumping away among the cotton fi elds near Bakersfi eld or along Hwy. 101 near San Ardo in southern Monterey County. In fact, these freeways themselves are products of the state’s early oil development. Hollywood helped glamorize these cars, which quickly came to represent freedom, independence, and seem-ingly endless upward mobility.
A state in a constant state of reinvention and hype, California has many identities: the magical sheen of Hollywood; the gadgetry of Silicon Valley; and the bohe-mian ways of that Baghdad by the Bay, San Francisco. Californians do not think of themselves as coming from a petroleum state. Even agriculture trumps oil when it comes to self-identity in California. Petro-politics, nevertheless, forever changed the map of California in the twentieth
Plate 25. The Santa Barbara oil spill of 1969 turned public opinion against California’s oil industry.
Asmus08_Part I.indd 55 12/18/08 11:13:04 AM
Copyrighted Material
O V E R V I E W56
century and left a lasting imprint on the state’s housing, employment, and recreation trends.
And then came nuclear power.
Chic Nuclear Power
SCE was the fi rst private utility in the United States to generate electricity from a nuclear reactor not earmarked for military purposes. This momentous event occurred in 1956 at the Santa Susana Experimental Station in Ventura County. Relying upon a sodium coolant, the most power this research and develop-ment (R&D) project ever produced was 7.5 megawatts, less than 1/100th the size of today’s typical utility-scale reactors. On November 12, 1957, nearby Moorpark became the fi rst small town in the world to be completely powered by nuclear energy from this experimental nuclear reactor. The utility trumpeted this accomplishment as the launching of the “Age of Atomic Energy,” when electricity, it was widely predicted by nuclear engineers, would literally “be too cheap to meter.”
Not to be outdone by its southern competitor, PG&E unveiled the Vallecitos Nuclear Power Plant near Pleasanton in 1957. Operated jointly by GE and PG&E, and fi nanced entirely with private capital, this 30-megawatt reactor boiled water to run its turbine. In 1963, the 63-megawatt Humboldt Bay Nuclear Plant, located just south of Eureka, came online. Also developed by PG&E, this reactor continued to operate until 1976, when a previously unknown earthquake fault was discovered just off the coast, and this plant too is closed down. (By the way, on July 26, 1959, the Santa Susana mini-reactor suffered a partial core meltdown, releasing radioac-tivity and requiring closure in February 1964.)
California’s fi rst large-scale nuclear reactor to operate commercially (pl. 26) came online in northern San Diego County near the Camp Pendleton U.S. Marine Corps Base in 1967. Known as “Unit One” of the San Onofre Nuclear
Asmus08_Part I.indd 56 12/18/08 11:13:04 AM
Copyrighted Material
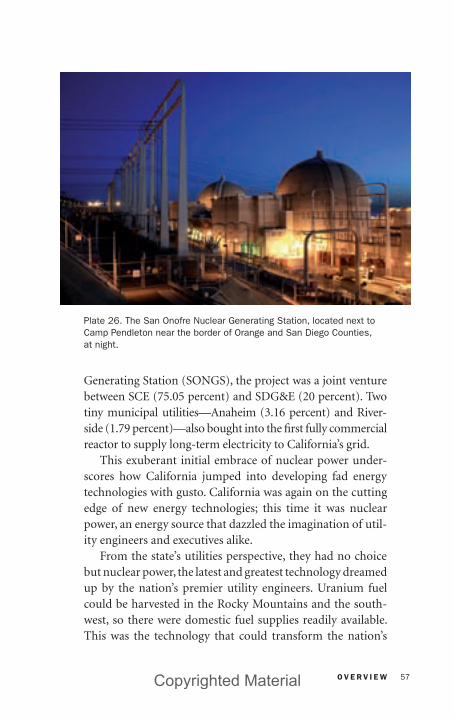
O V E R V I E W 57
Generating Station (SONGS), the project was a joint venture between SCE (75.05 percent) and SDG&E (20 percent). Two tiny municipal utilities—Anaheim (3.16 percent) and River-side (1.79 percent)—also bought into the fi rst fully commercial reactor to supply long-term electricity to California’s grid.
This exuberant initial embrace of nuclear power under-scores how California jumped into developing fad energy technologies with gusto. California was again on the cutting edge of new energy technologies; this time it was nuclear power, an energy source that dazzled the imagination of util-ity engineers and executives alike.
From the state’s utilities perspective, they had no choice but nuclear power, the latest and greatest technology dreamed up by the nation’s premier utility engineers. Uranium fuel could be harvested in the Rocky Mountains and the south-west, so there were domestic fuel supplies readily available. This was the technology that could transform the nation’s
Plate 26. The San Onofre Nuclear Generating Station, located next to Camp Pendleton near the border of Orange and San Diego Counties, at night.
Asmus08_Part I.indd 57 12/18/08 11:13:04 AM
Copyrighted Material
O V E R V I E W58
nuclear weapon legacy with Japan and World War II into a story with a happy ending with the so-called “Atoms for Peace” movement. Among the biggest proponents of nuclear power as part of a mass electrifi cation policy was Chauncey Starr, who founded the Palo Alto–based Electric Power Research Institute in 1973, a utility-fi nanced think tank that pooled utility investments in R&D.
This was the heyday for California’s and the nation’s electric utilities, as their plans for fi nding the resources to keep the lights on were typically rubber-stamped by state regulators. The business of electricity was managed by a small fraternity akin to a secret cult. Terms such as “capac-ity factors” or “load-building” or “spinning reserves” befud-dled most ordinary citizens. The electricity business was not only dense, but it was full of confusing acronyms. Decisions that carried incredible economic and environmental conse-quences were made—more often than not—without little fanfare or public debate.
Beginning in the 1970s and continuing through the 1980s, California’s population growth shifted again, this time away from the pricey coast and into the more affordable inland valleys. In the south, suburban sprawl, supported by freeway infrastructure, fanned out to Riverside and San Bernardino, placing people farther and farther into the desert and heat. Further north, it was the Central Valley, and cities such as Sacramento, that would boom as residents sought relief from some of the highest real estate prices in the land, especially along the coast. This push inward, however, exacerbated energy shortages, as air conditioning demand skyrocketed, increasing the chance of power shortages during late summer, when hydro capacity was at its lowest point, and tempera-tures running through California’s interior often surpassed the century mark.
As more and more people fi led into California, the state’s electric utilities—whether privately or publicly owned— continually sought new supplies. Concerns over fi sh
Asmus08_Part I.indd 58 12/18/08 11:13:05 AM
Copyrighted Material
O V E R V I E W 59
populations and other environmental concerns, nonetheless, limited large-scale hydro projects beyond those already con-structed. California banned oil as a fuel for electricity genera-tion, despite the fact there was ample local supplies. California also halted construction of any future in-state, coal-fi red power plants because of concerns about air pollution.
At one point, things got so bad that plans were on the drawing boards for a fl eet of nuclear reactors up and down the Central Valley and scattered along California’s beloved coastline (map 4)! All told, the state’s utilities reported that California would require 60 nuclear power plants by the year 2000 to boost the state’s total electrical capacity to over 100,000 megawatts. (California’s peak demand capacity in 2006 was approximately 67,000 megawatts.)
While electric utilities were gung ho on the virtues and prospects of nuclear power, opposition to nuclear power was growing among the ranks of a budding environmental movement gaining critical traction in California.
Anti-Nuclear Movement Finds a Champion in State Legislature
Charles Warren was elected to California’s State Assembly in 1963 to represent downtown Los Angeles. He soon found himself serving on the legislative committees overseeing California’s land use policies. At that time, utilities seeking to construct new nuclear power plants needed to get a green light from local governments. Complex and new technologies such as nuclear power were quite a challenge for these local governments, so decision making was slow. Utilities were worried that they would never be able to build the number of necessary nuclear reactors in time if they could not speed up and streamline the power plant approval process.
In 1970, the state’s private utilities came to the California Legislature seeking to preempt local land use decisions on power plants with a “one-stop” state government siting
Asmus08_Part I.indd 59 12/18/08 11:13:05 AM
Copyrighted Material

0 100 mi
0 150 km
HumboldtBay
Tehama South
ButtesExisting nuclear plantsNuclear plants under constructionMost likely sites for nuclear plants
Yuba City
Rancho Seco
Modesto/Waterford
Merced
Madera
Los Banos
Kettleman City
WascoDiablo Canyon
San Onofre
Sundesert
Vidal
Map 4. Projections of California nuclear supply scenarios developed in 1979 for the year 2000.
Asmus08_Part I.indd 60 12/19/08 3:22:11 PM
Copyrighted Material

O V E R V I E W 61
agency. Senator Alquist agreed to carry a bill on behalf of the utilities. When the bill came before Warren’s land use com-mittee, he sent the proposed legislation to “interim study.” In many cases, the interim study status is akin to killing a bill. In this case, however, the RAND Corporation—a Santa Monica think tank best known for its national defense expertise, but which was diversifying into domestic issues—was hired with outside funding to prepare an independent analysis of nuclear power prospects for California.
When the RAND Corporation released its report to the newly created Subcommittee on Energy Reform in 1972, the fi rst state legislative body devoted to energy matters, “my life changed,” recalled Warren, the committee’s new chair-man. “The fundamental conclusions of the report were that current utility practices could be described as ‘demand accommodation,’ with energy consumption increasing 6 to 7 percent annually. At that rate, the report noted, utilities had to double their electricity generation every 10 to 11 years,” Warren said. The same report also highlighted major con-cerns about nuclear power, including the potential for melt-downs and the challenges of waste disposal.
“At that point in time, the downsides of nuclear power were not well-known,” recalled Warren. “With the RAND report in hand, our Subcommittee concluded that the utility business-as-usual demand accommodation would have to be abandoned, and that California should investigate conserva-tion savings.” Warren introduced legislation that would create a new state agency—the California Energy Commission—with equal power to the California Public Utilities Commis-sion (CPUC), but with a focus on ways to save energy and to encourage public participation in all of its proceedings. As a compromise, the Alquist one-stop siting idea was incor-porated into the same bill. Then, Governor Ronald Reagan vetoed the bill as “dangerous social engineering”! That same year, a ballot measure proposing a moratorium on nuclear power in the state brought the same issue to a public vote,
Asmus08_Part I.indd 61 12/18/08 11:13:06 AM
Copyrighted Material

O V E R V I E W62
but it too failed, as grassroots activists could not overcome the clout of state utilities.
Then came the Yom Kippur War, the oil embargo, and the energy crisis of 1973 (pl. 27). “Suddenly, energy was the topic of the day.” Warren then became chairman of the Energy and Diminishing Resources Committee, and he reintroduced his same piece of legislation. This time, Reagan convened nego-tiations with utilities, and to Warren’s surprise, they only suggested minimal changes to the legislation that had been previously vetoed. The bill passed by a single vote in both the Assembly and Senate, and Reagan signed it into law in 1974.
During this approximate time period, SDG&E, the small-est of California’s three private utilities, had quietly begun planning to construct the Sundesert Nuclear Power Plant, which was to feature two 950-megawatt reactors. The utility purchased land in 1975 near the small city of Blythe near the eastern border of California, just 10 miles from the Colorado River. This was the fi rst power “thermal” plant to come before the newly created California Energy Commission’s one-step
Plate 27. Long lines of cars at service stations were the norm in 1973.
Asmus08_Part I.indd 62 12/18/08 11:13:06 AM
Copyrighted Material

O V E R V I E W 63
licensing approval process. (The term “thermal” refers to any electricity generator that relies upon heat to create steam to drive a turbine.) The Los Angeles Department of Water and Power and three small southern California municipal utili-ties (Glendale, Pasadena, and Riverside) were the proposed partners in the project, but SDG&E was the biggest player, proposing to consume half of the total output.
The California Energy Commission gave the project a green light, but only after reducing the project’s size in half and saddling it with numerous conditions. A series of legal battles ensued, but ultimately the project was rejected by the State Assembly on the basis of lingering concerns about nuclear waste storage. It did not help that the proposed project was located near an earthquake fault line.
Nuclear Victories—and Defeats
This battle over regulatory authority over nuclear power continued for years, with the utilities arguing that any state moratorium on nuclear power violated federal jurisdiction over nuclear energy with the recently created U.S. Nuclear Regulatory Commission. Surprisingly, the U.S. Supreme Court sided with the State of California, rejecting the arguments of California private utilities and the federal government. Inter-estingly enough, the rationale for this momentous decision did not rest with safety issues, as the courts agreed these sorts of issues fell under the purview of the federal regulation. The U.S. Supreme Court instead focused on the ability of state gov-ernment offi cials to reject nuclear power plants on the basis of economics and land use concerns. As was the case with oil, California was once again defi ning who had jurisdiction over energy sources—oil and now nuclear—that have transformed world history.
Proposition 15, yet another antinuclear ballot measure, failed again in 1976. Yet the key provision of this ballot
Asmus08_Part I.indd 63 12/18/08 11:13:06 AM
Copyrighted Material

O V E R V I E W64
measure—prohibiting any future licenses for nuclear reac-tors until there was proof of an effective radioactive waste disposal system—would become offi cial state policy despite the loss at the polls. Just before Proposition 15 failed at the polls, new Governor Jerry Brown signed a law that Warren wrote and pushed through the State Legislature that did essentially the same thing as the ballot measure, setting in place a de facto moratorium on nuclear power in California, which remains in place today.
Despite this major setback for the nuclear power indus-try, California would witness additions to the state’s nuclear energy portfolio, as nuclear reactors that had already been in the utility resource plan cue were allowed to proceed. In southern California, Units 2 (1,070 megawatts) and 3 (1,080 megawatts) of SONGS came online in 1983 and 1984, respectively, and continue to operate today. The SONGS Unit 1 was closed in 1992 when its owners declined to invest $125 million in necessary repairs. PG&E added to the state’s nuclear capacity in 1985 and 1986 with Unit 1 (1,073 mega-watts) and Unit 2 (1,087 megawatts) of the Diablo Canyon nuclear reactor, located near San Luis Obispo on California’s central coast (pl. 28).
The only other nuclear reactor to come online in California was the 913-megawatt Rancho Seco nuclear reac-tor, which came online in 1975 and was the only nuclear reactor in California to be completely owned by a municipal utility serving Sacramento. In contrast to SONGS and Diablo Canyon, however, Rancho Seco’s performance was less than stellar. A near meltdown, and rate increase after rate increase, took its toll on SMUD’s ratepayers’ patience. After a long and controversial battle between local activists and the national nuclear reactor lobby, Rancho Seco became the only nuclear power plant in the entire country to be closed by a public vote in 1989.
California’s energy history consists of many high and low moments for nuclear advocates. This was the fi rst state to
Asmus08_Part I.indd 64 12/18/08 11:13:06 AM
Copyrighted Material
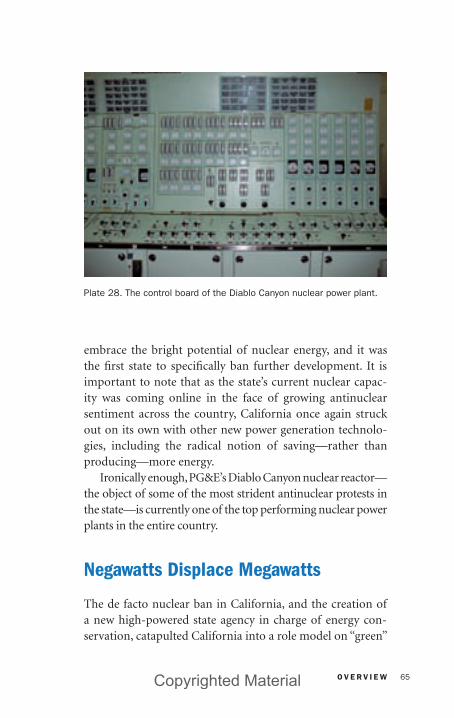
O V E R V I E W 65
embrace the bright potential of nuclear energy, and it was the fi rst state to specifi cally ban further development. It is important to note that as the state’s current nuclear capac-ity was coming online in the face of growing antinuclear sentiment across the country, California once again struck out on its own with other new power generation technolo-gies, including the radical notion of saving—rather than producing—more energy.
Ironically enough, PG&E’s Diablo Canyon nuclear reactor—the object of some of the most strident antinuclear protests in the state—is currently one of the top performing nuclear power plants in the entire country.
Negawatts Displace Megawatts
The de facto nuclear ban in California, and the creation of a new high-powered state agency in charge of energy con-servation, catapulted California into a role model on “green”
Plate 28. The control board of the Diablo Canyon nuclear power plant.
Asmus08_Part I.indd 65 12/18/08 11:13:07 AM
Copyrighted Material
O V E R V I E W66
energy policy in the 1970s. Young scientists and activists such as David Goldstein, inspired by older physicists such as Art Rosenfeld, began to challenge the supply plans presented to the state’s utilities own resource plans.
Rosenfeld helped convene a meeting at Princeton in 1974 that brought the best and brightest minds in physics to think creatively about the energy conundrum facing the United States. “By the end of our fi rst week of discussions, we real-ized we had blundered into one of the world’s largest oil and gas fi elds. The energy was buried, in effect, in the buildings of our cities, the vehicles on the roads, and the machines in our factories,” recalled Rosenfeld. At a hearing before Warren’s energy committee in 1975, PG&E was so shocked by testimony by Rosenfeld that California’s energy consumption could be cut from 5 to 1.2 percent that they called the University of California at Berkeley and asked that he be fi red immediately. That never happened, of course, but PG&E’s outrage ultimately turned to respect, as actual energy growth did slow down to 2.2 percent, less than half of what the utility had projected.
Portrayed in the best possible light in the 1984 book Dynamos and Virgins, authored by David Roe with the Envi-ronmental Defense Fund (now Environmental Defense), these bright and persuasive academics built a credible case for building “conservation power plants” by simply making buildings and appliances that consumed less energy, defray-ing the need for constructing traditional power plants. Roe also became enamored by the idea of energy conservation, questioning utilities such as PG&E over their assumptions about future energy consumption trends. Here is a telling quote from Roe’s book:
My parents did not doubt the truth of any single fact that I
was telling them. But the implication of what I was saying
was that Pacifi c Gas & Electric was being grossly misman-
aged, to its own detriment, by the eminently respectable and
worldly businessmen who were peers of my parents’ friends.
Asmus08_Part I.indd 66 12/18/08 11:13:07 AM
Copyrighted Material

O V E R V I E W 67
My parents didn’t know any PG&E offi cers personally, except
for the chairman of the board—he and my father were mem-
bers of the same club, and infrequently saw each other at
lunch—but the men downtown who had risen to the top of
such an established institution must have known their busi-
ness. Details might slip from time to time, but improvements
on the scale I was expounding were inherently improbable.
Could we really claim to know more about the utility business
than thirty-two fl oors worth of well-paid utility executives?
“If what you saw is right,” my father said, “why isn’t PG&E
already doing it?”
It was exactly the right question.
—Roe 1984:66–67
Among the more noteworthy early fi ndings of Rosenfeld, Goldstein, Roe, and other conservation and effi ciency advo-cates was that the most energy-effi cient refrigerators on the market cost about the same as the least energy-effi cient. If California implemented an effi ciency standard that elimi-nated half of the wasteful fridges, the state could displace one-and-a-half nuclear reactors (i.e., 1,500 megawatts). This was one among many state effi ciency standards that helped eliminate the need for the army of nuclear reactors that the state’s utilities had projected coming online in California over the next several decades. Generally speaking, refrigera-tors are the largest single electricity consumer in a typical residence, so making better refrigerators was a logical early step in the war against wasteful energy practices. National refrigerator standards alone have offset the need to construct 130,000 megawatts of new power plant capacity nationwide (fi g. 6), a fi gure that represents two and half Californias’ worth of total electricity consumption!
Soon, new software programs were developed that made it easy for residents or businesses in different climate zones to calculate energy savings from a growing list of energy-saving devices and practices. Thus, a whole cottage industry sprung
Asmus08_Part I.indd 67 12/18/08 11:13:07 AM
Copyrighted Material

O V E R V I E W68
up, with growing numbers of entrepreneurs inventing new ways to do more with less.
Just how much progress has California made through its energy effi ciency efforts in the electricity sector, such as the appliance and building standards put into place in 1976 and 1978, respectively? If California had followed the path of the rest of the country, the state would have required 50 addi-tional medium-sized, 500-megawatt power plants. Roughly half of these energy savings can be attributed to the state’s aggressive energy effi ciency programs (fi g. 7).
Luckily, California’s leadership on energy matters often is imported by other states and even nations. Its appliance energy effi ciency standards were ultimately copied by the federal government in 1987. The state’s building standards have recently been copied by Russia and China. A new code governing building construction in Russia modeled after California’s pioneering standards is dropping energy con-sumption by 40 percent, and similar, if not more aggressive, savings are expected in China. It is important to note that
Figure 6. Refrigerator energy use in the United States over time, highlighting the role of California appliance standards.
2000 25
20
15
10
5
0
1800
1600
1400Refrigeratorsize (cubic ft)
Energy use perunit (kWh/year) 75% reduction in
30 yrs = 5%/yr
1st federalstds ‘92
1200
1000
800
600
400
200
0
1947
1952
1957
1962
1967
1972
1977
1982
1987
1997
2002
1992
Aver
age
ener
gy u
se p
er u
nit s
old
(kW
h/yr
)
Refri
gera
tor v
olum
e (c
ubic
feet
)
Asmus08_Part I.indd 68 12/18/08 11:13:08 AM
Copyrighted Material

O V E R V I E W 69
California continually updates and upgrades these standards. For example, a 2005 update for buildings and appliances will avoid the need to build fi ve 500-megawatt fossil fuel power plants over the next decade.
Another innovation on effi ciency in California was the novel idea of decoupling utility profi ts from electricity sales. Without such mechanisms, electric utilities still have fi nan-cial incentives to sell us more, rather than less, electricity. Five other states (Oregon, Utah, North Carolina, Ohio, and Maryland) have now followed suit on decoupling and sev-eral others (Idaho, Washington, Wisconsin, New York, New Jersey, and New Mexico) are considering proposals to put into place this important incentive to foster greater effi ciency when it comes to energy supplies.
Although critics of California’s energy policies often malign this state for its high retail electricity rates, the actual bills that residents and businesses pay have, in fact, declined over time. Since 1973, energy bills in California have aver-aged $100 less than those of the nation as a whole. All told, California’s economy receives a boost of between $7 and
Figure 7. California’s peak electricity demand, 1965–2004.
140At 5% growth rateActual (2.2% year)If CA had grown at U.S. rate
120
100
80
60
40
20
0 0
1965
1969
1973
1977
1981
1985
1989
1993
1997
2001
GWGW
120
65
55
Asmus08_Part I.indd 69 12/18/08 11:13:08 AM
Copyrighted Material
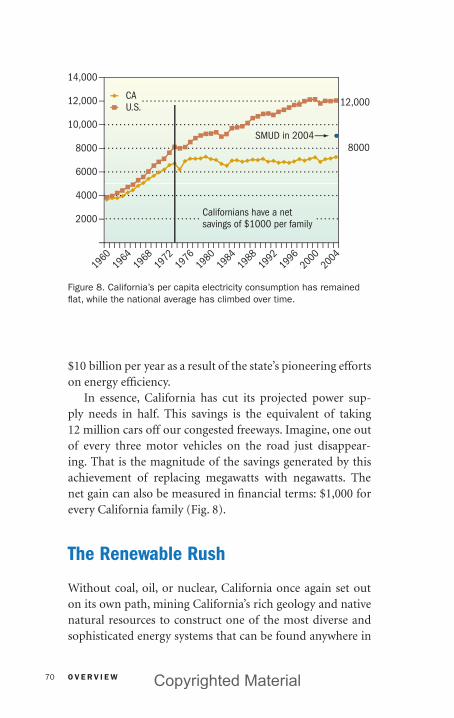
O V E R V I E W70
$10 billion per year as a result of the state’s pioneering efforts on energy effi ciency.
In essence, California has cut its projected power sup-ply needs in half. This savings is the equivalent of taking 12 million cars off our congested freeways. Imagine, one out of every three motor vehicles on the road just disappear-ing. That is the magnitude of the savings generated by this achievement of replacing megawatts with negawatts. The net gain can also be measured in fi nancial terms: $1,000 for every California family (Fig. 8).
The Renewable Rush
Without coal, oil, or nuclear, California once again set out on its own path, mining California’s rich geology and native natural resources to construct one of the most diverse and sophisticated energy systems that can be found anywhere in
Figure 8. California’s per capita electricity consumption has remained fl at, while the national average has climbed over time.
14,000
SMUD in 2004
12,000
8000
Californians have a netsavings of $1000 per family
12,000
10,000
8000
6000
4000
2000
1960
1964
1968
1972
1976
1980
1984
1988
1992
1996
2000
2004
CAU.S.
Asmus08_Part I.indd 70 12/18/08 11:13:08 AM
Copyrighted Material

O V E R V I E W 71
the world. In the course of just fi ve years, a combination of tax credits, long-term power purchase contracts, and state technical assistance jump-started the wind, solar, geother-mal, and biomass power industries.
The passage of the federal Public Utility Regulatory Policy Act (PURPA) in 1978 allowed private companies to build new power plants relying upon renewable fuels. California was the most aggressive state when it came to implementing PURPA. This law jump-started the entire renewable energy industry in the United States, especially California, because it required electric utilities to purchase power from these independent power producers at “avoided cost” rates. Among the incentives offered for wind power developers were generous state investment tax credits (which augmented federal tax credits), standard long-term utility power purchase contracts that featured fi xed prices during the fi rst 5 to 10 years of operation, and a state-funded wind resource assessment that identifi ed California’s best wind energy opportunities.
California promoted solar, wind, geothermal, and bio-mass energy sources like no other state in the country, with its own tax credits and attractive, stable long-term power prices for private generators to build these new power plants (pl. 29). These incentives were put forward because the costs of utility-owned nuclear reactors, such as PG&E’s Diablo Canyon, had greatly exceeded original estimates. Ratepayers were required to cover $5 billion in cost over-runs for this single nuclear reactor, a fact that led to a unique performance-based cost recovery scheme. Opening up the power generation sector to competition spawned an entire domestic renewable energy industry in California, acceler-ating the deregulation of wholesale electricity generation throughout the country.
At this point in time, introducing competition into the power plant building business was seen as a way to let ratepay-ers off the hook when something went wrong at an electricity
Asmus08_Part I.indd 71 12/18/08 11:13:08 AM
Copyrighted Material

O V E R V I E W72
generating station. On the watch of Governor Jerry Brown, California embarked upon a series of wild experiments with new cleaner and smaller power sources that stunned utilities nationwide. Wall Street shysters and environmentalists were suddenly working together as California lurched forward into an untested energy future.
For example, approximately $1 billion was diverted from federal and state taxes into wind farms between 1981 and 1985 to jump-start the world’s wind power industry in California, currently the world’s most successful renew-able energy business. The end result of this effort was the addition of 1,700 megawatts of new wind power capacity
Plate 29. This 100 kW wind turbine was the mainstay of U.S. Windpower, which later changed its name to Kenetech.
Asmus08_Part I.indd 72 12/18/08 11:13:08 AM
Copyrighted Material
O V E R V I E W 73
to the state’s power plant portfolio, which represented over 90 percent of the world’s total wind power capacity. Both federal and state investment tax credits were terminated in 1986, however, because of publicity surrounding the abuse of this investment tax shelter, perhaps the last of the great tax scams in recent U.S. history. Congressman Pete Stark of Hayward led the fi ght to terminate the investment tax credits by proclaiming, “These aren’t wind farms; they’re tax farms.”
Once again, California’s effervescence over new tech-nologies would engender a backlash. Yet California’s public policies created a global market for wind as well as other renewable energy technologies. A valid claim can be made that California’s policies to promote renewable energy tech-nologies was the most successful commercialization effort in the history of the United States.
California also offered attractive utility power pur-chase contracts and other public support for other renew-able energy technologies that yielded these significant developments:
� California pushed new solar thermal electric systems known as “parabolic troughs” into commercial opera-tion. At present, nine distinct solar thermal trough systems generate 354 megawatts of peak power in smoggy southern California. A total of 650,000 para-bolic mirrors stretch over 1,000 acres of the desolate Mojave Desert. At this site, originally developed by a joint Israeli–U.S. venture beginning in 1983, expan-sion plans have been delayed for years despite the fact that the performance of solar thermal parabolic troughs has been excellent, even after more than 10 years of operation.
� Geothermal power was also pioneered here (pl. 30), though in this case, the world’s largest geothermal facil-ity had been originally constructed back in 1960 up in
Asmus08_Part I.indd 73 12/18/08 11:13:09 AM
Copyrighted Material
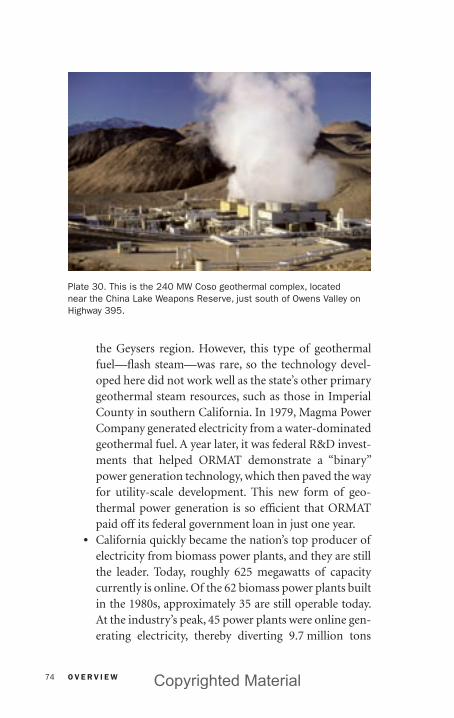
O V E R V I E W74
the Geysers region. However, this type of geothermal fuel—fl ash steam—was rare, so the technology devel-oped here did not work well as the state’s other primary geothermal steam resources, such as those in Imperial County in southern California. In 1979, Magma Power Company generated electricity from a water-dominated geothermal fuel. A year later, it was federal R&D invest-ments that helped ORMAT demonstrate a “binary” power generation technology, which then paved the way for utility-scale development. This new form of geo-thermal power generation is so effi cient that ORMAT paid off its federal government loan in just one year.
� California quickly became the nation’s top producer of electricity from biomass power plants, and they are still the leader. Today, roughly 625 megawatts of capacity currently is online. Of the 62 biomass power plants built in the 1980s, approximately 35 are still operable today. At the industry’s peak, 45 power plants were online gen-erating electricity, thereby diverting 9.7 million tons
Plate 30. This is the 240 MW Coso geothermal complex, located near the China Lake Weapons Reserve, just south of Owens Valley on Highway 395.
Asmus08_Part I.indd 74 12/18/08 11:13:09 AM
Copyrighted Material

O V E R V I E W 75
of solid urban wood waste from California’s crowded landfi lls.
In each major renewable energy category—solar, wind, geothermal, and biomass—California quickly jumped into the category of global pioneer. It was not always pretty, as anyone who drives to the wind farms near Palm Springs on Hwy. 10 can attest to. However, it was remarkable that a single state—albeit a giant one with a plethora of renewable energy in the northern, southern, eastern, and western parts of the state—could spawn an entire industry in less than a decade. Grants, fi nancing, and expertise from the world over were involved with these pioneering efforts, harshly criticized by the state’s utilities as well as industry skeptics all across the country.
Remarkably, California’s natural history and the corre-sponding energy streams that fl owed from the sun, wind, biomass wastes, and volcanic activity below the surface all provided the basis for a slow transformation of electricity infrastructure that attracted attention all over the world, both for its boldness and its seeming naïveté (fi g. 9).
Figure 9. PURPA gave a large boost to the production of electricity from alternative sources in California.
45,000
Milli
ons
of k
Wh.
40,000
35,000
30,000
25,000
20,000
15,000
10,000
5000
01982 1983 1984 1985 1986 1987 1988 1989 1990
HydroelectricSolarWind powerGeothermalCogeneration
Asmus08_Part I.indd 75 12/18/08 11:13:10 AM
Copyrighted Material
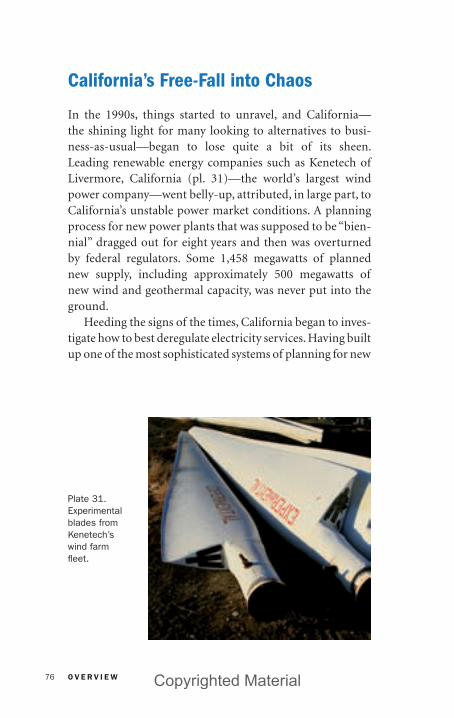
O V E R V I E W76
California’s Free-Fall into Chaos
In the 1990s, things started to unravel, and California—the shining light for many looking to alternatives to busi-ness-as-usual—began to lose quite a bit of its sheen. Leading renewable energy companies such as Kenetech of Livermore, California (pl. 31)—the world’s largest wind power company—went belly-up, attributed, in large part, to California’s unstable power market conditions. A planning process for new power plants that was supposed to be “bien-nial” dragged out for eight years and then was overturned by federal regulators. Some 1,458 megawatts of planned new supply, including approximately 500 megawatts of new wind and geothermal capacity, was never put into the ground.
Heeding the signs of the times, California began to inves-tigate how to best deregulate electricity services. Having built up one of the most sophisticated systems of planning for new
Plate 31. Experimental blades from Kenetech’s wind farm fl eet.
Asmus08_Part I.indd 76 12/18/08 11:13:10 AM
Copyrighted Material

O V E R V I E W 77
resources, California was now turning from this command-and-control resource planning model to an alleged “free market” for electricity. Building on the state’s historical legacy of relying upon independent power producers, the state was again poised to push the envelope. However, this time, it would heed a growing chorus of experts predict-ing that electricity was ready to move beyond the monopoly structure in place for almost a century. Economists boldly endorsed competition to allow new ideas to fl ourish in a state that had become synonymous with cutting-edge energy experimentation.
Marathon legislative negotiation sessions led by for-mer State Senator Steve Peace (D-Chula Vista), who was once producer of the underground fi lm classic Attack of the Killer Tomatoes, had shaped state legislation that would revamp the nation’s largest electricity market. Typically, such bills are drafted behind closed doors, with compet-ing lobbyists shaking hands over cocktails or cigars. In this case, Peace—acting a bit like Phil Donahue—would bring all of the special interests into one room, get them to sit at one table in legislative chambers, and would go around with a microphone, quizzing and putting people on the spot with his tough questioning. While Peace was a brilliant politician and managed to craft a bill that sailed through the California Legislature (pl. 32) without a sin-gle dissenting vote, he unknowingly set the state up for a major wake-up call.
“We take the risk if our costs go up,” acknowledged Gordon Smith, PG&E chief executive in 1997, referring to AB 1890, the law that Peace pushed and that restructured California’s $23 billion electricity market. More than any other special interests, the state’s large private utilities helped shape AB 1890, a 100-page-long law that restructured California’s electricity market. Though large energy consumers initially pushed for the restructuring of California’s power market, AB 1890’s most generous fi nancial provisions delighted
Asmus08_Part I.indd 77 12/18/08 11:13:11 AM
Copyrighted Material

O V E R V I E W78
investor-owned utilities. PG&E and Edison International (the parent company of SCE) each reaped $10 billion in profi ts between 1998 and April 2000 as a result of provisions that allowed the utilities to charge ratepayers for all of their past debts under a compressed schedule.
While the state’s restructuring law of 1996 promised lower rates and the opportunity for citizens to vote for clean energy with their ratepayer dollars, the compromise legisla-tion set the stage for one of California’s darkest hours. First came rolling blackouts in 2000, which continued through 2001. Then, astronomical wholesale prices were charged by the likes of Enron. PG&E and SCE sank billions of dollars of debt, with PG&E ultimately declaring bankruptcy. Still later, the stock market crash and terrorist attacks dramatically
Plate 32. Late-night sessions at the State Capitol set the stage for passage of the nation’s most comprehensive restructuring of power markets.
Asmus08_Part I.indd 78 12/18/08 11:13:11 AM
Copyrighted Material

O V E R V I E W 79
slowed the economy, spawning low-cost power surpluses. And then came the climb in price for virtually all energy sources, including natural gas (our current dominant elec-tricity fuel) and oil (our dominant transportation fuel).
To solve the California energy crisis, California Governor Davis ultimately thrust the state Department of Water Resources (DWR) into the role of becoming the sole pur-chasing agent of electricity for most Californians. This ago-nizing decision required the largest public bond issuance in state history. More than 30 contracts with wholesalers worth $40 billion were signed with the DWR. Roughly 70 percent of those contracts sell power from facilities that had not yet been built, investments in facilities that will operate for 30 years or more. All but 2.5 percent—120 megawatts—of these electricity generators are fueled by natural gas, a fuel subject to extreme price fl uctuation.
When natural gas prices go up, the cost of electricity from these power plants increases dramatically. Experience has shown us that it is never good to depend primarily on a sin-gle fuel to generate electricity. As in an investment portfolio, diversity is necessary to hedge against risks. While California has since emerged from this debacle, ratepayers will be pay-ing off debts for this $40 billion investment well into the next decade.
At this point, California seemed to be teetering between two worlds, neither of which served the public interest. Free markets? Why, wasn’t that the cause of skyrocketing prices and rolling blackouts? Big government? A state takeover of electricity purchasing ran up huge state budget defi cits to be borne by state taxpayers locked into large blocks of “dirty” electricity at high prices. California’s ongoing experiment with governance of power markets seemed to deliver more of the same to state consumers: high prices and long-term debts for sources of polluting power.
Managing the ebbs and fl ows of energy supplies offers a unique set of challenges to policymakers. California’s roller
Asmus08_Part I.indd 79 12/18/08 11:13:12 AM
Copyrighted Material
O V E R V I E W80
coaster ride during 2000–2001 was a result of an untested power market that was heralded as a “free” market when in reality, it was a political plan based in blind faith in mar-kets with just enough progressive elements (such as support for renewable energy and effi ciency) to get every legislator’s vote. Though it allowed wholesale prices to fl uctuate, retail prices were frozen, a feature intended to protect residential ratepayers. This is why the PG&E and SCE seemed power-less as the crisis persisted. When wholesale prices that utili-ties paid skyrocketed (largely because of an untested power market structure that proved to be a disaster), prices paid by retail consumers still stayed the same. Apparently, no one had envisioned prices going up under the new regulatory framework. The assumption all along was that the wonders of a market would drive costs down. It was the difference between wholesale and retail rates that created a crisis.
California is not the only state disappointed by the prom-ise of deregulation in delivering a better electricity system. The large industrial consumers who originally pushed for these sorts of radical reforms were also extremely disap-pointed. Here are some of the reasons why markets have not delivered a cheaper and cleaner energy product:
� Most markets, including California’s, were designed to pay all producers the same highest price in auctions.
� Producers discovered that it is relatively easy to with-hold power to create artifi cial shortages, thereby increasing prices.
� This market proved easy to manipulate in a way that approached collusion but skirted just within the con-fi nes of the law.
� In other markets, customers always have the opportu-nity to walk away. This is not the case with electricity, which has become a vital aspect of everyday life.
� In the stock market, vast numbers of buyers and sell-ers tend to keep prices in balance. In California’s power
Asmus08_Part I.indd 80 12/18/08 11:13:12 AM
Copyrighted Material
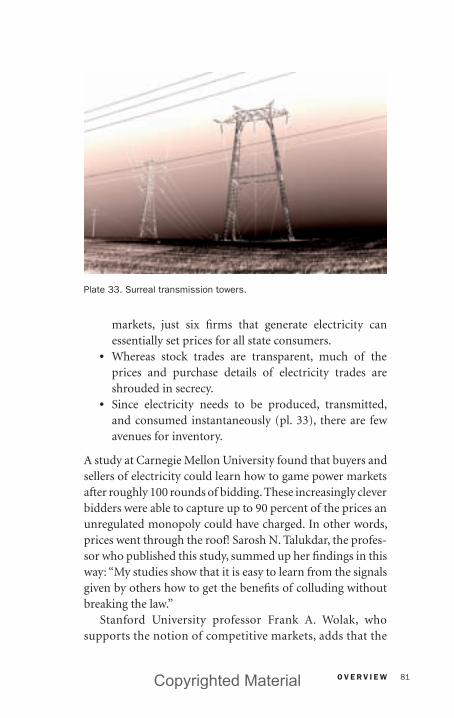
O V E R V I E W 81
markets, just six fi rms that generate electricity can essentially set prices for all state consumers.
� Whereas stock trades are transparent, much of the prices and purchase details of electricity trades are shrouded in secrecy.
� Since electricity needs to be produced, transmitted, and consumed instantaneously (pl. 33), there are few avenues for inventory.
A study at Carnegie Mellon University found that buyers and sellers of electricity could learn how to game power markets after roughly 100 rounds of bidding. These increasingly clever bidders were able to capture up to 90 percent of the prices an unregulated monopoly could have charged. In other words, prices went through the roof! Sarosh N. Talukdar, the profes-sor who published this study, summed up her fi ndings in this way: “My studies show that it is easy to learn from the signals given by others how to get the benefi ts of colluding without breaking the law.”
Stanford University professor Frank A. Wolak, who supports the notion of competitive markets, adds that the
Plate 33. Surreal transmission towers.
Asmus08_Part I.indd 81 12/18/08 11:13:12 AM
Copyrighted Material
O V E R V I E W82
THE RISE AND FALL OF ENRON
Jeffrey Skilling, former Enron CEO, once bragged Enron would evolve into the world’s top corporation, period.
Instead of being “vertically integrated” like its asset-heavy compatriots, Enron would be “virtually integrated.” Deregulation would break up traditional fi rms into thousands of tiny niche players. Enron’s strategy was to “wire those thousands of fi rms back together cheaply and temporarily,” relying upon its unregulated Internet-based trading platforms to squeeze out profi ts from other people’s assets.
The quick disintegration of Enron—a fi rm once ranked as the seventh largest in the world based on annual revenues—virtually had no effect on maintaining the reliability of power supplies in California or the rest of the country.
Enron did not generate electricity; it merely traded the juice. Enron operated, more or less, like a publicly held huge hedge fund. What Enron failed to do was inform its shareholders that it had evolved into a high-risk investment fi rm carrying huge debts that accounting gimmicks glossed over. Though demonized by activists and politicians dismissing electricity deregulation, Enron did not reap anywhere near the profi ts its fellow energy marketers and generators made, fi rms such as Calpine of San Jose. The very competition Enron championed as its golden opportunity started cutting into already-thin profi t margins as the economy slowed and wholesale electricity prices plummeted. Since it owned no power plants, all Enron did was repackage electricity and then resell it. As wholesale prices fell, Enron’s profi t margins kept getting thinner and thinner.
Ironically, one of the few assets the company maintained was its wind turbine manufacturing subsidiary, which it had been trying to sell for over a year. Given that wind power
Asmus08_Part I.indd 82 12/18/08 11:13:13 AM
Copyrighted Material
O V E R V I E W 83
current hodgepodge of regulated and unregulated mar-kets that currently exist throughout the country sends too many mixed signals and therefore cannot reduce costs. “Even small flaws in the design of markets can cause enormous harm to consumers in very little time,” he observed.
Two bright spots emerged from California’s energy crisis of 2000–2001: fi rst, a record number of distributed renewable energy systems, particularly solar photovoltaic (PV) panels, were installed, many by corporations and local governments seeking clean, reliable electricity sup-plies (pl. 34); and second, the voluntary conservation sav-ings state consumers supplied over the summer of 2001 far exceeded expectations and dwarfed energy demand reduc-tions encouraged by energy-effi ciency programs managed by utility monopolies.
The energy crisis also happened to bolster the case for demand-side management (DSM) programs, a close relative of energy effi ciency. In the case of DSM, as it is called within industry circles, energy savings are time-dependent and often require active participation on the part of the consumer. For example, the state’s “Flex Your Power” campaign launched
has been the fastest-growing power supply source over the past decade, Enron seemed to get lost in a virtual world of online real-time trades and Internet connections, and they forgot about fostering real innovations in supplying electricity from actual hardware that can offer lasting solutions. To its credit, Enron was a proponent of curbing emissions to global climate change. Yet the fi rm failed to recognize the value of the one hard asset it owned: Enron Wind Corporation, which showed tremendous profi t potential as a result of global climate change concerns.
Asmus08_Part I.indd 83 12/18/08 11:13:13 AM
Copyrighted Material

O V E R V I E W84
during the summer of 2001 offered fi nancial incentives for residents and businesses to not use electricity during peak demand periods in the late afternoons and early evenings. A massive installation of compact fl uorescent light bulbs and high-effi ciency motors helped California save 5,000 mega-watts, the equivalent electricity to power a city the size of Los Angeles. Unfortunately, roughly half of these effi ciency gains disappeared in 2002, when the crisis ended and the sense of urgency and camaraderie waned.
These two success stories point the way to the future. They are the direct result of California’s experiment with opening up markets to new players, some of which gouged state consumers, others of which helped push forward the next generation of clean power technologies.
None of this human drama, interestingly enough, would have been possible if not for natural processes that evolved over millions of years and that never knew the difference between a “blue” or a “red” state or a private or public utility. The next two sections of this book provide an overview of all
Plate 34. Large solar PV array near Lake Oroville at dusk.
Asmus08_Part I.indd 84 12/18/08 11:13:13 AM
Copyrighted Material

O V E R V I E W 85
of the energy sources you depend upon to support your cur-rent lifestyle, with particular emphasis on electricity, fossil fuels, and renewable energy. For each energy source exam-ined, particular attention is placed on the role California played in their maturation as a viable option in today’s carbon-constrained world.
Asmus08_Part I.indd 85 12/18/08 11:13:15 AM
Copyrighted Material