winner-takes-all: competing viruses or ideas on fair-play networks b. aditya prakash, alex beutel,...
TRANSCRIPT

Winner-takes-all: Competing Viruses or Ideas
on fair-play Networks
B. Aditya Prakash, Alex Beutel, Roni Rosenfeld, Christos Faloutsos
Carnegie Mellon University, USA
2
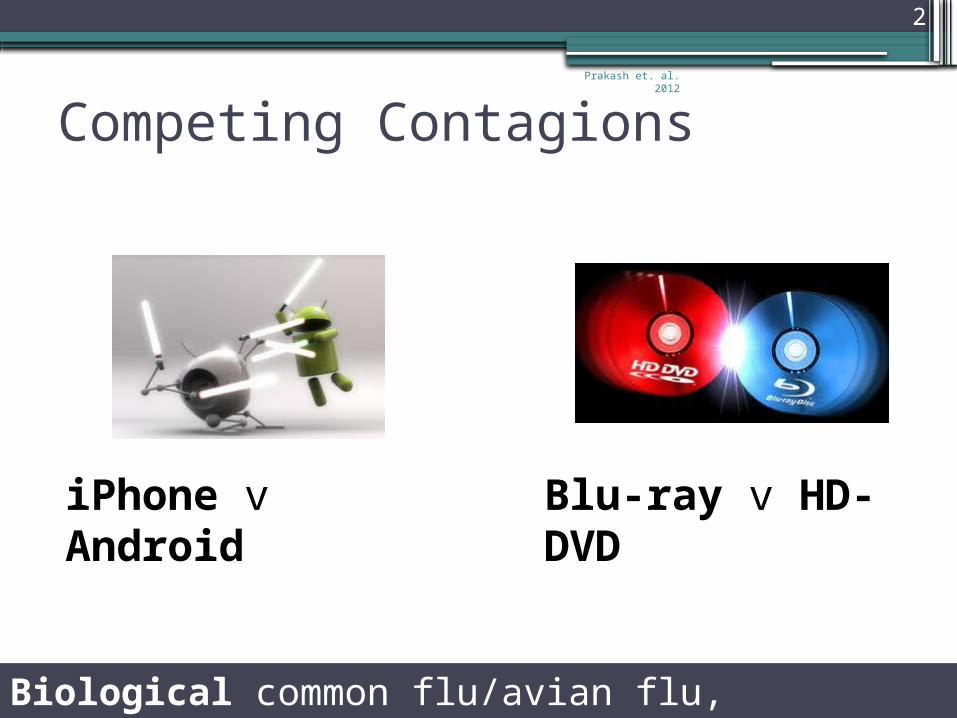
Competing Contagions
iPhone v Android
Blu-ray v HD-DVD
Biological common flu/avian flu, pneumococcal inf etc
Prakash et. al. 2012

Prakash et. al. 2012
3
Outline
•Introduction•Propagation Model•Problem and Result•Simulations•Proof Sketch•Real Examples•Conclusions
Prakash et. al. 2012
4
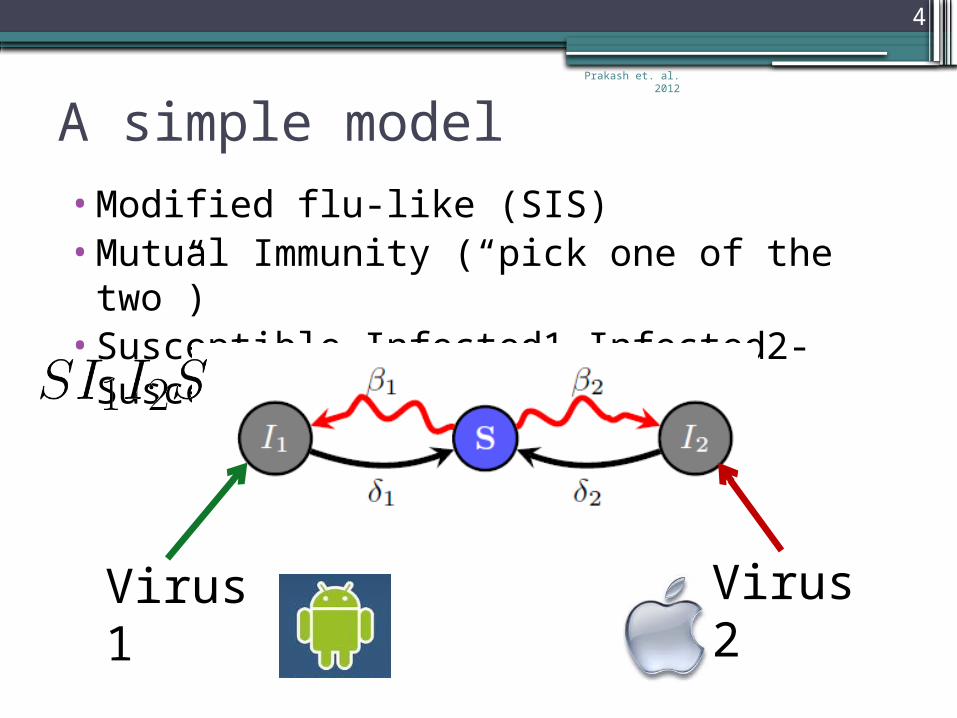
A simple model•Modified flu-like (SIS) •Mutual Immunity (“pick one of the two”)•Susceptible-Infected1-Infected2-
Susceptible
Virus 1
Virus 2
Prakash et. al. 2012
5
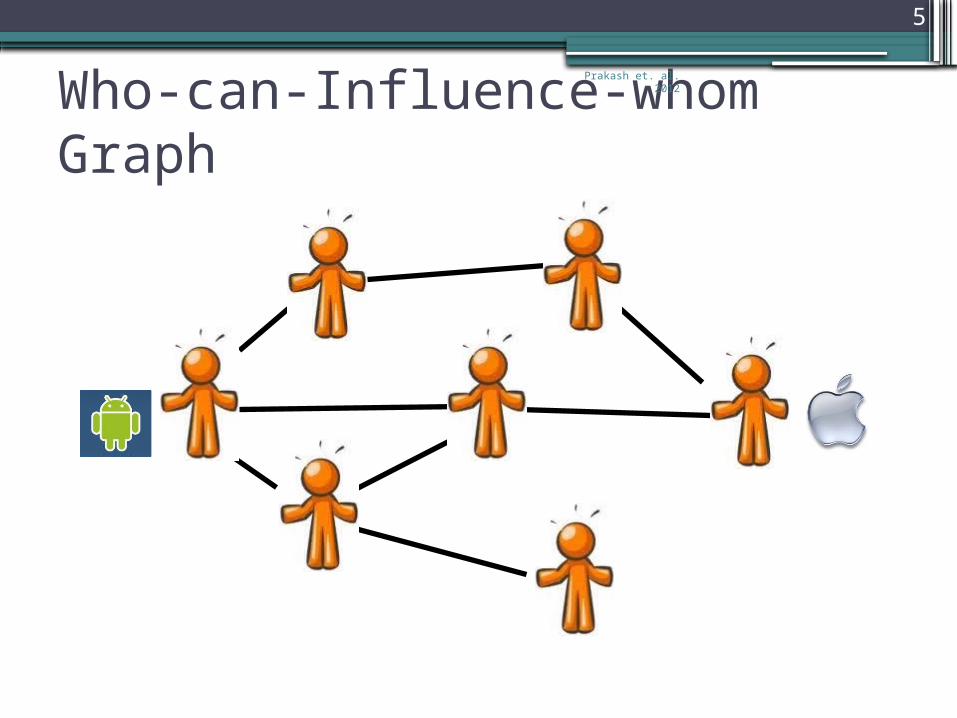
Who-can-Influence-whom Graph

Prakash et. al. 2012
6
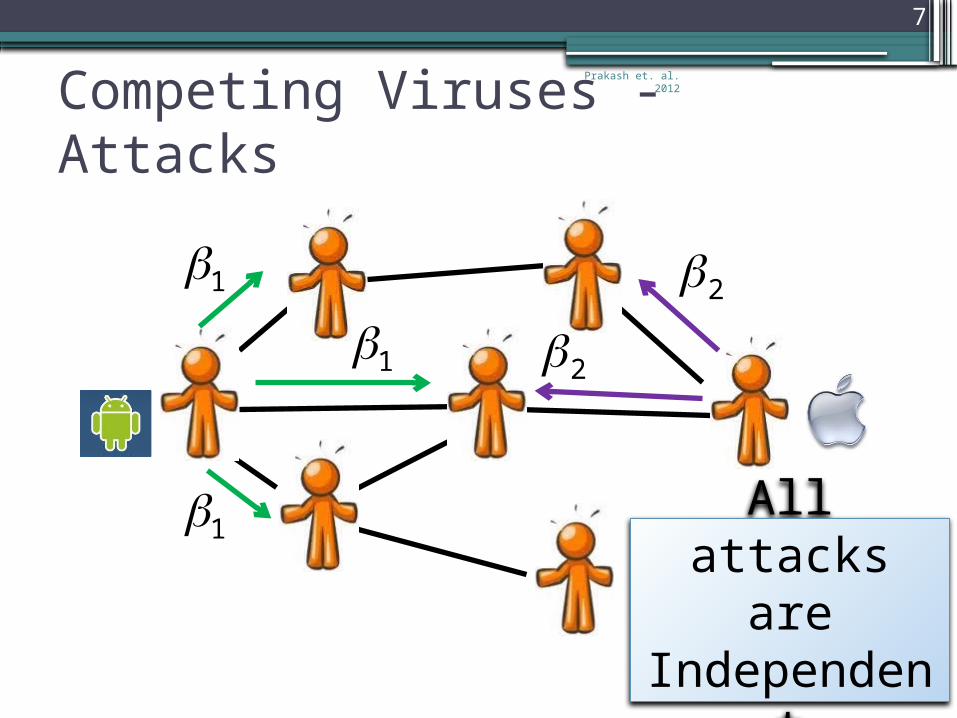
Competing Viruses - Attacks
1
1
1
Prakash et. al. 2012
7
Competing Viruses - Attacks
1
1
22
All attacks are
Independent
1

Prakash et. al. 2012
8
Competing Viruses - Cure
1
Abandons the Android
Abandon the iPhone
2
Prakash et. al. 2012
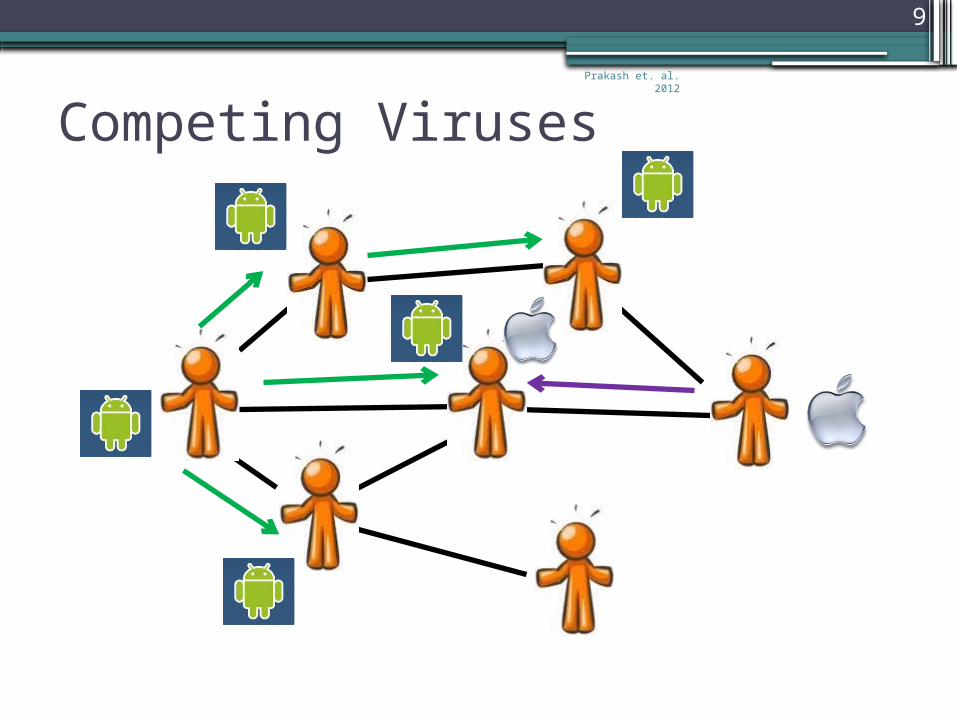
9
Competing Viruses

Prakash et. al. 2012
10
Outline
•Introduction•Propagation Model•Problem and Result•Simulations•Proof Sketch•Real Examples•Conclusions
Prakash et. al. 2012
11
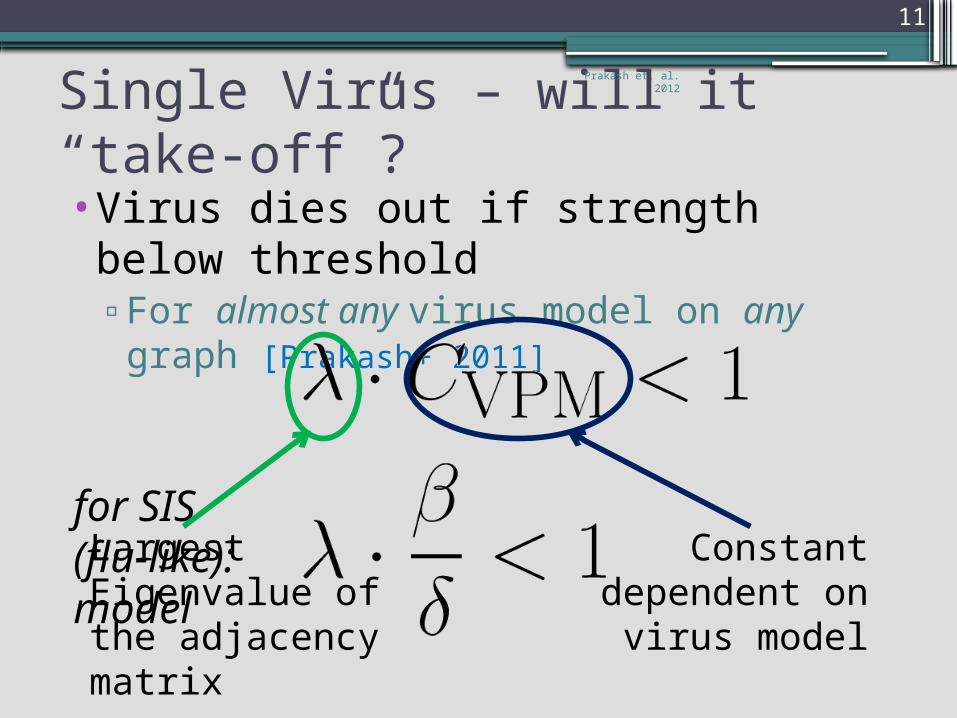
Single Virus – will it “take-off”?
•Virus dies out if strength below threshold▫For almost any virus model on any graph
[Prakash+ 2011]
for SIS (flu-like): model
Largest Eigenvalue of the adjacency matrix
Constant dependent on
virus model
Prakash et. al. 2012
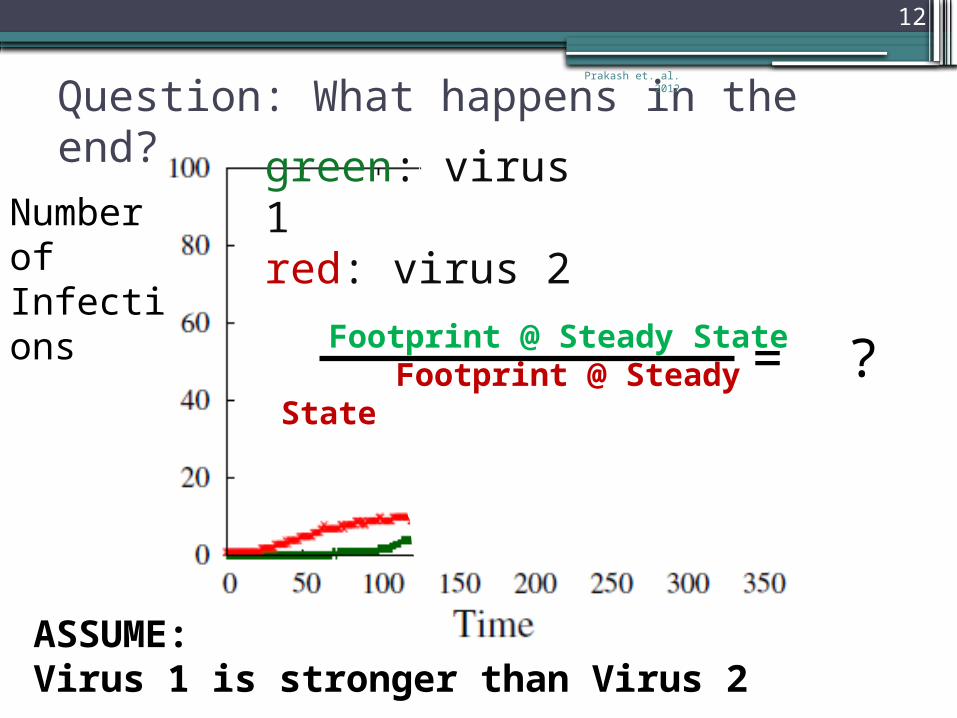
12
Question: What happens in the end?
green: virus 1red: virus 2
Footprint @ Steady State Footprint @ Steady State= ?
Number of Infections
ASSUME: Virus 1 is stronger than Virus 2
Prakash et. al. 2012
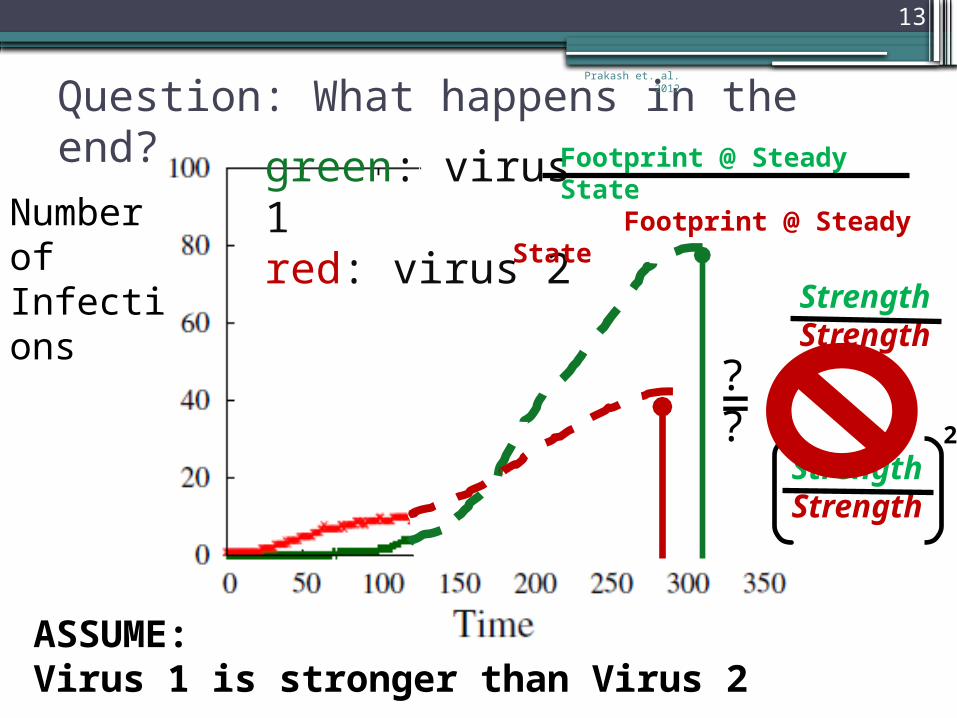
13
Question: What happens in the end?
green: virus 1red: virus 2
Number of Infections
Strength Strength
??=
Strength Strength
2
Footprint @ Steady State
Footprint @ Steady State
ASSUME: Virus 1 is stronger than Virus 2
Prakash et. al. 2012
14
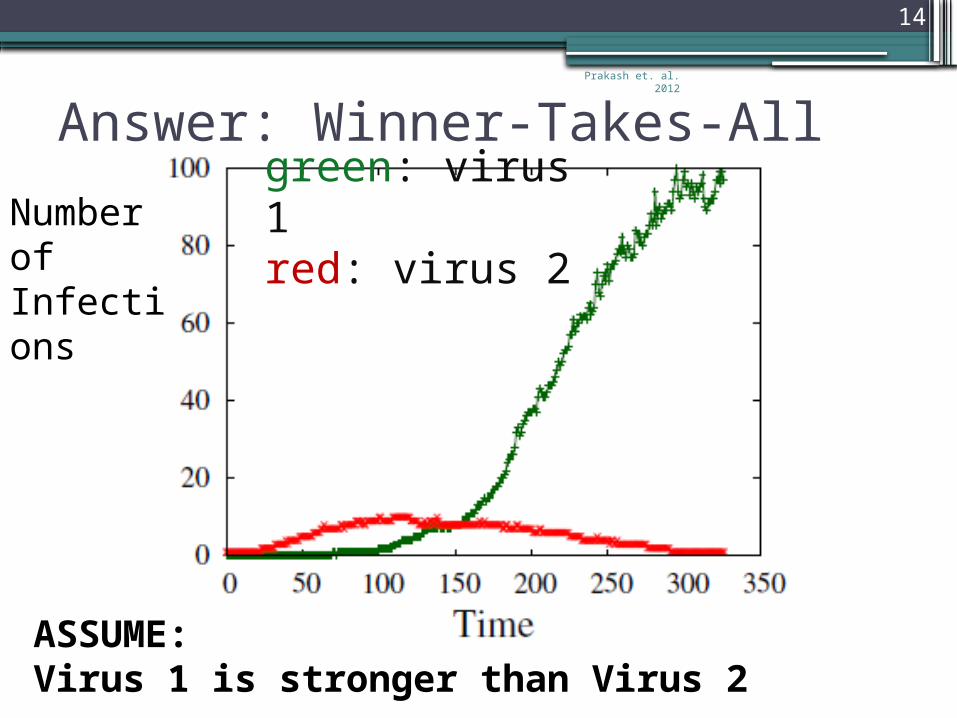
Answer: Winner-Takes-Allgreen: virus 1red: virus 2
ASSUME: Virus 1 is stronger than Virus 2
Number of Infections
Prakash et. al. 2012
15
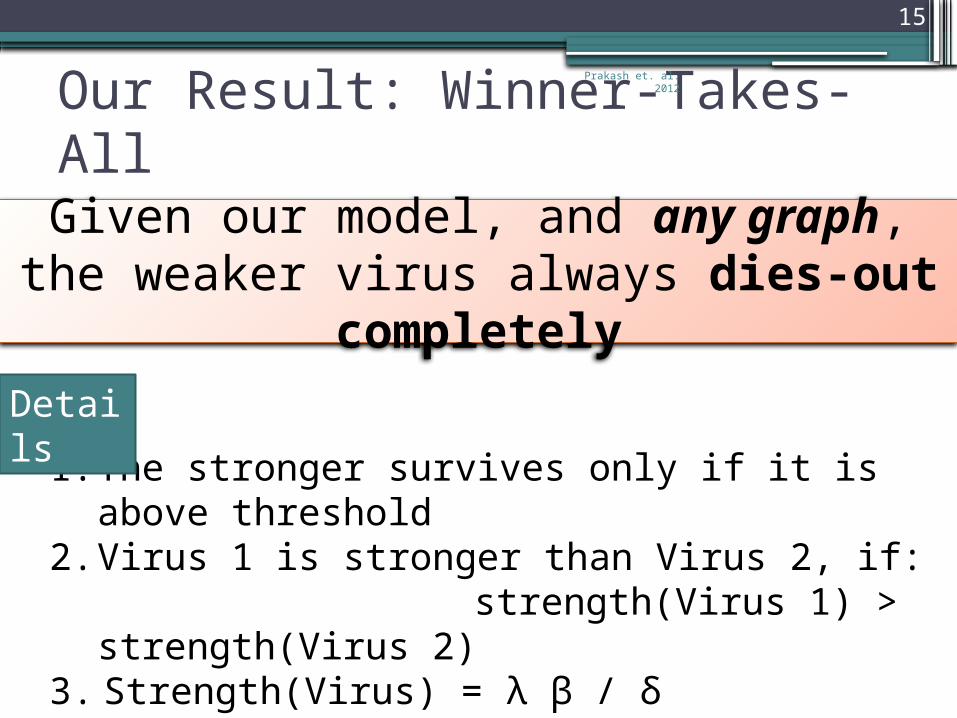
Our Result: Winner-Takes-All
Given our model, and any graph, the weaker virus always dies-out
completely
1. The stronger survives only if it is above threshold
2. Virus 1 is stronger than Virus 2, if: strength(Virus 1) > strength(Virus
2)3. Strength(Virus) = λ β / δ
Details

Prakash et. al. 2012
16
Outline
•Introduction•Propagation Model•Problem and Result•Simulations•Proof Sketch•Real Examples•Conclusions
Prakash et. al. 2012
17
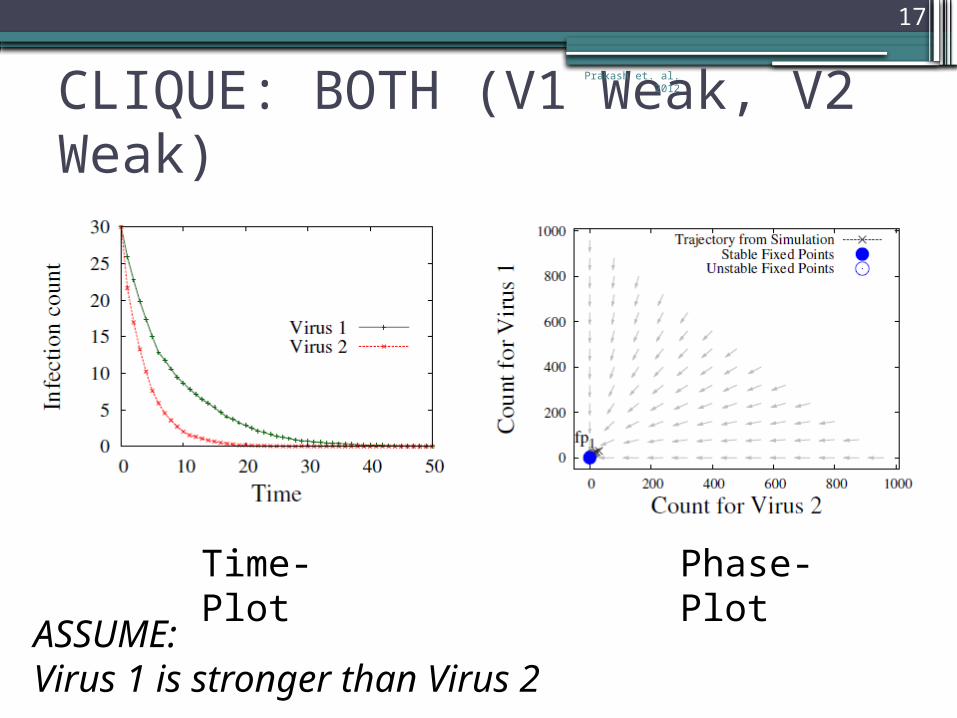
CLIQUE: BOTH (V1 Weak, V2 Weak)
Time-Plot Phase-Plot
ASSUME: Virus 1 is stronger than Virus 2

Prakash et. al. 2012
18
CLIQUE: MIXED (V1 strong, V2 Weak)
Time-Plot Phase-Plot
ASSUME: Virus 1 is stronger than Virus 2

Prakash et. al. 2012
19
CLIQUE: ABOVE (V1 strong, V2 strong)
Time-Plot Phase-Plot
ASSUME: Virus 1 is stronger than Virus 2

Prakash et. al. 2012
22
AS-OREGON (ABOVE V1 strong, V2 strong)
V2 in isolation
15,429 links among 3,995 peersASSUME:
Virus 1 is stronger than Virus 2

Prakash et. al. 2012
23
PORTLAND (ABOVE V1 strong, V2 strong)
PORTLAND graph: synthetic population,
31 million links, 6 million nodes

Prakash et. al. 2012
24
Outline
•Introduction•Propagation Model•Problem and Result•Simulations•Proof Sketch
▫Clique▫Arbitrary Graph
•Real Examples •Conclusions

Prakash et. al. 2012
25
Proof Sketch (clique)
•View as dynamical system
Prakash et. al. 2012
26
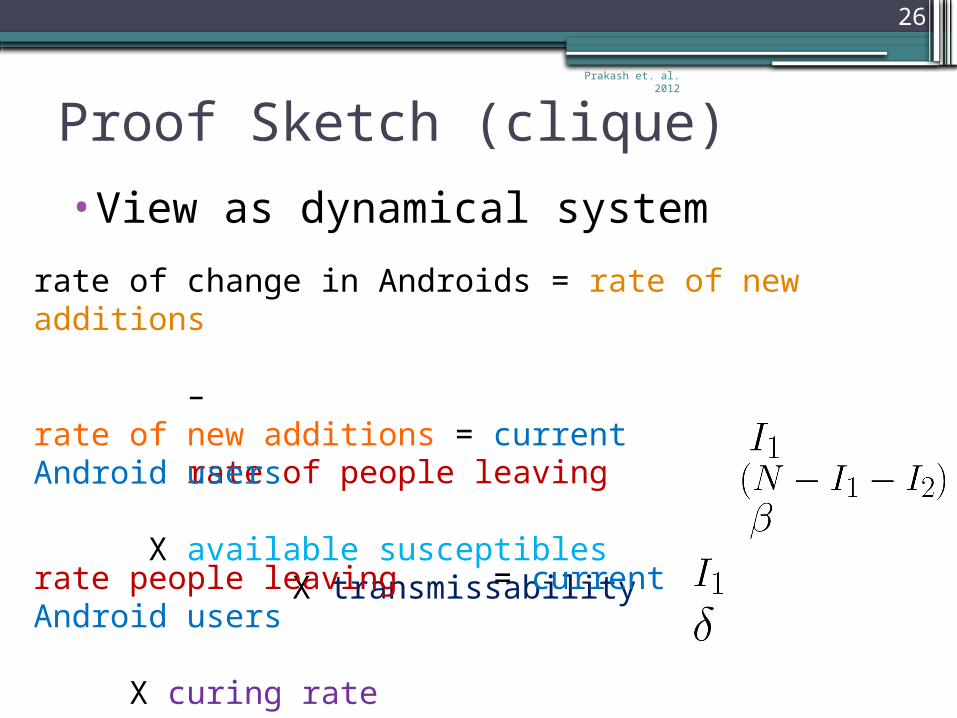
Proof Sketch (clique)
•View as dynamical system
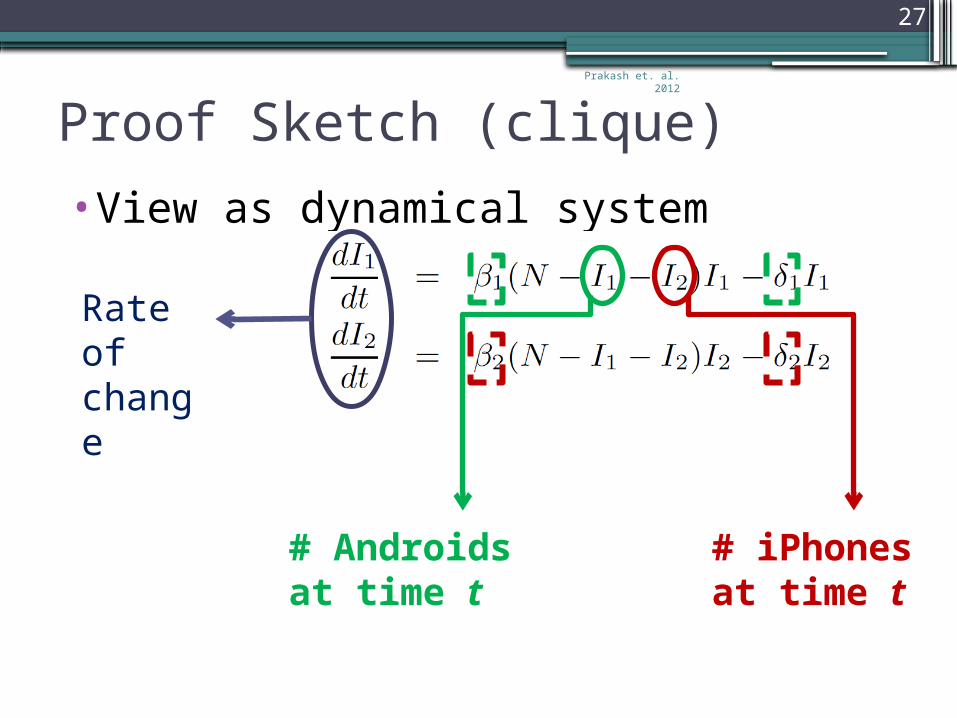
rate of change in Androids = rate of new additions – rate of people leaving rate of new additions = current Android users X available susceptibles
X transmissability rate people leaving = current Android users X curing rate
Prakash et. al. 2012
27
Proof Sketch (clique)
•View as dynamical system
# Androids at time t
# iPhones at time t
Rate of change

Prakash et. al. 2012
28
Proof Sketch (clique)
•View as dynamical system
New Victims
Cured

Prakash et. al. 2012
29
Proof Sketch (clique)
•View as dynamical system
•Fixed Points
Both die out
One dies out

Prakash et. al. 2012
30
Proof Sketch (clique)
•View as dynamical system•Fixed Points•Stability Conditions
▫when is each fixed point stable?
Fixed Point
V1 Weak, V2 Weak
Field lines converge
Prakash et. al. 2012
31
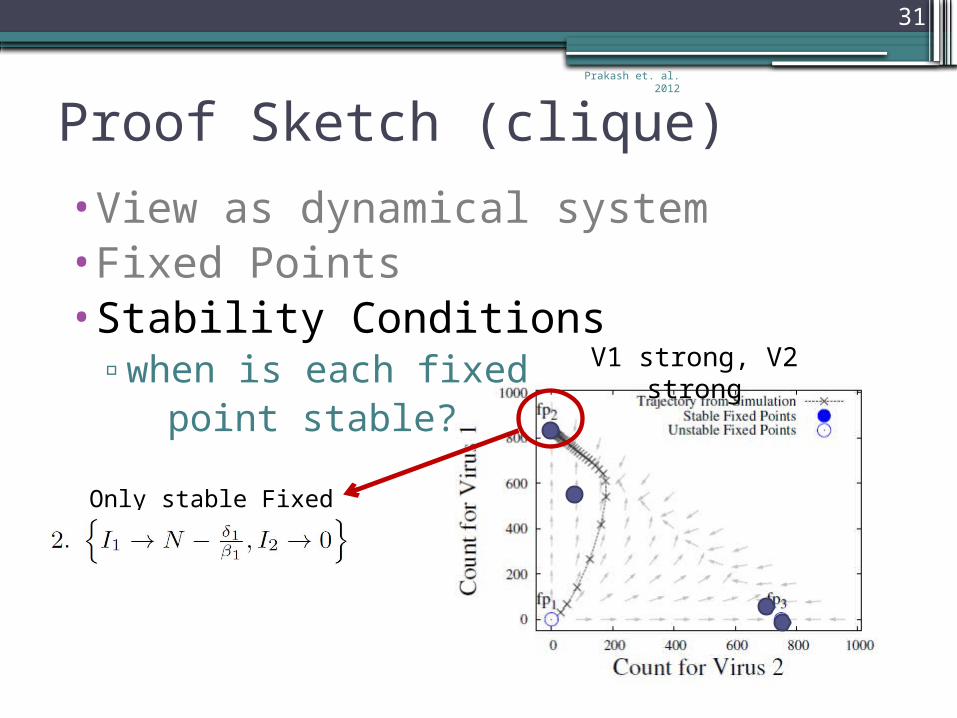
Proof Sketch (clique)
•View as dynamical system•Fixed Points•Stability Conditions
▫when is each fixed point stable?
V1 strong, V2 strong
Only stable Fixed point

Prakash et. al. 2012
32
Proof Sketch (clique)
•View as dynamical system•Fixed Points•Stability Conditions
▫when is each fixed point stable?
Formally: when real parts of the eigenvalues of the Jacobian* are negative
*
Prakash et. al. 2012
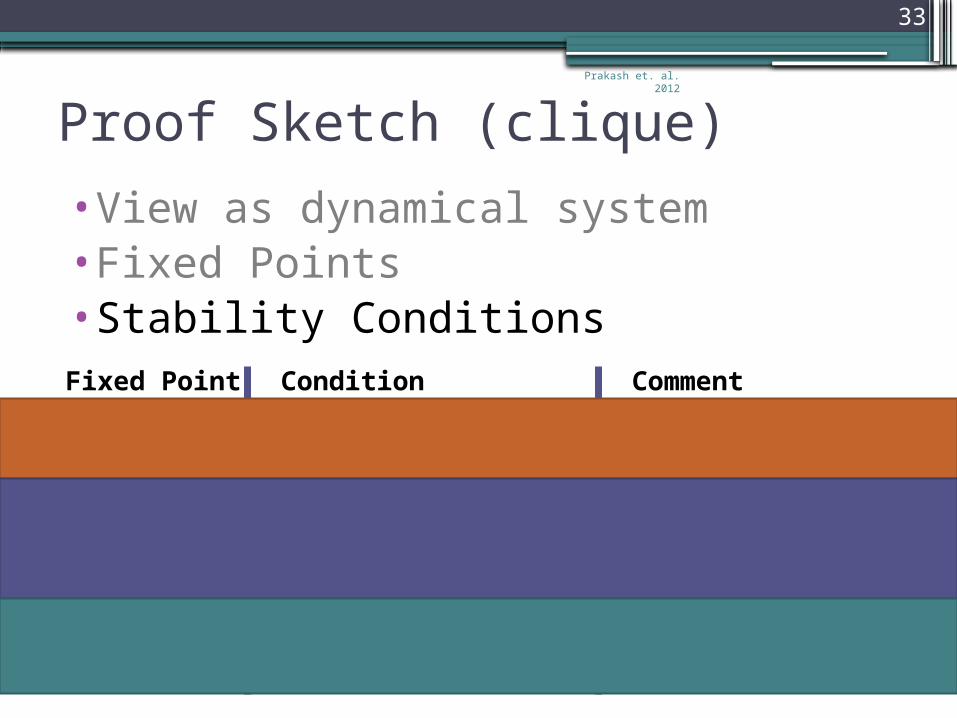
33
Proof Sketch (clique)
•View as dynamical system•Fixed Points•Stability Conditions
………
Fixed Point Condition Comment
Both viruses below threshold
V1 is above threshold and stronger than V2
........Similarly……….
and
and
Prakash et. al. 2012
34
Outline
•Introduction•Propagation Model•Problem and Result•Simulations•Proof Sketch
• Clique▫Arbitrary Graph
•Real Examples•Conclusions
Prakash et. al. 2012
35
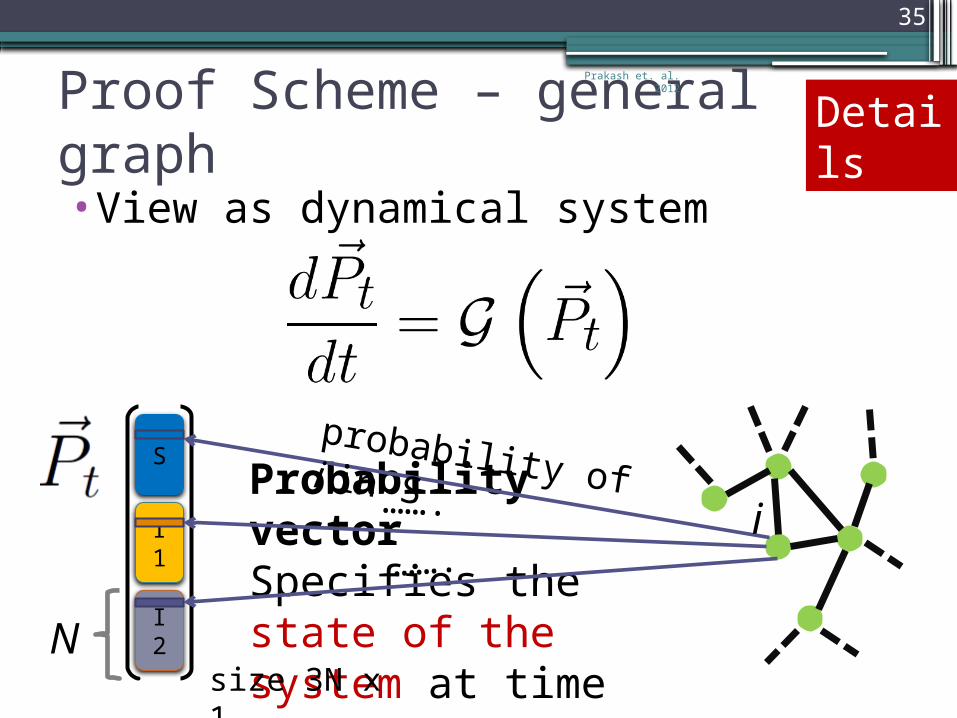
Proof Scheme – general graph
•View as dynamical system
I1
I2
SProbability vector Specifies the state of the system at time t
Details
N
i
probability of i in S…….
…….
size 3N x 1

Prakash et. al. 2012
36
Proof Scheme – general graph
•View as dynamical system
Non-linear functionExplicitly gives the evolution of system
Details

Prakash et. al. 2012
37
Proof Scheme – general graph•View as dynamical system
•Fixed Points▫only three fixed points▫at least one has to die out at any point
▫Key Constraints: All probabilities have to be non-zero They are spreading on the same graph Used Perron-Frobenius Theorem
Details

Prakash et. al. 2012
38
Proof Scheme – general graph
•View as dynamical system
•Fixed Points
•Stability Conditions▫give the precise conditions for each
fixed point to be stable (attracting)▫Utilized Lyapunov Theorem
Details

Prakash et. al. 2012
39
Outline
•Introduction•Propagation Model•Problem and Result•Simulations•Proof Sketch•Real Examples•Conclusions
Prakash et. al. 2012
40
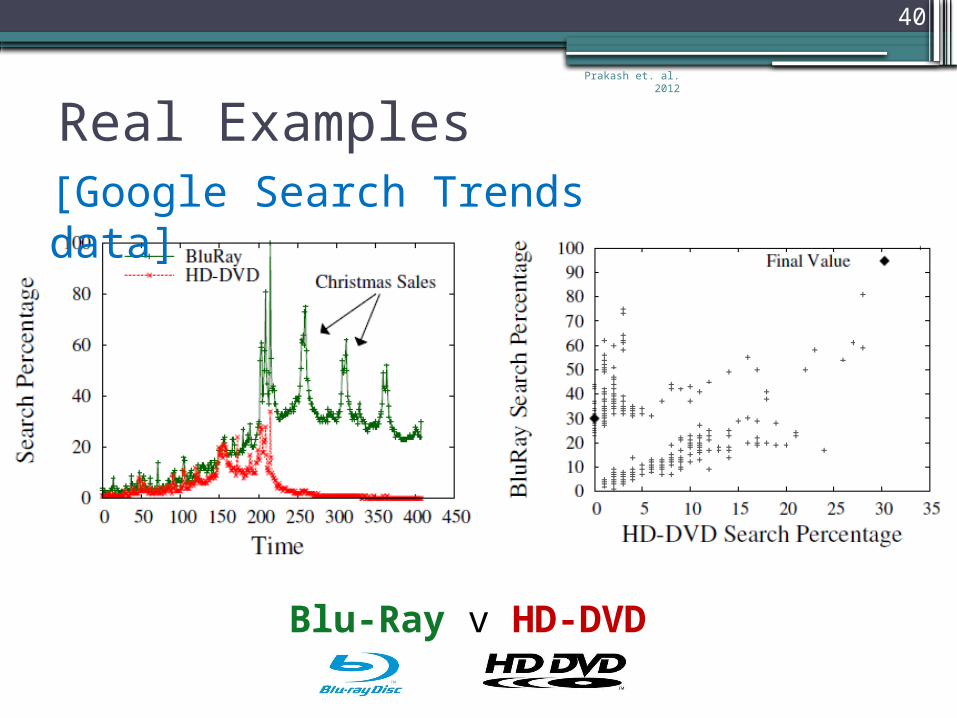
Real Examples
Blu-Ray v HD-DVD
[Google Search Trends data]

Prakash et. al. 2012
41
Real Examples[Google Search Trends data]
Facebook v MySpace
Prakash et. al. 2012
42
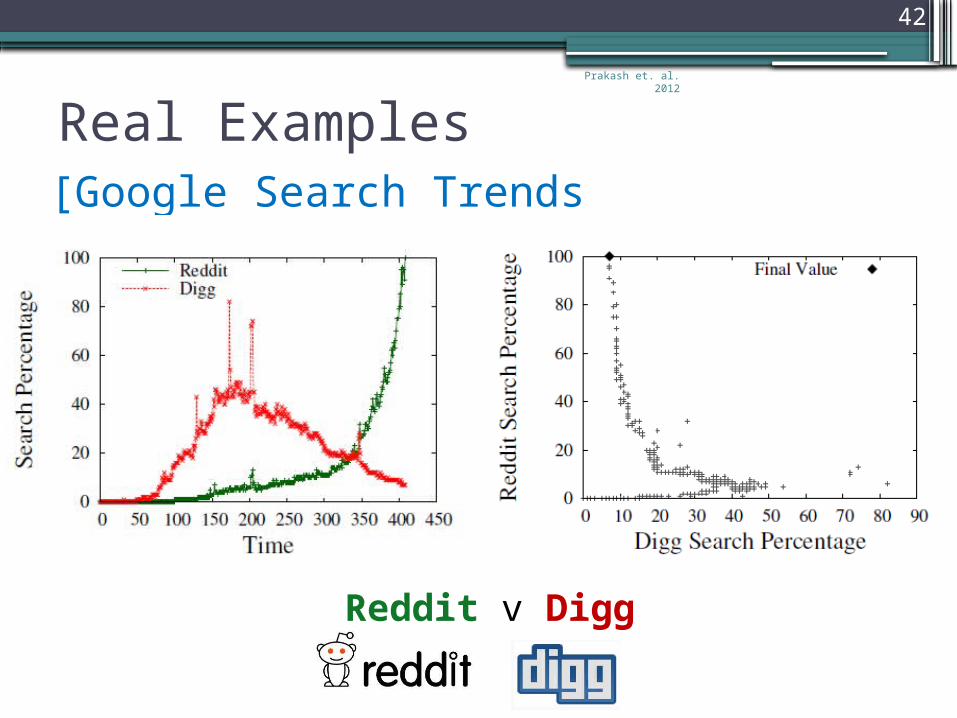
Real Examples[Google Search Trends data]
Reddit v Digg

Prakash et. al. 2012
43
Outline
•Introduction•Propagation Model•Problem and Result•Simulations•Proof Sketch•Real Examples•Conclusions

Prakash et. al. 2012
44
Conclusions•Competing Contagions (iPhone vs Android)▫Mutual Immunity▫Flu-like model
•Q: What happens in the end? A: Winner-takes-all
▫On any graph!
•Simulations and Case Studies on real data
45
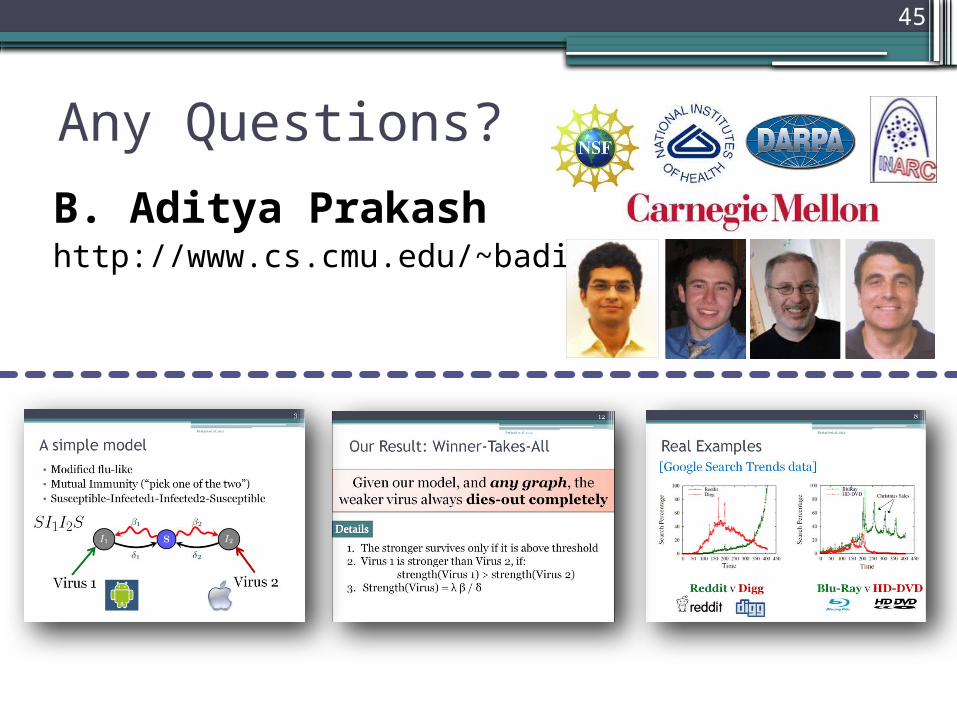
Any Questions?
B. Aditya Prakash http://www.cs.cmu.edu/~badityap