winners and losers after paying for the tax · pdf filewinners and losers after paying for the...
TRANSCRIPT

WINNERS AND LOSERS AFTER PAYING FOR THE
TAX CUTS AND JOBS ACT
William Gale, Surachai Khitatrakun, and Aaron Krupkin
December 8, 2017

ABSTRACT
TA X P OL ICY CENTER | URBAN INSTITUTE & BR OOKINGS INSTITUTION I I
Tax cuts often look like “free lunches” for taxpayers, but they eventually have to be paid for with other tax
increases or spending cuts. We examine the distributional effects – with and without financing – of both the
House and Senate versions of the Tax Cuts and Jobs Act. When ignoring financing, the bills would be
regressive; most households would be better off, but the highest income households would generally receive
the largest percentage boosts in after-tax income. Including financing – based on either equal costs per
household or an equal proportion of each household’s income – would make the overall plan far more
regressive and would leave the vast majority of households worse off than they would be if the tax cuts were
not implemented in the first place. If financing were proportional to households’ current income tax liability, the
results would be more mixed. These results show how important the method of financing is to understanding
the ultimate distributional effects of tax proposals.
ABOUT THE TAX POLICY CENTER
The Urban-Brookings Tax Policy Center aims to provide independent analyses of current and longer-term tax issues and to
communicate its analyses to the public and to policymakers in a timely and accessible manner. The Center combines top
national experts in tax, expenditure, budget policy, and microsimulation modeling to concentrate on four overarching areas
of tax policy that are critical to future debate.
Copyright © 2017. Tax Policy Center. Permission is granted for reproduction of this file, with attribution to the Urban-
Brookings Tax Policy Center.

CONTENTS
TA X P OL ICY CENTER | URBAN INSTITUTE & BR OOKINGS INSTITUTION I I I
ABSTRACT II
CONTENTS III
ACKNOWLEDGMENTS IV
I. INTRODUCTION 1
II. THE HOUSE PROPOSALS 6
III. DISTRIBUTIONAL EFFECTS OF THE HOUSE BILL WITHOUT FINANCING 8
IV. HOUSE BILL FINANCING OPTIONS 9
Framework 9
Results: Effects of Financing 10
V. THE SENATE PROPOSALS 12
VI. DISTRIBUTIONAL EFFECTS OF THE SENATE BILL WITHOUT FINANCING 14
VII. SENATE BILL FINANCING OPTIONS
Framework 15
Results: Effects of Financing 15
VIII. CONCLUSION 17
TABLES 18
APPENDIX TABLES 30
NOTES 42
REFERENCES 44
ABOUT THE AUTHORS 46

ACKNOWLEDGMENTS
TA X P OL ICY CENTER | URBAN INSTITUTE & BR OOKINGS INSTITUTION IV
The authors thank Henry Aaron, Len Burman, Hilary Gelfond, Adam Looney, Mark Mazur, Isaac Shapiro, and Eric
Toder for helpful comments.
The views expressed are those of the authors and should not be attributed the Urban-Brookings Tax Policy
Center, the Urban Institute, the Brookings Institution, their trustees, or their funders. Funders do not determine
our research findings or the insights and recommendations of our experts. For more information on Urban’s
funding principles, go to www.urban.org/support; for more information on Brookings’ donor guidelines, go to
www.brookings.edu/support-brookings/donor-guidelines.
I. INTRODUCTION
TA X P OL ICY CENTER | URBAN INSTITUTE & BR OOKINGS INSTITUTION 1
The House and Senate have passed different versions of the Tax Cuts and Jobs Act (TCJA), which would reduce
federal revenues by more than $1.4 trillion over a decade.1 While the two versions contain key differences, the
overall themes are similar. A key question is how the plans affect the distribution of the tax burden.
Conventional analysis of the distributional effects focuses only on the tax cuts and ignores the fact that tax cuts
are not free; they will have to be paid for with higher taxes or lower spending in the future.
This paper addresses the distributional effects of these plans, including alternative ways of paying for the
costs of tax cuts.2 Our central finding is that if either bill as written were to become law and plausible ways of
financing the bill were taken into account, a significant majority of low-and middle-income households will
eventually end up worse off than if the bill did not become law.3 In other words, they will lose more from the
financing mechanisms than they will gain from the tax cuts themselves. Our estimates do not account for
potential economic growth effects because several recent studies suggest that such effects would be relatively
small. Incorporating such effects, however, are unlikely to change the basic conclusions by much.4
We analyze three financing mechanisms – payments that are equal across households in dollars, in share of
income, and in share of income taxes paid. The first would be the most regressive of the three options, but it is
possible to have even more regressive financing take place. Republican leaders have recently claimed that, now
that tax cuts have been enacted in each Chamber, the party will turn to cutting welfare and entitlements.5 If
that were to pan out, the tax cuts plus their financing could be even more regressive than the results below that
allocate financing by equal payments per household.
The main results are presented in a series of Figures in the Introduction and a longer series of Tables at the
end of the paper. Under the version of the TCJA as passed by the House Ways and Means Committee on
November 9, 2017 (and subsequently passed with minor amendments by the full chamber on November 16,
2017), we find that:6
The direct provisions of the tax cut would reduce taxes in 2018 for 76 percent of households (by an
average of $1,890) and raise taxes for 7 percent of households (by an average of $2,100), including
10 percent in the middle quintile of the income distribution ($1,100 on average).7 Average after-tax
income would rise by 0.4 percent ($60) in the bottom quintile, 1.4 percent in the middle quintile
($830), 1.9 percent in the top quintile ($4,860), and 2.4 percent ($37,100) in the top 1 percent
(Tables A1 and 1).
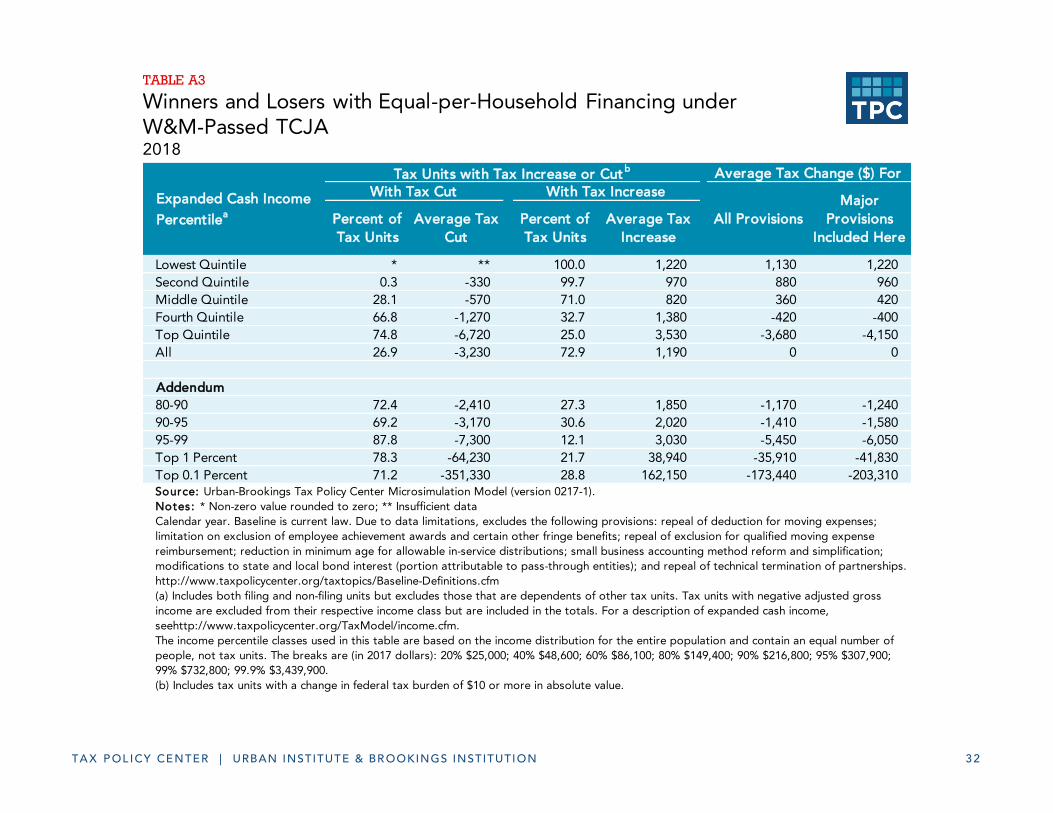
If the House bill were financed by fees that were equal in dollar amounts per tax unit (or spending
cuts with similar effect), the combined effect of financing and the direct provisions of the tax cut
would cut taxes in 2018 for 27 percent of households ($3,230 on average) and raise taxes (formally,
would reduce income net of taxes and benefits) for 73 percent of households ($1,190 on average),

TA X P OL ICY CENTER | URBAN INSTITUTE & BR OOKINGS INSTITUTION 2
including 100 percent of households in the bottom quintile, who would face an average increase of
$1,220, and 71 percent of households in the middle quintile. Average after-tax income in 2018
would drop by 8.1 percent ($1,130) in the bottom quintile and 0.6 percent ($360) in the middle
quintile, but rise by 1.4 percent in the top quintile ($3,680) and 2.4 percent ($35,910) in the top 1
percent (Tables A3 and 3).
If the House bill were financed by fees or spending cuts that are proportional to income, the
combined effect of financing and the direct provisions of the tax cut would cut taxes in 2018 for 39
percent of households ($1,460 on average), and raise taxes for 59 percent of households ($950 on
average), including 84 percent of households in the bottom quintile, who would face an average
increase of $190. Average after-tax income in 2018 would be reduced by 0.9 percent ($130) in the
bottom quintile and 0.1 percent ($30) in the middle quintile. It would increase by 0.2 percent in the
top quintile ($400) and 0.5 percent ($8,250) in the top 1 percent (Tables A5 and 5).
If the House bill were financed by fees that are proportional to current income tax liability, the
combined effect of financing and the direct provisions of the tax cut would cut taxes in 2018 for 65
percent of households ($950 on average), and raise taxes for 18 percent of households ($3,490 on
average), including 53 percent of households in the top quintile, who would face an average
increase of $6,960. Average after-tax income would increase in 2018 by 0.3 percent ($50) in the
bottom quintile and 0.7 percent in the middle quintile ($400). It would drop by 0.6 percent in the
top quintile ($1,660) and 1.9 percent ($29,520) in the top 1 percent (Tables A7 and 7).
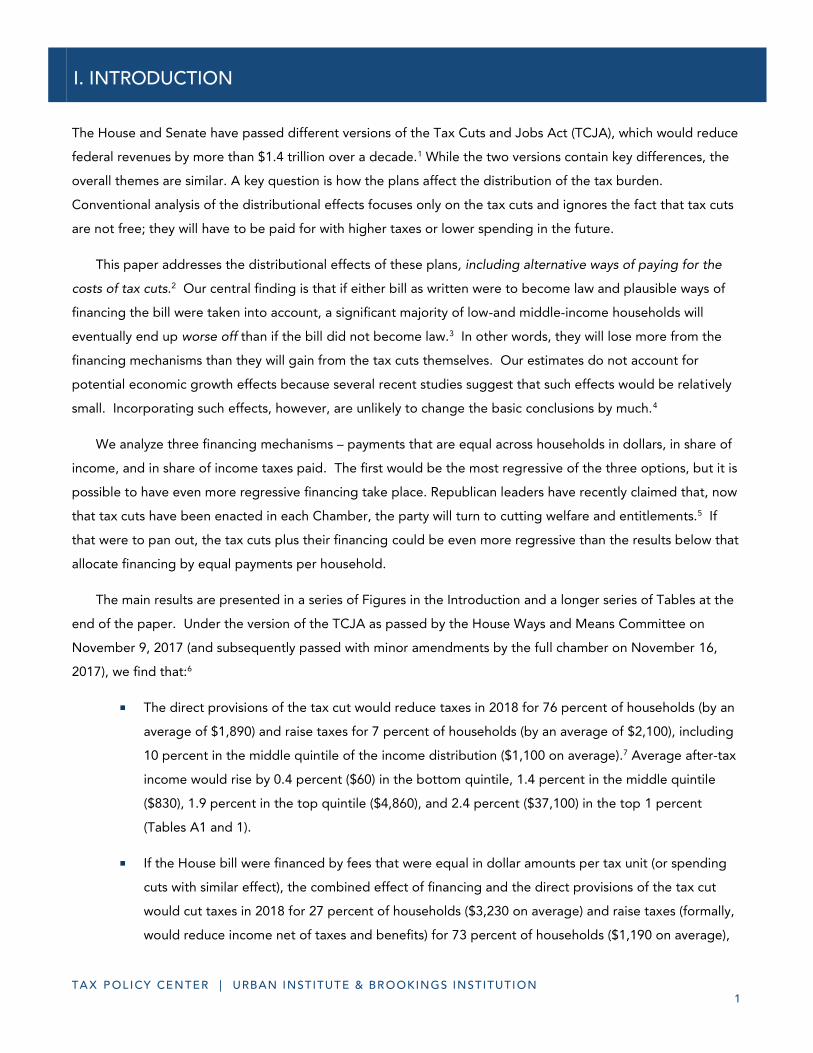
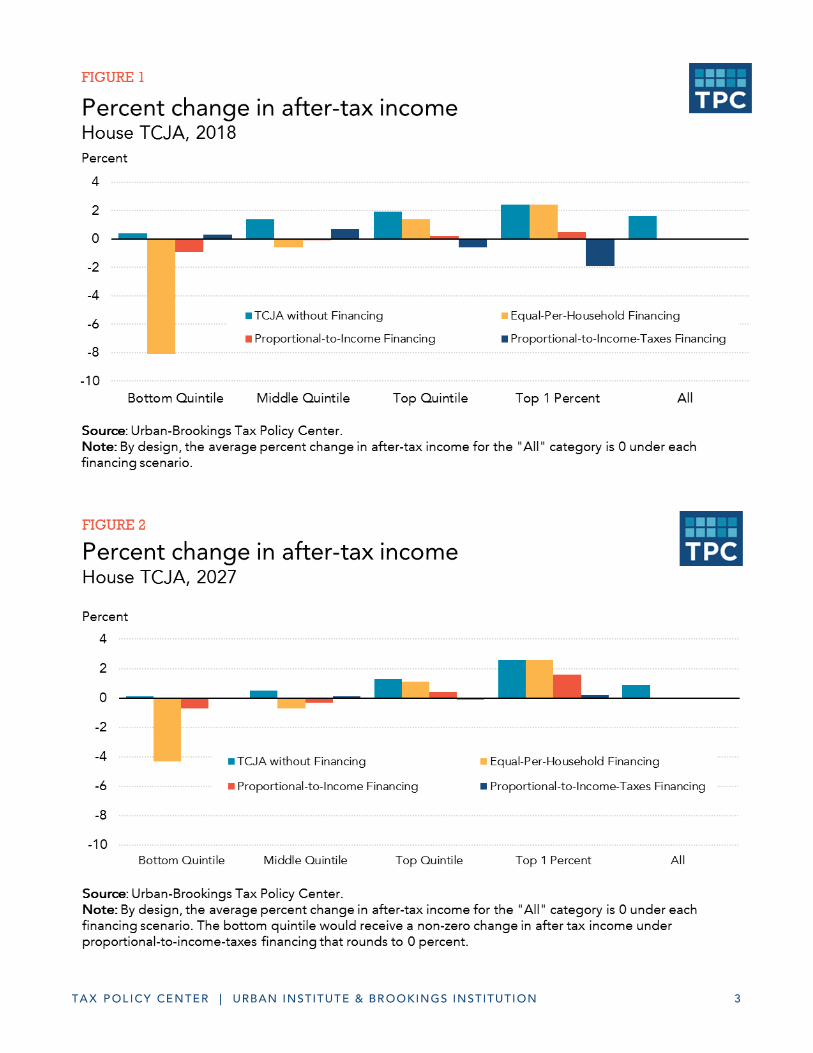
Figures 1 and 2 provide a summary and show the percent change in after-tax income across income groups
for each financing scenario of the House bill in 2018 and 2027, respectively.8 While the bottom and middle
quintiles, on average, would experience an increase in after-tax income in both years when financing is ignored,
after-tax income would fall for these groups under the first two financing scenarios. The top 1 percent of
households would receive an increase in average after-tax income under every scenario we model except for
proportional-to-income-taxes financing in 2018.
We calculate similar results for the TCJA as passed by the Senate on December 2, 2017, though we analyze
2019 data instead of 2018 since the Senate legislation would delay the corporate income tax cut by one year.9 It
is important to note that we do not estimate the distributional impact of the Senate’s proposed repeal of the
ACA individual mandate. Including that provision would produce results that are substantially more regressive
than below.10 It would also make the bill budget positive in calendar year 2027. As a result, we only include
calendar year 2019 in our analysis of the Senate bill.11
TA X P OL ICY CENTER | URBAN INSTITUTE & BR OOKINGS INSTITUTION 3

TA X P OL ICY CENTER | URBAN INSTITUTE & BR OOKINGS INSTITUTION 4
The direct provisions of the tax cut would reduce taxes in 2019 for 75 percent of households
($1,990 on average) and raise taxes for 7 percent of households ($3,070 on average), including 10
percent in the middle quintile of the income distribution ($840 on average). Average after-tax
income would increase by 0.3 percent ($40) in the bottom quintile, 1.4 percent ($840) in the middle
quintile, 2.0 percent in the top quintile ($5,420), and 1.8 percent ($28,430) in the top 1 percent
(Tables A9 and 9).
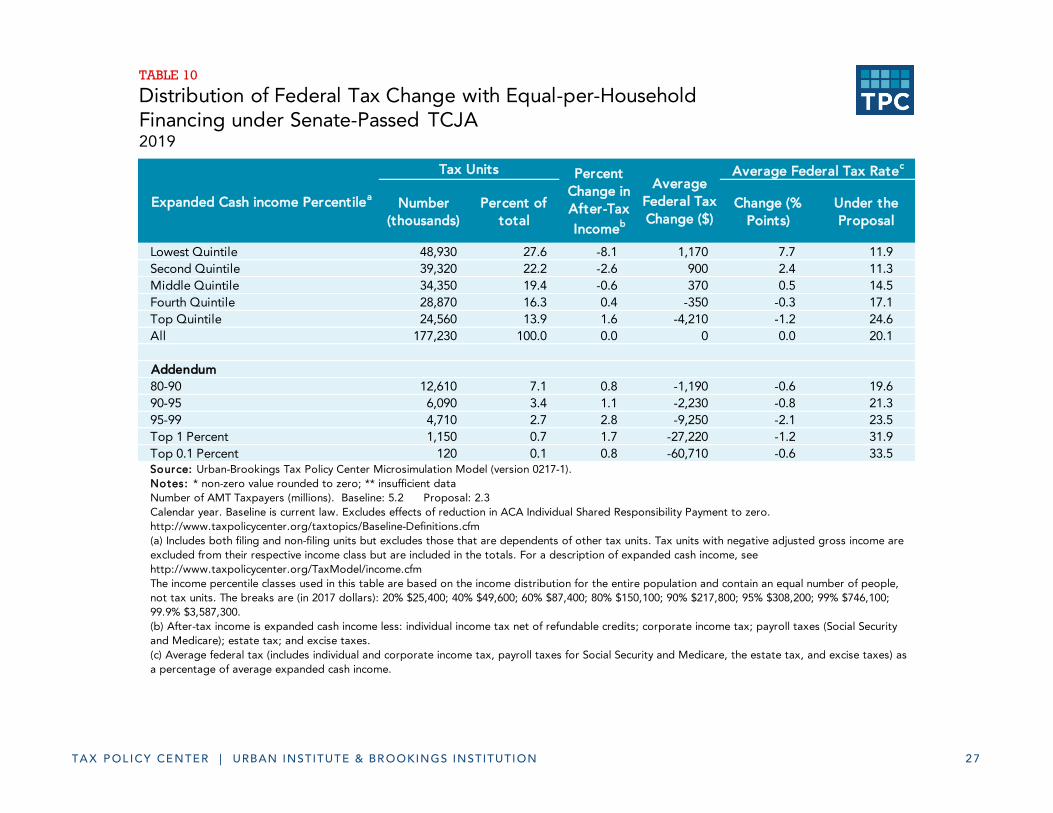
If the Senate bill were financed by fees that were equal in dollar amounts per tax unit (or spending
cuts with similar effect), the combined effect of financing and the direct provisions of the tax cut
would cut taxes in 2019 for 28 percent of households ($3,350 on average) and raise taxes for 72
percent of households ($1,310 on average), including almost 100 percent of households in the
bottom quintile, who would face an average increase of $1,240, and 66 percent of households in
the middle quintile. Average after-tax income in 2019 would drop by 8.1 percent ($1,170) in the
bottom quintile and 0.6 percent ($370) in the middle quintile. It would increase by 1.6 percent in
the top quintile ($4,210) and 1.7 percent ($27,220) in the top 1 percent (Tables A10 and 10).
If the Senate bill were financed by fees or spending cuts that are proportional to income, the
combined effect of financing and the direct provisions of the tax cut would cut taxes in 2019 for 34
percent of households ($1,820 on average), and raise taxes for 64 percent of households ($970 on
average), including 93 percent of households in the bottom quintile, who would face an average
increase of $180. Average after-tax income in 2019 would drop by 1.1 percent ($160) in the bottom
quintile and 0.1 percent ($40) in the middle quintile. It would increase by 0.3 percent in the top
quintile on average ($880), but drop by 0.1 percent ($1,510) in the top 1 percent (Tables A11 and
11).
If the Senate bill were financed by fees that are proportional to current income tax liability, the
combined effect of financing and the direct provisions of the tax cut would cut taxes in 2019 for 65
percent of households ($990 on average), and raise taxes for 17 percent of households ($3,840 on
average), including 44 percent of households in the top quintile, who would face an average
increase of $8,160. Average after-tax income in 2019 would increase by 0.2 percent ($20) in the
bottom quintile and 0.7 percent ($410) in the middle quintile. It would drop by 0.5 percent in the
top quintile ($1,230) and by 2.6 percent ($40,950) in the top 1 percent (Tables A12 and 12).
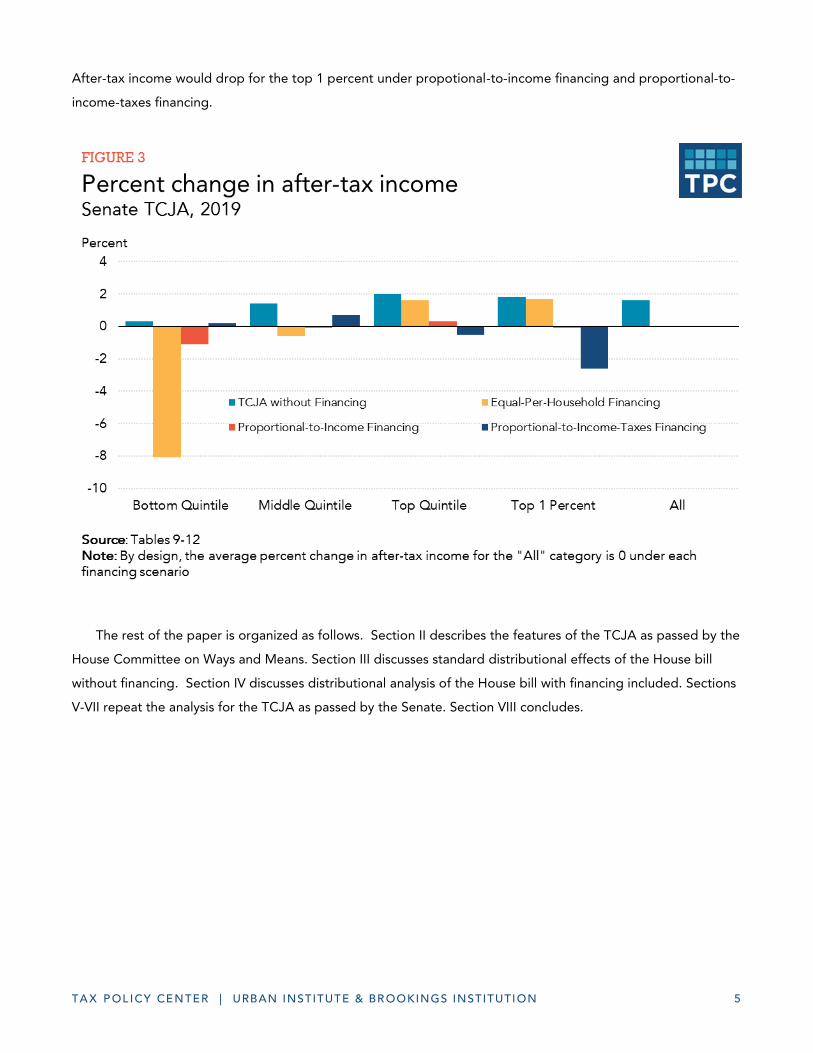
Figure 3 provides a summary and shows the percent change in after-tax income in 2019 across income
groups for each financing scenario of the Senate bill.12 The bottom and middle quintiles would lose out under
the first two financing scenarios. However, the top quintile on average would receive an increase in average
after-tax income under every scenario we model except for proportional-to-income-taxes financing in 2019.
TA X P OL ICY CENTER | URBAN INSTITUTE & BR OOKINGS INSTITUTION 5
After-tax income would drop for the top 1 percent under propotional-to-income financing and proportional-to-
income-taxes financing.
The rest of the paper is organized as follows. Section II describes the features of the TCJA as passed by the
House Committee on Ways and Means. Section III discusses standard distributional effects of the House bill
without financing. Section IV discusses distributional analysis of the House bill with financing included. Sections
V-VII repeat the analysis for the TCJA as passed by the Senate. Section VIII concludes.

II. THE HOUSE PROPOSALS
TA X P OL ICY CENTER | URBAN INSTITUTE & BR OOKINGS INSTITUTION 6
The Tax Cuts and Jobs Act, as passed by the House Committee on Ways and Means on November 9, 2017 (and
subsequently passed with minor amendments by the full chamber on November 16, 2017), would:13
Individual Income Tax:
Set individual income tax rates at 12, 25, 35, and 39.6 percent and create an additional “bubble”
tax of 6 percent for certain high-income households;14
Repeal the alternative minimum tax;
Increase the standard deduction to $12,200 for single filers and $24,400 for joint filers;
Repeal personal and dependent exemptions;
Increase the child credit to $1,600 and raise the income level at which the credit phases out;
Create a temporary additional $300 credit for the taxpayer, spouse, and other dependents;
Repeal most itemized deductions other than those for mortgage interest and charitable
contributions;
Lower the limit of deductible mortgage principle to $500,000 on a primary residence;
Eliminate the deduction for state and local income and sales taxes and cap the deduction of state
and local property taxes at $10,000;
Repeal several other exemptions, deductions, and credits;
Use an alternative measure of inflation to index tax brackets and other tax parameters;
Reduce the maximum tax rate on certain income from pass-through businesses to 25 percent;15
Corporate Tax:
Reduce the corporate income tax rate to 20 percent;
Repeal the corporate alternative minimum tax;
Allow full expensing for new investments in depreciable property other than structures until 2023;
Partially limit the ability of corporations to deduct net interest;
Repeal other business-related special exclusions and deductions;
TA X P OL ICY CENTER | URBAN INSTITUTE & BR OOKINGS INSTITUTION 7
Adopt a modified territorial system of taxing foreign-source income with provisions to limit
avoidance;
Impose a one-time tax on un-repatriated foreign earnings; and
Estate Tax:
Double the exemption threshold for the estate tax, and repeal the tax after 2024.
III. DISTRIBUTIONAL EFFECTS OF THE HOUSE BILL WITHOUT FINANCING
TA X P OL ICY CENTER | URBAN INSTITUTE & BR OOKINGS INSTITUTION 8
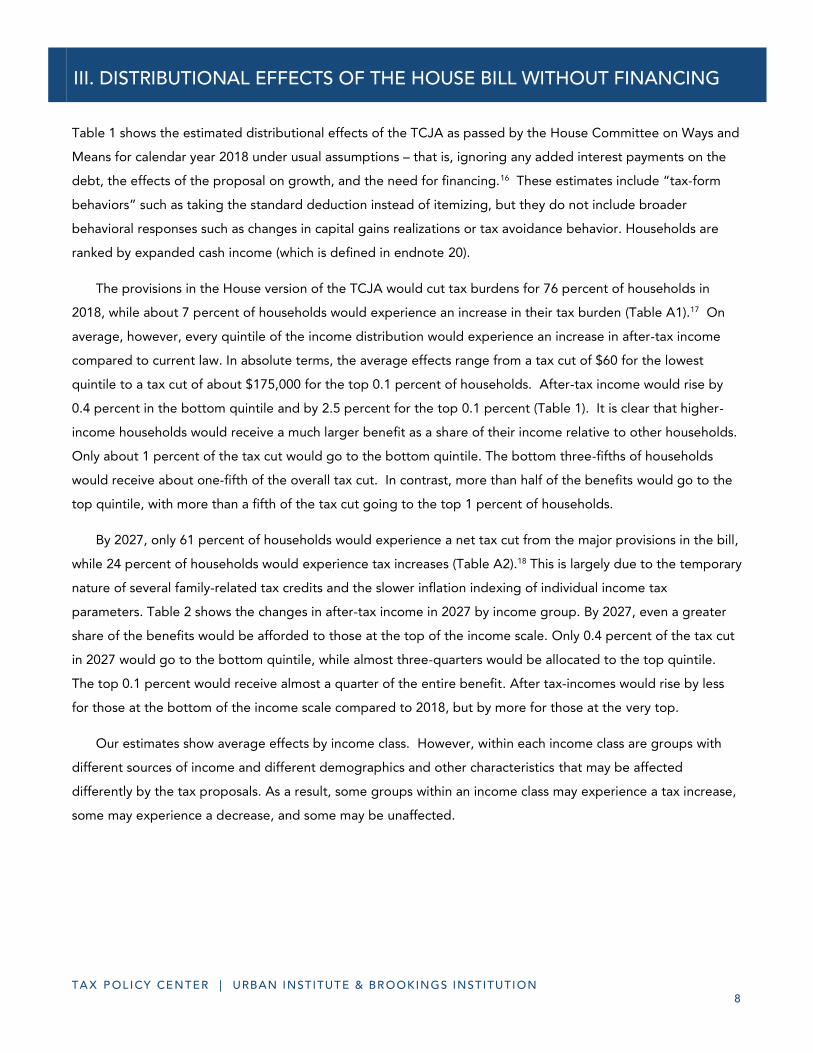
Table 1 shows the estimated distributional effects of the TCJA as passed by the House Committee on Ways and
Means for calendar year 2018 under usual assumptions – that is, ignoring any added interest payments on the
debt, the effects of the proposal on growth, and the need for financing.16 These estimates include “tax-form
behaviors” such as taking the standard deduction instead of itemizing, but they do not include broader
behavioral responses such as changes in capital gains realizations or tax avoidance behavior. Households are
ranked by expanded cash income (which is defined in endnote 20).
The provisions in the House version of the TCJA would cut tax burdens for 76 percent of households in
2018, while about 7 percent of households would experience an increase in their tax burden (Table A1).17 On
average, however, every quintile of the income distribution would experience an increase in after-tax income
compared to current law. In absolute terms, the average effects range from a tax cut of $60 for the lowest
quintile to a tax cut of about $175,000 for the top 0.1 percent of households. After-tax income would rise by
0.4 percent in the bottom quintile and by 2.5 percent for the top 0.1 percent (Table 1). It is clear that higher-
income households would receive a much larger benefit as a share of their income relative to other households.
Only about 1 percent of the tax cut would go to the bottom quintile. The bottom three-fifths of households
would receive about one-fifth of the overall tax cut. In contrast, more than half of the benefits would go to the
top quintile, with more than a fifth of the tax cut going to the top 1 percent of households.
By 2027, only 61 percent of households would experience a net tax cut from the major provisions in the bill,
while 24 percent of households would experience tax increases (Table A2).18 This is largely due to the temporary
nature of several family-related tax credits and the slower inflation indexing of individual income tax
parameters. Table 2 shows the changes in after-tax income in 2027 by income group. By 2027, even a greater
share of the benefits would be afforded to those at the top of the income scale. Only 0.4 percent of the tax cut
in 2027 would go to the bottom quintile, while almost three-quarters would be allocated to the top quintile.
The top 0.1 percent would receive almost a quarter of the entire benefit. After tax-incomes would rise by less
for those at the bottom of the income scale compared to 2018, but by more for those at the very top.
Our estimates show average effects by income class. However, within each income class are groups with
different sources of income and different demographics and other characteristics that may be affected
differently by the tax proposals. As a result, some groups within an income class may experience a tax increase,
some may experience a decrease, and some may be unaffected.

IV. HOUSE BILL FINANCING OPTIONS
TA X P OL ICY CENTER | URBAN INSTITUTE & BR OOKINGS INSTITUTION 9
FRAMEWORK
We do not know how the proposals, if enacted, would eventually be financed, just that the budget constraints
facing the government would not disappear. There is an infinite number of ways to fully finance the proposed
tax cut. In this paper, we focus on three specific options.
Equal-per-household financing: Under this scenario, each tax filing unit (which usually corresponds
with “household”19) pays the same dollar amount in added burden. Something approximating this
scenario would be the case if there were a combination of cuts in transfers (which would affect
mainly low-income and to some extent middle-income households) coupled with an income tax
increase (which would mainly affect high-income households and to some extent middle-income
households). This is the least progressive of the three financing options that we formally analyze.
Proportional-to-income financing: Under this scenario, each household pays the same percentage
of its income to cover the added burdens created by the tax cut. We use expanded cash income
(ECI) under current law as the income measure.20 Tax units with zero or negative ECI would not face
any direct financing costs. This would be more progressive than equal-per-household financing, but
less progressive than the third option, proportional increases in income taxes.
Proportional-to-income-taxes financing: In this scenario, each household pays the same percentage
increase in its federal income taxes (calculated on a current law pre-credit basis) to cover the added
burdens. This policy can be thought of as fairly close to what an across-the-board increase in
income tax rates would generate. Only those with positive pre-credit income tax liabilities bear
financing costs in this scenario. This would be the most progressive of the three formal options.
Note that these three options do not span – in progressivity terms – the range of possible financing options.
An increase in taxes focused solely on high-income households would be more progressive than any of the
options. In contrast, an across-the-board cut in income-tested government spending would be more regressive
– and hurt low-income households more – than any of the three scenarios. A scenario more regressive than
equal-per-household financing would most accurately characterize the policy preferences embedded in recent
proposals by the Trump Administration and Congressional Republicans – for example, the Trump
Administration’s budget, the budget resolutions passed by the House and Senate, and the House’s passage of
deep Medicaid cuts as part of efforts to bring about health care reform.21 Additionally, several Republicans
have indicated that the next step after tax reform is to cut spending in programs such as Medicare and Social
Security.22

TA X P OL ICY CENTER | URBAN INSTITUTE & BR OOKINGS INSTITUTION 1 0
In each scenario, the total amount of financing offsets the burden from the tax cuts in either calendar year
2018 or calendar year 2027.23 We ignore the burden effects of subsequent interest costs stemming from the tax
cuts. If we included those costs, households would be worse off, across-the-board, than shown below.
RESULTS: EFFECTS OF FINANCING
Tables 3 through 8 show the combined effect of the House tax proposals and the financing cost for each
financing scenario by income group.24
Under equal-per-household financing, each household would have to pay $1,180 in 2018 and $860 in 2027
to cover the costs of the tax cuts in those years. (By construction, this is the average federal tax change per tax
filing unit under the House legislation as shown in Tables 1 and 2). The inclusion of financing dramatically
changes the distributional results.
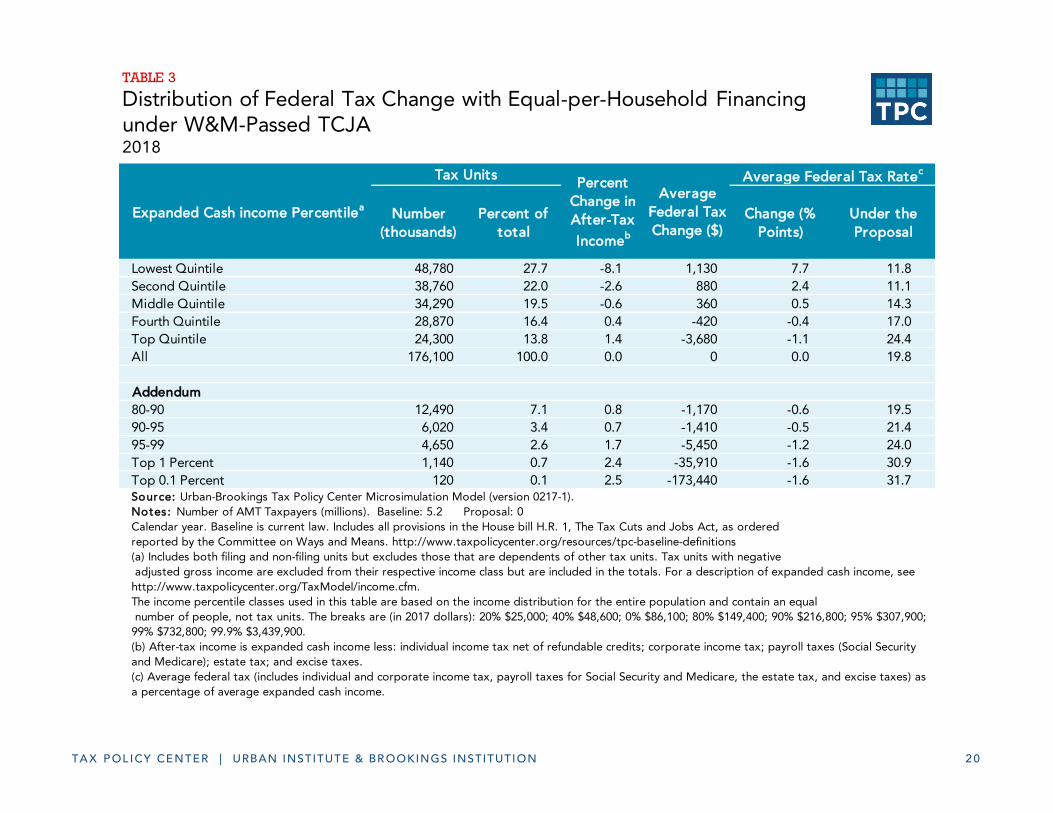
Whereas households in all quintiles, on average, would receive benefits in 2018 from the tax proposal alone,
the combination of tax cuts plus equal-per-household financing raises net burdens on households in the bottom
three quintiles on average (Table 3). Households in the bottom quintile would experience a $1,130 reduction in
their after-tax income in 2018 on average (after subtracting the $1,180 in financing from their $60 average tax
cut),25 which produces an 8.1 percent reduction in after-tax income on average from the combination of the tax
cut and the financing (Table 3). Middle-income households – those in the middle quintile – would face a 0.6
percent reduction in after-tax income ($360) from the combination of the tax cut and the financing. On the
other hand, households in the top 40 percent, on average, would be better off even after the financing was
included. Households in the fourth quintile would receive an average tax cut of $420 after equal-per-household
financing. The top 1 percent would continue to have an average net gain around $36,000, which would equate
to a 2.4 percent increase in after-tax income. Those in the top 0.1 percent would still gain, on average, about
$173,000 per household in 2018.
The results of equal-per-household financing are quite different once several of the temporary provisions in
the legislation expire. In 2027, under the scenario with equal-per-household financing, all income groups except
the top 5 percent, on average, would experience a net drop in after-tax income (Table 4). However, since the
required financing amount would be smaller in 2027, the drop in after-tax income would be smaller for the
bottom two quintiles compared to 2018.
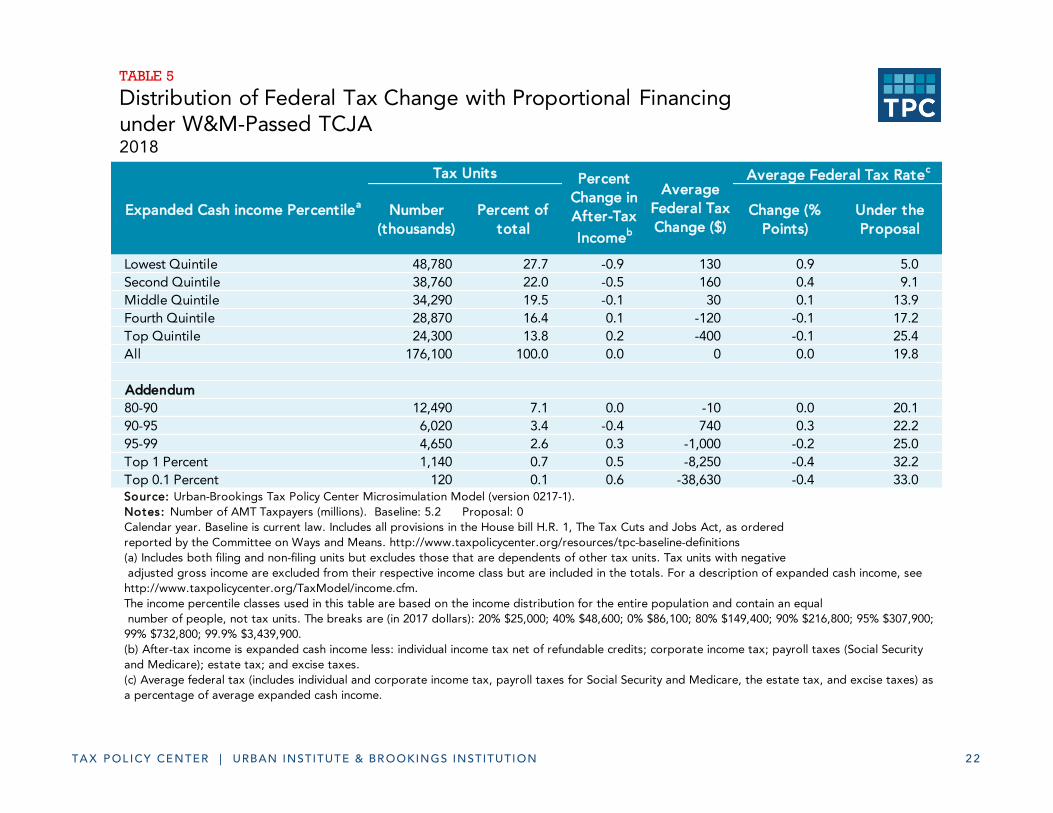
Tables 5 and 6 show what would happen if the tax proposal were coupled with proportional-to-income
financing.26 Households would have to pay, on average, 1.6 percent of their income (ECI) under current law in
2018 (Table 1) and 0.9 percent of income in 2027 (Table 2) to cover the burden of the tax proposal in those
years.
In 2018, the bottom 60 percent of households and the 90th-95th percentiles, on average, would be worse off
(Table 5). Average after-tax income would decrease by between 0.1 and 0.9 percent for these groups, on
TA X P OL ICY CENTER | URBAN INSTITUTE & BR OOKINGS INSTITUTION 1 1
average, but it would increase by 0.5 percent for the top 1 percent. Those in the fourth quintile would be better
off after proportional-to-income financing, realizing average tax cuts of $120 and a slight increase in after-tax
income.
By 2027, every income group in the bottom 95 percent would be worse off, on average, under
proportional-to-income financing relative to current law. Average after-tax income would drop for these groups
by between 0.2 and 0.7 percent (Table 6). However, households in the top 5 percent would still experience an
increase in after-tax income. For example, average federal taxes for those in the top 1 percent would decrease
on net by about $38,000.
Tables 7 and 8 show results under the proportional-to-income-tax financing scenario. Since federal income
taxes are progressive, this financing scenario would place greater burdens on those with higher incomes.
Hence, the overall distributional results are quite different from those under the other financing options.
In 2018, under this scenario, all income groups except those in the top 10 percent, on average, would
experience a net increase in after-tax income (Table 7). The bottom quintile would receive a small average tax
cut of $50 and see their after-tax income rise by 0.3 percent because many low-income households pay no
income tax (and thus bear little burden of the financing cost under this scenario). Households in the middle
quintile would experience an average increase in after-tax income of about 0.7 percent ($400) under this
scenario in 2018. In stark opposition to the other two financing scenarios, those in the top 1 percent would
experience an increase in federal taxes of about $30,000. After-tax income for this group would drop by 1.9
percent.
The results under proportional-to-income-tax financing would be quite different in 2027. Here, the bottom
quintile would realize a negligible change relative to current law, but after-tax income would drop for those in
the second quintile and the 80th-95th percentiles (Table 8). Households in the third quintile, fourth quintile, and
top 5 percent would experience 0.1 to 0.6 percent net increases in after-tax income, on average. Again, the
largest gains would be enjoyed by the top 0.1 percent of households.
V. THE SENATE PROPOSALS
TA X P OL ICY CENTER | URBAN INSTITUTE & BR OOKINGS INSTITUTION 1 2
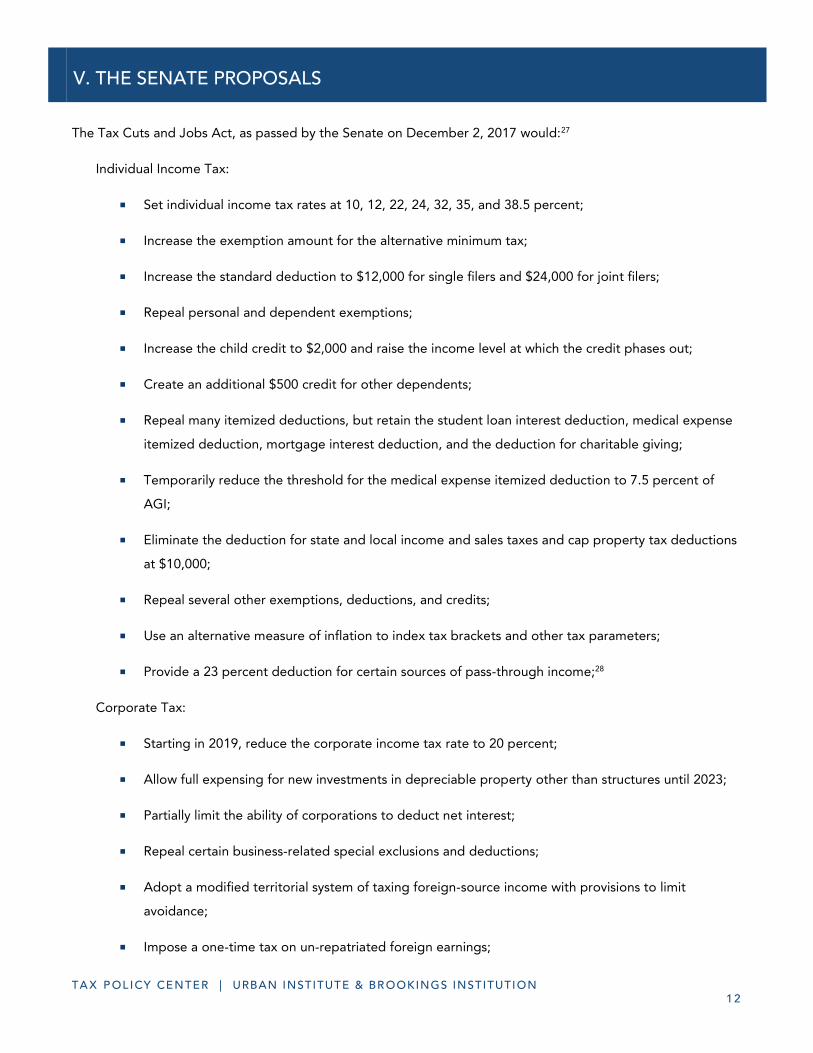
The Tax Cuts and Jobs Act, as passed by the Senate on December 2, 2017 would:27
Individual Income Tax:
Set individual income tax rates at 10, 12, 22, 24, 32, 35, and 38.5 percent;
Increase the exemption amount for the alternative minimum tax;
Increase the standard deduction to $12,000 for single filers and $24,000 for joint filers;
Repeal personal and dependent exemptions;
Increase the child credit to $2,000 and raise the income level at which the credit phases out;
Create an additional $500 credit for other dependents;
Repeal many itemized deductions, but retain the student loan interest deduction, medical expense
itemized deduction, mortgage interest deduction, and the deduction for charitable giving;
Temporarily reduce the threshold for the medical expense itemized deduction to 7.5 percent of
AGI;
Eliminate the deduction for state and local income and sales taxes and cap property tax deductions
at $10,000;
Repeal several other exemptions, deductions, and credits;
Use an alternative measure of inflation to index tax brackets and other tax parameters;
Provide a 23 percent deduction for certain sources of pass-through income;28
Corporate Tax:
Starting in 2019, reduce the corporate income tax rate to 20 percent;
Allow full expensing for new investments in depreciable property other than structures until 2023;
Partially limit the ability of corporations to deduct net interest;
Repeal certain business-related special exclusions and deductions;
Adopt a modified territorial system of taxing foreign-source income with provisions to limit
avoidance;
Impose a one-time tax on un-repatriated foreign earnings;

TA X P OL ICY CENTER | URBAN INSTITUTE & BR OOKINGS INSTITUTION 1 3
Other:
Double the exemption threshold for the estate tax; and
Repeal the ACA individual mandate penalty.29
VI. DISTRIBUTIONAL EFFECTS OF THE SENATE BILL WITHOUT FINANCING
TA X P OL ICY CENTER | URBAN INSTITUTE & BR OOKINGS INSTITUTION 1 4
Table 9 shows the estimated distributional effects of the TCJA as passed by the Senate for calendar year 2019
under usual assumptions – that is, ignoring any added interest payments on the debt, the effects of the
proposal on growth, and the need for financing.30 This is similar in construction to Table 1 that analyzes the
House bill for calendar year 2018.
Major provisions in the Senate version of the TCJA would cut tax burdens for 75 percent of households in
2019, while about 7 percent of households would experience an increase in their tax burden (Table A9).31 On
average, however, every quintile of the income distribution would experience an increase in after-tax income
compared to current law. In absolute terms, the average effects range from a tax cut of $40 for the lowest
quintile to a tax cut of about $62,000 for the top 0.1 percent of households. After-tax income would rise by 0.3
percent in the bottom quintile and 2.0 percent for the top quintile (Table 9). In particular, the largest
percentage gains would be enjoyed by those in the 95th-99th percentiles, who would experience an average
increase in after-tax income of 3.1 percent. Less than 1 percent of the tax cut would go to the bottom quintile.
The bottom three-fifths of households would receive about one-fifth of the overall tax cut. In contrast, more
than three-fifths of the benefits would go to the top quintile, with about a quarter of the tax cuts going to
households in the 95th-99th percentiles.
VII. SENATE BILL FINANCING OPTIONS
TA X P OL ICY CENTER | URBAN INSTITUTE & BR OOKINGS INSTITUTION 1 5
FRAMEWORK
When analyzing the distributional effects of financing the TCJA as passed by the Senate, we employ similar
procedures as above. In each scenario, the total amount of financing offsets the burden from the tax cuts in
calendar year 2019. Again, we ignore the burden effects of subsequent interest costs stemming from the tax
cuts. If we included those costs, households would be worse off, across-the-board, than shown below. We do
not present a similar analysis for 2027 because the Senate bill is estimated to raise some revenue in that year,
eliminating the need to consider financing decisions.
RESULTS: EFFECTS OF FINANCING
Tables 10 through 12 show the combined effect of the Senate tax proposals and the financing cost for each
financing scenario by income group.
Under equal-per-household financing, each household would have to pay $1,210 in 2019 to cover the costs
of the tax cuts in that year. (By construction, this is the average federal tax change per tax filing unit under the
Senate legislation as shown in Table 9). Similar to the House bill, the inclusion of financing dramatically changes
the distributional results.
Whereas households in all quintiles, on average, would receive benefits in 2019 from the tax proposal alone,
the combination of tax cuts plus equal-per-household financing raises net burdens on the bottom 60 percent of
households on average (Table 10). Households in the bottom quintile would experience a $1,170 reduction in
their after-tax income in 2019 on average (after subtracting the $1,210 in financing from their $40 average tax
cut), which produces an 8.1 percent reduction in after-tax income on average from the combination of the tax
cut and the financing (Table 10). Middle-income households – those in the middle quintile – would face an
average 0.6 percent reduction in after-tax income ($370) from the combination of the tax cut and the financing.
On the other hand, households in the top 40 percent, on average, would be better off even after the financing
was included. Households in the fourth quintile would receive an average tax cut of $350 after equal-per-
household financing. The top 1 percent would have an average net gain of about $27,000, which would equate
to a 1.7 percent increase in after-tax income. Households in the 95th-99th percentiles would still experience the
largest percentage increase in after-tax income in 2019, on average, which is 2.8 percent.
Table 11 shows what would happen if the tax proposal were coupled with proportional-to-income
financing.32 Households would have to pay, on average, 1.6 percent of their income (ECI) under current law in
2019 (Table 9) to cover the burden of the tax proposal in that year.

TA X P OL ICY CENTER | URBAN INSTITUTE & BR OOKINGS INSTITUTION 1 6
In 2019, after-tax income for households in the bottom 60 percent and top 1 percent would drop after
proportional-to-income financing. However, it would increase by less than 0.2 percent on average for
households in the 60th-95th percentiles. Average after-tax income would increase by 1.4 percent for those in the
95th-99th percentiles under this scenario.
Table 12 shows results under the proportional-to-income-tax financing scenario. Since federal income taxes
are progressive, this financing scenario would place greater burdens on those with higher incomes. Hence, the
overall distributional results are in stark opposition to those under the other financing options.
In 2019, under this scenario, all income groups except households in the 90th-95th percentiles and the top 1
percent, on average, would experience a net increase in after-tax income (Table 12). The bottom quintile would
receive a small average tax cut of $20 and see their after-tax income rise by 0.2 percent because many low-
income households pay no income tax (and thus bear little burden of the financing cost under this scenario).
Households in the middle quintile would experience an average increase in after-tax income of about 0.7
percent ($410) under this scenario in 2019. Those in the top 1 percent would experience an increase in federal
taxes of about $41,000. After-tax income for this group would drop by 2.6 percent.
VIII. CONCLUSION
TA X P OL ICY CENTER | URBAN INSTITUTE & BR OOKINGS INSTITUTION 1 7
The direct effects of the provisions in the TCJA would be regressive. They would initially benefit, on average,
every income group in the economy, but they would generally provide much larger tax cuts – relative to current
tax burdens, relative to income, and in dollar terms – to the highest income groups. When the notion that the
tax cuts must be paid for is taken into account, the results become even more regressive under scenarios that
appear to most closely resemble recent Administration and Congressional budget proposals. Under equal-per-
household financing or proportional-to-income financing, the tax cuts would generally continue to be
regressive. The results are mixed under proportional-to-income-taxes financing, but it is questionable how
likely a financing scheme similar to this would come into effect under the current Administration.
While it would be nice if tax cuts could be designed to benefit everyone, accounting for the costs of
financing inevitably produces winners and losers. Moreover, the choice of financing mechanism matters. These
results emphasize that there are no free lunches in tax reform.

TABLES
TA X P OL ICY CENTER | URBAN INSTITUTE & BR OOKINGS INSTITUTION 1 8
Number
(thousands)
Percent of
total
Change (%
Points)
Under the
Proposal
Lowest Quintile 48,780 27.7 0.4 1.3 -60 -0.4 3.7
Second Quintile 38,760 22.0 0.9 5.7 -310 -0.9 7.8
Middle Quintile 34,290 19.5 1.4 13.6 -830 -1.2 12.6
Fourth Quintile 28,870 16.4 1.7 22.3 -1,610 -1.4 15.9
Top Quintile 24,300 13.8 1.9 56.7 -4,860 -1.4 24.1
All 176,100 100.0 1.6 100.0 -1,180 -1.3 18.5
Addendum
80-90 12,490 7.1 1.6 14.1 -2,350 -1.3 18.8
90-95 6,020 3.4 1.3 7.5 -2,590 -1.0 21.0
95-99 4,650 2.6 2.0 14.8 -6,640 -1.5 23.7
Top 1 Percent 1,140 0.7 2.4 20.3 -37,100 -1.7 30.9
Top 0.1 Percent 120 0.1 2.5 9.7 -174,620 -1.7 31.7
Average
Federal Tax
Change ($)
Average Federal Tax Ratec
Source: Urban-Brookings Tax Policy Center Microsimulation Model (version 0217-1).
Notes: Number of AMT Taxpayers (millions). Baseline: 5.2 Proposal: 0
Calendar year. Baseline is current law. Includes all provisions in the House bill H.R. 1, The Tax Cuts and Jobs Act, as ordered
reported by the Committee on Ways and Means. http://www.taxpolicycenter.org/resources/tpc-baseline-definitions
(a) Includes both filing and non-filing units but excludes those that are dependents of other tax units. Tax units with negative
adjusted gross income are excluded from their respective income class but are included in the totals. For a description of expanded cash income, see
http://www.taxpolicycenter.org/TaxModel/income.cfm.
The income percentile classes used in this table are based on the income distribution for the entire population and contain an equal
number of people, not tax units. The breaks are (in 2017 dollars): 20% $25,000; 40% $48,600; 0% $86,100; 80% $149,400; 90% $216,800; 95% $307,900; 99% $732,800;
99.9% $3,439,900.
(b) After-tax income is expanded cash income less: individual income tax net of refundable credits; corporate income tax; payroll taxes (Social Security and Medicare);
estate tax; and excise taxes.
(c) Average federal tax (includes individual and corporate income tax, payroll taxes for Social Security and Medicare, the estate tax, and excise taxes) as a percentage
of average expanded cash income.
Expanded Cash income Percentilea
Tax Units Percent
Change in
After-Tax
Incomeb
Share of
Total
Federal Tax
Change
TABLE 1
Distribution of Federal Tax Change under W&M-Passed TCJA2018

TA X P OL ICY CENTER | URBAN INSTITUTE & BR OOKINGS INSTITUTION 1 9
Number
(thousands)
Percent of
total
Change (%
Points)
Under the
Proposal
Lowest Quintile 50,190 26.9 0.1 0.4 -10 -0.1 4.2
Second Quintile 42,290 22.7 0.1 1.3 -50 -0.1 8.8
Middle Quintile 36,880 19.8 0.5 8.1 -360 -0.4 13.4
Fourth Quintile 30,280 16.2 0.7 15.8 -840 -0.6 16.4
Top Quintile 25,810 13.8 1.3 73.6 -4,590 -1.0 25.3
All 186,640 100.0 0.9 100.0 -860 -0.7 19.5
Addendum
80-90 13,370 7.2 0.4 6.7 -810 -0.3 19.4
90-95 6,290 3.4 0.2 2.4 -600 -0.2 21.7
95-99 4,930 2.6 1.4 17.5 -5,690 -1.0 24.6
Top 1 Percent 1,220 0.7 2.6 47.1 -62,300 -1.8 31.7
Top 0.1 Percent 120 0.1 3.0 24.4 -320,640 -2.0 31.8Source: Urban-Brookings Tax Policy Center Microsimulation Model (version 0217-1).
Notes: Number of AMT Taxpayers (millions). Baseline: 5.6 Proposal: 0
Calendar year. Baseline is current law. Includes all provisions in the House bill H.R. 1, The Tax Cuts and Jobs Act, as ordered reported by the Committee on Ways and
Means. http://www.taxpolicycenter.org/resources/tpc-baseline-definitions
(a) Includes both filing and non-filing units but excludes those that are dependents of other tax units. Tax units with negative adjusted gross income are excluded from
their respective income class but are included in the totals. For a description of expanded cash income, see http://www.taxpolicycenter.org/TaxModel/income.cfm.
The income percentile classes used in this table are based on the income distribution for the entire population and contain an equal number of people, not tax units.
The breaks are (in 2017 dollars): 20% $28,100; 40% $54,700; 60% $93,200; 80% $154,900; 90% $225,400; 95% $304,600; 99% $912,100; 99.9% $5,088,900.
(b) After-tax income is expanded cash income less: individual income tax net of refundable credits; corporate income tax; payroll taxes (Social Security and Medicare);
estate tax; and excise taxes.
(c) Average federal tax (includes individual and corporate income tax, payroll taxes for Social Security and Medicare, the estate tax, and excise taxes) as a percentage
of average expanded cash income.
Expanded Cash income Percentilea
Tax Units Percent
Change in
After-Tax
Incomeb
Share of
Total
Federal Tax
Change
Average
Federal Tax
Change ($)
Average Federal Tax Ratec
TABLE 2
Distribution of Federal Tax Change under W&M-Passed TCJA2027
TA X P OL ICY CENTER | URBAN INSTITUTE & BR OOKINGS INSTITUTION 2 0
Number
(thousands)
Percent of
total
Change (%
Points)
Under the
Proposal
Lowest Quintile 48,780 27.7 -8.1 1,130 7.7 11.8
Second Quintile 38,760 22.0 -2.6 880 2.4 11.1
Middle Quintile 34,290 19.5 -0.6 360 0.5 14.3
Fourth Quintile 28,870 16.4 0.4 -420 -0.4 17.0
Top Quintile 24,300 13.8 1.4 -3,680 -1.1 24.4
All 176,100 100.0 0.0 0 0.0 19.8
Addendum
80-90 12,490 7.1 0.8 -1,170 -0.6 19.5
90-95 6,020 3.4 0.7 -1,410 -0.5 21.4
95-99 4,650 2.6 1.7 -5,450 -1.2 24.0
Top 1 Percent 1,140 0.7 2.4 -35,910 -1.6 30.9
Top 0.1 Percent 120 0.1 2.5 -173,440 -1.6 31.7Source: Urban-Brookings Tax Policy Center Microsimulation Model (version 0217-1).
Notes: Number of AMT Taxpayers (millions). Baseline: 5.2 Proposal: 0
Calendar year. Baseline is current law. Includes all provisions in the House bill H.R. 1, The Tax Cuts and Jobs Act, as ordered
reported by the Committee on Ways and Means. http://www.taxpolicycenter.org/resources/tpc-baseline-definitions
(a) Includes both filing and non-filing units but excludes those that are dependents of other tax units. Tax units with negative
adjusted gross income are excluded from their respective income class but are included in the totals. For a description of expanded cash income, see
http://www.taxpolicycenter.org/TaxModel/income.cfm.
The income percentile classes used in this table are based on the income distribution for the entire population and contain an equal
number of people, not tax units. The breaks are (in 2017 dollars): 20% $25,000; 40% $48,600; 0% $86,100; 80% $149,400; 90% $216,800; 95% $307,900;
99% $732,800; 99.9% $3,439,900.
(b) After-tax income is expanded cash income less: individual income tax net of refundable credits; corporate income tax; payroll taxes (Social Security
and Medicare); estate tax; and excise taxes.
(c) Average federal tax (includes individual and corporate income tax, payroll taxes for Social Security and Medicare, the estate tax, and excise taxes) as
a percentage of average expanded cash income.
Percent
Change in
After-Tax
Incomeb
Expanded Cash income Percentilea
Tax Units
Average
Federal Tax
Change ($)
Average Federal Tax Ratec
TABLE 3
Distribution of Federal Tax Change with Equal-per-Household Financingunder W&M-Passed TCJA2018

TA X P OL ICY CENTER | URBAN INSTITUTE & BR OOKINGS INSTITUTION 2 1
Number
(thousands)
Percent of
total
Change (%
Points)
Under the
Proposal
Lowest Quintile 50,190 26.9 -4.3 850 4.2 8.5
Second Quintile 42,290 22.7 -1.8 810 1.6 10.5
Middle Quintile 36,880 19.8 -0.7 510 0.6 14.4
Fourth Quintile 30,280 16.2 0.0 30 0.0 17.0
Top Quintile 25,810 13.8 1.1 -3,730 -0.8 25.5
All 186,640 100.0 0.0 0 0.0 20.2
Addendum
80-90 13,370 7.2 0.0 50 0.0 19.8
90-95 6,290 3.4 -0.1 260 0.1 22.0
95-99 4,930 2.6 1.1 -4,830 -0.9 24.7
Top 1 Percent 1,220 0.7 2.6 -61,440 -1.7 31.7
Top 0.1 Percent 120 0.1 3.0 -319,780 -2.0 31.8Source: Urban-Brookings Tax Policy Center Microsimulation Model (version 0217-1).
Notes: Number of AMT Taxpayers (millions). Baseline: 5.6 Proposal: 0
Calendar year. Baseline is current law. Includes all provisions in the House bill H.R. 1, The Tax Cuts and Jobs Act, as ordered reported by the Committee
on Ways and Means. http://www.taxpolicycenter.org/resources/tpc-baseline-definitions
(a) Includes both filing and non-filing units but excludes those that are dependents of other tax units. Tax units with negative adjusted gross income are
excluded from their respective income class but are included in the totals. For a description of expanded cash income, see
http://www.taxpolicycenter.org/TaxModel/income.cfm.
The income percentile classes used in this table are based on the income distribution for the entire population and contain an equal number of people,
not tax units. The breaks are (in 2017 dollars): 20% $28,100; 40% $54,700; 60% $93,200; 80% $154,900; 90% $225,400; 95% $304,600; 99% $912,100;
99.9% $5,088,900.
(b) After-tax income is expanded cash income less: individual income tax net of refundable credits; corporate income tax; payroll taxes (Social Security
and Medicare); estate tax; and excise taxes.
(c) Average federal tax (includes individual and corporate income tax, payroll taxes for Social Security and Medicare, the estate tax, and excise taxes) as
a percentage of average expanded cash income.
Expanded Cash income Percentilea
Tax Units Percent
Change in
After-Tax
Incomeb
Average
Federal Tax
Change ($)
Average Federal Tax Ratec
TABLE 4
Distribution of Federal Tax Change with Equal-per-Household Financingunder W&M-Passed TCJA2027
TA X P OL ICY CENTER | URBAN INSTITUTE & BR OOKINGS INSTITUTION 2 2
Number
(thousands)
Percent of
total
Change (%
Points)
Under the
Proposal
Lowest Quintile 48,780 27.7 -0.9 130 0.9 5.0
Second Quintile 38,760 22.0 -0.5 160 0.4 9.1
Middle Quintile 34,290 19.5 -0.1 30 0.1 13.9
Fourth Quintile 28,870 16.4 0.1 -120 -0.1 17.2
Top Quintile 24,300 13.8 0.2 -400 -0.1 25.4
All 176,100 100.0 0.0 0 0.0 19.8
Addendum
80-90 12,490 7.1 0.0 -10 0.0 20.1
90-95 6,020 3.4 -0.4 740 0.3 22.2
95-99 4,650 2.6 0.3 -1,000 -0.2 25.0
Top 1 Percent 1,140 0.7 0.5 -8,250 -0.4 32.2
Top 0.1 Percent 120 0.1 0.6 -38,630 -0.4 33.0Source: Urban-Brookings Tax Policy Center Microsimulation Model (version 0217-1).
Notes: Number of AMT Taxpayers (millions). Baseline: 5.2 Proposal: 0
Calendar year. Baseline is current law. Includes all provisions in the House bill H.R. 1, The Tax Cuts and Jobs Act, as ordered
reported by the Committee on Ways and Means. http://www.taxpolicycenter.org/resources/tpc-baseline-definitions
(a) Includes both filing and non-filing units but excludes those that are dependents of other tax units. Tax units with negative
adjusted gross income are excluded from their respective income class but are included in the totals. For a description of expanded cash income, see
http://www.taxpolicycenter.org/TaxModel/income.cfm.
The income percentile classes used in this table are based on the income distribution for the entire population and contain an equal
number of people, not tax units. The breaks are (in 2017 dollars): 20% $25,000; 40% $48,600; 0% $86,100; 80% $149,400; 90% $216,800; 95% $307,900;
99% $732,800; 99.9% $3,439,900.
(b) After-tax income is expanded cash income less: individual income tax net of refundable credits; corporate income tax; payroll taxes (Social Security
and Medicare); estate tax; and excise taxes.
(c) Average federal tax (includes individual and corporate income tax, payroll taxes for Social Security and Medicare, the estate tax, and excise taxes) as
a percentage of average expanded cash income.
Expanded Cash income Percentilea
Tax Units Percent
Change in
After-Tax
Incomeb
Average
Federal Tax
Change ($)
Average Federal Tax Ratec
TABLE 5
Distribution of Federal Tax Change with Proportional Financing under W&M-Passed TCJA2018

TA X P OL ICY CENTER | URBAN INSTITUTE & BR OOKINGS INSTITUTION 2 3
Number
(thousands)
Percent of
total
Change (%
Points)
Under the
Proposal
Lowest Quintile 50,190 26.9 -0.7 130 0.6 4.9
Second Quintile 42,290 22.7 -0.6 300 0.6 9.4
Middle Quintile 36,880 19.8 -0.3 270 0.3 14.1
Fourth Quintile 30,280 16.2 -0.2 200 0.1 17.1
Top Quintile 25,810 13.8 0.4 -1,310 -0.3 26.0
All 186,640 100.0 0.0 0 0.0 20.2
Addendum
80-90 13,370 7.2 -0.4 800 0.3 20.1
90-95 6,290 3.4 -0.6 1,630 0.5 22.4
95-99 4,930 2.6 0.4 -1,800 -0.3 25.3
Top 1 Percent 1,220 0.7 1.6 -37,870 -1.1 32.4
Top 0.1 Percent 120 0.1 2.0 -211,270 -1.3 32.5Source: Urban-Brookings Tax Policy Center Microsimulation Model (version 0217-1).
Notes: Number of AMT Taxpayers (millions). Baseline: 5.6 Proposal: 0
Calendar year. Baseline is current law. Includes all provisions in the House bill H.R. 1, The Tax Cuts and Jobs Act, as ordered reported by the Committee
on Ways and Means. http://www.taxpolicycenter.org/resources/tpc-baseline-definitions
(a) Includes both filing and non-filing units but excludes those that are dependents of other tax units. Tax units with negative adjusted gross income are
excluded from their respective income class but are included in the totals. For a description of expanded cash income, see
http://www.taxpolicycenter.org/TaxModel/income.cfm.
The income percentile classes used in this table are based on the income distribution for the entire population and contain an equal number of people,
not tax units. The breaks are (in 2017 dollars): 20% $28,100; 40% $54,700; 60% $93,200; 80% $154,900; 90% $225,400; 95% $304,600; 99% $912,100;
99.9% $5,088,900.
(b) After-tax income is expanded cash income less: individual income tax net of refundable credits; corporate income tax; payroll taxes (Social Security
and Medicare); estate tax; and excise taxes.
(c) Average federal tax (includes individual and corporate income tax, payroll taxes for Social Security and Medicare, the estate tax, and excise taxes) as
a percentage of average expanded cash income.
Percent
Change in
After-Tax
Incomeb
Expanded Cash income Percentilea
Tax UnitsAverage
Federal Tax
Change ($)
Average Federal Tax Ratec
TABLE 6
Distribution of Federal Tax Change with Proportional Financing under W&M-Passed TCJA2027

TA X P OL ICY CENTER | URBAN INSTITUTE & BR OOKINGS INSTITUTION 2 4
Number
(thousands)
Percent of
total
Change (%
Points)
Under the
Proposal
Lowest Quintile 48,780 27.7 0.3 -50 -0.3 3.8
Second Quintile 38,760 22.0 0.6 -190 -0.5 8.1
Middle Quintile 34,290 19.5 0.7 -400 -0.6 13.2
Fourth Quintile 28,870 16.4 0.6 -560 -0.5 16.8
Top Quintile 24,300 13.8 -0.6 1,660 0.5 25.9
All 176,100 100.0 0.0 0 0.0 19.8
Addendum
80-90 12,490 7.1 0.2 -300 -0.2 20.0
90-95 6,020 3.4 -0.4 870 0.3 22.3
95-99 4,650 2.6 -0.3 1,100 0.3 25.5
Top 1 Percent 1,140 0.7 -1.9 29,520 1.3 33.8
Top 0.1 Percent 120 0.1 -2.1 149,570 1.4 34.8Source: Urban-Brookings Tax Policy Center Microsimulation Model (version 0217-1).
Notes: Number of AMT Taxpayers (millions). Baseline: 5.2 Proposal: 0
Calendar year. Baseline is current law. Includes all provisions in the House bill H.R. 1, The Tax Cuts and Jobs Act, as ordered
reported by the Committee on Ways and Means. http://www.taxpolicycenter.org/resources/tpc-baseline-definitions
(a) Includes both filing and non-filing units but excludes those that are dependents of other tax units. Tax units with negative
adjusted gross income are excluded from their respective income class but are included in the totals. For a description of expanded cash income, see
http://www.taxpolicycenter.org/TaxModel/income.cfm.
The income percentile classes used in this table are based on the income distribution for the entire population and contain an equal
number of people, not tax units. The breaks are (in 2017 dollars): 20% $25,000; 40% $48,600; 0% $86,100; 80% $149,400; 90% $216,800; 95% $307,900;
99% $732,800; 99.9% $3,439,900.
(b) After-tax income is expanded cash income less: individual income tax net of refundable credits; corporate income tax; payroll taxes (Social Security
and Medicare); estate tax; and excise taxes.
(c) Average federal tax (includes individual and corporate income tax, payroll taxes for Social Security and Medicare, the estate tax, and excise taxes) as
a percentage of average expanded cash income.
Expanded Cash income Percentilea
Tax Units Percent
Change in
After-Tax
Incomeb
Average
Federal Tax
Change ($)
Average Federal Tax Ratec
TABLE 7
Distribution of Federal Tax Change with Proportional-to-Income Taxes Financing under W&M-Passed TCJA2018

TA X P OL ICY CENTER | URBAN INSTITUTE & BR OOKINGS INSTITUTION 2 5
Number
(thousands)
Percent of
total
Change (%
Points)
Under the
Proposal
Lowest Quintile 50,190 26.9 0.0 * 0.0 4.3
Second Quintile 42,290 22.7 -0.1 40 0.1 8.9
Middle Quintile 36,880 19.8 0.1 -50 -0.1 13.8
Fourth Quintile 30,280 16.2 0.1 -160 -0.1 16.8
Top Quintile 25,810 13.8 -0.1 250 0.1 26.3
All 186,640 100.0 0.0 0 0.0 20.2
Addendum
80-90 13,370 7.2 -0.3 500 0.2 20.0
90-95 6,290 3.4 -0.6 1,510 0.5 22.4
95-99 4,930 2.6 0.2 -630 -0.1 25.5
Top 1 Percent 1,220 0.7 0.2 -5,440 -0.2 33.3
Top 0.1 Percent 120 0.1 0.6 -63,200 -0.4 33.4Source: Urban-Brookings Tax Policy Center Microsimulation Model (version 0217-1).
Notes: Number of AMT Taxpayers (millions). Baseline: 5.6 Proposal: 0
Calendar year. Baseline is current law. Includes all provisions in the House bill H.R. 1, The Tax Cuts and Jobs Act, as ordered reported by the Committee
on Ways and Means. http://www.taxpolicycenter.org/resources/tpc-baseline-definitions
(a) Includes both filing and non-filing units but excludes those that are dependents of other tax units. Tax units with negative adjusted gross income are
excluded from their respective income class but are included in the totals. For a description of expanded cash income, see
http://www.taxpolicycenter.org/TaxModel/income.cfm.
The income percentile classes used in this table are based on the income distribution for the entire population and contain an equal number of people,
not tax units. The breaks are (in 2017 dollars): 20% $28,100; 40% $54,700; 60% $93,200; 80% $154,900; 90% $225,400; 95% $304,600; 99% $912,100;
99.9% $5,088,900.
(b) After-tax income is expanded cash income less: individual income tax net of refundable credits; corporate income tax; payroll taxes (Social Security
and Medicare); estate tax; and excise taxes.
(c) Average federal tax (includes individual and corporate income tax, payroll taxes for Social Security and Medicare, the estate tax, and excise taxes) as
a percentage of average expanded cash income.
Expanded Cash income Percentilea
Tax Units Percent
Change in
After-Tax
Incomeb
Average
Federal Tax
Change ($)
Average Federal Tax Ratec
TABLE 8
Distribution of Federal Tax Change with Proportional-to-Income-Taxes Financing under W&M-Passed TCJA2027

TA X P OL ICY CENTER | URBAN INSTITUTE & BR OOKINGS INSTITUTION 2 6
Number
(thousands)
Percent of
total
Change (%
Points)
Under the
Proposal
Lowest Quintile 48,930 27.6 0.3 0.8 -40 -0.2 4.0
Second Quintile 39,320 22.2 0.9 5.6 -300 -0.8 8.1
Middle Quintile 34,350 19.4 1.4 13.5 -840 -1.2 12.7
Fourth Quintile 28,870 16.3 1.6 21.0 -1,560 -1.3 16.1
Top Quintile 24,560 13.9 2.0 62.2 -5,420 -1.5 24.3
All 177,230 100.0 1.6 100.0 -1,210 -1.3 18.8
Addendum
80-90 12,610 7.1 1.6 14.1 -2,400 -1.3 18.9
90-95 6,090 3.4 1.7 9.8 -3,430 -1.3 20.8
95-99 4,710 2.7 3.1 23.0 -10,460 -2.3 23.2
Top 1 Percent 1,150 0.7 1.8 15.3 -28,430 -1.2 31.9
Top 0.1 Percent 120 0.1 0.8 3.4 -61,920 -0.6 33.5Source: Urban-Brookings Tax Policy Center Microsimulation Model (version 0217-1).
Notes: * non-zero value rounded to zero; ** insufficient data
Number of AMT Taxpayers (millions). Baseline: 5.2 Proposal: 2.3
Calendar year. Baseline is current law. Excludes effects of reduction in ACA Individual Shared Responsibility Payment to zero.
http://www.taxpolicycenter.org/taxtopics/Baseline-Definitions.cfm
(a) Includes both filing and non-filing units but excludes those that are dependents of other tax units. Tax units with negative adjusted gross income are excluded from
their respective income class but are included in the totals. For a description of expanded cash income, see http://www.taxpolicycenter.org/TaxModel/income.cfm
The income percentile classes used in this table are based on the income distribution for the entire population and contain an equal number of people, not tax units.
The breaks are (in 2017 dollars): 20% $25,400; 40% $49,600; 60% $87,400; 80% $150,100; 90% $217,800; 95% $308,200; 99% $746,100; 99.9% $3,587,300.
(b) After-tax income is expanded cash income less: individual income tax net of refundable credits; corporate income tax; payroll taxes (Social Security and Medicare);
estate tax; and excise taxes.
(c) Average federal tax (includes individual and corporate income tax, payroll taxes for Social Security and Medicare, the estate tax, and excise taxes) as a percentage
of average expanded cash income.
Expanded Cash income Percentilea
Tax Units Percent
Change in
After-Tax
Incomeb
Share of
Total
Federal Tax
Change
Average
Federal Tax
Change ($)
Average Federal Tax Ratec
TABLE 9
Distribution of Federal Tax Change under Senate-Passed TCJA2019
TA X P OL ICY CENTER | URBAN INSTITUTE & BR OOKINGS INSTITUTION 2 7
Number
(thousands)
Percent of
total
Change (%
Points)
Under the
Proposal
Lowest Quintile 48,930 27.6 -8.1 1,170 7.7 11.9
Second Quintile 39,320 22.2 -2.6 900 2.4 11.3
Middle Quintile 34,350 19.4 -0.6 370 0.5 14.5
Fourth Quintile 28,870 16.3 0.4 -350 -0.3 17.1
Top Quintile 24,560 13.9 1.6 -4,210 -1.2 24.6
All 177,230 100.0 0.0 0 0.0 20.1
Addendum
80-90 12,610 7.1 0.8 -1,190 -0.6 19.6
90-95 6,090 3.4 1.1 -2,230 -0.8 21.3
95-99 4,710 2.7 2.8 -9,250 -2.1 23.5
Top 1 Percent 1,150 0.7 1.7 -27,220 -1.2 31.9
Top 0.1 Percent 120 0.1 0.8 -60,710 -0.6 33.5Source: Urban-Brookings Tax Policy Center Microsimulation Model (version 0217-1).
Notes: * non-zero value rounded to zero; ** insufficient data
Number of AMT Taxpayers (millions). Baseline: 5.2 Proposal: 2.3
Calendar year. Baseline is current law. Excludes effects of reduction in ACA Individual Shared Responsibility Payment to zero.
http://www.taxpolicycenter.org/taxtopics/Baseline-Definitions.cfm
(a) Includes both filing and non-filing units but excludes those that are dependents of other tax units. Tax units with negative adjusted gross income are
excluded from their respective income class but are included in the totals. For a description of expanded cash income, see
http://www.taxpolicycenter.org/TaxModel/income.cfm
The income percentile classes used in this table are based on the income distribution for the entire population and contain an equal number of people,
not tax units. The breaks are (in 2017 dollars): 20% $25,400; 40% $49,600; 60% $87,400; 80% $150,100; 90% $217,800; 95% $308,200; 99% $746,100;
99.9% $3,587,300.
(b) After-tax income is expanded cash income less: individual income tax net of refundable credits; corporate income tax; payroll taxes (Social Security
and Medicare); estate tax; and excise taxes.
(c) Average federal tax (includes individual and corporate income tax, payroll taxes for Social Security and Medicare, the estate tax, and excise taxes) as
a percentage of average expanded cash income.
Percent
Change in
After-Tax
Incomeb
Expanded Cash income Percentilea
Tax UnitsAverage
Federal Tax
Change ($)
Average Federal Tax Ratec
TABLE 10
Distribution of Federal Tax Change with Equal-per-HouseholdFinancing under Senate-Passed TCJA2019

TA X P OL ICY CENTER | URBAN INSTITUTE & BR OOKINGS INSTITUTION 2 8
Number
(thousands)
Percent of
total
Change (%
Points)
Under the
Proposal
Lowest Quintile 48,930 27.6 -1.1 160 1.0 5.3
Second Quintile 39,320 22.2 -0.5 170 0.5 9.3
Middle Quintile 34,350 19.4 -0.1 40 0.1 14.0
Fourth Quintile 28,870 16.3 0.1 -50 0.0 17.4
Top Quintile 24,560 13.9 0.3 -880 -0.2 25.6
All 177,230 100.0 0.0 0 0.0 20.1
Addendum
80-90 12,610 7.1 0.0 -40 0.0 20.2
90-95 6,090 3.4 0.0 -70 0.0 22.1
95-99 4,710 2.7 1.4 -4,760 -1.1 24.4
Top 1 Percent 1,150 0.7 -0.1 1,510 0.1 33.2
Top 0.1 Percent 120 0.1 -1.1 78,340 0.7 34.8Source: Urban-Brookings Tax Policy Center Microsimulation Model (version 0217-1).
Notes: * non-zero value rounded to zero; ** insufficient data
Number of AMT Taxpayers (millions). Baseline: 5.2 Proposal: 2.3
Calendar year. Baseline is current law. Excludes effects of reduction in ACA Individual Shared Responsibility Payment to zero.
http://www.taxpolicycenter.org/taxtopics/Baseline-Definitions.cfm
(a) Includes both filing and non-filing units but excludes those that are dependents of other tax units. Tax units with negative adjusted gross income are
excluded from their respective income class but are included in the totals. For a description of expanded cash income, see
http://www.taxpolicycenter.org/TaxModel/income.cfm
The income percentile classes used in this table are based on the income distribution for the entire population and contain an equal number of people,
not tax units. The breaks are (in 2017 dollars): 20% $25,400; 40% $49,600; 60% $87,400; 80% $150,100; 90% $217,800; 95% $308,200; 99% $746,100;
99.9% $3,587,300.
(b) After-tax income is expanded cash income less: individual income tax net of refundable credits; corporate income tax; payroll taxes (Social Security
and Medicare); estate tax; and excise taxes.
(c) Average federal tax (includes individual and corporate income tax, payroll taxes for Social Security and Medicare, the estate tax, and excise taxes) as
a percentage of average expanded cash income.
Expanded Cash income Percentilea
Tax Units Percent
Change in
After-Tax
Incomeb
Average
Federal Tax
Change ($)
Average Federal Tax Ratec
TABLE 11
Distribution of Federal Tax Change with Proportional Financing under Senate-Passed TCJA2019

TA X P OL ICY CENTER | URBAN INSTITUTE & BR OOKINGS INSTITUTION 2 9
Number
(thousands)
Percent of
total
Change (%
Points)
Under the
Proposal
Lowest Quintile 48,930 27.6 0.2 -20 -0.2 4.1
Second Quintile 39,320 22.2 0.5 -180 -0.5 8.4
Middle Quintile 34,350 19.4 0.7 -410 -0.6 13.4
Fourth Quintile 28,870 16.3 0.5 -500 -0.4 17.0
Top Quintile 24,560 13.9 -0.5 1,230 0.3 26.2
All 177,230 100.0 0.0 0 0.0 20.1
Addendum
80-90 12,610 7.1 0.2 -350 -0.2 20.0
90-95 6,090 3.4 0.0 40 0.0 22.1
95-99 4,710 2.7 0.8 -2,730 -0.6 24.9
Top 1 Percent 1,150 0.7 -2.6 40,950 1.7 34.8
Top 0.1 Percent 120 0.1 -3.7 273,400 2.5 36.5Source: Urban-Brookings Tax Policy Center Microsimulation Model (version 0217-1).
Notes: * non-zero value rounded to zero; ** insufficient data
Number of AMT Taxpayers (millions). Baseline: 5.2 Proposal: 2.3
Calendar year. Baseline is current law. Excludes effects of reduction in ACA Individual Shared Responsibility Payment to zero.
http://www.taxpolicycenter.org/taxtopics/Baseline-Definitions.cfm
(a) Includes both filing and non-filing units but excludes those that are dependents of other tax units. Tax units with negative adjusted gross income are
excluded from their respective income class but are included in the totals. For a description of expanded cash income, see
http://www.taxpolicycenter.org/TaxModel/income.cfm
The income percentile classes used in this table are based on the income distribution for the entire population and contain an equal number of people,
not tax units. The breaks are (in 2017 dollars): 20% $25,400; 40% $49,600; 60% $87,400; 80% $150,100; 90% $217,800; 95% $308,200; 99% $746,100;
99.9% $3,587,300.
(b) After-tax income is expanded cash income less: individual income tax net of refundable credits; corporate income tax; payroll taxes (Social Security
and Medicare); estate tax; and excise taxes.
(c) Average federal tax (includes individual and corporate income tax, payroll taxes for Social Security and Medicare, the estate tax, and excise taxes) as
a percentage of average expanded cash income.
Expanded Cash income Percentilea
Tax Units Percent
Change in
After-Tax
Incomeb
Average
Federal Tax
Change ($)
Average Federal Tax Ratec
TABLE 12
Distribution of Federal Tax Change with Proportional-to-Income Taxes Financing under Senate-Passed TCJA2019

APPENDIX TABLES
TA X P OL ICY CENTER | URBAN INSTITUTE & BR OOKINGS INSTITUTION 3 0
Percent of
Tax Units
Average Tax
Cut
Percent of
Tax Units
Average Tax
IncreaseLowest Quintile 48,780 27.7 48.0 -150 1.7 790 -60 -60
Second Quintile 38,760 22.0 84.0 -440 6.3 860 -310 -320
Middle Quintile 34,290 19.5 88.8 -1,090 9.8 1,100 -830 -860
Fourth Quintile 28,870 16.4 88.2 -2,110 11.4 1,580 -1,610 -1,680
Top Quintile 24,300 13.8 87.2 -6,970 12.7 5,080 -4,860 -5,430
All 176,100 100.0 76.0 -1,890 7.4 2,100 -1,180 -1,280
Addendum
80-90 12,490 7.1 86.9 -3,190 13.0 1,930 -2,350 -2,520
90-95 6,020 3.4 84.1 -3,790 15.8 2,060 -2,590 -2,860
95-99 4,650 2.6 93.9 -8,080 5.9 4,320 -6,640 -7,330
Top 1 Percent 1,140 0.7 79.9 -64,210 20.1 40,720 -37,100 -43,120
Top 0.1 Percent 120 0.1 71.7 -350,020 28.3 164,140 -174,620 -204,590Source: Urban-Brookings Tax Policy Center Microsimulation Model (version 0217-1).
Notes: * Non-zero value rounded to zero; ** Insufficient data
Calendar year. Baseline is current law. Due to data limitations, excludes the following provisions: repeal of deduction for moving expenses; limitation on exclusion of employee
achievement awards and certain other fringe benefits; repeal of exclusion for qualified moving expense reimbursement; reduction in minimum age for allowable in-service
distributions; small business accounting method reform and simplification; modifications to state and local bond interest (portion attributable to pass-through entities); and repeal
of technical termination of partnerships. http://www.taxpolicycenter.org/taxtopics/Baseline-Definitions.cfm
(a) Includes both filing and non-filing units but excludes those that are dependents of other tax units. Tax units with negative adjusted gross income are excluded from their
respective income class but are included in the totals. For a description of expanded cash income, seehttp://www.taxpolicycenter.org/TaxModel/income.cfm.
The income percentile classes used in this table are based on the income distribution for the entire population and contain an equal number of people, not tax units. The breaks
are (in 2017 dollars): 20% $25,000; 40% $48,600; 60% $86,100; 80% $149,400; 90% $216,800; 95% $307,900; 99% $732,800; 99.9% $3,439,900.
(b) Includes tax units with a change in federal tax burden of $10 or more in absolute value.
Tax Units with Tax Increase or Cutb
With Tax Cut With Tax IncreaseNumber
(thousands)
Percent of
total
Average Tax Change ($) For
All Tax Units
All ProvisionsMajor
Provisions
Included Here
Expanded Cash Income
Percentilea
Tax Units
TABLE A1
Winners and Losers under W&M-Passed TCJA2018

TA X P OL ICY CENTER | URBAN INSTITUTE & BR OOKINGS INSTITUTION 3 1
Percent of
Tax Units
Average Tax
Cut
Percent of
Tax Units
Average Tax
IncreaseLowest Quintile 50,190 26.9 45.8 -120 13.0 320 -10 -20
Second Quintile 42,290 22.7 64.0 -380 24.0 760 -50 -60
Middle Quintile 36,880 19.8 68.3 -1,110 30.0 1,230 -360 -390
Fourth Quintile 30,280 16.2 72.4 -2,030 27.3 2,090 -840 -900
Top Quintile 25,810 13.8 64.3 -11,430 35.5 5,830 -4,590 -5,280
All 186,640 100.0 61.4 -2,410 24.2 2,080 -860 -980
Addendum
80-90 13,370 7.2 64.3 -3,080 35.5 2,830 -810 -980
90-95 6,290 3.4 54.5 -4,190 45.1 3,510 -600 -700
95-99 4,930 2.6 74.9 -10,740 25.0 6,540 -5,690 -6,410
Top 1 Percent 1,220 0.7 71.1 -126,130 28.9 62,880 -62,300 -71,600
Top 0.1 Percent 120 0.1 71.5 -621,500 28.4 284,630 -320,640 -363,490Source: Urban-Brookings Tax Policy Center Microsimulation Model (version 0217-1).
Notes: * Non-zero value rounded to zero; ** Insufficient data
Calendar year. Baseline is current law. Due to data limitations, excludes the following provisions: repeal of deduction for moving expenses; limitation on exclusion of employee
achievement awards and certain other fringe benefits; repeal of exclusion for qualified moving expense reimbursement; reduction in minimum age for allowable in-service
distributions; small business accounting method reform and simplification; modifications to state and local bond interest (portion attributable to pass-through entities); and repeal
of technical termination of partnerships.
http://www.taxpolicycenter.org/taxtopics/Baseline-Definitions.cfm
(a) Includes both filing and non-filing units but excludes those that are dependents of other tax units. Tax units with negative adjusted gross income are excluded from their
respective income class but are included in the totals. For a description of expanded cash income, see http://www.taxpolicycenter.org/TaxModel/income.cfm
The income percentile classes used in this table are based on the income distribution for the entire population and contain an equal number of people, not tax units. The breaks
are (in 2017 dollars): 20% $28,100; 40% $54,700; 60% $93,200; 80% $154,900; 90% $225,400; 95% $304,600; 99% $912,100; 99.9% $5,088,900.
(b) Includes tax units with a change in federal tax burden of $10 or more in absolute value.
Expanded Cash Income
Percentilea
Tax Units Tax Units with Tax Increase or Cutb Average Tax Change ($) For
Number
(thousands)
Percent of
total
With Tax Cut With Tax IncreaseAll Provisions
Major
Provisions
Included Here
TABLE A2
Winners and Losers under W&M-Passed TCJA2027
TA X P OL ICY CENTER | URBAN INSTITUTE & BR OOKINGS INSTITUTION 3 2
Percent of
Tax Units
Average Tax
Cut
Percent of
Tax Units
Average Tax
Increase
Lowest Quintile * ** 100.0 1,220 1,130 1,220
Second Quintile 0.3 -330 99.7 970 880 960
Middle Quintile 28.1 -570 71.0 820 360 420
Fourth Quintile 66.8 -1,270 32.7 1,380 -420 -400
Top Quintile 74.8 -6,720 25.0 3,530 -3,680 -4,150
All 26.9 -3,230 72.9 1,190 0 0
Addendum
80-90 72.4 -2,410 27.3 1,850 -1,170 -1,240
90-95 69.2 -3,170 30.6 2,020 -1,410 -1,580
95-99 87.8 -7,300 12.1 3,030 -5,450 -6,050
Top 1 Percent 78.3 -64,230 21.7 38,940 -35,910 -41,830
Top 0.1 Percent 71.2 -351,330 28.8 162,150 -173,440 -203,310Source: Urban-Brookings Tax Policy Center Microsimulation Model (version 0217-1).
Notes: * Non-zero value rounded to zero; ** Insufficient data
Calendar year. Baseline is current law. Due to data limitations, excludes the following provisions: repeal of deduction for moving expenses;
limitation on exclusion of employee achievement awards and certain other fringe benefits; repeal of exclusion for qualified moving expense
reimbursement; reduction in minimum age for allowable in-service distributions; small business accounting method reform and simplification;
modifications to state and local bond interest (portion attributable to pass-through entities); and repeal of technical termination of partnerships.
http://www.taxpolicycenter.org/taxtopics/Baseline-Definitions.cfm
(a) Includes both filing and non-filing units but excludes those that are dependents of other tax units. Tax units with negative adjusted gross
income are excluded from their respective income class but are included in the totals. For a description of expanded cash income,
seehttp://www.taxpolicycenter.org/TaxModel/income.cfm.
The income percentile classes used in this table are based on the income distribution for the entire population and contain an equal number of
people, not tax units. The breaks are (in 2017 dollars): 20% $25,000; 40% $48,600; 60% $86,100; 80% $149,400; 90% $216,800; 95% $307,900;
99% $732,800; 99.9% $3,439,900.
(b) Includes tax units with a change in federal tax burden of $10 or more in absolute value.
All Provisions
Expanded Cash Income
Percentilea
Tax Units with Tax Increase or Cutb Average Tax Change ($) For
With Tax Cut With Tax IncreaseMajor
Provisions
Included Here
TABLE A3
Winners and Losers with Equal-per-Household Financing under W&M-Passed TCJA2018

TA X P OL ICY CENTER | URBAN INSTITUTE & BR OOKINGS INSTITUTION 3 3
Percent of
Tax Units
Average Tax
Cut
Percent of
Tax Units
Average Tax
IncreaseLowest Quintile 0.2 -500 99.8 970 850 960
Second Quintile 3.3 -440 96.3 970 810 920
Middle Quintile 32.2 -860 67.0 1,290 510 590
Fourth Quintile 55.0 -1,540 44.7 2,060 30 80
Top Quintile 53.9 -12,560 45.9 5,380 -3,730 -4,300
All 23.6 -4,810 76.1 1,490 0 0
Addendum
80-90 51.4 -2,740 48.3 2,920 50 *
90-95 44.4 -4,050 55.4 3,750 260 280
95-99 68.6 -10,690 31.3 6,110 -4,830 -5,430
Top 1 Percent 70.0 -127,160 30.0 61,500 -61,440 -70,620
Top 0.1 Percent 71.5 -620,630 28.5 284,980 -319,780 -362,510Source: Urban-Brookings Tax Policy Center Microsimulation Model (version 0217-1).
Notes: * Non-zero value rounded to zero; ** Insufficient data
Calendar year. Baseline is current law. Due to data limitations, excludes the following provisions: repeal of deduction for moving expenses;
limitation on exclusion of employee achievement awards and certain other fringe benefits; repeal of exclusion for qualified moving expense
reimbursement; reduction in minimum age for allowable in-service distributions; small business accounting method reform and simplification;
modifications to state and local bond interest (portion attributable to pass-through entities); and repeal of technical termination of partnerships.
http://www.taxpolicycenter.org/taxtopics/Baseline-Definitions.cfm
(a) Includes both filing and non-filing units but excludes those that are dependents of other tax units. Tax units with negative adjusted gross
income are excluded from their respective income class but are included in the totals. For a description of expanded cash income, see
http://www.taxpolicycenter.org/TaxModel/income.cfm
The income percentile classes used in this table are based on the income distribution for the entire population and contain an equal number of
people, not tax units. The breaks are (in 2017 dollars): 20% $28,100; 40% $54,700; 60% $93,200; 80% $154,900; 90% $225,400; 95% $304,600; 99%
$912,100; 99.9% $5,088,900.
(b) Includes tax units with a change in federal tax burden of $10 or more in absolute value.
Expanded Cash Income
Percentilea
Tax Units with Tax Increase or Cutb Average Tax Change ($) For
With Tax Cut With Tax IncreaseAll Provisions
Major
Provisions
Included Here
TABLE A4
Winners and Losers with Equal-per-Household Financing under W&M-Passed TCJA2027
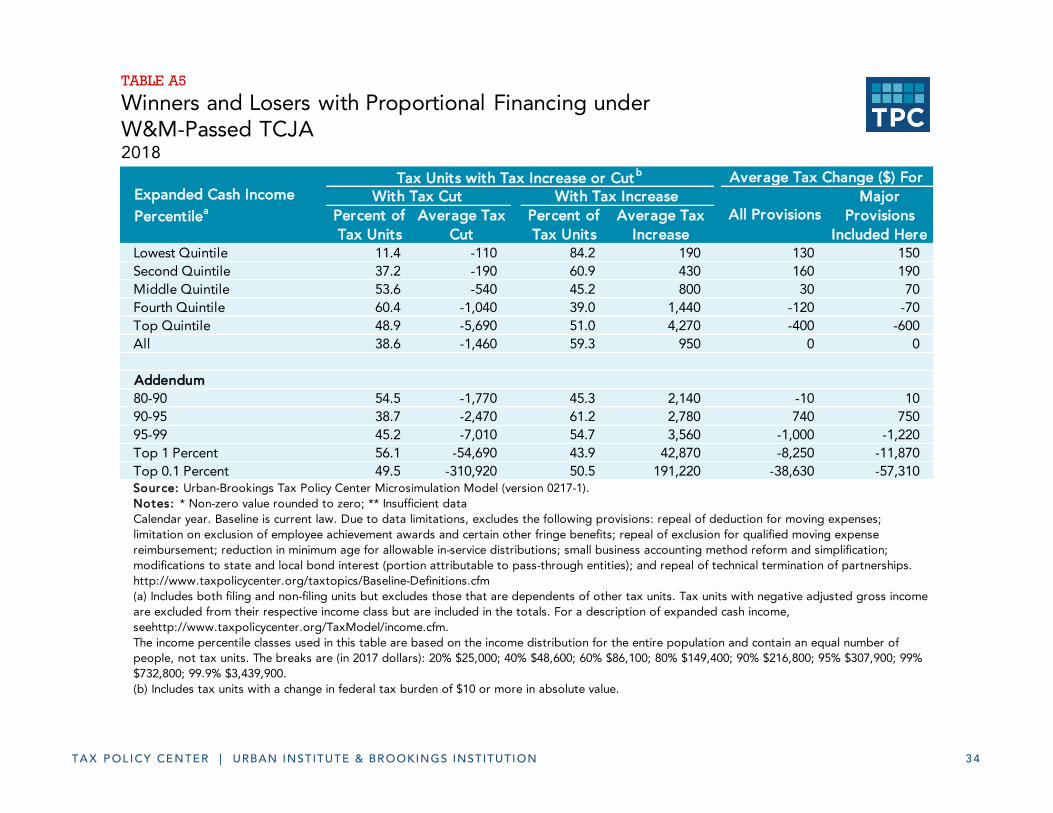
TA X P OL ICY CENTER | URBAN INSTITUTE & BR OOKINGS INSTITUTION 3 4
Percent of
Tax Units
Average Tax
Cut
Percent of
Tax Units
Average Tax
IncreaseLowest Quintile 11.4 -110 84.2 190 130 150
Second Quintile 37.2 -190 60.9 430 160 190
Middle Quintile 53.6 -540 45.2 800 30 70
Fourth Quintile 60.4 -1,040 39.0 1,440 -120 -70
Top Quintile 48.9 -5,690 51.0 4,270 -400 -600
All 38.6 -1,460 59.3 950 0 0
Addendum
80-90 54.5 -1,770 45.3 2,140 -10 10
90-95 38.7 -2,470 61.2 2,780 740 750
95-99 45.2 -7,010 54.7 3,560 -1,000 -1,220
Top 1 Percent 56.1 -54,690 43.9 42,870 -8,250 -11,870
Top 0.1 Percent 49.5 -310,920 50.5 191,220 -38,630 -57,310Source: Urban-Brookings Tax Policy Center Microsimulation Model (version 0217-1).
Notes: * Non-zero value rounded to zero; ** Insufficient data
Calendar year. Baseline is current law. Due to data limitations, excludes the following provisions: repeal of deduction for moving expenses;
limitation on exclusion of employee achievement awards and certain other fringe benefits; repeal of exclusion for qualified moving expense
reimbursement; reduction in minimum age for allowable in-service distributions; small business accounting method reform and simplification;
modifications to state and local bond interest (portion attributable to pass-through entities); and repeal of technical termination of partnerships.
http://www.taxpolicycenter.org/taxtopics/Baseline-Definitions.cfm
(a) Includes both filing and non-filing units but excludes those that are dependents of other tax units. Tax units with negative adjusted gross income
are excluded from their respective income class but are included in the totals. For a description of expanded cash income,
seehttp://www.taxpolicycenter.org/TaxModel/income.cfm.
The income percentile classes used in this table are based on the income distribution for the entire population and contain an equal number of
people, not tax units. The breaks are (in 2017 dollars): 20% $25,000; 40% $48,600; 60% $86,100; 80% $149,400; 90% $216,800; 95% $307,900; 99%
$732,800; 99.9% $3,439,900.
(b) Includes tax units with a change in federal tax burden of $10 or more in absolute value.
Expanded Cash Income
Percentilea
Tax Units with Tax Increase or Cutb Average Tax Change ($) For
With Tax Cut With Tax IncreaseAll Provisions
Major
Provisions
Included Here
TABLE A5
Winners and Losers with Proportional Financing under W&M-Passed TCJA2018

TA X P OL ICY CENTER | URBAN INSTITUTE & BR OOKINGS INSTITUTION 3 5
Percent of
Tax Units
Average Tax
Cut
Percent of
Tax Units
Average Tax
IncreaseLowest Quintile 9.7 -160 85.2 190 130 140
Second Quintile 23.9 -310 74.4 550 300 330
Middle Quintile 42.2 -900 57.1 1,210 270 310
Fourth Quintile 51.8 -1,410 47.9 2,100 200 270
Top Quintile 40.4 -12,980 59.3 6,200 -1,310 -1,560
All 30.6 -3,080 67.3 1,400 0 0
Addendum
80-90 41.8 -2,450 57.6 3,250 800 850
90-95 29.5 -4,170 70.4 4,350 1,630 1,830
95-99 46.1 -11,510 53.6 6,200 -1,800 -1,990
Top 1 Percent 57.4 -125,490 42.6 65,980 -37,870 -43,880
Top 0.1 Percent 59.3 -609,900 40.8 299,340 -211,270 -239,430Source: Urban-Brookings Tax Policy Center Microsimulation Model (version 0217-1).
Notes: * Non-zero value rounded to zero; ** Insufficient data
Calendar year. Baseline is current law. Due to data limitations, excludes the following provisions: repeal of deduction for moving expenses; limitation
on exclusion of employee achievement awards and certain other fringe benefits; repeal of exclusion for qualified moving expense reimbursement;
reduction in minimum age for allowable in-service distributions; small business accounting method reform and simplification; modifications to state
and local bond interest (portion attributable to pass-through entities); and repeal of technical termination of partnerships.
http://www.taxpolicycenter.org/taxtopics/Baseline-Definitions.cfm
(a) Includes both filing and non-filing units but excludes those that are dependents of other tax units. Tax units with negative adjusted gross income
are excluded from their respective income class but are included in the totals. For a description of expanded cash income, see
http://www.taxpolicycenter.org/TaxModel/income.cfm
The income percentile classes used in this table are based on the income distribution for the entire population and contain an equal number of
people, not tax units. The breaks are (in 2017 dollars): 20% $28,100; 40% $54,700; 60% $93,200; 80% $154,900; 90% $225,400; 95% $304,600; 99%
$912,100; 99.9% $5,088,900.
(b) Includes tax units with a change in federal tax burden of $10 or more in absolute value.
Expanded Cash Income
Percentilea
Tax Units with Tax Increase or Cutb Average Tax Change ($) For
With Tax Cut With Tax IncreaseAll Provisions
Major
Provisions
Included Here
TABLE A6
Winners and Losers with Proportional Financing under W&M-Passed TCJA2027

TA X P OL ICY CENTER | URBAN INSTITUTE & BR OOKINGS INSTITUTION 3 6
Percent of
Tax Units
Average Tax
Cut
Percent of
Tax Units
Average Tax
IncreaseLowest Quintile 46.2 -130 3.3 450 -50 -50
Second Quintile 80.9 -320 8.9 720 -190 -190
Middle Quintile 82.1 -680 16.3 970 -400 -400
Fourth Quintile 72.4 -1,290 27.2 1,460 -560 -540
Top Quintile 46.9 -4,370 52.8 6,960 1,660 1,630
All 65.4 -950 17.8 3,490 0 0
Addendum
80-90 58.4 -1,950 41.3 2,030 -300 -300
90-95 35.0 -2,650 64.7 2,800 870 880
95-99 35.0 -7,040 64.9 5,410 1,100 1,050
Top 1 Percent 32.6 -49,690 67.4 67,220 29,520 29,030
Top 0.1 Percent 29.2 -280,520 70.7 322,950 149,570 146,510Source: Urban-Brookings Tax Policy Center Microsimulation Model (version 0217-1).
Notes: * Non-zero value rounded to zero; ** Insufficient data
Calendar year. Baseline is current law. Due to data limitations, excludes the following provisions: repeal of deduction for moving expenses;
limitation on exclusion of employee achievement awards and certain other fringe benefits; repeal of exclusion for qualified moving expense
reimbursement; reduction in minimum age for allowable in-service distributions; small business accounting method reform and simplification;
modifications to state and local bond interest (portion attributable to pass-through entities); and repeal of technical termination of partnerships.
http://www.taxpolicycenter.org/taxtopics/Baseline-Definitions.cfm
(a) Includes both filing and non-filing units but excludes those that are dependents of other tax units. Tax units with negative adjusted gross income
are excluded from their respective income class but are included in the totals. For a description of expanded cash income,
seehttp://www.taxpolicycenter.org/TaxModel/income.cfm.
The income percentile classes used in this table are based on the income distribution for the entire population and contain an equal number of
people, not tax units. The breaks are (in 2017 dollars): 20% $25,000; 40% $48,600; 60% $86,100; 80% $149,400; 90% $216,800; 95% $307,900; 99%
$732,800; 99.9% $3,439,900.
(b) Includes tax units with a change in federal tax burden of $10 or more in absolute value.
Expanded Cash Income
Percentilea
Tax Units with Tax Increase or Cutb Average Tax Change ($) For
With Tax Cut With Tax IncreaseAll Provisions
Major
Provisions
Included Here
TABLE A7
Winners and Losers with Proportional-to-Income-Taxes Financing under W&M-Passed TCJA2018

TA X P OL ICY CENTER | URBAN INSTITUTE & BR OOKINGS INSTITUTION 3 7
Percent of
Tax Units
Average Tax
Cut
Percent of
Tax Units
Average Tax
IncreaseLowest Quintile 40.5 -130 18.1 270 * *
Second Quintile 56.7 -300 30.6 680 40 40
Middle Quintile 58.9 -860 39.0 1,170 -50 -50
Fourth Quintile 61.0 -1,530 38.5 2,080 -160 -130
Top Quintile 41.0 -10,730 58.8 7,850 250 220
All 51.4 -1,790 33.9 2,710 0 0
Addendum
80-90 45.5 -2,520 54.1 3,060 500 510
90-95 30.5 -3,970 69.3 4,190 1,510 1,690
95-99 41.1 -11,600 58.6 7,000 -630 -660
Top 1 Percent 44.4 -124,240 55.7 86,260 -5,440 -7,100
Top 0.1 Percent 47.6 -590,200 52.3 400,340 -63,200 -71,480Source: Urban-Brookings Tax Policy Center Microsimulation Model (version 0217-1).
Notes: * Non-zero value rounded to zero; ** Insufficient data
Calendar year. Baseline is current law. Due to data limitations, excludes the following provisions: repeal of deduction for moving expenses; limitation
on exclusion of employee achievement awards and certain other fringe benefits; repeal of exclusion for qualified moving expense reimbursement;
reduction in minimum age for allowable in-service distributions; small business accounting method reform and simplification; modifications to state
and local bond interest (portion attributable to pass-through entities); and repeal of technical termination of partnerships.
http://www.taxpolicycenter.org/taxtopics/Baseline-Definitions.cfm
(a) Includes both filing and non-filing units but excludes those that are dependents of other tax units. Tax units with negative adjusted gross income
are excluded from their respective income class but are included in the totals. For a description of expanded cash income, see
http://www.taxpolicycenter.org/TaxModel/income.cfm
The income percentile classes used in this table are based on the income distribution for the entire population and contain an equal number of
people, not tax units. The breaks are (in 2017 dollars): 20% $28,100; 40% $54,700; 60% $93,200; 80% $154,900; 90% $225,400; 95% $304,600; 99%
$912,100; 99.9% $5,088,900.
(b) Includes tax units with a change in federal tax burden of $10 or more in absolute value.
Expanded Cash Income
Percentilea
Tax Units with Tax Increase or Cutb Average Tax Change ($) For
With Tax Cut With Tax IncreaseAll Provisions
Major
Provisions
Included Here
TABLE A8
Winners and Losers with Proportional-to-Income-Taxes Financing under W&M-Passed TCJA2027
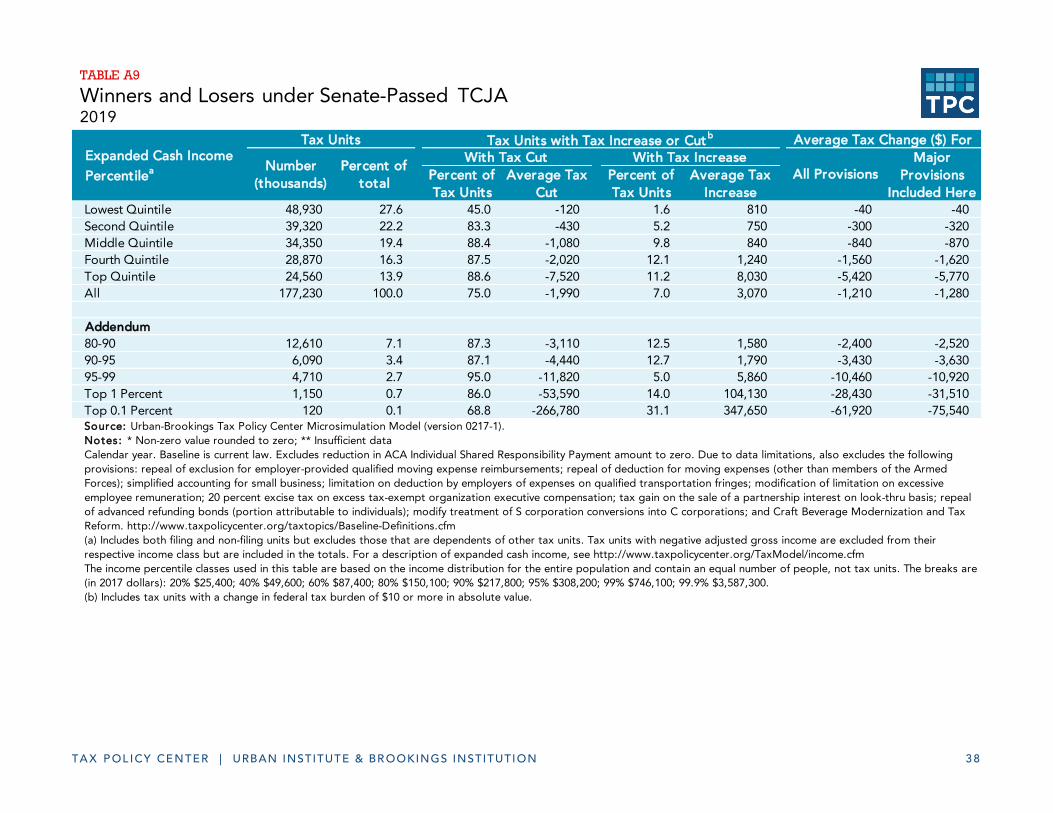
TA X P OL ICY CENTER | URBAN INSTITUTE & BR OOKINGS INSTITUTION 3 8
Percent of
Tax Units
Average Tax
Cut
Percent of
Tax Units
Average Tax
IncreaseLowest Quintile 48,930 27.6 45.0 -120 1.6 810 -40 -40
Second Quintile 39,320 22.2 83.3 -430 5.2 750 -300 -320
Middle Quintile 34,350 19.4 88.4 -1,080 9.8 840 -840 -870
Fourth Quintile 28,870 16.3 87.5 -2,020 12.1 1,240 -1,560 -1,620
Top Quintile 24,560 13.9 88.6 -7,520 11.2 8,030 -5,420 -5,770
All 177,230 100.0 75.0 -1,990 7.0 3,070 -1,210 -1,280
Addendum
80-90 12,610 7.1 87.3 -3,110 12.5 1,580 -2,400 -2,520
90-95 6,090 3.4 87.1 -4,440 12.7 1,790 -3,430 -3,630
95-99 4,710 2.7 95.0 -11,820 5.0 5,860 -10,460 -10,920
Top 1 Percent 1,150 0.7 86.0 -53,590 14.0 104,130 -28,430 -31,510
Top 0.1 Percent 120 0.1 68.8 -266,780 31.1 347,650 -61,920 -75,540Source: Urban-Brookings Tax Policy Center Microsimulation Model (version 0217-1).
Notes: * Non-zero value rounded to zero; ** Insufficient data
Calendar year. Baseline is current law. Excludes reduction in ACA Individual Shared Responsibility Payment amount to zero. Due to data limitations, also excludes the following
provisions: repeal of exclusion for employer-provided qualified moving expense reimbursements; repeal of deduction for moving expenses (other than members of the Armed
Forces); simplified accounting for small business; limitation on deduction by employers of expenses on qualified transportation fringes; modification of limitation on excessive
employee remuneration; 20 percent excise tax on excess tax-exempt organization executive compensation; tax gain on the sale of a partnership interest on look-thru basis; repeal
of advanced refunding bonds (portion attributable to individuals); modify treatment of S corporation conversions into C corporations; and Craft Beverage Modernization and Tax
Reform. http://www.taxpolicycenter.org/taxtopics/Baseline-Definitions.cfm
(a) Includes both filing and non-filing units but excludes those that are dependents of other tax units. Tax units with negative adjusted gross income are excluded from their
respective income class but are included in the totals. For a description of expanded cash income, see http://www.taxpolicycenter.org/TaxModel/income.cfm
The income percentile classes used in this table are based on the income distribution for the entire population and contain an equal number of people, not tax units. The breaks are
(in 2017 dollars): 20% $25,400; 40% $49,600; 60% $87,400; 80% $150,100; 90% $217,800; 95% $308,200; 99% $746,100; 99.9% $3,587,300.
(b) Includes tax units with a change in federal tax burden of $10 or more in absolute value.
Expanded Cash Income
Percentilea
Tax Units Tax Units with Tax Increase or Cutb Average Tax Change ($) For
Number
(thousands)
Percent of
total
With Tax Cut With Tax IncreaseAll Provisions
Major
Provisions
Included Here
TABLE A9
Winners and Losers under Senate-Passed TCJA2019

TA X P OL ICY CENTER | URBAN INSTITUTE & BR OOKINGS INSTITUTION 3 9
Percent of
Tax Units
Average Tax
Cut
Percent of
Tax Units
Average Tax
IncreaseLowest Quintile 0.1 -480 99.9 1,240 1,170 1,230
Second Quintile 2.7 -430 97.2 1,000 900 960
Middle Quintile 32.5 -510 66.3 860 370 400
Fourth Quintile 64.8 -1,200 34.6 1,270 -350 -340
Top Quintile 76.1 -7,360 23.6 4,740 -4,210 -4,490
All 28.1 -3,350 71.6 1,310 0 0
Addendum
80-90 70.7 -2,400 28.9 1,580 -1,190 -1,240
90-95 73.9 -3,830 25.9 1,830 -2,230 -2,360
95-99 91.7 -10,930 8.3 4,580 -9,250 -9,650
Top 1 Percent 84.1 -53,490 15.9 93,010 -27,220 -30,230
Top 0.1 Percent 68.4 -267,120 31.6 343,650 -60,710 -74,260Source: Urban-Brookings Tax Policy Center Microsimulation Model (version 0217-1).
Notes: * Non-zero value rounded to zero; ** Insufficient data
Calendar year. Baseline is current law. Excludes reduction in ACA Individual Shared Responsibility Payment amount to zero. Due to data
limitations, also excludes the following provisions: repeal of exclusion for employer-provided qualified moving expense reimbursements; repeal of
deduction for moving expenses (other than members of the Armed Forces); simplified accounting for small business; limitation on deduction by
employers of expenses on qualified transportation fringes; modification of limitation on excessive employee remuneration; 20 percent excise tax
on excess tax-exempt organization executive compensation; tax gain on the sale of a partnership interest on look-thru basis; repeal of advanced
refunding bonds (portion attributable to individuals); modify treatment of S corporation conversions into C corporations; and Craft Beverage
Modernization and Tax Reform. http://www.taxpolicycenter.org/taxtopics/Baseline-Definitions.cfm
(a) Includes both filing and non-filing units but excludes those that are dependents of other tax units. Tax units with negative adjusted gross
income are excluded from their respective income class but are included in the totals. For a description of expanded cash income, see
http://www.taxpolicycenter.org/TaxModel/income.cfm
The income percentile classes used in this table are based on the income distribution for the entire population and contain an equal number of
people, not tax units. The breaks are (in 2017 dollars): 20% $25,400; 40% $49,600; 60% $87,400; 80% $150,100; 90% $217,800; 95% $308,200; 99%
$746,100; 99.9% $3,587,300.
(b) Includes tax units with a change in federal tax burden of $10 or more in absolute value.
Expanded Cash Income
Percentilea
Tax Units with Tax Increase or Cutb Average Tax Change ($) For
With Tax Cut With Tax IncreaseAll Provisions
Major
Provisions
Included Here
TABLE A10
Winners and Losers with Equal-per-Household Financing under Senate-Passed TCJA2019
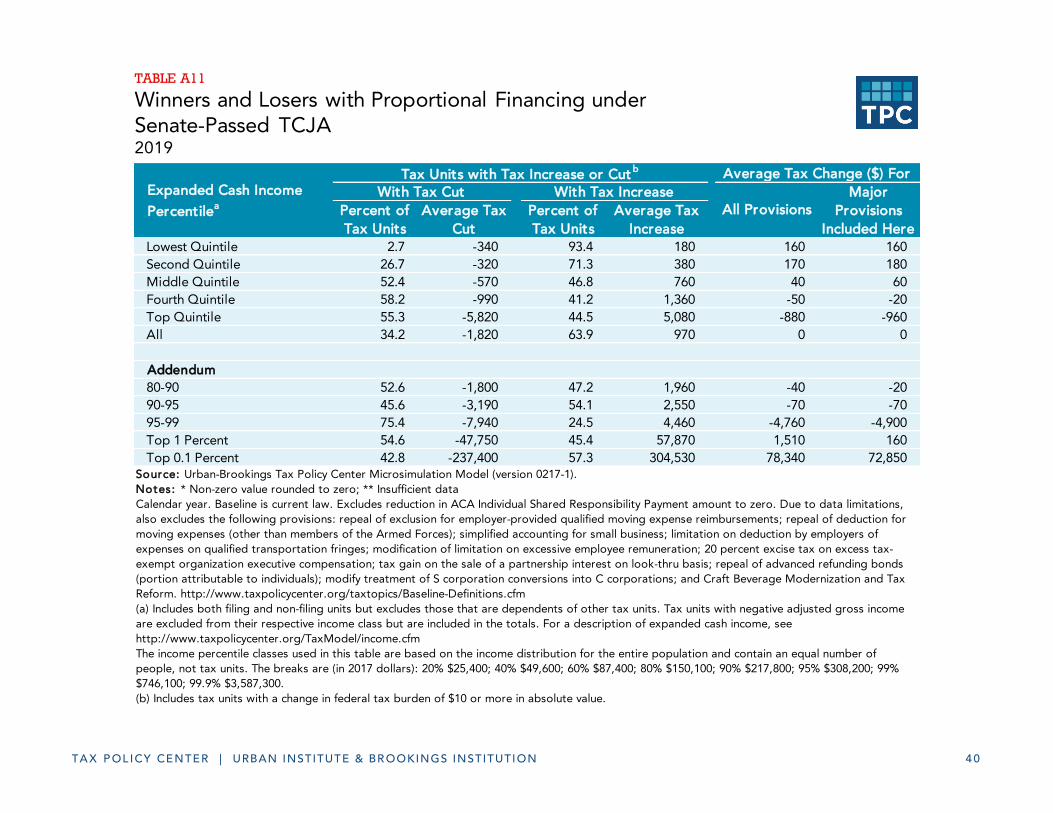
TA X P OL ICY CENTER | URBAN INSTITUTE & BR OOKINGS INSTITUTION 4 0
Percent of
Tax Units
Average Tax
Cut
Percent of
Tax Units
Average Tax
IncreaseLowest Quintile 2.7 -340 93.4 180 160 160
Second Quintile 26.7 -320 71.3 380 170 180
Middle Quintile 52.4 -570 46.8 760 40 60
Fourth Quintile 58.2 -990 41.2 1,360 -50 -20
Top Quintile 55.3 -5,820 44.5 5,080 -880 -960
All 34.2 -1,820 63.9 970 0 0
Addendum
80-90 52.6 -1,800 47.2 1,960 -40 -20
90-95 45.6 -3,190 54.1 2,550 -70 -70
95-99 75.4 -7,940 24.5 4,460 -4,760 -4,900
Top 1 Percent 54.6 -47,750 45.4 57,870 1,510 160
Top 0.1 Percent 42.8 -237,400 57.3 304,530 78,340 72,850Source: Urban-Brookings Tax Policy Center Microsimulation Model (version 0217-1).
Notes: * Non-zero value rounded to zero; ** Insufficient data
Calendar year. Baseline is current law. Excludes reduction in ACA Individual Shared Responsibility Payment amount to zero. Due to data limitations,
also excludes the following provisions: repeal of exclusion for employer-provided qualified moving expense reimbursements; repeal of deduction for
moving expenses (other than members of the Armed Forces); simplified accounting for small business; limitation on deduction by employers of
expenses on qualified transportation fringes; modification of limitation on excessive employee remuneration; 20 percent excise tax on excess tax-
exempt organization executive compensation; tax gain on the sale of a partnership interest on look-thru basis; repeal of advanced refunding bonds
(portion attributable to individuals); modify treatment of S corporation conversions into C corporations; and Craft Beverage Modernization and Tax
Reform. http://www.taxpolicycenter.org/taxtopics/Baseline-Definitions.cfm
(a) Includes both filing and non-filing units but excludes those that are dependents of other tax units. Tax units with negative adjusted gross income
are excluded from their respective income class but are included in the totals. For a description of expanded cash income, see
http://www.taxpolicycenter.org/TaxModel/income.cfm
The income percentile classes used in this table are based on the income distribution for the entire population and contain an equal number of
people, not tax units. The breaks are (in 2017 dollars): 20% $25,400; 40% $49,600; 60% $87,400; 80% $150,100; 90% $217,800; 95% $308,200; 99%
$746,100; 99.9% $3,587,300.
(b) Includes tax units with a change in federal tax burden of $10 or more in absolute value.
Expanded Cash Income
Percentilea
Tax Units with Tax Increase or Cutb Average Tax Change ($) For
With Tax Cut With Tax IncreaseAll Provisions
Major
Provisions
Included Here
TABLE A11
Winners and Losers with Proportional Financing underSenate-Passed TCJA2019
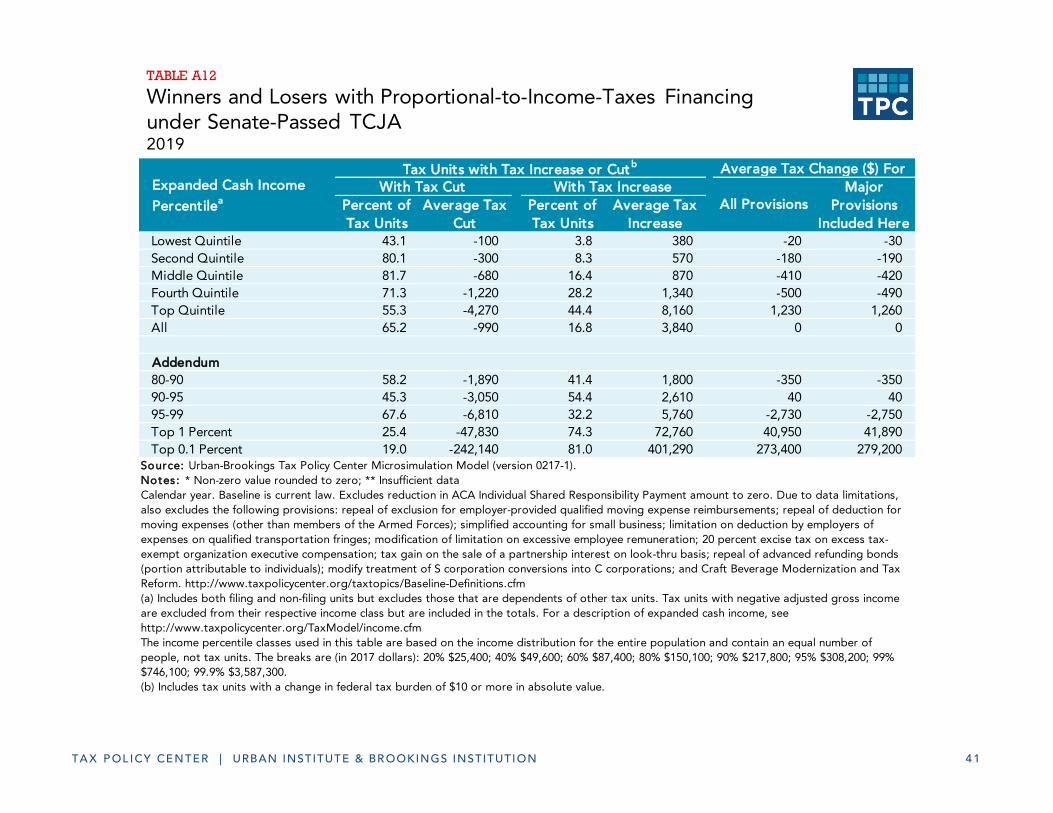
TA X P OL ICY CENTER | URBAN INSTITUTE & BR OOKINGS INSTITUTION 4 1
Percent of
Tax Units
Average Tax
Cut
Percent of
Tax Units
Average Tax
IncreaseLowest Quintile 43.1 -100 3.8 380 -20 -30
Second Quintile 80.1 -300 8.3 570 -180 -190
Middle Quintile 81.7 -680 16.4 870 -410 -420
Fourth Quintile 71.3 -1,220 28.2 1,340 -500 -490
Top Quintile 55.3 -4,270 44.4 8,160 1,230 1,260
All 65.2 -990 16.8 3,840 0 0
Addendum
80-90 58.2 -1,890 41.4 1,800 -350 -350
90-95 45.3 -3,050 54.4 2,610 40 40
95-99 67.6 -6,810 32.2 5,760 -2,730 -2,750
Top 1 Percent 25.4 -47,830 74.3 72,760 40,950 41,890
Top 0.1 Percent 19.0 -242,140 81.0 401,290 273,400 279,200Source: Urban-Brookings Tax Policy Center Microsimulation Model (version 0217-1).
Notes: * Non-zero value rounded to zero; ** Insufficient data
Calendar year. Baseline is current law. Excludes reduction in ACA Individual Shared Responsibility Payment amount to zero. Due to data limitations,
also excludes the following provisions: repeal of exclusion for employer-provided qualified moving expense reimbursements; repeal of deduction for
moving expenses (other than members of the Armed Forces); simplified accounting for small business; limitation on deduction by employers of
expenses on qualified transportation fringes; modification of limitation on excessive employee remuneration; 20 percent excise tax on excess tax-
exempt organization executive compensation; tax gain on the sale of a partnership interest on look-thru basis; repeal of advanced refunding bonds
(portion attributable to individuals); modify treatment of S corporation conversions into C corporations; and Craft Beverage Modernization and Tax
Reform. http://www.taxpolicycenter.org/taxtopics/Baseline-Definitions.cfm
(a) Includes both filing and non-filing units but excludes those that are dependents of other tax units. Tax units with negative adjusted gross income
are excluded from their respective income class but are included in the totals. For a description of expanded cash income, see
http://www.taxpolicycenter.org/TaxModel/income.cfm
The income percentile classes used in this table are based on the income distribution for the entire population and contain an equal number of
people, not tax units. The breaks are (in 2017 dollars): 20% $25,400; 40% $49,600; 60% $87,400; 80% $150,100; 90% $217,800; 95% $308,200; 99%
$746,100; 99.9% $3,587,300.
(b) Includes tax units with a change in federal tax burden of $10 or more in absolute value.
Expanded Cash Income
Percentilea
Tax Units with Tax Increase or Cutb Average Tax Change ($) For
With Tax Cut With Tax IncreaseAll Provisions
Major
Provisions
Included Here
TABLE A12
Winners and Losers with Proportional-to-Income-Taxes Financingunder Senate-Passed TCJA2019
NOTES
TA X P OL ICY CENTER | URBAN INSTITUTE & BR OOKINGS INSTITUTION 4 2
1 Joint Committee on Taxation (2017a, 2017b).
2 In Gale, Khitatrakun, and Krupkin (2017), we pursued the same exercise for the White House’s (2017) April 2017 outline
and found similar results.
3 Similar previous work implied that the 2001 and 2003 tax cuts, taken in isolation, made most households better off.
However, most households would be worse off, after taking into account the net effects of the tax cuts plus plausible
financing options, even after allowing for some induced increases in labor supply and saving (Gale, Orszag, and Shapiro
2004; Elmendorf et al. 2008). The issue of financing tax cuts has also been explored in more recent work, including
Gale, Khitatrakun, and Krupkin (2017); Huang and Duke (2017); and Furman and Leiserson (2017).
4 The Joint Committee on Taxation (2017c) finds that the Senate bill as passed by the Committee on Finance would increase
the level of GDP by about 0.8 percent on average over the ten-year window. Page et al. (2017b) estimate that the
Senate bill as passed by the Committee on Finance would leave GDP roughly the same in 2027 as under current law.
Page et al. (2017a) estimate that the House bill would increase the level of GDP by 0.3 percent at the end of the first
decade. Zandi, Lafakis, and Yaros (2017) find that the legislation would only increase the average annual growth rate
over a decade by 0.03 percentage points. The Penn Wharton Budget Model (2017) finds that GDP would be 0.4-0.9
percent larger in 2027 under the House version of the TCJA compared to current policy. TPC Staff (2017c, Table 7)
analyze an earlier, similar proposal and conclude that the growth effects would initially be small and positive, but
eventually turn negative. Hatzius et al. (2017) find that a similar tax cut would raise the level of GDP (not the growth
rate) by 0.5 percent over the medium term. Gale and Samwick (2017) review research and evidence on the relationship
between income tax cuts and growth and find small effects. In a recent University of Chicago poll of leading
economists, only 1 out of 42 respondents agreed that, “If the US enacts a tax bill similar to those currently moving
through the House and Senate — and assuming no other changes in tax or spending policy — US GDP will be
substantially higher a decade from now than under the status quo” (IGM Forum 2017).
5 According to Senator Marco Rubio, “We have to generate economic growth, which generates revenue, while reducing
spending. That will mean instituting structural changes to Social Security and Medicare for the future.” President Trump
said, next, “we’re going to go into welfare reform” (Zernike and Rappeport 2017). Senator Hatch said, “Now let’s just
be honest about it: We’re in trouble. This country is in deep debt. You don’t help the poor by not solving the problems
of debt, and you don’t help the poor by continually pushing more and more liberal programs thorugh” (Stein 2017).
6 TPC Staff (2017a); Joint Committee on Taxation (2017a).
7 The Appendix Tables show the share of tax units with tax increases or tax cuts under each financing scenario. They only
include the effects of major provisions in the Tax Cuts and Jobs Act, while Tables 1-12 include all provisions. This
slightly changes the necessary financing amount in each year. For more details, see Tax Policy Center (2017a, 2017b).
8 Figure 1 uses data provided in Tables 1, 3, 5, and 7. Similarly, Figure 2 uses data provided in Tables 2, 4, 6, and 8. Both
figures do not show results for the second or fourth quintiles.
9 TPC Staff (2017b); Joint Committee on Taxation (2017b).
10 Congressional Budget Office (2017b).
11 Results for calendar year 2025 are similar to those for calendar year 2019 (TPC Staff 2017b).
12 Figure 3 uses data provided in Tables 9-12. It does not show results for the second or fourth quintiles.
13 Joint Committee on Taxation (2017a).
14 For details on the bubble tax rate, see Gale (2017).
15 The top rate would be set at 25% for “passive” net business income, a weighted 35.22% rate for “active” net business
income, and 39.6% for personal service income.
16 TPC Staff (2017a, Table 1).
TA X P OL ICY CENTER | URBAN INSTITUTE & BR OOKINGS INSTITUTION 4 3
17 TPC Staff (2017a, Table 3). Comparable estimates with financing are in Appendix Tables A3, A5, and A7.
18 TPC Staff (2017a, Table 4). Comparable estimates with financing are in Appendix Tables A4, A6, and A8.
19 See Tax Policy Center (2016).
20 Expanded cash income equals cash income plus tax-exempt employee and employer contributions to employer health
insurance and other fringe benefits, employer contributions to tax-preferred retirement accounts, income earned within
retirement accounts, and food stamps. Using ECI allows analyses to characterize differences in the economic status of
taxpayers in an accurate manner. It is preferred versus adjusted gross income (AGI) because AGI is not comprehensive
and its use may cause many households’ economic situations to be mischaracterized. For more information on ECI, see
Rosenberg (2013).
21 Over a decade, the House GOP’s budget resolution from early October 2017 would have cut programs aimed at low-
income and moderate-income households by $2.9 trillion. The legislation would have cut these programs by more than
a third in 2027 (Shapiro, Kogan, and Cho 2017a). The Senate’s version, which was later adopted by the House, calls for
more than $4 trillion in cuts to mandatory spending programs over the same period (Friedman et al. 2017). Shapiro,
Kogan, and Cho (2017b) find that three-fifths of the spending cuts in Trump’s 2018 Budget Proposal (Office of
Management and Budget 2017) would fall on low-income and middle-income households. The American Health Care
Act, as passed by the House in May 2017, would cut federal Medicaid spending by more than $800 billion over a
decade and would cut taxes for high-income households (Congressional Budget Office 2017a). Rappeport (2017) writes
that Republicans may cut entitlement programs to reduce the deficit effects of their tax cuts. Bartlett (2017) posits that
the tax cuts will be paired in the future with cuts in Medicare and Social Security.
22 Stein (2017); Zernike and Rappeport (2017).
23 In the TPC model, the change in tax burden can differ from the change in tax revenue because of intertemporal factors.
For example, savers can reduce current-period tax liability by making tax-deductible contributions to traditional IRAs or
401(k)s. They will generally face higher tax liabilities in the future when the money is withdrawn and hence taxed. A
reduction in the current-period tax rate, as proposed in the Tax Cuts and Jobs Act, will reduce the tax saving when
401(k) or IRA contributions are made, but also reduce future tax liabilities when the savings are withdrawn. This
reduction in future tax liabilities represents a reduction in tax burdens, but not a reduction in current revenues. These
differences are not large, however.
24 Each of the three financing scenarios has two tables, one for 2018 and another for 2027.
25 Numbers do not add up because each value is rounded to the nearest $10.
26 We obtain similar results using adjusted gross income as the income measure instead of ECI.
27 Joint Committee on Taxation (2017b). Several provisions in the bill, including most of the individual income tax provisions
and the estate tax provision, would sunset after 2025, after which, they would revert to current law.
28 Personal service business income would not receive the deduction. The deduction is limited above $250,000 for single
filers or $500,000 for joint filers based on compensation paid.
29 We do not include this provision in our analysis. Including the provision would make the results more regressive
(Congressional Budget Office 2017b).
30 TPC Staff (2017b, Table 1).
31 TPC Staff (2017b, Table 4). Comparable estimates with financing are in Appendix Tables A10 through A12.
32 We obtain similar results using adjusted gross income as the income measure instead of ECI.
REFERENCES
TA X P OL ICY CENTER | URBAN INSTITUTE & BR OOKINGS INSTITUTION 4 4
Bartlett, Bruce. 2017. “First, Republicans Want Tax Cuts. Next, They’ll Try Gutting Medicare and Social Security.”
Washington Post: November 16.
Congressional Budget Office. 2017a. “H.R. 1628: American Health Care Act of 2017.” Congressional Budget Office Cost
Estimate: May 24.
Congressional Budget Office. 2017b. “Reconciliation Recommendations of the Senate Committee on Finance.”
Congressional Budget Office Cost Estimate: November 26.
Elmendorf, Douglas W., Jason Furman, William G. Gale, and Benjamin H. Harris. 2008. “Distributional Effects of the 2001
and 2003 Tax Cuts: How do Financing and Behavioral Responses Matter?” National Tax Journal 61: 365-80.
Friedman, Joel, Chye-Ching Huang, David Reich, Paul N. Van de Water, and Sharon Parrott. 2017. “Proposed Senate
Budget is Likely to Leave Millions of Americans Worse Off.” Center on Budget and Policy Priorities: Washington, DC.
Furman, Jason, and Greg Leiserson. 2017. “The Real Cost of the Republican Tax Cuts.” Vox: November 1.
Gale, William G. 2017. “A Bubble with a Bite: The House Tax Bill Implies a 49.4 Percent Top Effective Tax Rate.” Tax Vox:
November 14.
Gale, William, Surachai Khitatrakun, and Aaron Krupkin. 2017. “Cutting Taxes and Making Future Americans Pay for It: How
Trump’s Tax Cuts Could Hurt Many Households.” The Tax Policy Center: Washington, DC.
Gale, William G., and Andrew A. Samwick. 2017. “Effects of Income Tax Changes on Economic Growth.” In The Economics
of Tax Policy, edited by Alan J. Auerbach and Kent Smetters. Oxford University Press.
Gale, William G., Peter R. Orszag, and Isaac Shapiro. 2004. “Distributional Effects of the 2001 and 2003 Tax Cuts and Their
Financing.” Tax Notes 103 (12): 1539-48.
Hatzius, Jan, Alec Phillips, David Mericle, Spencer Hill, Daan Struyven, Avisha Thakkar, and Blake Taylor. 2017. “The Effects
of Tax Reform on the Economy and Monetary Policy.” Goldman Sachs: New York, NY.
Huang, Chye-Ching, and Brendan Duke. 2017. “Vast Majority of Americans Would Likely Lose from Senate GOP’s $1.5
Trillion in Tax Cuts, Once They’re Paid For.” Center on Budget and Policy Priorities: Washington, DC.
IGM Forum. 2017. “Tax Reform.” University of Chicago Booth School. November 21:
http://www.igmchicago.org/surveys/tax-reform-2.
Joint Committee on Taxation. 2017a. “Estimated Revenue Effects of H.R. 1, The “Tax Cuts and Jobs Act,” As Ordered
Reported by the Committee on Ways and Means on November 9, 2017.” JCX-54-17.
Joint Committee on Taxation. 2017b. “Estimated Revenue Effects of The “Tax Cuts and Jobs Act,” As Passed by the Senate
on December 2, 2017.” JCX-63-17.
Joint Committee on Taxation. 2017c. “Macroeconomic Analysis of the “Tax Cut and Jobs Act” As Ordered Reported by the
Senate Committee on Finance on November 16, 2017.” JCX-61-17.
Office of Management and Budget. 2017. “Budget of the U.S. Government: A New Foundation for American Greatness,
Fiscal Year 2018.” The White House: Washington, DC.
Page, Benjamin R., Joseph Rosenberg, James R. Nunns, Jeffrey Rohaly, and Daniel Berger. 2017a. “Macroeconomic Analysis
of the Tax Cuts and Jobs Act as Passed by the House of Representatives.” Tax Policy Center: Washington, DC.
Page, Benjamin R., Joseph Rosenberg, James R. Nunns, Jeffrey Rohaly, and Daniel Berger. 2017b. “Macroeconomic Analysis
of the Tax Cuts and Jobs Act as Passed by the Senate Finance Committee.” Tax Policy Center: Washington, DC
Penn Wharton Budget Model. 2017. “The House Tax Cuts and Jobs Act, Amended (11/9/17): The Dynamic Effect on the
Budget and the Economy.” University of Pennsylvania: Philadelphia, PA.
Rappeport, Alan. 2017. “Republicans May Target Entitlement Programs to Reduce Deficit.” New York Times: November 15.
Rosenberg, Joseph. 2013. “Measuring Income for Distributional Analysis.” The Tax Policy Center: Washington, DC.
TA X P OL ICY CENTER | URBAN INSTITUTE & BR OOKINGS INSTITUTION 4 5
Shapiro, Isaac, Richard Kogan, and Chloe Cho. 2017a. “House GOP Budget Cuts Programs Aiding Low- and Moderate-
Income People by $2.9 Trillion Over Decade.” Center on Budget and Policy Priorities: Washington, DC.
Shapiro, Isaac, Richard Kogan, and Chloe Cho. 2017b. “Trump Budget Gets Three-Fifths of its Cuts from Programs for Low-
and Moderate-Income People.” Center on Budget and Policy Priorities: Washington, DC.
Stein, Jeff. 2017. “GOP Eyes Post-Tax-Cut Changes to Welfare, Medicare and Social Security.” The Washington Post:
December 1.
Tax Policy Center. 2016. “Measuring the Distribution of Tax Changes.” Tax Model Resources.
http://www.taxpolicycenter.org/resources/measuring-distribution-tax-changes.
TPC Staff. 2017a. “Distributional Analysis of the Tax Cuts and Jobs Act as Passed by the House Ways and Means
Committee.” Tax Policy Center: Washington, DC.
TPC Staff. 2017b. “Distributional Analysis of the Tax Cuts and Jobs Act as Passed by the Senate.” Tax Policy Center:
Washington, DC.
TPC Staff. 2017c. “A Preliminary Analysis of the Unified Framework.” Tax Policy Center: Washington, DC.
The White House. 2017. “2017 Tax Reform for Economic Growth and American Jobs.”
http://taxprof.typepad.com/files/trump-tax-plan.pdf.
Zandi, Mark, Chris Lafakis, and Bernard Yaros. 2017. “Tax Reform Wild Card.” Moody’s Analytics: New York, NY.
Zernike, Kate, and Alan Rappeport. 2017. “Heading Toward Tax Victory, Republicans Eye Next Step: Cutting Spending.”
The New York Times: Decemeber 2.
ABOUT THE AUTHORS
TA X P OL ICY CENTER | URBAN INSTITUTE & BR OOKINGS INSTITUTION 4 6
William G. Gale: Miller Chair, Brookings Institution and Codirector, Urban-Brookings Tax Policy Center Surachai Khitatrakun: Senior Research Methodologist, Urban Institute and Tax Policy Center Aaron Krupkin: Senior Research Analyst, Brookings Institution and Tax Policy Center

The Tax Policy Center is a joint venture of the
Urban Institute and Brookings Institution.
For more information, visit taxpolicycenter.org
or email [email protected]