winning in us commercial staffing - randstad/media/files/r/randstad-ir/documents...winning in us...
TRANSCRIPT
winning in US commercial staffing
Capital Markets Day London Randstad Holding nv November 20, 2014
Traci Fiatte, President Randstad General Staffing USA
ober 30, 2014 third quarter results 2014 - roadshow version 2
agenda
introduction and definitions US market and Randstad General Staffing US how did we get here? history and methods
going forward
WINNING
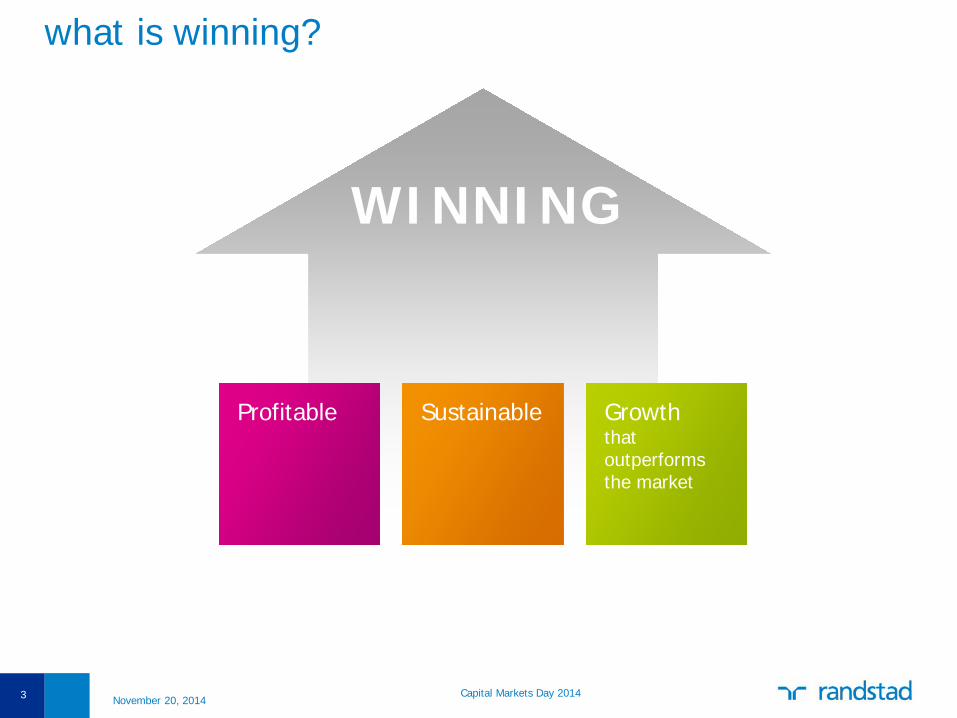
what is winning?
3
Profitable Sustainable Growth that outperforms the market
Capital Markets Day 2014 November 20, 2014
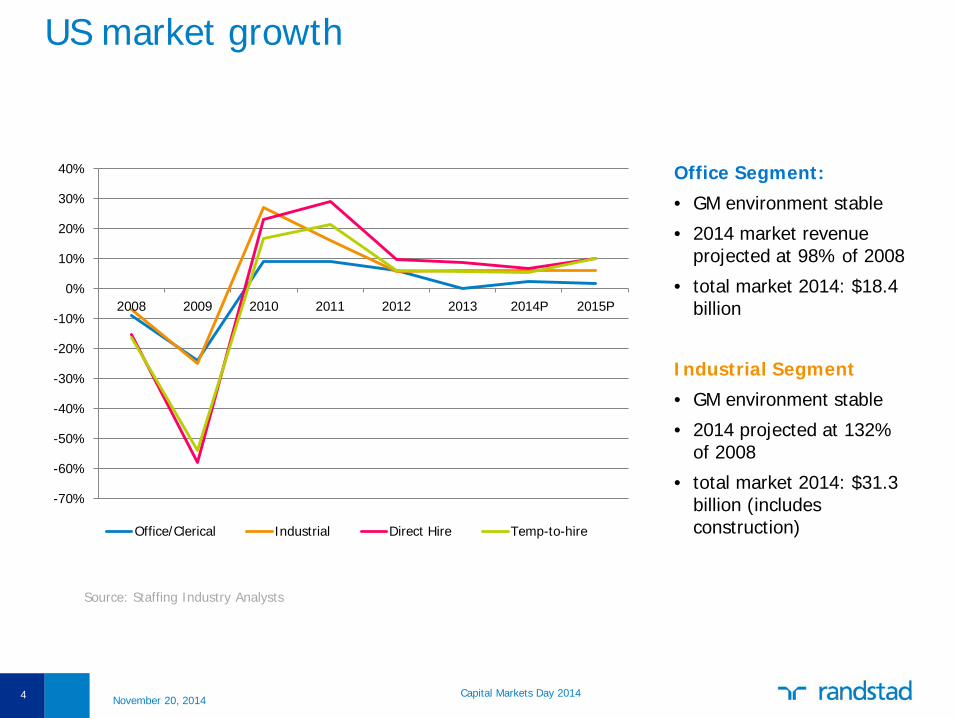
US market growth
4
Office Segment:
• GM environment stable
• 2014 market revenue projected at 98% of 2008
• total market 2014: $18.4 billion
Industrial Segment
• GM environment stable
• 2014 projected at 132% of 2008
• total market 2014: $31.3 billion (includes construction)
Source: Staffing Industry Analysts
-70%
-60%
-50%
-40%
-30%
-20%
-10%
0%
10%
20%
30%
40%
2008 2009 2010 2011 2012 2013 2014P 2015P
Office/Clerical Industrial Direct Hire Temp-to-hire
Capital Markets Day 2014 November 20, 2014
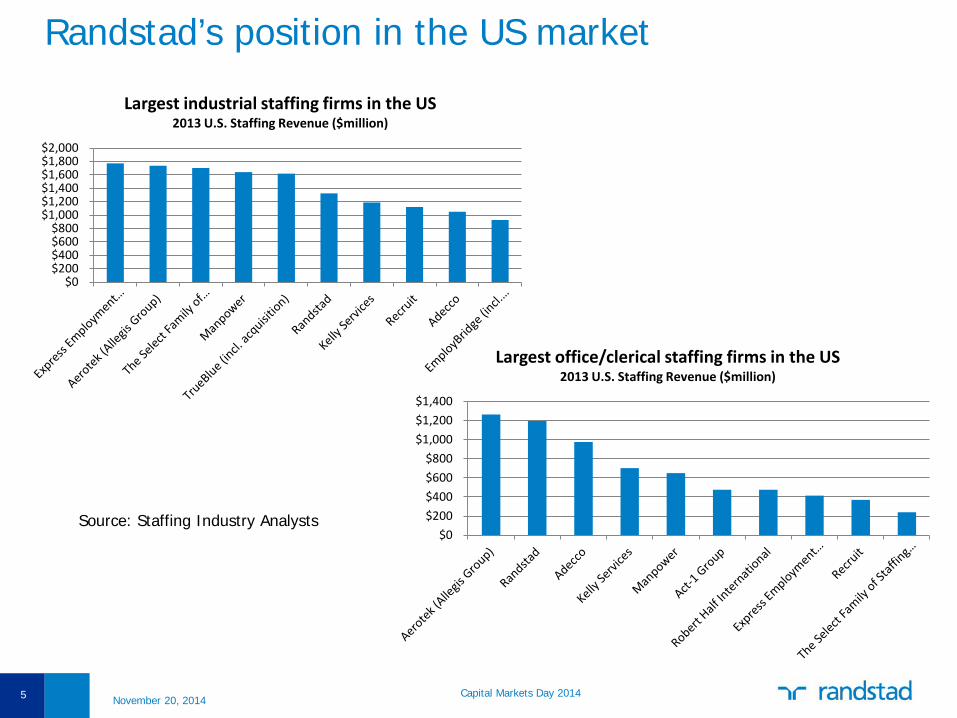
Randstad’s position in the US market
5
$0$200$400$600$800
$1,000$1,200$1,400$1,600$1,800$2,000
Largest industrial staffing firms in the US 2013 U.S. Staffing Revenue ($million)
$0$200$400$600$800
$1,000$1,200$1,400
Largest office/clerical staffing firms in the US 2013 U.S. Staffing Revenue ($million)
Source: Staffing Industry Analysts
Capital Markets Day 2014 November 20, 2014
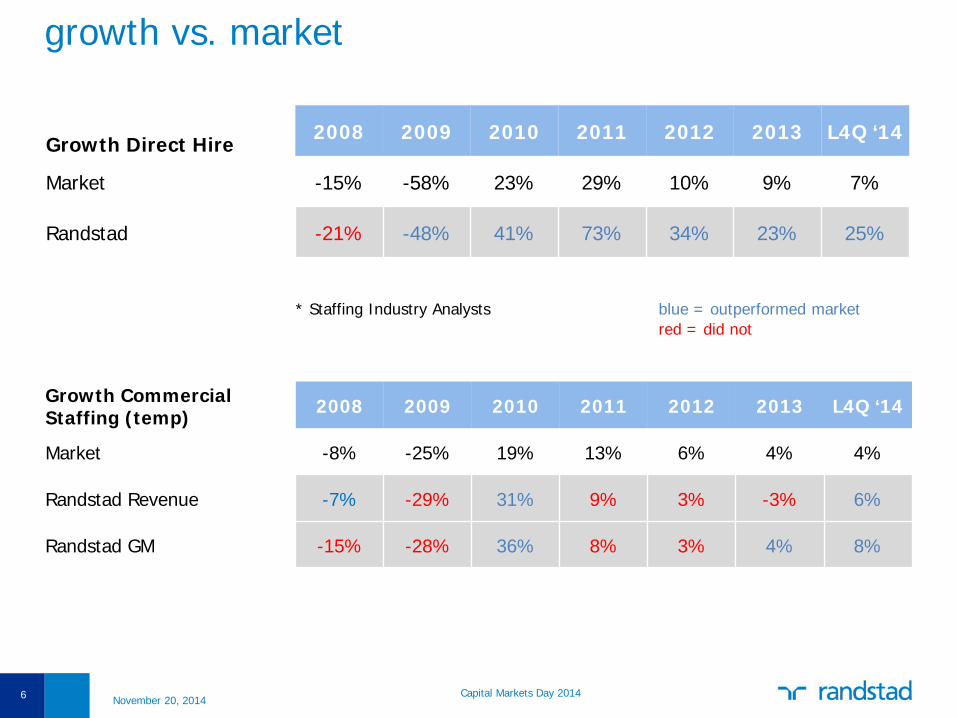
growth vs. market
6
Growth Direct Hire 2008 2009 2010 2011 2012 2013 L4Q ‘14
Market -15% -58% 23% 29% 10% 9% 7%
Randstad -21% -48% 41% 73% 34% 23% 25%
Growth Commercial Staffing (temp) 2008 2009 2010 2011 2012 2013 L4Q ‘14
Market -8% -25% 19% 13% 6% 4% 4%
Randstad Revenue -7% -29% 31% 9% 3% -3% 6%
Randstad GM -15% -28% 36% 8% 3% 4% 8%
blue = outperformed market red = did not
* Staffing Industry Analysts
Capital Markets Day 2014 November 20, 2014
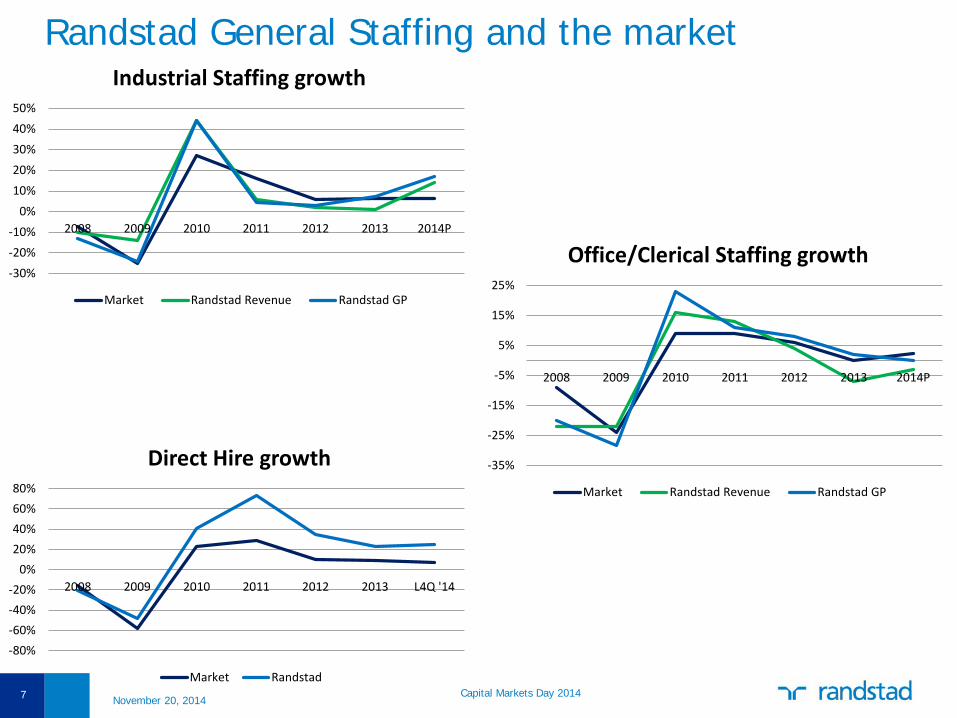
Randstad General Staffing and the market
7 Capital Markets Day 2014 November 20, 2014
-80%-60%-40%-20%
0%20%40%60%80%
2008 2009 2010 2011 2012 2013 L4Q '14
Direct Hire growth
Market Randstad
-30%-20%-10%
0%10%20%30%40%50%
2008 2009 2010 2011 2012 2013 2014P
Industrial Staffing growth
Market Randstad Revenue Randstad GP
-35%
-25%
-15%
-5%
5%
15%
25%
2008 2009 2010 2011 2012 2013 2014P
Office/Clerical Staffing growth
Market Randstad Revenue Randstad GP
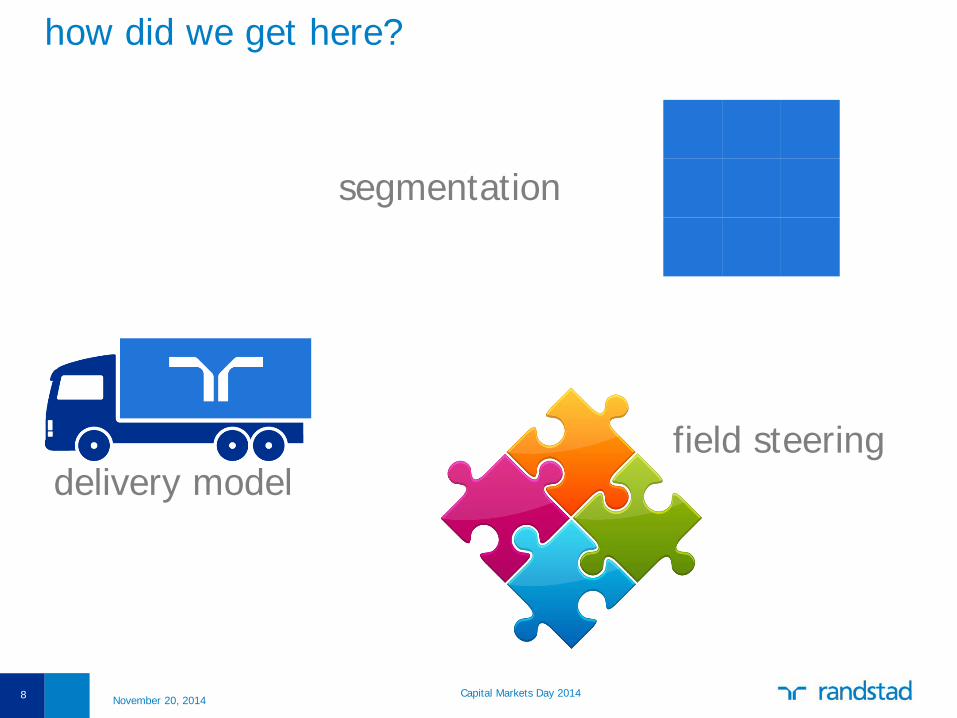
how did we get here?
8
segmentation
delivery model field steering
Capital Markets Day 2014 November 20, 2014
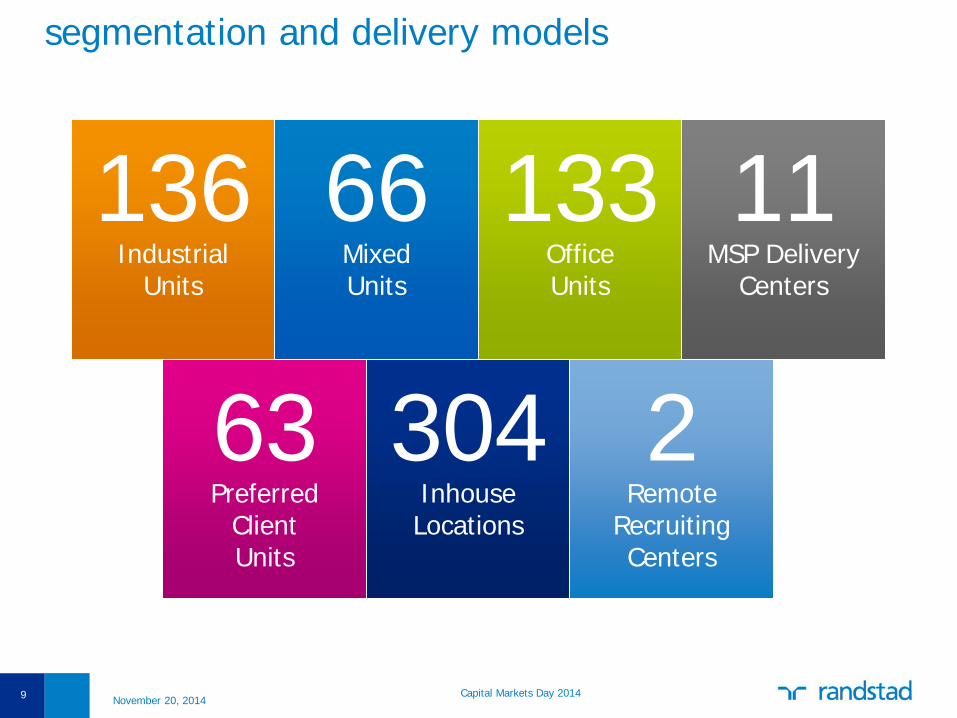
segmentation and delivery models
9
136 Industrial
Units
66 Mixed Units
133 Office Units
11 MSP Delivery
Centers
63 Preferred
Client Units
304 Inhouse Locations
2 Remote
Recruiting Centers
Capital Markets Day 2014 November 20, 2014
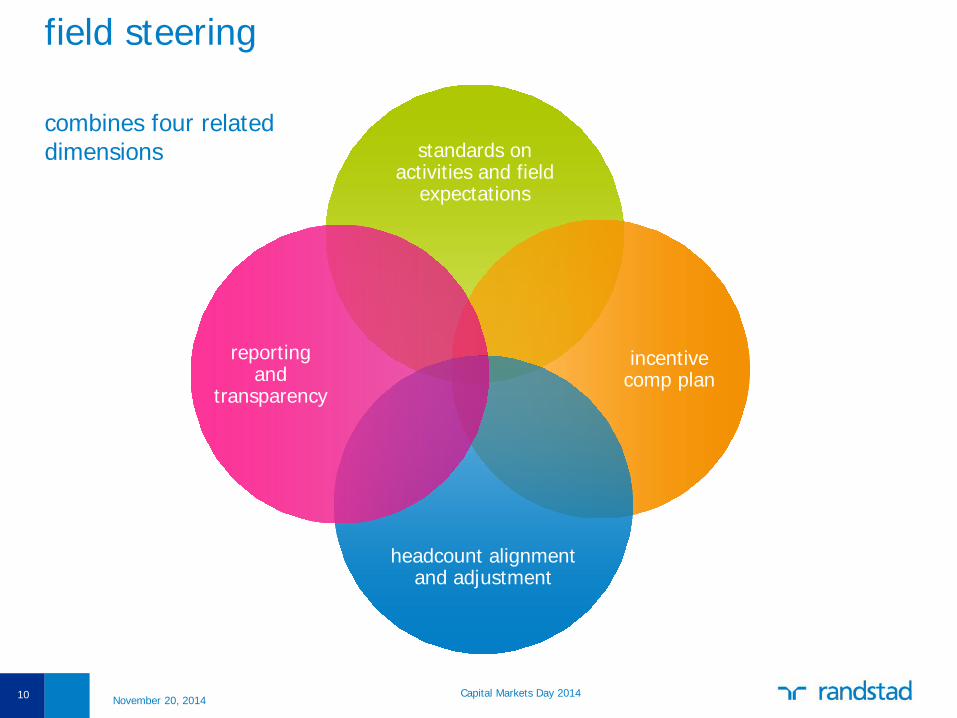
field steering
10
standards on activities and field
expectations
incentive comp plan
headcount alignment and adjustment
reporting and
transparency
combines four related dimensions
Capital Markets Day 2014 November 20, 2014
11
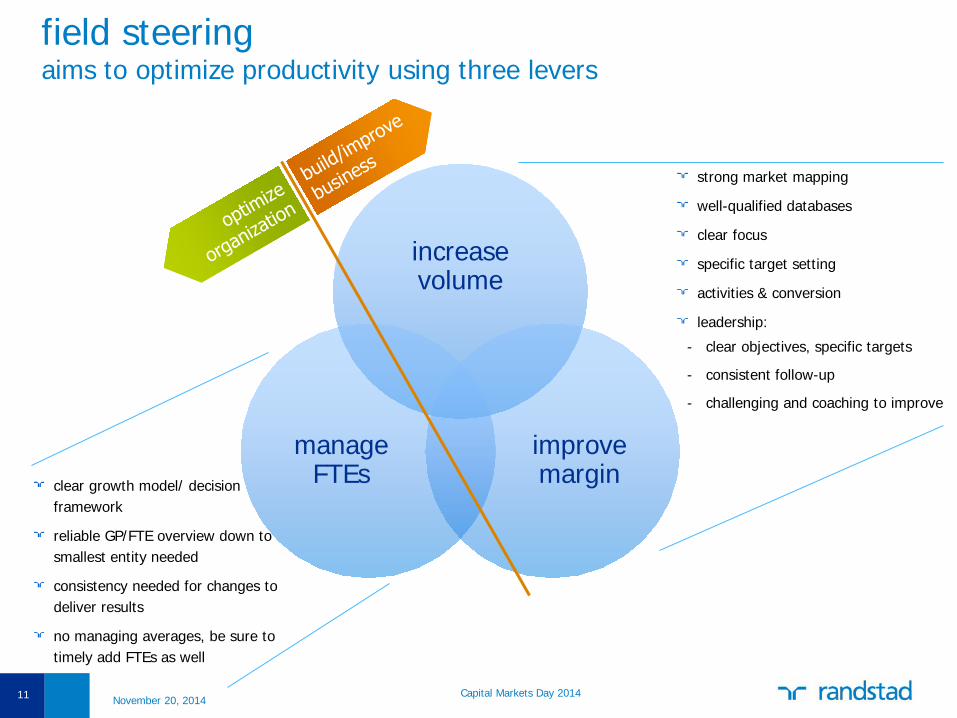
strong market mapping
well-qualified databases
clear focus
specific target setting
activities & conversion
leadership:
- clear objectives, specific targets
- consistent follow-up
- challenging and coaching to improve
increase volume
improve margin
manage FTEs clear growth model/ decision
framework
reliable GP/FTE overview down to smallest entity needed
consistency needed for changes to deliver results
no managing averages, be sure to timely add FTEs as well
field steering aims to optimize productivity using three levers
Capital Markets Day 2014 November 20, 2014
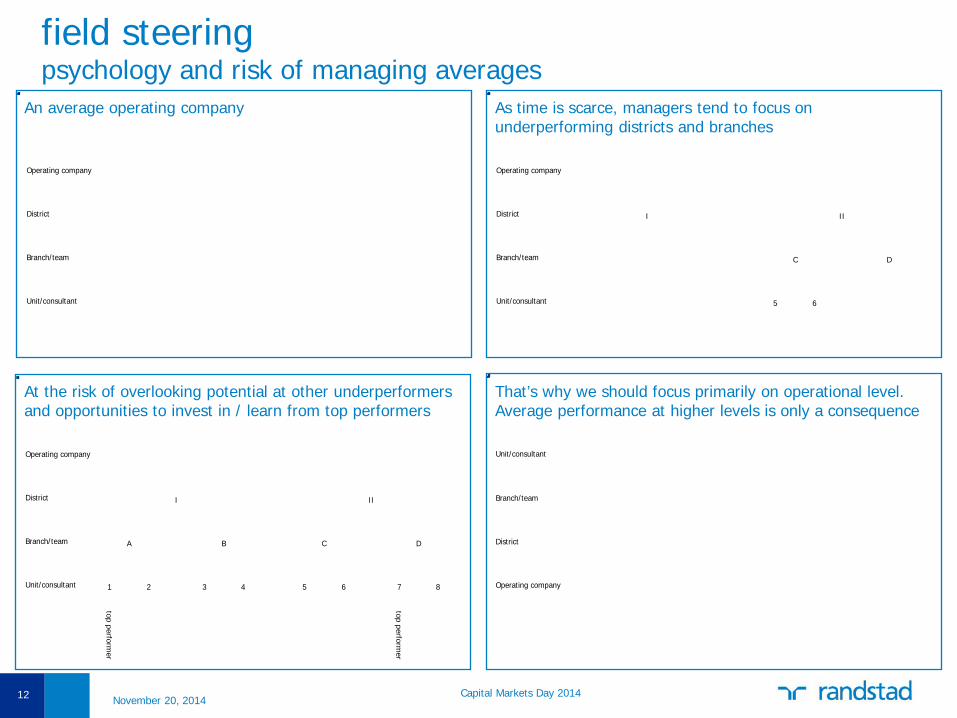
field steering psychology and risk of managing averages
12
An average operating company
District
Branch/team
Unit/consultant
Operating company
Where would any manager tend to focus?
I IIDistrict
Branch/team
Unit/consultant
Operating company
C D
5 6
What improvement potential would they have overlooked?
1 2 3 4
A B
I
5 6 7 8
C D
II
top performer
top performer
District
Branch/team
Unit/consultant
Operating company
That’s why we like to draw our company upside down
District
Branch/team
Operating company
Unit/consultant
As time is scarce, managers tend to focus on underperforming districts and branches
An average operating company
At the risk of overlooking potential at other underperformers and opportunities to invest in / learn from top performers
That’s why we should focus primarily on operational level. Average performance at higher levels is only a consequence
Capital Markets Day 2014 November 20, 2014
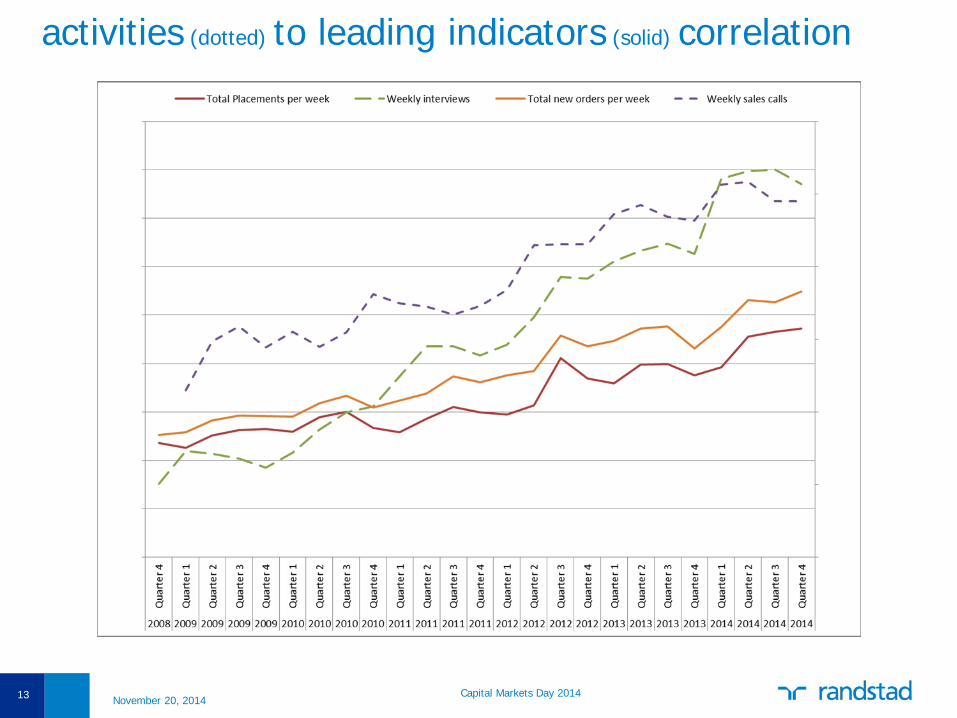
activities (dotted) to leading indicators (solid) correlation
13 Capital Markets Day 2014 November 20, 2014
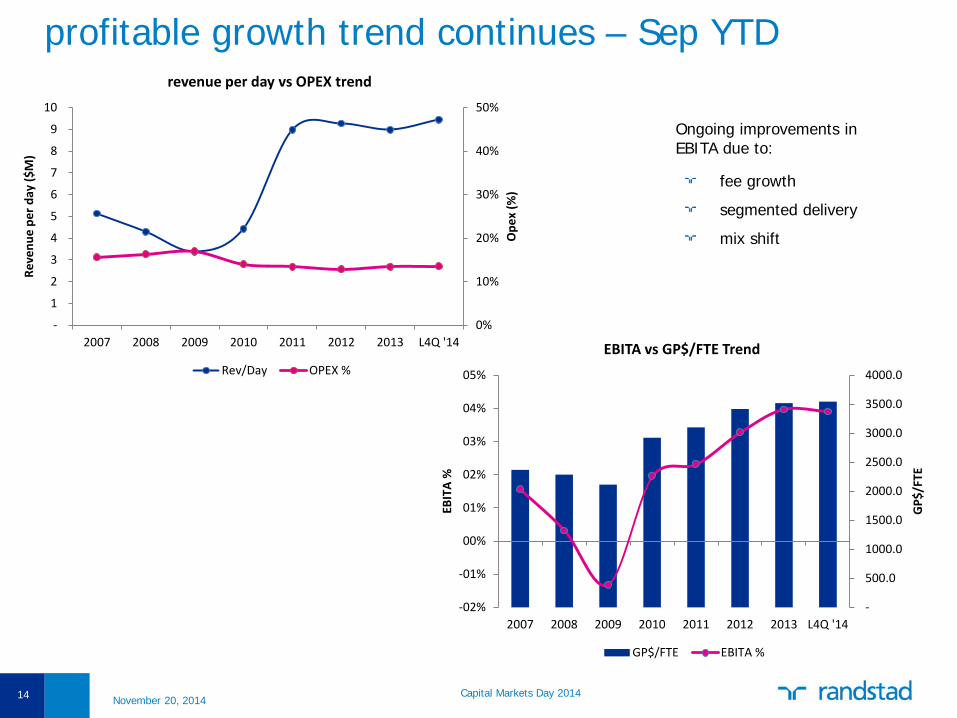
profitable growth trend continues – Sep YTD
14
Ongoing improvements in EBITA due to:
fee growth
segmented delivery
mix shift
Capital Markets Day 2014 November 20, 2014
0%
10%
20%
30%
40%
50%
-
1
2
3
4
5
6
7
8
9
10
2007 2008 2009 2010 2011 2012 2013 L4Q '14
Ope
x (%
)
Reve
nue
per d
ay ($
M)
revenue per day vs OPEX trend
Rev/Day OPEX %
-
500.0
1000.0
1500.0
2000.0
2500.0
3000.0
3500.0
4000.0
-02%
-01%
00%
01%
02%
03%
04%
05%
2007 2008 2009 2010 2011 2012 2013 L4Q '14
GP$
/FTE
EBIT
A %
EBITA vs GP$/FTE Trend
GP$/FTE EBITA %
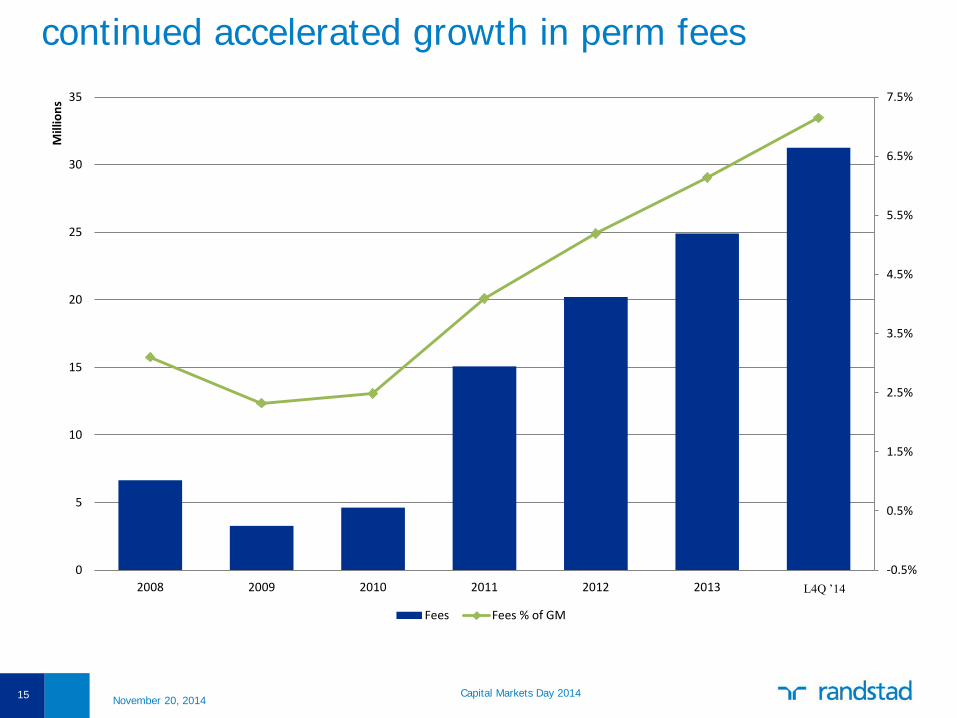
continued accelerated growth in perm fees
15
-0.5%
0.5%
1.5%
2.5%
3.5%
4.5%
5.5%
6.5%
7.5%
0
5
10
15
20
25
30
35
2008 2009 2010 2011 2012 2013 2014 annualized
Mill
ions
Fees Fees % of GM
L4Q ’14
Capital Markets Day 2014 November 20, 2014
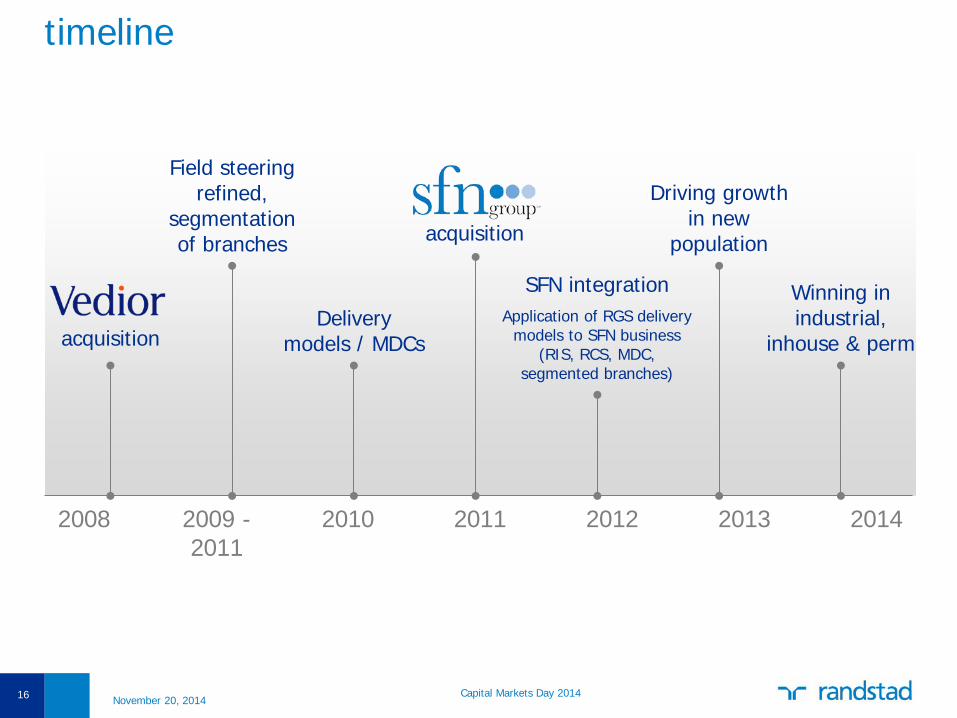
timeline
16
2008 2009 - 2011
2010 2011 2012 2013 2014
Field steering refined,
segmentation of branches
Delivery models / MDCs acquisition
SFN integration Application of RGS delivery
models to SFN business (RIS, RCS, MDC,
segmented branches)
Winning in industrial,
inhouse & perm
acquisition
Driving growth in new
population
Capital Markets Day 2014 November 20, 2014

going forward
17 Capital Markets Day 2014 November 20, 2014
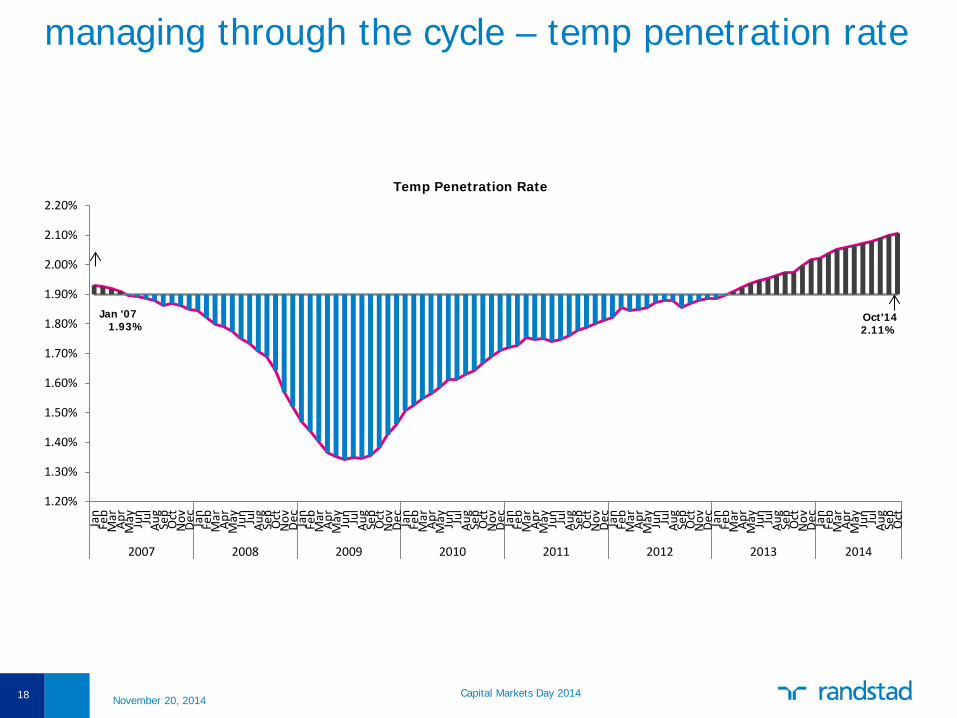
managing through the cycle – temp penetration rate
18
1.20%
1.30%
1.40%
1.50%
1.60%
1.70%
1.80%
1.90%
2.00%
2.10%
2.20%
Jan
Feb
Mar Ap
rM
ay Jun Jul
Aug
Sep
Oct
Nov De
cJa
nFe
bM
ar Apr
May Jun Jul
Aug
Sep
Oct
Nov De
cJa
nFe
bM
ar Apr
May Jun Jul
Aug
Sep
Oct
Nov De
cJa
nFe
bM
ar Apr
May Jun Jul
Aug
Sep
Oct
Nov De
cJa
nFe
bM
ar Apr
May Jun Jul
Aug
Sep
Oct
Nov De
cJa
nFe
bM
ar Apr
May Jun Jul
Aug
Sep
Oct
Nov De
cJa
nFe
bM
ar Apr
May Jun Jul
Aug
Sep
Oct
Nov De
cJa
nFe
bM
ar Apr
May Jun Jul
Aug
Sep
Oct
2007 2008 2009 2010 2011 2012 2013 2014
Temp Penetration Rate
Jan '07 1.93%
Oct'14 2.11%
Capital Markets Day 2014 November 20, 2014
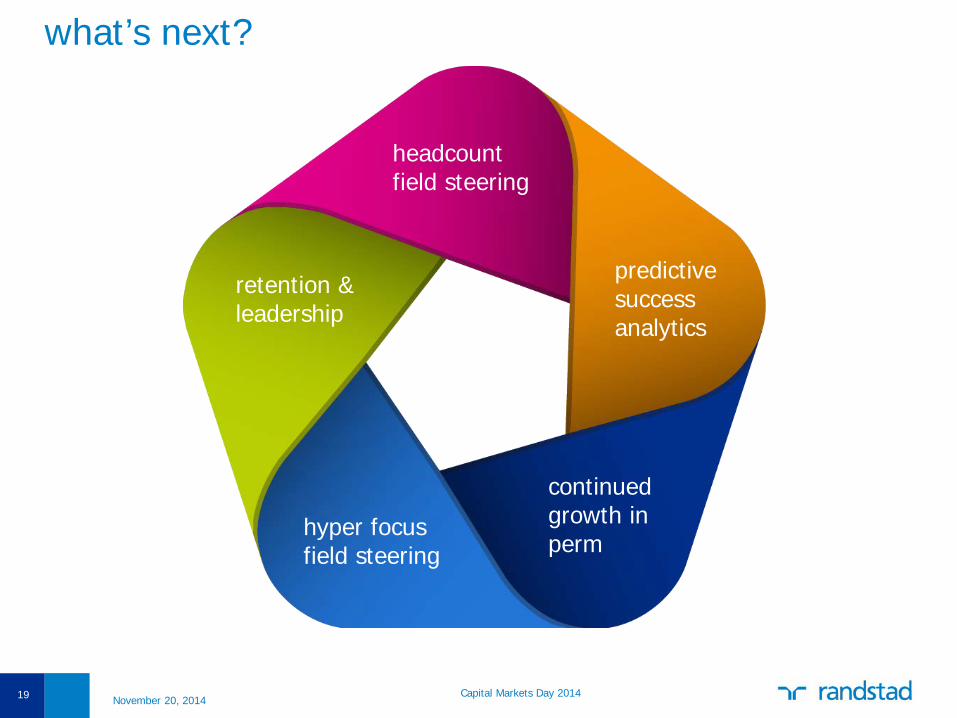
what’s next?
19
headcount field steering
retention & leadership
hyper focus field steering
continued growth in perm
predictive success analytics
Capital Markets Day 2014 November 20, 2014

20 Capital Markets Day 2014 November 20, 2014