winslow transit plan | 2017 executive summary€¦ · · 2018-04-28winslow transit plan | 2017...
TRANSCRIPT

WINSLOW TRANSIT PLAN | 2017
Prepared for the City of Winslow by the Northern Arizona Intergovernmental Public Transportation Authority
In partnership with the Arizona Department of Transportationand Federal Transit Administration
BUS STOP
APPENDICES
EXECUTIVE SUMMARY


WI N SL O W T R A N S I T P L AN | 20 1 7
WINSLOW TRANSIT PLAN | 2017
EXECUTIVE SUMMARY
PREPARED ON BEHALF OF THE C ITY OF WINSLOW BY THE
NORTHERN ARIZONA INTERGOVERNMENTAL PUBLIC TRANSPORTATION AUTHORITY
IN PARTNERSHIP WITH THE ARIZONA DEPARTMENT OF TRANSPORTATION
AND FEDERAL TRANSIT ADMINISTRATION

WI N SL O W T R A N S I T P L AN | 20 1 7
This report was funded in part through grants from the Federal Transit Administration, U.S. Department of Transportation. The contents of this report reflect the views of the authors, who are responsible for the facts and the accuracy of the data, and for the use or adaptation of previously published material, presented herein. The contents do not necessarily reflect the official views or policies of the Arizona Department of Transportation or the Federal Transit Administration, U.S. Department of Transportation. This report does not constitute a standard, specification, or regulation. Trade or manufacturers’ names that may appear herein are cited only because they are considered essential to the objectives of the report. The U.S. government and the State of Arizona do not endorse products or manufacturers.

WI N SL O W T R A N S I T P L AN | 20 1 7
EXECUT IVE SUMMARY PAGE 1
EXECUTIVE SUMMARY
BACKGROUND
The Winslow Transit Plan (Plan) officially kicked off on January 19, 2017 with the mission, “To present a Winslow Transit Plan to the Winslow City Council that is financially viable, operationally specific, supported broadly by the community and effectively meets Winslow’s mobility goals.” This Plan has two overarching goals:
Identify a variety of transit service alternatives both within the city of Winslow and to adjacent communities along I-40, and
Recommend a detailed, financially feasible operating plan to meet those alternatives.
PLANNING PROCESS
The Core Planning Team including the Winslow City Manager, Community Development Director and Finance Director as well as the NAIPTA CEO and General Manager, members of the planning team and the Administrative Director. Additionally, a key stakeholders group was formed and included the following people:
Mark Woodson, Woodson Engineering and City of Winslow Engineer
Donavon Gomez, Hopi Senom Transit
Shawn Silas, Hopi Senom Transit
Lisa Robertson, City of Show Low
Elias Jouen, City of Winslow
Dwight Keeto, Navajo Transit
Grant Evans, Woodson Engineering
Sara Allred, ADOT Planning Manager
RJ Erickson, Northern Arizona Council of Governments Mobility Planner Public outreach was conducted through two surveys yielding more than 900 responses, social media, radio announcements, open houses, emails and a dedicated website. Background research on previous planning efforts and current demographics affecting transit was also conducted. The need for transit service in Winslow is demonstrated by several key planning demographics including that 30 percent of households are in poverty, 45 percent of households have one vehicle or less, 14.5 percent of people under 65 have a disability, and 10 percent of the population is age 65 or older.

WI N SL O W T R A N S I T P L AN | 20 1 7
PAGE 2 EXEC UTI VE SUMM ARY
SUMMARY OF ALTERNATIVES
A variety of service alternatives were studied for both commuter and local services. Analysis of each alternative includes a 5-year expenses and revenue estimates, schedules, routes and projected performance compared to peer systems in Arizona. Depending on the goals of the community, there are a variety of ways transit needs can be met. For example, regular commuters can have a high level of service at a low cost with a vanpool program. However, this does not meet the needs of occasional riders which a commuter bus service provides. For local services, defining target populations, whether specific to seniors and people with disabilities or the general public, guides which service alternative best meets those goals and determines how to best serve those populations. Below is an overview of each a service alternative studied. These service alternatives can operate as a stand-alone program or be combined to create a unique, Winslow-specific transit program.
COMMUTER OPTIONS
Commuter service along I-40 could meet the needs of those working along the I-40 corridor from Flagstaff to Holbrook. Additionally, many people need access to medical and commercial services in Flagstaff as well as County and government services in Holbrook. Figure ES.1 Commuter service options
Service Stops Frequency Total Annual
Costs1
Vehicle Recommendation
Winslow- Flagstaff
Twin Arrows 2 roundtrips per day: one morning, one evening
$66,000 at $59/hour
2 small buses less than 30 feet ($150,000 each)
Winslow-Holbrook
Joseph City
3 roundtrips per day: one morning, one midday, one evening
$75,000 at $59/hour
2 small buses less than 30 feet ($150,000 each)
Vanpool N/A Dependent upon group
$34,000 at $400 monthly subsidy per van2
2- 6 sedans and SUVs with capacity for 7-15 passengers ($50,000 each)
LOCAL SERVICE OPTIONS
There are a larger variety of options for providing local services in the City of Winslow depending on the community’s goals. These include traditional fixed route service, as well as demand response and other services which target only a specific population such as people with disabilities.
1 Annual costs are total operating and administration. See Chapter 4 (pages 54-58) for more detail.
2 Unlike other Federally funded transportation programs, vanpools may count rider fares as their local match for the program,
meaning that while the City could add a subsidy to increase affordability, no local dollars are required.

WI N SL O W T R A N S I T P L AN | 20 1 7
EXECUT IVE SUMMARY PAGE 3
Winslow Frequency Fixed-Route Local Service Alternative: This route focuses on serving a passenger base interested in accessing important origins and destinations in the core of the business community along Business Route 66, as well as the central I-40 interchange where the primary variety of commercial and retail businesses are located. This route is proposed to run in two-hour time blocks, three times per day. The route makes three laps every two hours for a total of nine loops per day.
Winslow Coverage Fixed-Route Local Service Alternative: This route includes main locations identified in the frequency routes, plus housing locations on the west, and on the south side of the BNSF right-of-way. This route is proposed to run in two-hour time blocks, three times per day. The route can make one loop per hour for a total of six trips per day.
The Hopi Senom Transit partnership: Hopi Senom Transit currently runs a commuter route with several stops in Winslow twice a day. The route begins and ends on north Highway 87. Partnership with Hopi Senom Transit could provide additional mobility opportunities. (Chapter 4, Page 62)
Complementary Paratransit: The FTA requires complementary paratransit services within ¾ of a mile of any fixed-route bus system, providing origin-to-destination services to those riders who are functionally unable to ride the fixed-route bus or for whom the bus stop is not accessible. This service would require six hours of paratransit time to complement fixed route service schedules above. Deviated Fixed-Route: Though like fixed-route, a deviated fixed-route service may divert from its regular route to pick up or drop off passengers within ¾ mile surrounding the fixed route and within its schedule, usually through a dispatching scenario. This type of system meets the ADA complementary paratransit service requirement through deviation, and can allow the bus system to operate with only one vehicle rather than multiple vehicles with considerable cost savings over a complementary paratransit system. Deviations however, affect the frequency of service—by way of extended travel time, meaning that there would be fewer loops made for the same amount of money. Demand-Response: A community may elect to offer demand-response services. These services can be pre-scheduled and/or requested on-demand. Services like this can be tailored to local preferences, including the service area, days and hours of operation, and defined by categories of clients. Clients can be the general public in nature or limited to seniors, those with disabilities, or any number of other categories as determined. Because of the nature of the service, ADA requirements are automatically met using this method. This service is proposed to be provided from 6:30 a.m. to 6:30 p.m. on weekdays.

WI N SL O W T R A N S I T P L AN | 20 1 7
PAGE 4 EXEC UTI VE SUMM ARY
Figure ES.2 Costs of local service
Service Total Annual Costs3 Vehicle Recommendation4
Winslow Frequency Alternative $94,000 at $54/hour 2 cutaway buses (body on chassis) ($85,000 each)
Winslow Coverage Alternative $82,000 at $54/ hour 2 cutaway buses (body on chassis) ($85,000 each)
Hopi Senom Transit Alternative No current estimate May require vehicle upgrades
Complementary Paratransit $103,000 at $67/hour 2 ADA-equipped vans ($60,000 each)
Deviated Fixed-route $94,000 at 54/hour (commensurate with fixed-route)
2 cutaway buses (body on chassis) ($85,000 each)
Demand-response $206,000 at $67/ hour 4 ADA-equipped vans ($60,000 each)
While the cost of a transit system is expensive, federal and state grants can significantly reduce local costs. When using federal and state resources it is important to assure Winslow’s financial capabilities and commitment to the program. Along with providing a local match, the City must be able to dedicate financial resources since grants are typically on a reimbursement plan, provide reporting, and meet compliance requirements.
CAPITAL INVESTMENTS
Capital investments are important to running a transit system, from rolling stock, to horizontal improvements at bus stops, to technology. Capital investments can be planned on a regular reoccurring basis but costs can vary greatly year to year. Capital investments depend heavily upon what type of service is being offered. When making capital investments, attention to funding sources used is important because of associated reporting, acquisition and environmental requirements.
RISK
Managing and mitigating risk is critical component of a transit program. Insuring a transit program is complicated and requires consulting by professionals that can provide comparisons, ratings, and coverages based upon the service provided. Also important is creating barriers to liability through organizational structure and insurance programs. Such barriers can help protect the City from damages to assets, bodily injury, and workers’ compensation. Finally, the risks associated with the public perception of the service is critical to the funding and success of a program.
3 See Chapter 4 (pages 60-66) for more detail on annual costs.
4 See Chapter 3 (pages 36-37) for more detail on vehicle recommendations.

WI N SL O W T R A N S I T P L AN | 20 1 7
EXECUT IVE SUMMARY PAGE 5
PERFORMANCE MEASURES AND PEER CITY COMPARISONS
Performance measures and peer city comparisons can go a long way to setting expectations for a service. It is important to keep in mind the specific goals of the City and to also set metrics that measure success in meeting those community priorities. Providing services with performance measures below average may still be important to a community if it is meeting other City-specific goals. The Plan also identifies peer Arizona cities to compare each of the service alternatives to. For each alterative, ridership and five-year costs were estimated to provide the following projections: cost per passenger trip, cost per mile, cost per hour, passengers per mile, and passengers per hour.
FIVE-YEAR PHASED RECOMMENDATION
An effective combination of the studied service alternatives can be achieved to provide both commuter and local transit programs. Factors in making a recommendation include financial capacity, ridership, populations served, and short-term versus long-term transit goals. Capital costs associated with rolling stock and bus facilities in first year of operations are significant. For this reason, year one expenses for new services are higher than in year two and beyond.

WI N SL O W T R A N S I T P L AN | 20 1 7
PAGE 6 EXECU TI VE SUMMARY
Figure ES.3 Five-year phased recommendation5
FY 2019 FY 2020 FY 2021 FY 2022 FY 2023 FY 2024 Total
Revenues
5311 $89,113 $755,096 $647,660 $396,707 $352,004 $433,811 $2,674,391
Local $25,311 $245,723 $238,908 $177,573 $145,797 $167,269 $1,000,581
Total $114,424 $1,000,819 $886,568 $574,280 $497,801 $601,080 $3,674,972
Expenses
Transit manager $40,000 $40,000 $40,000 $40,000 $40,000 $40,000 $240,000
Vanpool $11,424 $22,848 $34,272 $34,272 $34,272 $34,272 $171,360
Commuter transit hub $60,000 $60,000
Ridematching program $3,000 $3,000 $3,000 $3,000 $3,000 $3,000 $18,000
Winslow-Flagstaff commuter bus $424,365 $103,356 $113,689 $106,049 $116,437 $863,897
Local general public demand-response $510,606 $265,949 $270,143 $1,046,698
Winslow-Holbrook commuter bus $439,992 $113,175 $123,705 $116,265 $793,137
Local deviated fixed-route* $190,775 $191,106 $381,881
Five-Year Plan update $100,000 $100,000
Total $114,424 $1,000,819 $886,568 $574,280 $497,801 $601,080 $3,674,972
*Transition from general public demand-response to deviated fixed-route should occur at annual ridership of 20,000 to maximize performance measure cost/ passenger trip.
5 Capital costs associated with rolling stock and bus facilities in the first year of operation are significant. For this reason, year one expenses for new services are higher than in
year two and beyond.

WI N SL O W T R A N S I T P L AN | 20 1 7
EXECUT IVE SUMMARY PAGE 7
NEXT STEPS AND IMPLEMENTATION
Implementation of a public transportation program requires significant pre-planning and commitment to provide the best service solution that meets many goals. To do so, will require coordination with many entities, sound planning, and ample preparation time. Several major decision points remain for the City including:
Determining what service if any they want to pursue,
Committing and identifying revenue for a five year budget to those programs, and
Determining how governance and operation of a system will work. The current funding for planning and implementation ends September 30, 2018. In order to have any federal funds to assist in implementation beginning October 1, 2018, the City MUST start the ADOT Section 5311 process beginning in February 2018. This includes the need to have a local cash match.
WI N SL O W T R A N S I T P L AN | 20 1 7
PAGE 8 EXECU TI VE SUMMARY
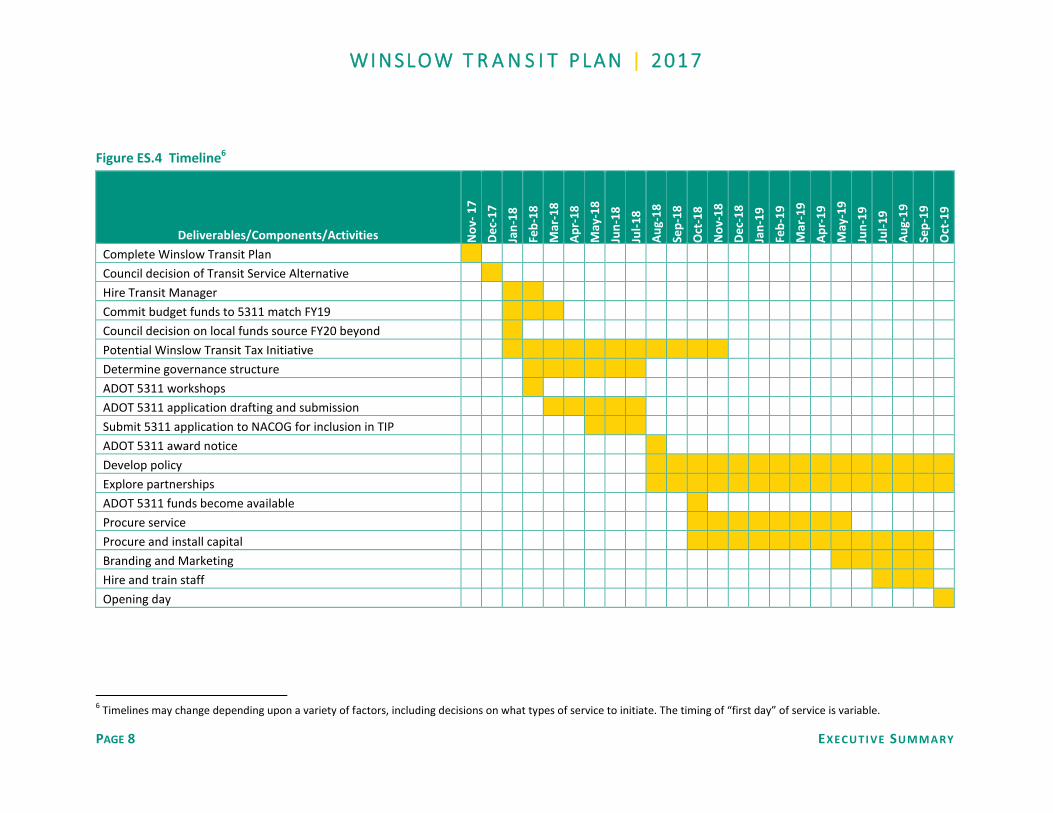
Figure ES.4 Timeline6
Deliverables/Components/Activities No
v- 1
7
De
c-1
7
Jan
-18
Feb
-18
Mar
-18
Ap
r-1
8
May
-18
Jun
-18
Jul-
18
Au
g-1
8
Sep
-18
Oct
-18
No
v-1
8
De
c-1
8
Jan
-19
Feb
-19
Mar
-19
Ap
r-1
9
May
-19
Jun
-19
Jul-
19
Au
g-1
9
Sep
-19
Oct
-19
Complete Winslow Transit Plan
Council decision of Transit Service Alternative
Hire Transit Manager
Commit budget funds to 5311 match FY19
Council decision on local funds source FY20 beyond
Potential Winslow Transit Tax Initiative
Determine governance structure
ADOT 5311 workshops
ADOT 5311 application drafting and submission
Submit 5311 application to NACOG for inclusion in TIP
ADOT 5311 award notice
Develop policy
Explore partnerships
ADOT 5311 funds become available
Procure service
Procure and install capital
Branding and Marketing
Hire and train staff
Opening day
6 Timelines may change depending upon a variety of factors, including decisions on what types of service to initiate. The timing of “first day” of service is variable.