winter 2014-15 us propane supply outlook · winter 2014-15 us propane supply outlook eia/naseo...
TRANSCRIPT

© 2014 IHS
Presentation
ihs.com
IHS
Winter 2014-15 US Propane Supply Outlook EIA/NASEO Winter Energy Outlook Conference
7 October 2014
Bill Veno, Senior Director, Natural Gas Liquids Research, +1 617 866 5118,
NGL RESEARCH

© 2014 IHS 2
Factors Underlying the 2013-14 Propane Shortage

© 2014 IHS
US propane price supply shortage was the result of
a convergence of unfavorable market fundamentals
The price spike in February of this year was the result of a convergence
of several factors:
• High propane demand for crop drying
• An unusually prolonged period of cold weather, leading to high heating
demand
• Rising exports of US propane to international markets
The confluence of these factors led to a rapid fall in primary propane
inventories and supply tightness that resulted in a surge in prices in the
Mid-Continent region.
• PADD II primary inventories dropped sharply starting in October 2013
and remained low through February 2014.
• The price spike was short-lived, as markets adjusted and prices
returned to normal levels relatively quickly.
• Production growth outpaced demand and exports, enabling stocks to
recover for the start of the 2014 - 2015 winter.
3
© 2014 IHS
US propane supply outlook depends primarily on
market fundamentals
Principal factors affecting propane supply and pricing include:
• Inventory levels at start of the heating season
• Winter weather
• Propane production – especially production from prolific wet shale gas
plays
• Demand – incl. weather-related and structural demand (e.g. chemicals)
• Exports – Availability of export capacity (as influenced by US propane
price competitiveness in foreign markets)
These are the principal factors expected to influence the outlook for
propane supply and prices in the winter of 2014-15, as well as in the
years ahead.
4
© 2014 IHS 5
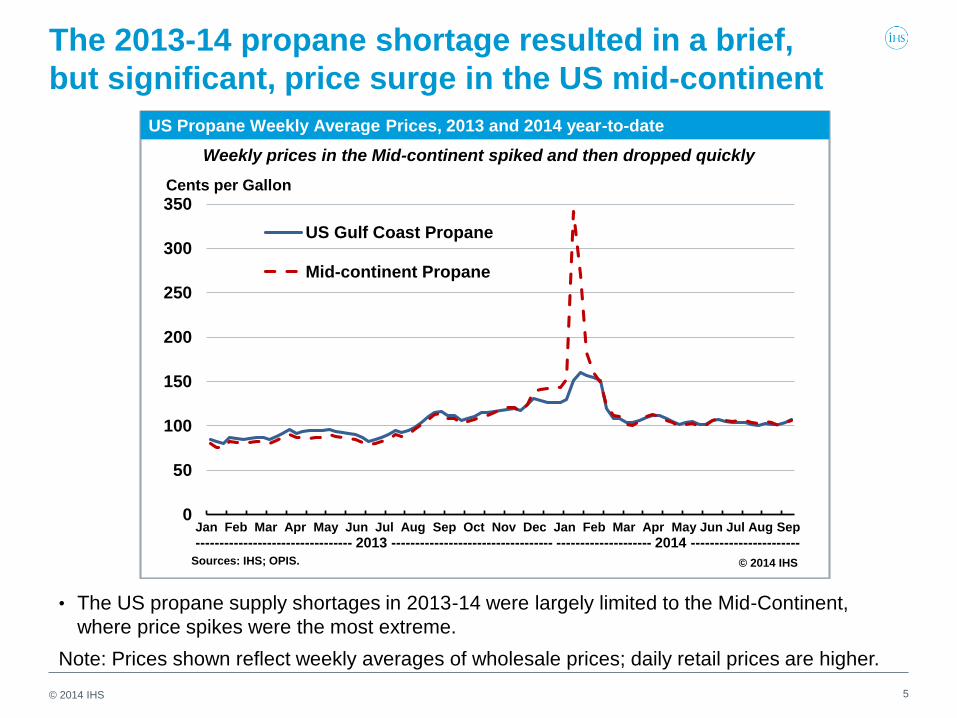
The 2013-14 propane shortage resulted in a brief,
but significant, price surge in the US mid-continent
0
50
100
150
200
250
300
350
JanJanFebMarMarAprMayMayJuneJulyAugAugSepOctOctNovDecDecJanFebMarMarAprMayMayJuneJuneJulyAugSep
US Gulf Coast Propane
Mid-continent Propane
US Propane Weekly Average Prices, 2013 and 2014 year-to-date
© 2014 IHS
Cents per Gallon
Sources: IHS; OPIS.
Jan Feb Mar Apr May Jun Jul Aug Sep Oct Nov Dec Jan Feb Mar Apr May Jun Jul Aug Sep
--------------------------------- 2013 ---------------------------------- -------------------- 2014 -----------------------
Weekly prices in the Mid-continent spiked and then dropped quickly
• The US propane supply shortages in 2013-14 were largely limited to the Mid-Continent,
where price spikes were the most extreme.
Note: Prices shown reflect weekly averages of wholesale prices; daily retail prices are higher.

© 2014 IHS 6
Waterborne exports of propane have been rising rapidly,
but dropped in February and March as prices spiked
0
2
4
6
8
10
12
14
Monthly Annual
US Waterborne Propane Exports – Monthly and Annual Averages, 2007 to 2014 ytd
© 2014 IHS
Thousand Barrels per Month
Sources: IHS Waterborne; US Department of Energy.
Waterborne propane exports soared during 2013 and 2014
• When US propane price differentials relative to other regions collapsed, waterborne exports
dropped.
• Exports subsequently rose sharply when the price incentives improved.

© 2014 IHS 7
The North Central US experienced a significantly
colder winter in 2013-14
• PADD II (North Central) region had 25% higher heating degree-days in the 2013-14 heating season
(Oct- Mar) compared to the same period in 2012-13, and 35% higher than in the winter of 2011-12.
• Winter of 2013-14 reflects a period colder and longer period than normal.
• Additional demand for crop drying (primarily for corn prior to storage) exacerbated the demand
impact experienced in PADD II region.
0
200
400
600
800
1,000
1,200
1,400
1,600
Oct Nov Dec Jan Feb Mar
2013-14
2012-13
2011-12
US PADD II Heating Degree Days
© 2014 IHS
Heating Degree Days
Source: IHS
2013-14 less 2012-13
2013-14 less 2011-12

© 2014 IHS 8
US propane demand in 2013-14 trended higher, with
gains in res/com offsetting a decline in chemicals
• Propane demand in both the residential/commercial and agriculture sectors exhibit weather-
related seasonality.
• Upward trend apparent in weather-related demand.
0
200
400
600
800
1,000
1,200
1,400
1,600
1,800
Oct-11 Jan-12 Apr-12 Jul-12 Oct-12 Jan-13 Apr-13 Jul-13 Oct-13 Jan-14
Chemicals Residential/Commercial
Farm, Industry, Engine Fuel
US Propane Demand by End-Use Sector
© 2014 IHS
Thousand Barrels per Day
Source: IHS
Trend

© 2014 IHS 9
The residential/commercial sector exhibits the
greatest weather-related seasonality of any sector
• Weather-related and seasonal gains in residential/commercial and agriculture demand were
key contributing factors in the propane supply shortage in 2013-14.
• The rise in propane prices prompted a decrease in chemical feedstock demand, partially
offsetting the increase in res/com and agriculture demand.
0
100
200
300
400
500
600
700
800
900
1,000
Oct-11 Jan-12 Apr-12 Jul-12 Oct-12 Jan-13 Apr-13 Jul-13 Oct-13 Jan-14
Residential/Commercial Farm, Industry, Engine Fuel
Chemicals
US Propane Demand by End Use Sector
© 2014 IHS
Thousand Barrels per Day
Source: IHS
© 2014 IHS 10
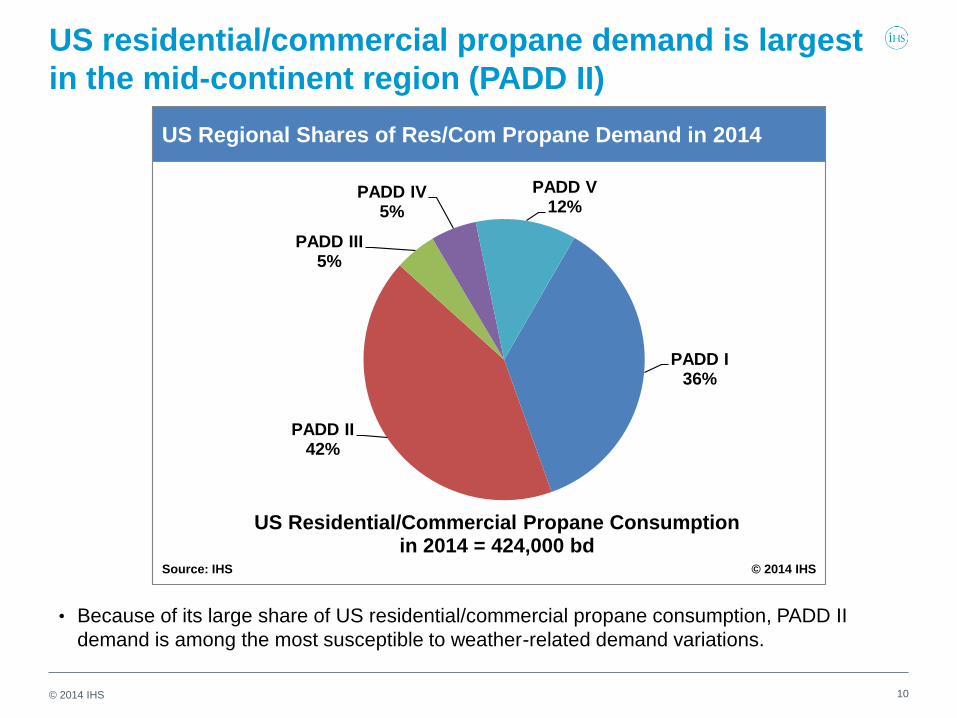
US residential/commercial propane demand is largest
in the mid-continent region (PADD II)
• Because of its large share of US residential/commercial propane consumption, PADD II
demand is among the most susceptible to weather-related demand variations.
PADD I36%
PADD II42%
PADD III5%
PADD IV5%
PADD V12%
US Regional Shares of Res/Com Propane Demand in 2014
© 2014 IHSSource: IHS
US Residential/Commercial Propane Consumption in 2014 = 424,000 bd

© 2014 IHS 11
Mid-Continent inventories dropped sharply starting in
October 2013, but have recovered strongly in 2014
• PADD II primary stocks dropped well below the normal range during the winter of 2013-14 …
… but recovered strongly during the 2nd and 3rd quarters
0
5
10
15
20
25
30
35
Jan 08 Feb 12 Mar 19 Apr 23 May 28 Jul 02 Aug 06 Sep 10 Oct 15 Nov 19 Dec 24
Million Barrels
2014
2013
2012
PADD II Primary Inventories
Source: IHS © 2014 IHS
2007-2011 Range of Maximum and
Minimum Invenories

© 2014 IHS 12
Total US primary inventories also recovered rapidly,
significantly exceeding the 2007-2013 maximum levels
0
10
20
30
40
50
60
70
80
90
Jan 08 Feb 12 Mar 19 Apr 23 May 28 Jul 02 Aug 06 Sep 10 Oct 15 Nov 19 Dec 24
Million Barrels
2014
2013
2012
Total US Propane Primary Inventories
Source: IHS © 2014 IHS
2007-2011 Range of Max and Min Primary Inventories (shaded
range)
• By mid-year, total US propane inventories had climbed rapidly, and are well above the
normal range at the start of the 2014-15 heating season.

© 2014 IHS 13
US Propane Supply Outlook for 2014-15

© 2014 IHS
US propane market in 2014-15: Outlook for the
coming winter depends on market fundamentals
• The US and PADD II markets responded quite well during the 2013-14
shortage, and the price spike was relatively temporary.
• US propane production continues to rise faster than growth in demand
and exports, enabling inventories to recover rapidly.
• US propane inventories have gone from near-record lows in early 2014
to near-record highs at the start of October.
• PADD II primary inventories have recovered to their highest October
levels since the economic collapse of 2009.
• Propane production from gas processing will sustain a rapid pace of
growth through 2015.
• US propane demand growth is projected to be modest, increasing by
just 1% in 2015.
• Propane exports will continue to grow as expanded and new export
capacity comes on line.
14

© 2014 IHS 15
US propane production from gas processing will be
driven by strong growth in shale gas production
• Rapidly rising shale gas production will drive corresponding growth in US propane
production; US propane from gas processing will rise nearly 20% in 2014, followed by 8%
growth in 2015.
0
200
400
600
800
1,000
1,200
Jan-07 Jan-08 Jan-09 Jan-10 Jan-11 Jan-12 Jan-13 Jan-14 Jan-15
US Propane Production from Gas Processing
© 2014 IHS
Thousand Barrels per Day
Sources: IHS, US Department of Energy
959
808
1,040US propane production from
gas processing will average
about 960 kbd in 2014, a 19%
increase over 2013

© 2014 IHS 16
US propane production from gas processing will be
driven by strong growth in shale gas production
• Most of the increase in NGL production will come from shale gas development in the
Marcellus, Utica and Bakken plays – all located in proximity to the mid-continent.
0
200
400
600
800
1,000
1,200
1,400
2010 2011 2012 2013 2014 2015 2016 2017 2018
Barnett
Woodford
Niobrara
Eagle Ford
Bakken
Marcellus
Utica
Total NGL Production by Major Shale Play
© 2014 IHS
Thousand Barrels per Day
Source: IHS
Marcellus, Utica and Bakken will account for about half of total
NGL production from shale plays
© 2014 IHS 17
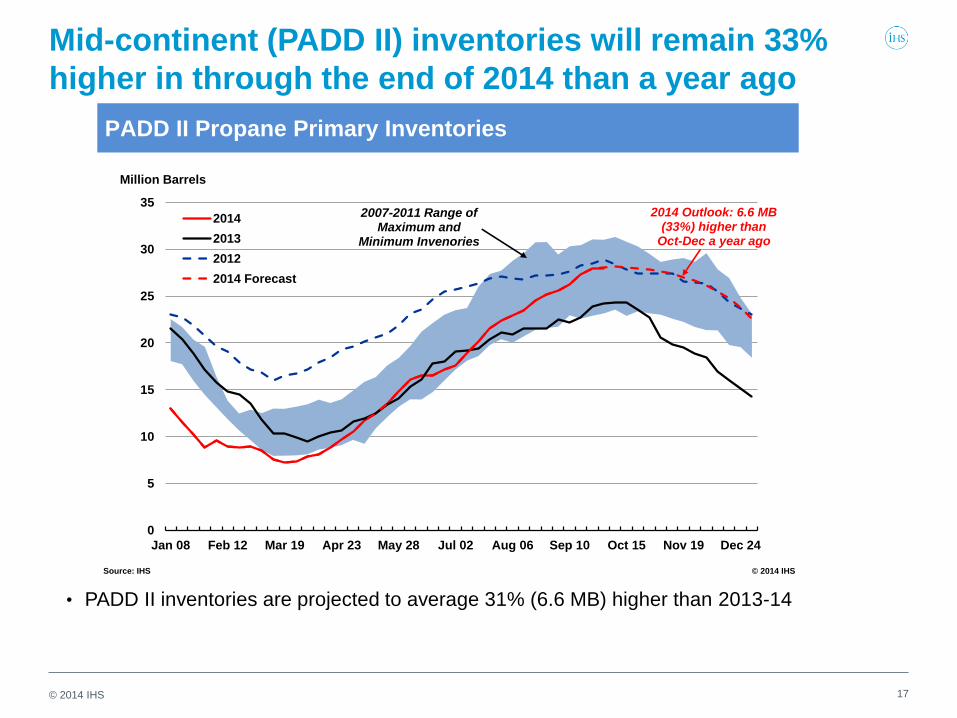
Mid-continent (PADD II) inventories will remain 33%
higher in through the end of 2014 than a year ago
• PADD II inventories are projected to average 31% (6.6 MB) higher than 2013-14
0
5
10
15
20
25
30
35
Jan 08 Feb 12 Mar 19 Apr 23 May 28 Jul 02 Aug 06 Sep 10 Oct 15 Nov 19 Dec 24
Million Barrels
2014
2013
2012
2014 Forecast
PADD II Propane Primary Inventories
Source: IHS © 2014 IHS
2007-2011 Range of Maximum and
Minimum Invenories
2014 Outlook: 6.6 MB (33%) higher than
Oct-Dec a year ago

© 2014 IHS 18
Total US primary inventories through the end of this
year will remain significantly higher than a year ago
0
10
20
30
40
50
60
70
80
90
Jan 08 Feb 12 Mar 19 Apr 23 May 28 Jul 02 Aug 06 Sep 10 Oct 15 Nov 19 Dec 24
Million Barrels
2014
2013
2012
2014 Forecast
Total US Propane Primary Inventories
Source: IHS © 2014 IHS
2007-2011 Range of Max and Min Primary Inventories (shaded
range)
2014 Outlook: 18.1 MB (31%) higher than Oct-Dec
a year ago

© 2014 IHS
US propane market in 2014-15:
Conclusions
Looking ahead at US and PADD II propane availability during the winter
of 2014-15, we expect that, despite an increase in domestic demand and
waterborne exports:
• Inventories will remain comfortable, and ample to meet projected
demand in the US and PADD II without a recurrence of last year’s
shortages.
• There is plenty of propane available to meet market demand.
• The high propane prices experienced last winter lasted only a short
time, roughly one month.
• Logistics capacity expansions and other measures are being taken by
various states in response to last year’s shortage.
19

© 2014 IHS
US propane market in 2014-15 and beyond: Factors
to monitor that could impact the supply outlook
• Propane demand for chemical feedstock use will increase with the
addition of new propane dehydrogenation (PDH) capacity – but these
additions will not affect the outlook for 2014-15.
• Propane exports will grow as new export terminal capacity is added in
the Gulf Coast region (increased during 2nd half 2014 and additional
expansions are scheduled for 2015).
• Logistics capacity changes are needed to accommodate changes in
US propane production, demand and exports in 2015 and beyond.
• Overall, supply and infrastructure additions are expected to keep pace
with production growth.
20

IHS Customer Care:
• Americas: +1 800 IHS CARE (+1 800 447 2273); [email protected]
• Europe, Middle East, and Africa: +44 (0) 1344 328 300; [email protected]
• Asia and the Pacific Rim: +604 291 3600; [email protected]
© 2014 IHS. No portion of this report may be reproduced, reused, or otherwise distributed in any form without prior written consent, with the exception of any internal client distribution as may be permitted in the license agreement between client and IHS.
Content reproduced or redistributed with IHS permission must display IHS legal notices and attributions of authorship. The information contained herein is from sources considered reliable but its accuracy and completeness are not warranted, nor are the
opinions and analyses which are based upon it, and to the extent permitted by law, IHS shall not be liable for any errors or omissions or any loss, damage, or expense incurred by reliance on information or any statement contained herein. For more
information, please contact IHS Customer Care (see phone numbers and email addresses listed above). All products, company names, or other marks appearing in this publication are the trademarks and property of IHS or their respective owners.