winter 2016 nonprofit fundraising study · overall ... missing goal linked with economy ... figure...
TRANSCRIPT
Winter 2016
Nonprofit Fundraising Study
Covering Charitable Receipts at Nonprofit Organizations in
the United States and Canada in 2015
March 2016
A Study From
Nonprofit Fundraising Survey March 2016
Acknowledgements
The Nonprofit Research Collaborative (NRC) thanks all respondents who took the
survey in January and February 2016. Your willingness to share information about
your organization makes it possible for this report to appear.
Most importantly, we thank every individual who made this report possible, from
concept and survey design through data analysis and proofreading. These include the
NRC committee, Lynn Lukins at Data Analytics & Research Solutions for data analysis,
Linh Preston at Fogus Consulting & Writing for writing and editing assistance, and
Gabrielle Robbins for proofreading.
Members of the Nonprofit Research Collaborative are
© Winter 2016 Nonprofit Fundraising Survey, Copyright 2016
Nonprofit Research Collaborative
Project management by
For permission to cite or reproduce, please contact Melissa Brown at
[email protected]. This report, PowerPoint slides based on graphics in this
report, infographics on selected NRC findings, and links to earlier reports can be found
at www.NPResearch.org.

Nonprofit Fundraising Survey i March 2016
CONTENTS List of Figures .................................................................................................................................... iii List of Tables ...................................................................................................................................... iv KEY FINDINGS ..................................................................................................................................... 1 KEY TRENDS ........................................................................................................................................ 2 INTRODUCTION ................................................................................................................................. 3 SECTION I: 2015 results .................................................................................................................... 4
65% of charities reported growth in charitable receipts ........................................................ 4 Organizations attribute success to major gifts, bequests, and working smarter overall ........................................................................................................................................... 5
Changes in charitable receipts by organizational size ........................................................... 6 Larger organizations more likely than smaller to see increases ....................................... 6 Across size groups, increase in the share of organizations reporting higher fundraising revenue compared with last year at this time ................................................ 7
Changes in charitable receipts by type of organization ......................................................... 8 Health and Arts organizations report greatest fluctuation among subsectors ............. 8
Change in charitable receipts by region .................................................................................. 10 Growth highest in U.S. West, lowest in U.S. South ............................................................. 10
Predicted change in charitable receipts compared with actual results ............................. 12 Nearly three-quarters met 2015 fundraising goal ................................................................. 13 Organizations attribute success to hard work; missing goal linked with economy or leadership challenges ............................................................................................................. 14
Smaller organizations remain less likely than larger ones to meet goals ..................... 15 Canadian organizations most likely to meet fundraising goal ....................................... 17
SECTION II: Fundraising methods FOR 2015 .............................................................................. 19 Direction of change in charitable receipts in 2015 by methods used ........................... 20 Organizations that do not see an increase in overall fundraising results are much less likely to see increases in most fundraising methods .................................... 24
SECTION III: TRENDS SINCE 2005 ................................................................................................. 27 Trends in changes in charitable receipts by methods often asked in person, 2005-2015 ................................................................................................................................................ 28 Trends in changes in charitable receipts via a specific communication medium, and special events, 2005-2015 .................................................................................................. 30 Trends in changes in charitable receipts from institutional donors, 2005-2015 ............ 33
SECTION IV: SPECIAL SECTION ON BEQUESTS ........................................................................... 35 More than 2/3rds of organizations raise funds with bequests .......................................... 35
Higher education organizations are the most likely to receive bequest dollars ......... 36 Larger organizations are more likely to receive bequests ................................................ 37 Bequest amounts received ...................................................................................................... 38 Average bequest amount most frequently between $25,000 and $100,000 ................ 39 Smaller organizations most likely to receive lower total from bequests ...................... 40
SECTION V: Outlook for 2016........................................................................................................ 41 CONCLUSION .................................................................................................................................... 45 METHODOLOGY ............................................................................................................................... 46
Statistical significance ................................................................................................................. 49 About the Nonprofit Research Collaborative ............................................................................. 50
Appendix I: Survey questions
Nonprofit Fundraising Survey ii March 2016
LIST OF FIGURES
Figure 1: Percentage of responding organizations reporting change in charitable receipts, 2015 compared with 2014 ....................................................................................... 5
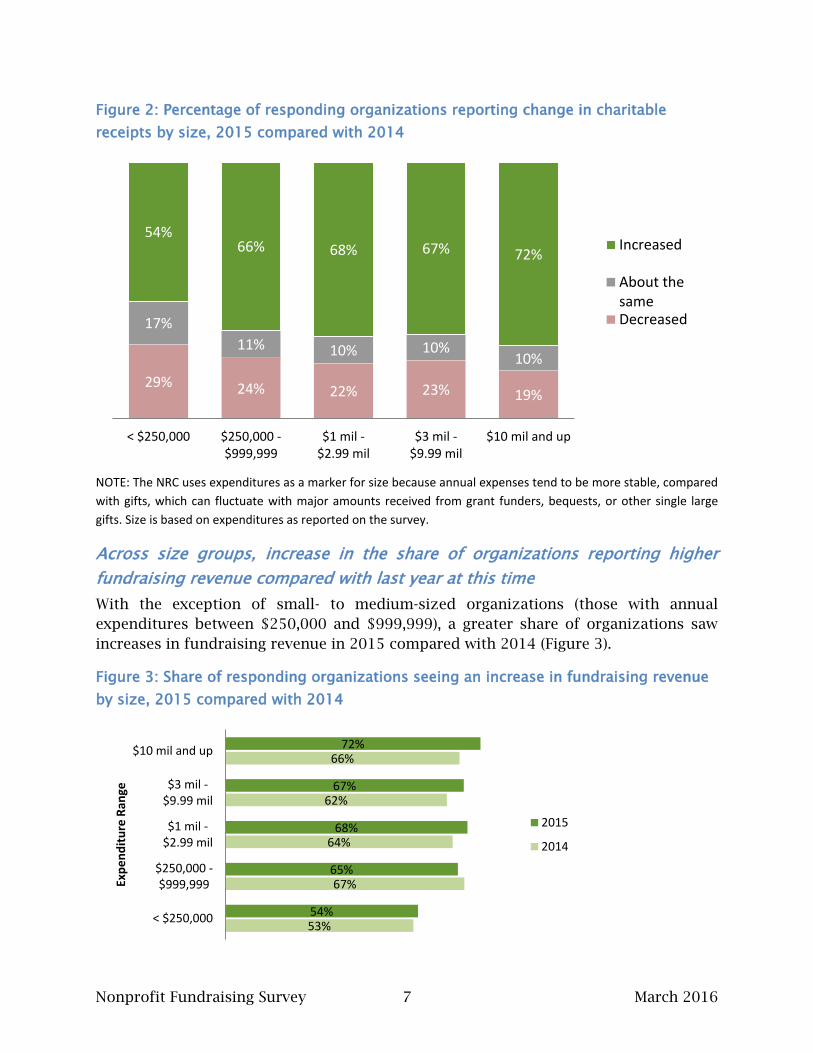
Figure 2: Percentage of responding organizations reporting change in charitable receipts by size, 2015 compared with 2014 ......................................................................... 7
Figure 3: Share of responding organizations seeing an increase in fundraising revenue by size, 2015 compared with 2014 ......................................................................... 7
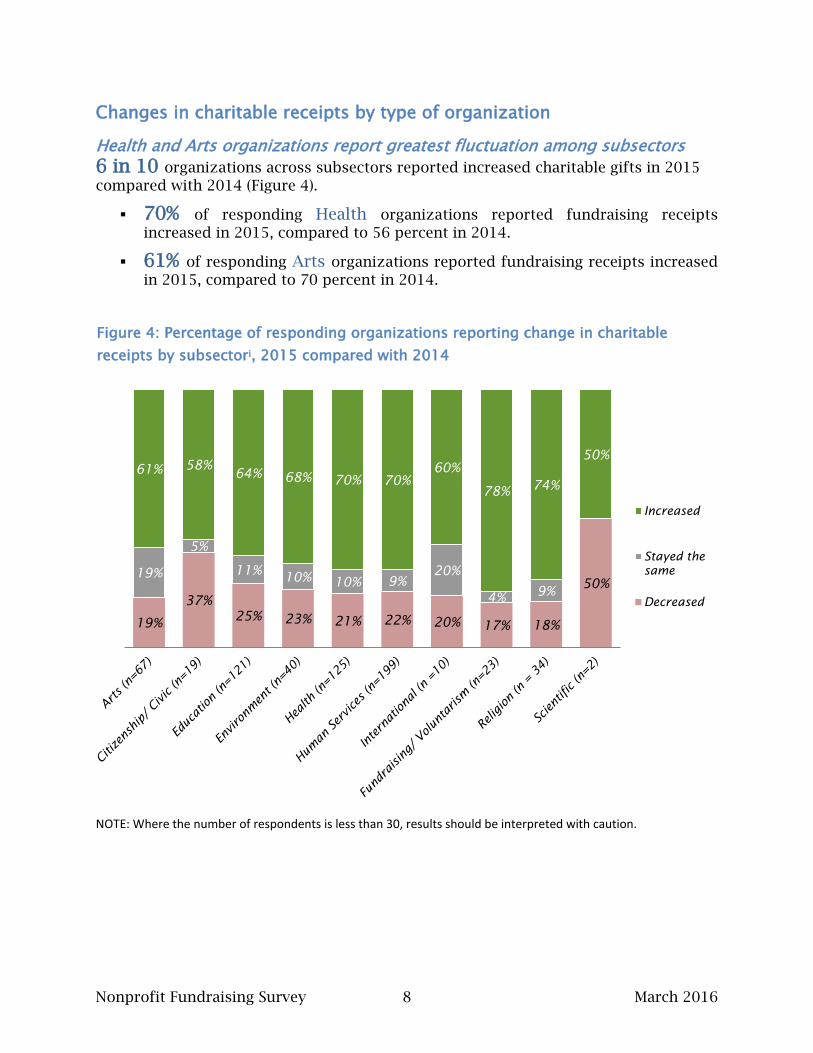
Figure 4: Percentage of responding organizations reporting change in charitable receipts by subsector, 2015 compared with 2014 ............................................................... 8
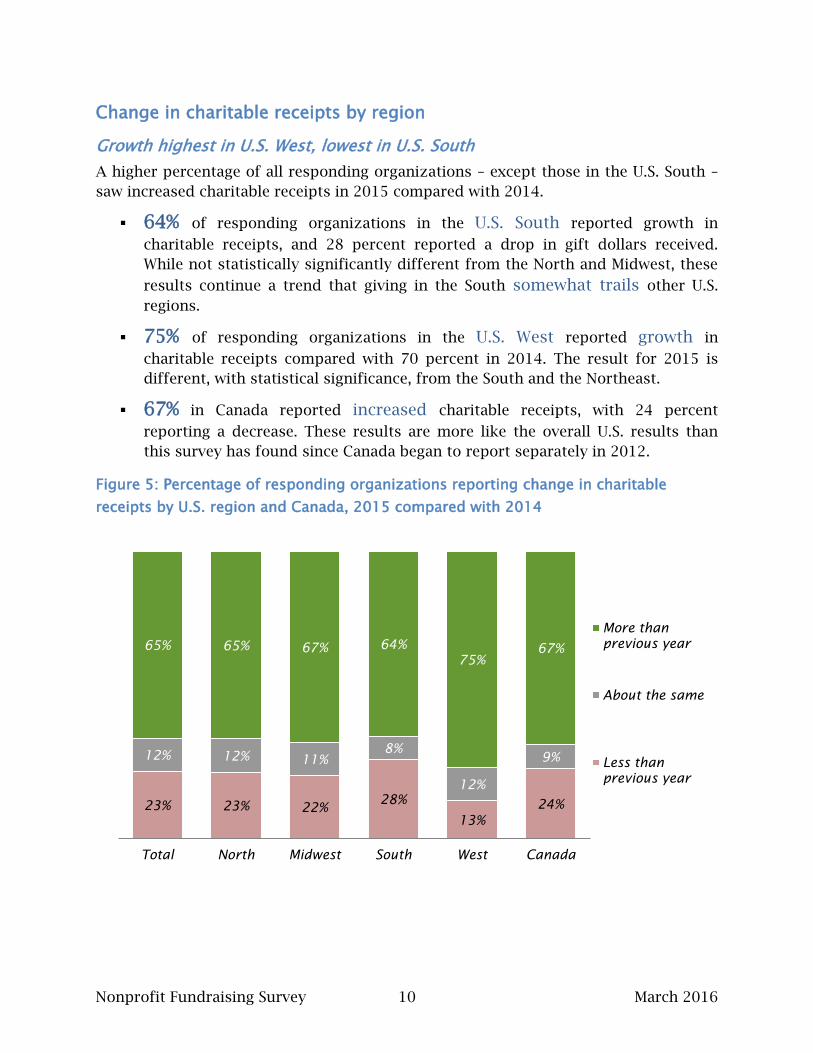
Figure 5: Percentage of responding organizations reporting change in charitable receipts by U.S. region and Canada, 2015 compared with 2014 ..................................... 10
Figure 6: Percentage of responding organizations reporting change in charitable receipts by U.S. region and Canada, 2015 compared with 2014 and 2014 compared with 2013 ................................................................................................................ 11
Figure 7: Predicted results for 2015 compared with actual results ....................................... 12
Figure 8: Did your organization meet its fiscal year 2015 fundraising goal? ...................... 13
Figure 9: Trend in percentage of organizations meeting fundraising goal, 2010-2015 .... 13
Figure 10: Words provided to explain meeting goals ............................................................... 14
Figure 11: Words provided to explain not meeting fundraising goal .................................... 15
Figure 12: Percentage of responding organizations meeting 2015 fundraising goal by organizational size ................................................................................................................... 16
Figure 13: Percentage by whether the responding organization met its 2015 fundraising goal, by region ..................................................................................................... 17
Figure 14: Percentage of responding organizations that use each of 15 fundraising methods ...................................................................................................................................... 19
Figure 15: Percentage of organizations reporting change in charitable receipts by most frequently used fundraising method, 2015 compared with 2014 ....................... 20
Figure 16: Percentage of organizations reporting change in charitable receipts by less frequently used fundraising method, 2015 compared with 2014 .................................. 21
Figure 17: Percentage of organizations reporting change in charitable receipts by least used fundraising method with slight increases, 2015 compared with 2014 ...... 23
Figure 18: Percentage of responding organizations that indicate using specific types of online or social media fundraising in 2015 ................................................................... 24
Figure 19: Percentage of respondents reporting an increase in funds raised by method and by whether the organization’s overall charitable receipts increased from 2014 to 2015 ................................................................................................................... 26
Figure 20: Percentage of responding organizations reporting change in charitable receipts by year, 2005-2015 ................................................................................................... 27
Figure 21: Percentage of responding organizations reporting change in contributions received from major gifts, 2005-2015 .................................................................................. 28
Figure 22: Percentage of responding organizations reporting change in contributions received through board giving, 2010-2015 ......................................................................... 28
Figure 23: Percentage of responding organizations reporting change in contributions received through planned gifts realized, 2005-2015 ........................................................ 29
Nonprofit Fundraising Survey iii March 2016
Figure 24: Percentage of responding organizations reporting change in contributions received through new committed planned gifts, 2012-2015 ........................................... 29
Figure 25: Percentage of responding organizations reporting change in contributions received through direct mail, 2005-2015 ............................................................................ 30
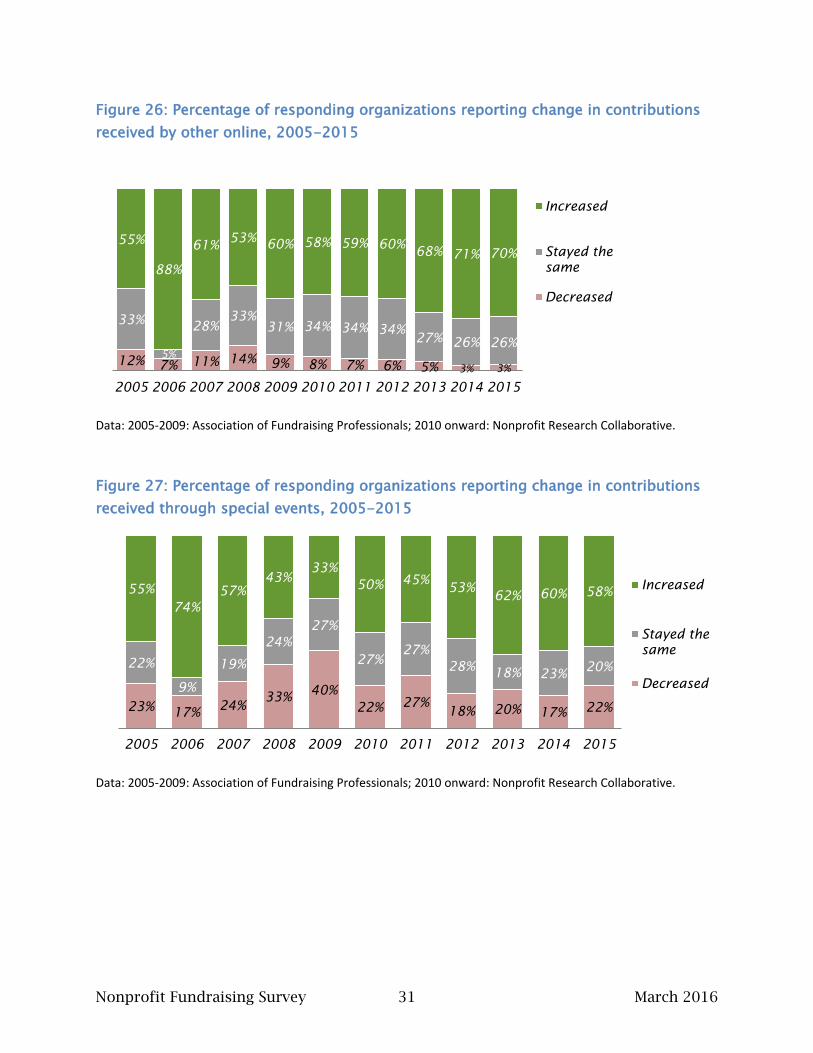
Figure 26: Percentage of responding organizations reporting change in contributions received by other online, 2005-2015 .................................................................................... 31
Figure 27: Percentage of responding organizations reporting change in contributions received through special events, 2005-2015 ....................................................................... 31
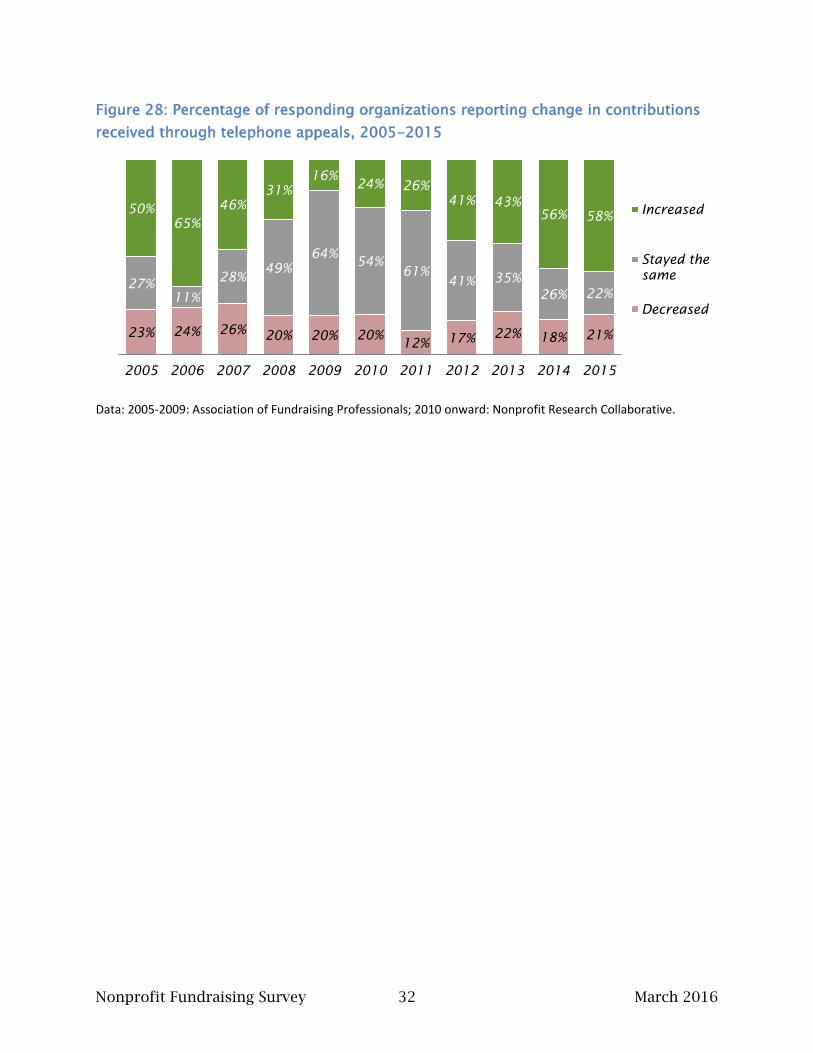
Figure 28: Percentage of responding organizations reporting change in contributions received through telephone appeals, 2005-2015 ............................................................... 32
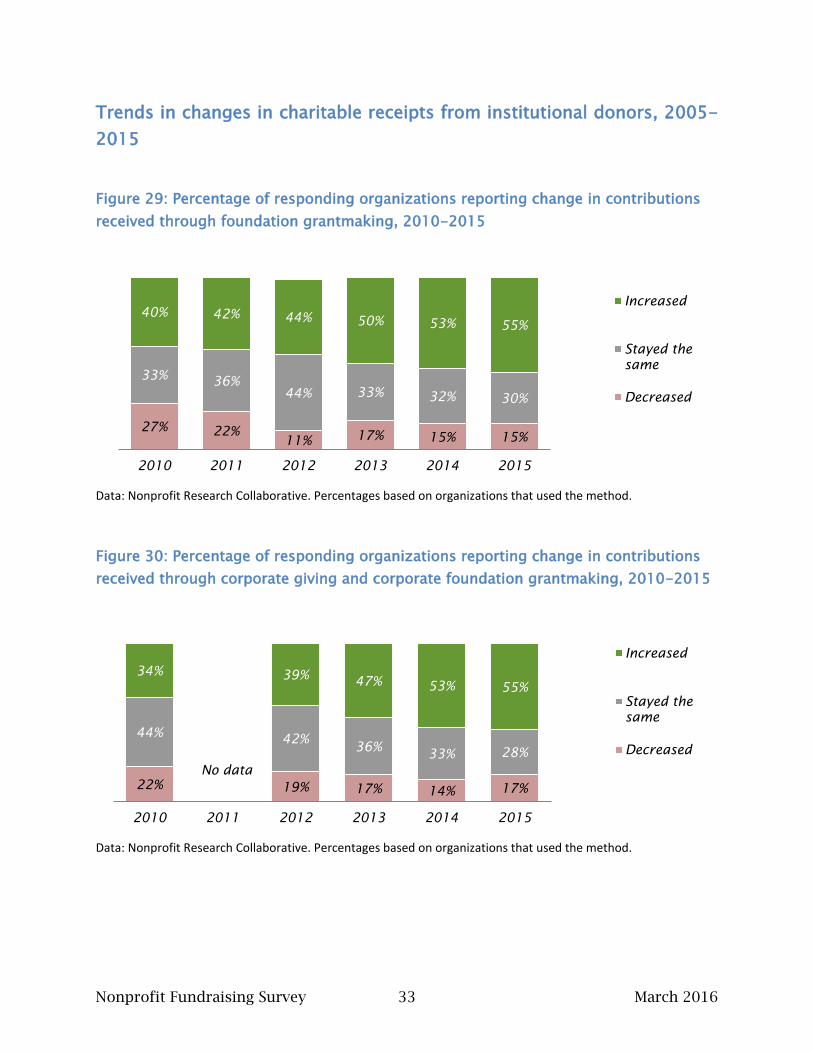
Figure 29: Percentage of responding organizations reporting change in contributions received through foundation grantmaking, 2010-2015 .................................................... 33
Figure 30: Percentage of responding organizations reporting change in contributions received through corporate giving and corporate foundation grantmaking, 2010-2015 ............................................................................................................................................ 33
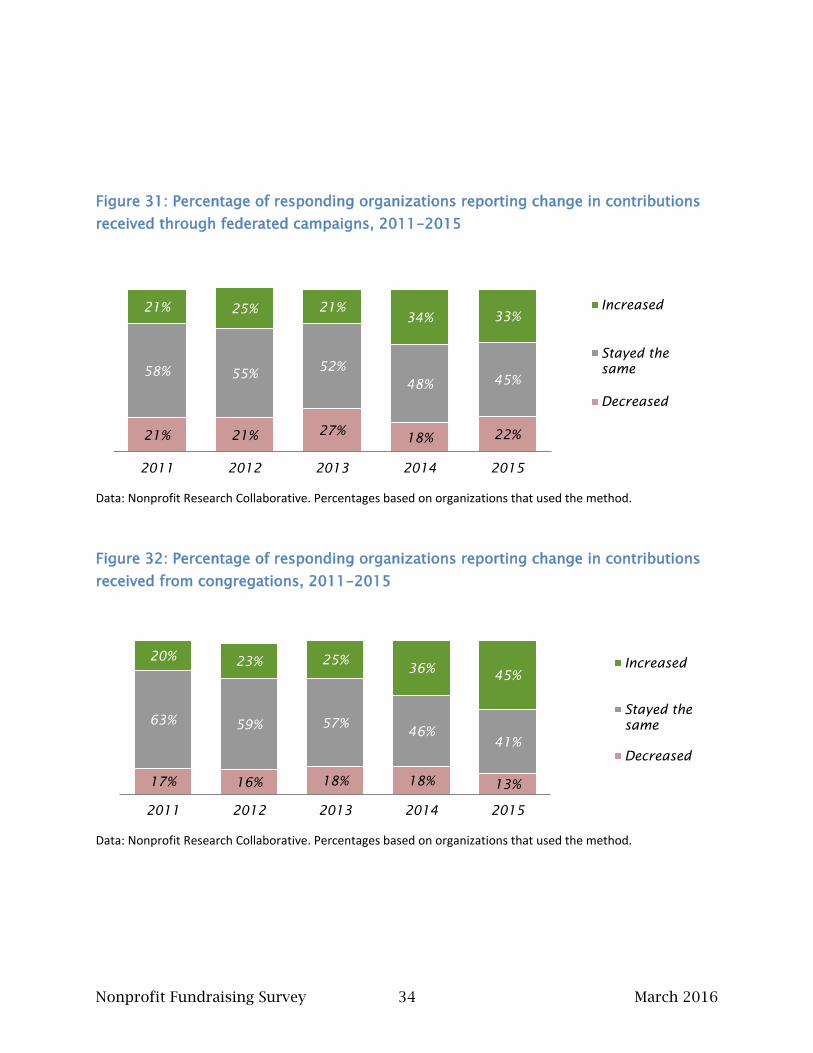
Figure 31: Percentage of responding organizations reporting change in contributions received through federated campaigns, 2011-2015 .......................................................... 34
Figure 32: Percentage of responding organizations reporting change in contributions received from congregations, 2011-2015 ............................................................................ 34
Figure 33: Percentage of responding organizations that received bequests in 2015 by subsector .................................................................................................................................... 36
Figure 34: Percentage of responding organizations that received bequests in 2015 by organization size ...................................................................................................................... 37
Figure 35: Percentage of responding organizations that received bequests in 2015 by total amount of bequest dollars ............................................................................................ 38
Figure 36: Percentage of responding organizations that received bequests in 2015 by average size of bequest amount ............................................................................................ 39
Figure 37: Percentage of responding organizations that received bequests in 2015 by greatest and least total amounts and by organization size ............................................. 40
Figure 38: Anticipated direction of change in charitable receipts, 2016 compared with 2015 ............................................................................................................................................ 41
Figure 39: Responses about anticipated challenges to 2016 fundraising, compared with what most negatively affected 2015 results .............................................................. 42
Figure 40: Responses about anticipated positive impact to 2016 fundraising, compared with what most positively affected 2015 results ............................................ 43
Figure 41: Percentage of responding charities by Census region compared with registered charities IRS and Business Master File, July 2013 .......................................... 47
Figure 42: Responding charities expenditure total, compared with reporting charities filing IRS forms ......................................................................................................................... 48
Figure 43: Responding charities by subsector compared with charities registered with the IRS ......................................................................................................................................... 49
Nonprofit Fundraising Survey iv March 2016
LIST OF TABLES Table 1: Trend in percentage of responding organizations reporting an increase in
charitable receipts, 2015-2010 .............................................................................................. 4
Table 2: Trend in percentage of responding organizations reporting a change in increased charitable receipts by subsector, 2015-2013.................................................... 9
Table 3: Trend in percentage of responding organizations reporting increased charitable receipts by subsector, 2015-2013. ..................................................................... 9
Table 4: Trend in percentage of responding organizations reporting decreased charitable receipts by subsector, 2015-2014 ...................................................................... 9
Table 5: Trend in percentage of responding organizations meeting fundraising goal by organizational size, 2013-2015 ...................................................................................... 16
Nonprofit Fundraising Survey 1 March 2016
KEY FINDINGS
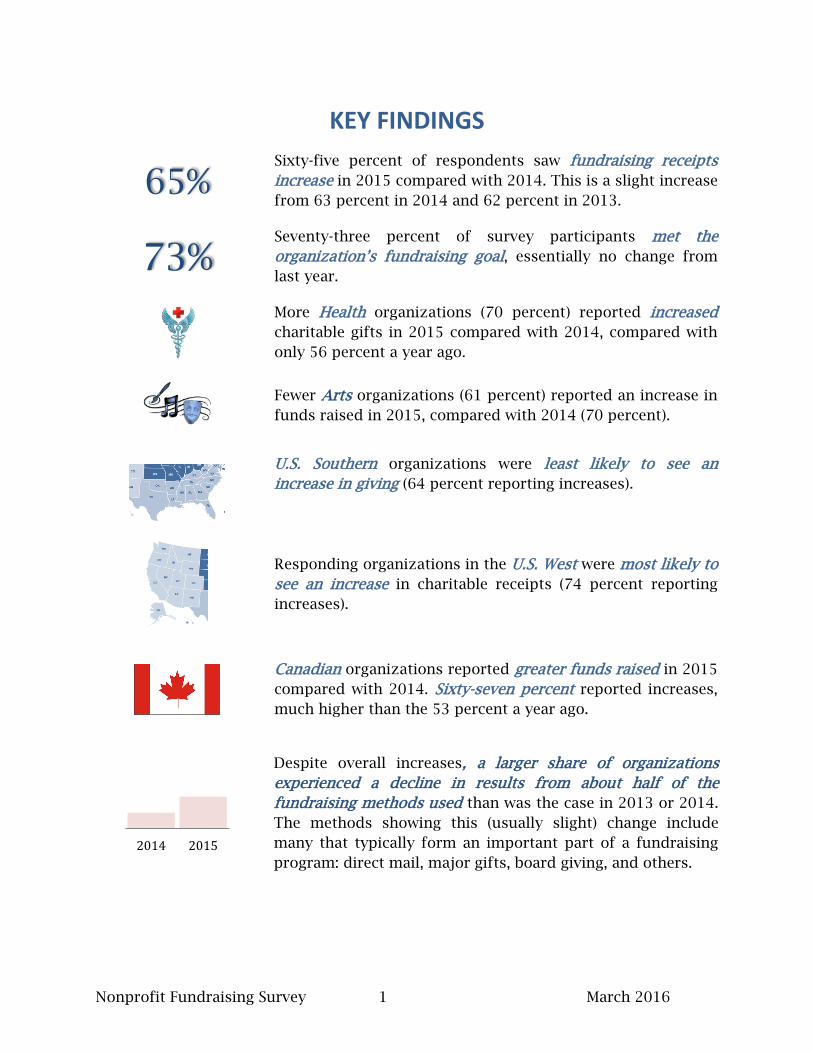
65% Sixty-five percent of respondents saw fundraising receipts
increase in 2015 compared with 2014. This is a slight increase
from 63 percent in 2014 and 62 percent in 2013.
73%Seventy-three percent of survey participants met the
organization’s fundraising goal, essentially no change from
last year.
More Health organizations (70 percent) reported increased
charitable gifts in 2015 compared with 2014, compared with
only 56 percent a year ago.
Fewer Arts organizations (61 percent) reported an increase in
funds raised in 2015, compared with 2014 (70 percent).
U.S. Southern organizations were least likely to see an
increase in giving (64 percent reporting increases).
Responding organizations in the U.S. West were most likely to
see an increase in charitable receipts (74 percent reporting
increases).
Canadian organizations reported greater funds raised in 2015
compared with 2014. Sixty-seven percent reported increases,
much higher than the 53 percent a year ago.
Despite overall increases, a larger share of organizations
experienced a decline in results from about half of the
fundraising methods used than was the case in 2013 or 2014.
The methods showing this (usually slight) change include
many that typically form an important part of a fundraising
program: direct mail, major gifts, board giving, and others. 2014 2015
Nonprofit Fundraising Survey 2 March 2016
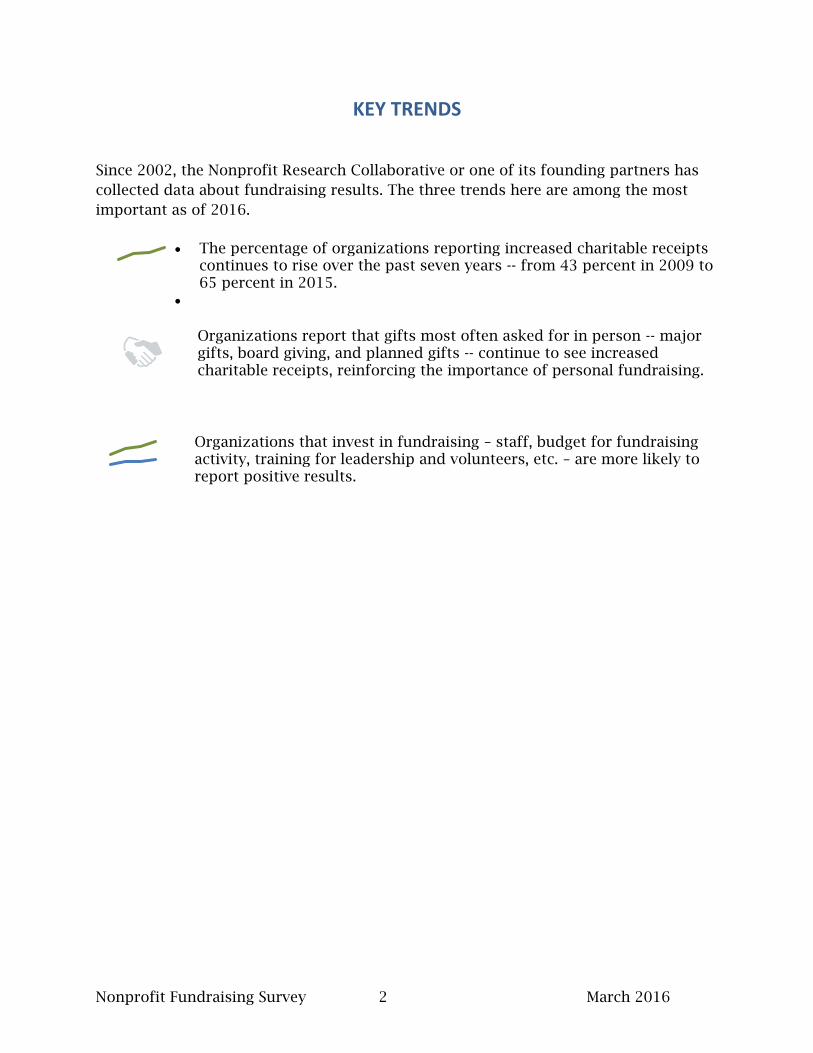
KEY TRENDS
Since 2002, the Nonprofit Research Collaborative or one of its founding partners has
collected data about fundraising results. The three trends here are among the most
important as of 2016.
The percentage of organizations reporting increased charitable receiptscontinues to rise over the past seven years -- from 43 percent in 2009 to65 percent in 2015.
Organizations report that gifts most often asked for in person -- major gifts, board giving, and planned gifts -- continue to see increased charitable receipts, reinforcing the importance of personal fundraising.
Organizations that invest in fundraising – staff, budget for fundraising activity, training for leadership and volunteers, etc. – are more likely to report positive results.
Nonprofit Fundraising Survey 3 March 2016
INTRODUCTION
A stronger economy and lower unemployment rates helped nonprofit organizations
see little change in the amount of charitable gifts received in 2015; however, many are
concerned that growth will actually decrease as donors are uneasy over an unstable
economy and the political environment leading up to the U.S. Presidential election. For
the first time since the Nonprofit Fundraising Survey began tracking Canadian
organizations separately, the results for that nation are very comparable to the results
for the United States. This report reveals to what extent a wide range of charitable
organizations in the United States and Canada saw increases, decreases, or no change
in charitable receipts in 2015.
Nearly 1,200 organizations answered Nonprofit Research Collaborative (NRC) survey
questions in early 2016 about charitable receipts from January through December
2015. Responding charitable groups included large and small organizations (by budget
size) and organizations from every subsector, Arts through Religion. Findings are
based on responses remaining after data cleaning, 1,197 total, including 71 from
Canada.
Questions ranged from changes in charitable receipt amounts in 2015, compared with
2014, to expectations for 2016. These findings can help an organization plan for its
fundraising efforts. We share results about charitable receipts in 2015 and compare
those with findings from similar surveys from 2005 through 2014. This section also
compares what charities predicted would happen in 2015 with what actually did.
One of the unique features of the NFS is our trend data, which covers findings about
charitable receipts from more than a dozen different fundraising methods. This report
includes trends for 2005 through 2015 by method.
The survey also asked about expectations for charitable receipts in 2016 and gave
respondents a chance to comment on specific challenges or trends they anticipate
affecting their fundraising this year.
Nonprofit Fundraising Survey 4 March 2016
SECTION I: 2015 RESULTS
This section presents overall results, results by size (determined by expenditures), by
subsector, and by region.
65% of charities reported growth in charitable receipts
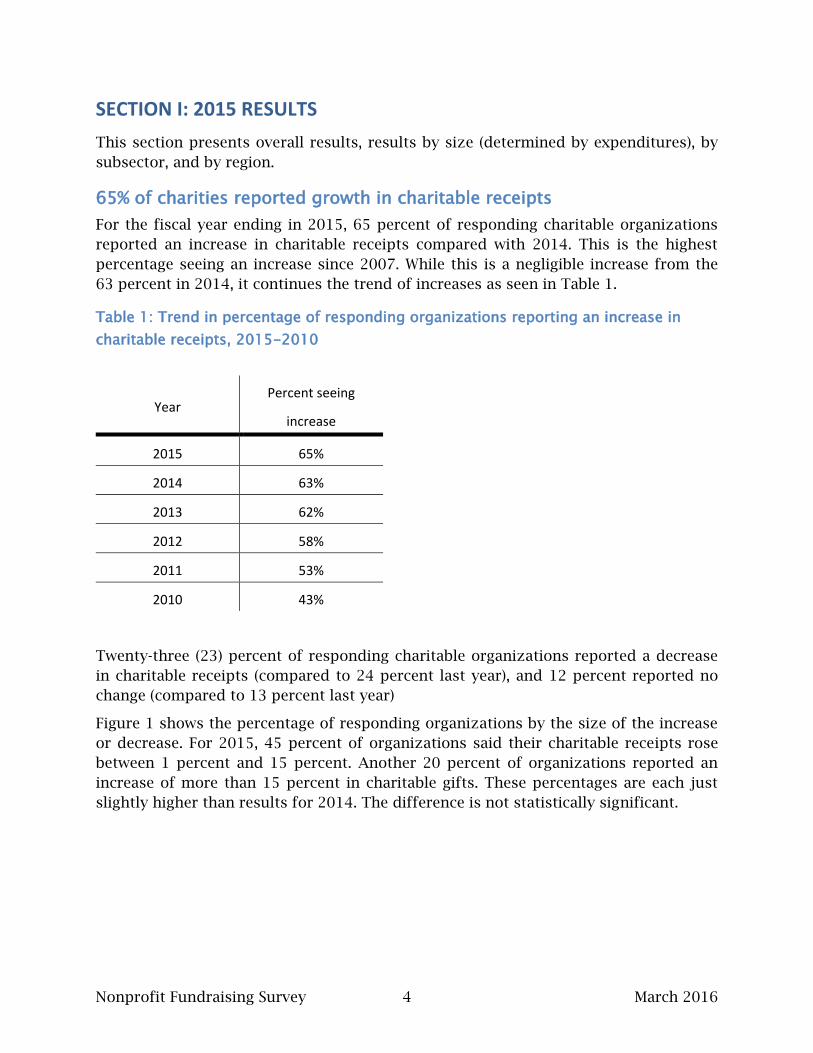
For the fiscal year ending in 2015, 65 percent of responding charitable organizations
reported an increase in charitable receipts compared with 2014. This is the highest
percentage seeing an increase since 2007. While this is a negligible increase from the
63 percent in 2014, it continues the trend of increases as seen in Table 1.
Table 1: Trend in percentage of responding organizations reporting an increase in
charitable receipts, 2015-2010
Year Percent seeing
increase
2015 65%
2014 63%
2013 62%
2012 58%
2011 53%
2010 43%
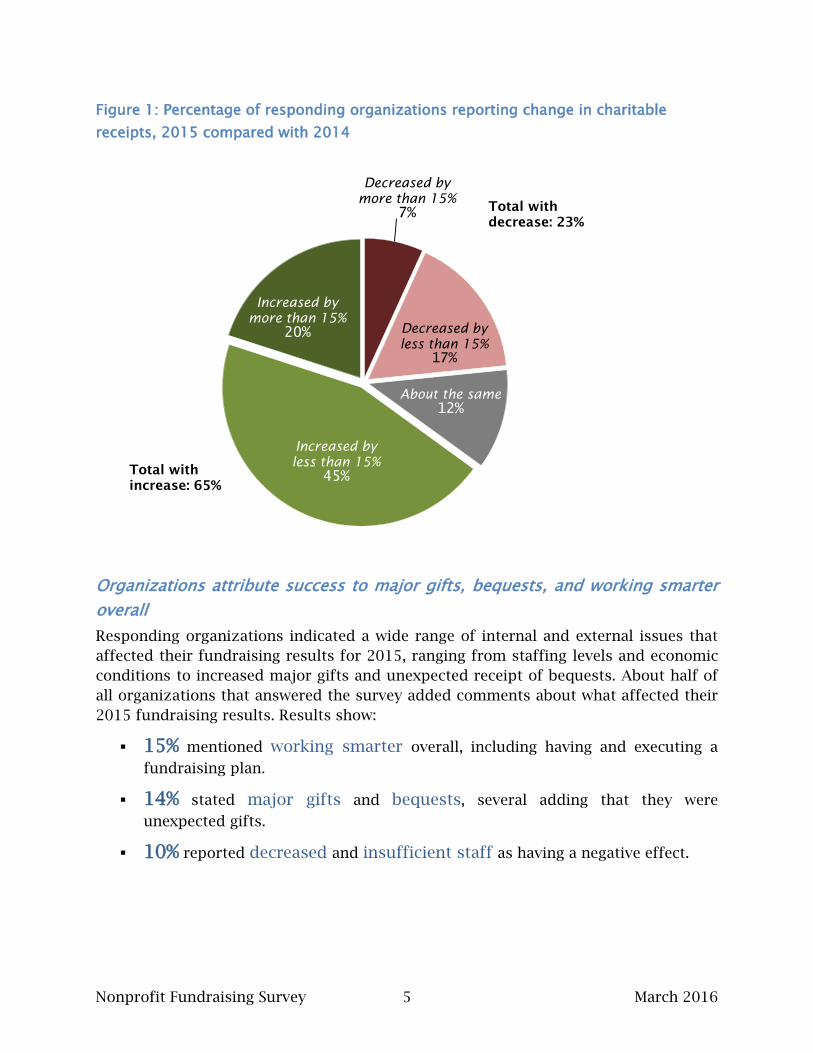
Twenty-three (23) percent of responding charitable organizations reported a decrease
in charitable receipts (compared to 24 percent last year), and 12 percent reported no
change (compared to 13 percent last year)
Figure 1 shows the percentage of responding organizations by the size of the increase
or decrease. For 2015, 45 percent of organizations said their charitable receipts rose
between 1 percent and 15 percent. Another 20 percent of organizations reported an
increase of more than 15 percent in charitable gifts. These percentages are each just
slightly higher than results for 2014. The difference is not statistically significant.
Nonprofit Fundraising Survey 5 March 2016
Figure 1: Percentage of responding organizations reporting change in charitable
receipts, 2015 compared with 2014
Organizations attribute success to major gifts, bequests, and working smarter
overall
Responding organizations indicated a wide range of internal and external issues that
affected their fundraising results for 2015, ranging from staffing levels and economic
conditions to increased major gifts and unexpected receipt of bequests. About half of
all organizations that answered the survey added comments about what affected their
2015 fundraising results. Results show:
15% mentioned working smarter overall, including having and executing a
fundraising plan.
14% stated major gifts and bequests, several adding that they were
unexpected gifts.
10% reported decreased and insufficient staff as having a negative effect.
Decreased by
more than 15%
7%
Decreased by
less than 15%
17%
About the same
12%
Increased by
less than 15%
45%
Increased by
more than 15%
20%
Total with
increase: 65%
Total with
decrease: 23%
Nonprofit Fundraising Survey 6 March 2016
Changes in charitable receipts by organizational size
The one factor associated consistently with a lower probability of raising more in
philanthropic revenue in any one year is having a lower overall organizational budget
from all revenue sources. This has been the case since the NFS began in 2010.
Larger organizations more likely than smaller to see increases
As has been the case in prior waves of the Nonprofit Fundraising Survey, larger
organizations (based on reported expenditures) were more likely to see growth in
charitable receipts than were smaller organizations (Figure 2).
54% of the smallest organizations (expenditures less than $250,000) reported
growth in charitable receipts for 2015.
17% of the smallest organizations reported unchanged charitable receipts in
2015, which is significantly more than the 9 to 11 percent of larger
organizations (any level of expenditure $250,000 or above) reporting no change.
72% of the largest organizations (expenditures $10 million or more) reported
growth in charitable receipts for 2015; this was also the largest group to see
increased giving.
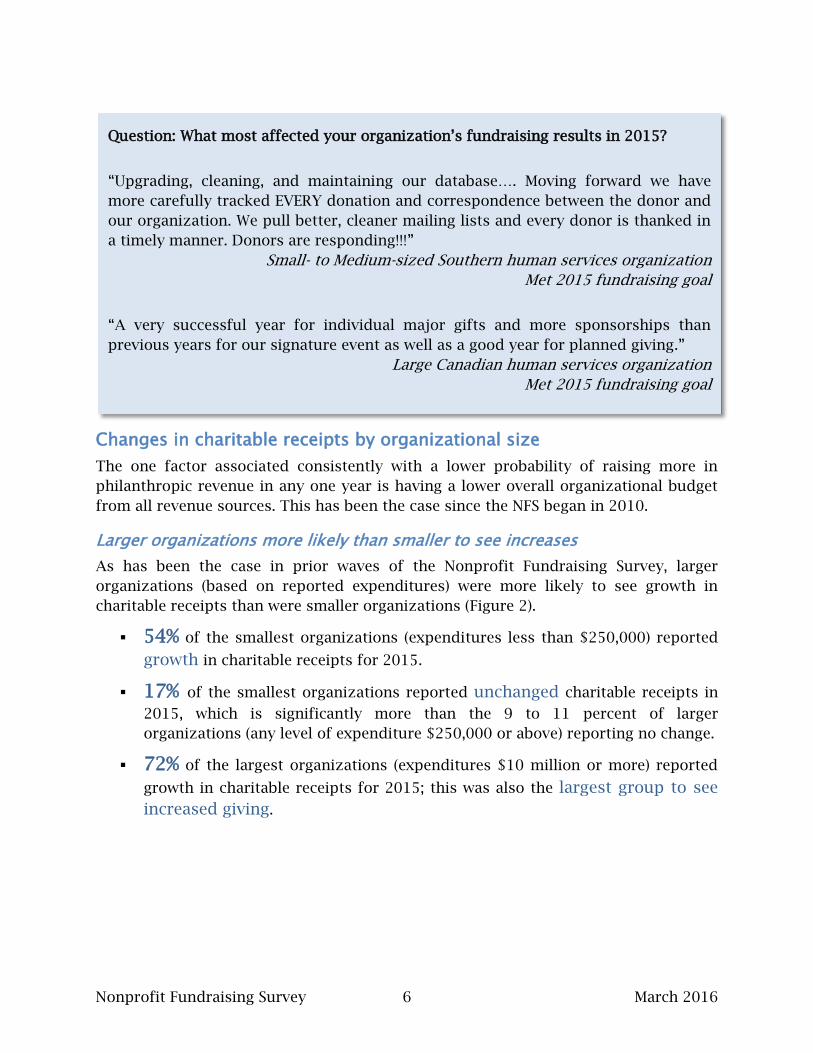
Question: What most affected your organization’s fundraising results in 2015?
“Upgrading, cleaning, and maintaining our database…. Moving forward we have
more carefully tracked EVERY donation and correspondence between the donor and
our organization. We pull better, cleaner mailing lists and every donor is thanked in
a timely manner. Donors are responding!!!”
Small- to Medium-sized Southern human services organization
Met 2015 fundraising goal
“A very successful year for individual major gifts and more sponsorships than
previous years for our signature event as well as a good year for planned giving.”
Large Canadian human services organization
Met 2015 fundraising goal
Nonprofit Fundraising Survey 7 March 2016
Figure 2: Percentage of responding organizations reporting change in charitable
receipts by size, 2015 compared with 2014
NOTE: The NRC uses expenditures as a marker for size because annual expenses tend to be more stable, compared
with gifts, which can fluctuate with major amounts received from grant funders, bequests, or other single large
gifts. Size is based on expenditures as reported on the survey.
Across size groups, increase in the share of organizations reporting higher
fundraising revenue compared with last year at this time
With the exception of small- to medium-sized organizations (those with annual
expenditures between $250,000 and $999,999), a greater share of organizations saw
increases in fundraising revenue in 2015 compared with 2014 (Figure 3).
Figure 3: Share of responding organizations seeing an increase in fundraising revenue
by size, 2015 compared with 2014
29% 24% 22% 23% 19%
17%
11% 10% 10% 10%
54% 66% 68% 67% 72%
< $250,000 $250,000 -$999,999
$1 mil -$2.99 mil
$3 mil -$9.99 mil
$10 mil and up
Increased
About thesameDecreased
53%
67%
64%
62%
66%
54%
65%
68%
67%
72%
< $250,000
$250,000 -$999,999
$1 mil -$2.99 mil
$3 mil -$9.99 mil
$10 mil and up
Exp
en
dit
ure
Ran
ge
2015
2014
Nonprofit Fundraising Survey 8 March 2016
Changes in charitable receipts by type of organization
Health and Arts organizations report greatest fluctuation among subsectors
6 in 10 organizations across subsectors reported increased charitable gifts in 2015
compared with 2014 (Figure 4).
70% of responding Health organizations reported fundraising receipts
increased in 2015, compared to 56 percent in 2014.
61% of responding Arts organizations reported fundraising receipts increased
in 2015, compared to 70 percent in 2014.
Figure 4: Percentage of responding organizations reporting change in charitable
receipts by subsectori, 2015 compared with 2014
NOTE: Where the number of respondents is less than 30, results should be interpreted with caution.
19%
37%
25% 23% 21% 22% 20% 17% 18%
50%
19%
5%
11% 10%
10% 9%
20%
4% 9%
61% 58%
64% 68% 70% 70%
60%
78% 74%
50%
Increased
Stayed the
same
Decreased
Nonprofit Fundraising Survey 9 March 2016
Over time, giving to Health and to Arts has fluctuated, as shown in Table 2. For 2015,
the swings in the share of organizations reporting an increase in charitable receipts are
the largest.
Table 2: Trend in percentage of responding organizations reporting a change in
increased charitable receipts by subsector, 2015-2013
2013 2014 2015
Arts, n = 67 52% by 18 70% by 9 61%
Health, n = 125 65% by 9 56% by 14 70%
Because of small sample sizes for the subsectors Religion; Philanthropy, Fundraising,
Voluntarism, or Grantmaking; and Citizenship and Civic Improvement, the
comparisons in Table 3 and Table 4 may not well reflect these subsectors. However,
the fluctuations are still interesting to note. In Table 3, an increase in the share
reporting an increase in charitable receipts is a positive sign among the responding
charities Religion and for Fundraising, Voluntarism, or Grantmaking.
Table 3: Trend in percentage of responding organizations reporting increased
charitable receipts by subsector, 2015-2013.
2013 2014 2015
Religion, n = 34 52% 6 58% by 16 74%
FR/Voluntarism, etc., n = 23 * * 59% by 19 78%
* Comparable data not available
Table 4 shows a higher number for the share of Civic Improvement organizations that
reported a drop in charitable receipts in 2015. This hints that this type of organization
might be experiencing a more challenging fundraising climate although the low
number of respondents makes us cautious. Fundraising and Voluntarism organizations
were LESS likely in 2015 than in 2014 to see a decline in giving (and more likely, as
above to see an increase).
Table 4: Trend in percentage of responding organizations reporting decreased
charitable receipts by subsector, 2015-2014
2014 2015
FR/Voluntarism, etc., n = 23 39% by 22 17%
Citizenship/Civic Improvement, n=19 18% by 19 37%
Nonprofit Fundraising Survey 10 March 2016
Change in charitable receipts by region
Growth highest in U.S. West, lowest in U.S. South
A higher percentage of all responding organizations – except those in the U.S. South –
saw increased charitable receipts in 2015 compared with 2014.
64% of responding organizations in the U.S. South reported growth in
charitable receipts, and 28 percent reported a drop in gift dollars received.
While not statistically significantly different from the North and Midwest, these
results continue a trend that giving in the South somewhat trails other U.S.
regions.
75% of responding organizations in the U.S. West reported growth in
charitable receipts compared with 70 percent in 2014. The result for 2015 is
different, with statistical significance, from the South and the Northeast.
67% in Canada reported increased charitable receipts, with 24 percent
reporting a decrease. These results are more like the overall U.S. results than
this survey has found since Canada began to report separately in 2012.
Figure 5: Percentage of responding organizations reporting change in charitable
receipts by U.S. region and Canada, 2015 compared with 2014
23% 23% 22% 28%
13%
24%
12% 12% 11%
8%
12%
9%
65% 65% 67% 64%
75%
67%
Total North Midwest South West Canada
More than
previous year
About the same
Less than
previous year
Nonprofit Fundraising Survey 11 March 2016
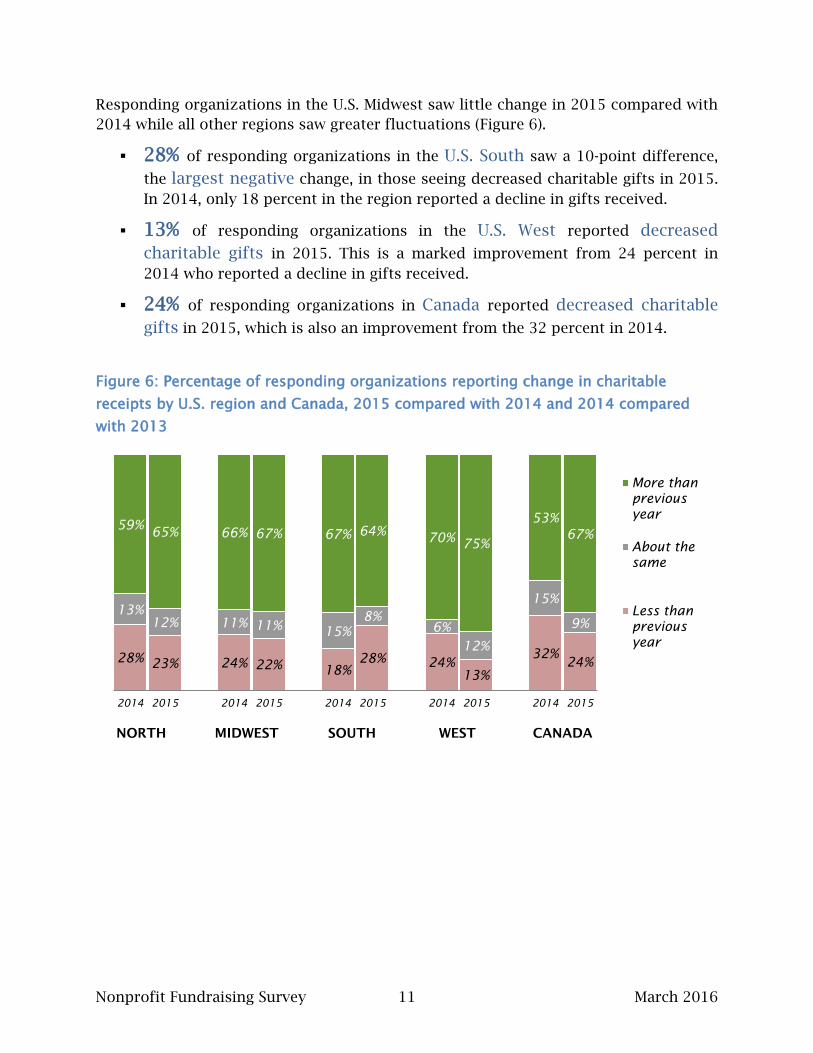
Responding organizations in the U.S. Midwest saw little change in 2015 compared with
2014 while all other regions saw greater fluctuations (Figure 6).
28% of responding organizations in the U.S. South saw a 10-point difference,
the largest negative change, in those seeing decreased charitable gifts in 2015.
In 2014, only 18 percent in the region reported a decline in gifts received.
13% of responding organizations in the U.S. West reported decreased
charitable gifts in 2015. This is a marked improvement from 24 percent in
2014 who reported a decline in gifts received.
24% of responding organizations in Canada reported decreased charitable
gifts in 2015, which is also an improvement from the 32 percent in 2014.
Figure 6: Percentage of responding organizations reporting change in charitable
receipts by U.S. region and Canada, 2015 compared with 2014 and 2014 compared
with 2013
NORTH MIDWEST SOUTH WEST CANADA
28% 23% 24% 22%
18%
28% 24%
13%
32% 24%
13%
12% 11% 11% 15%
8%
6%
12%
15%
9%
59% 65% 66% 67% 67% 64%
70% 75%
53%
67%
2014 2015 2014 2015 2014 2015 2014 2015 2014 2015
More than
previous
year
About the
same
Less than
previous
year
Nonprofit Fundraising Survey 12 March 2016
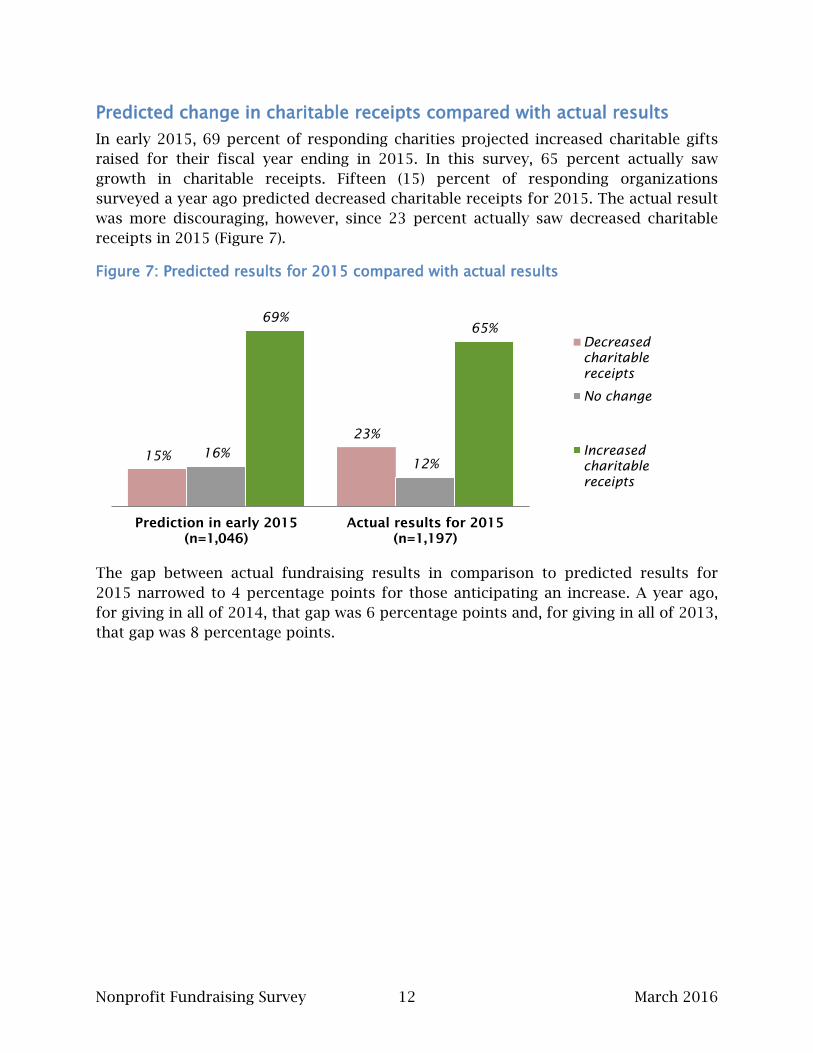
Predicted change in charitable receipts compared with actual results
In early 2015, 69 percent of responding charities projected increased charitable gifts
raised for their fiscal year ending in 2015. In this survey, 65 percent actually saw
growth in charitable receipts. Fifteen (15) percent of responding organizations
surveyed a year ago predicted decreased charitable receipts for 2015. The actual result
was more discouraging, however, since 23 percent actually saw decreased charitable
receipts in 2015 (Figure 7).
Figure 7: Predicted results for 2015 compared with actual results
The gap between actual fundraising results in comparison to predicted results for
2015 narrowed to 4 percentage points for those anticipating an increase. A year ago,
for giving in all of 2014, that gap was 6 percentage points and, for giving in all of 2013,
that gap was 8 percentage points.
15%
23%
16%
12%
69%
65%
Prediction in early 2015
(n=1,046)
Actual results for 2015
(n=1,197)
Decreased
charitable
receipts
No change
Increased
charitable
receipts
Nonprofit Fundraising Survey 13 March 2016
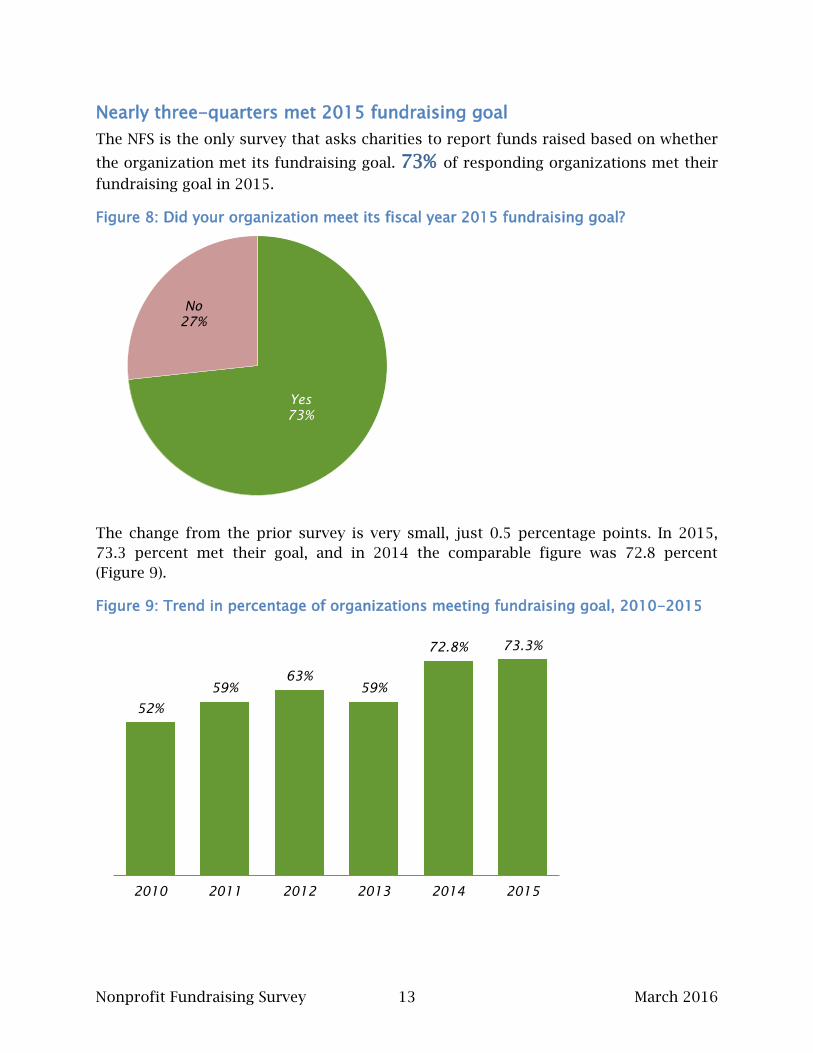
Nearly three-quarters met 2015 fundraising goal
The NFS is the only survey that asks charities to report funds raised based on whether
the organization met its fundraising goal. 73% of responding organizations met their
fundraising goal in 2015.
Figure 8: Did your organization meet its fiscal year 2015 fundraising goal?
The change from the prior survey is very small, just 0.5 percentage points. In 2015,
73.3 percent met their goal, and in 2014 the comparable figure was 72.8 percent
(Figure 9).
Figure 9: Trend in percentage of organizations meeting fundraising goal, 2010-2015
Yes
73%
No
27%
52%
59%
63%
59%
72.8% 73.3%
2010 2011 2012 2013 2014 2015
Nonprofit Fundraising Survey 14 March 2016
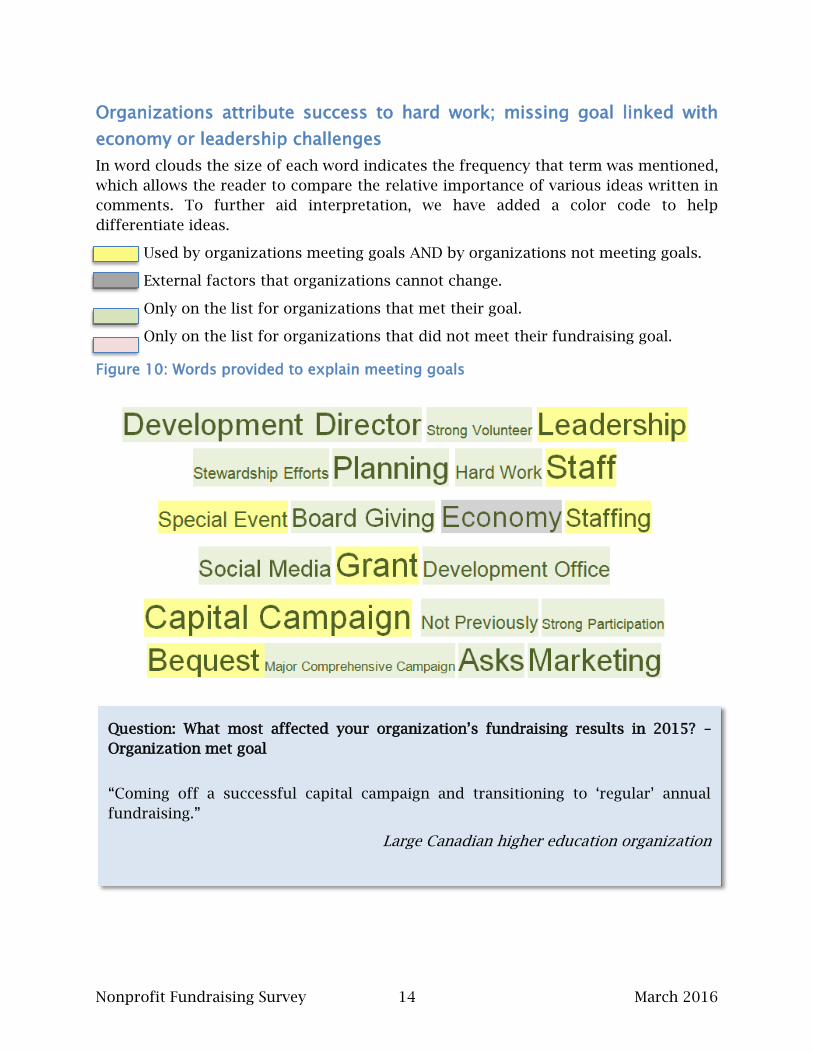
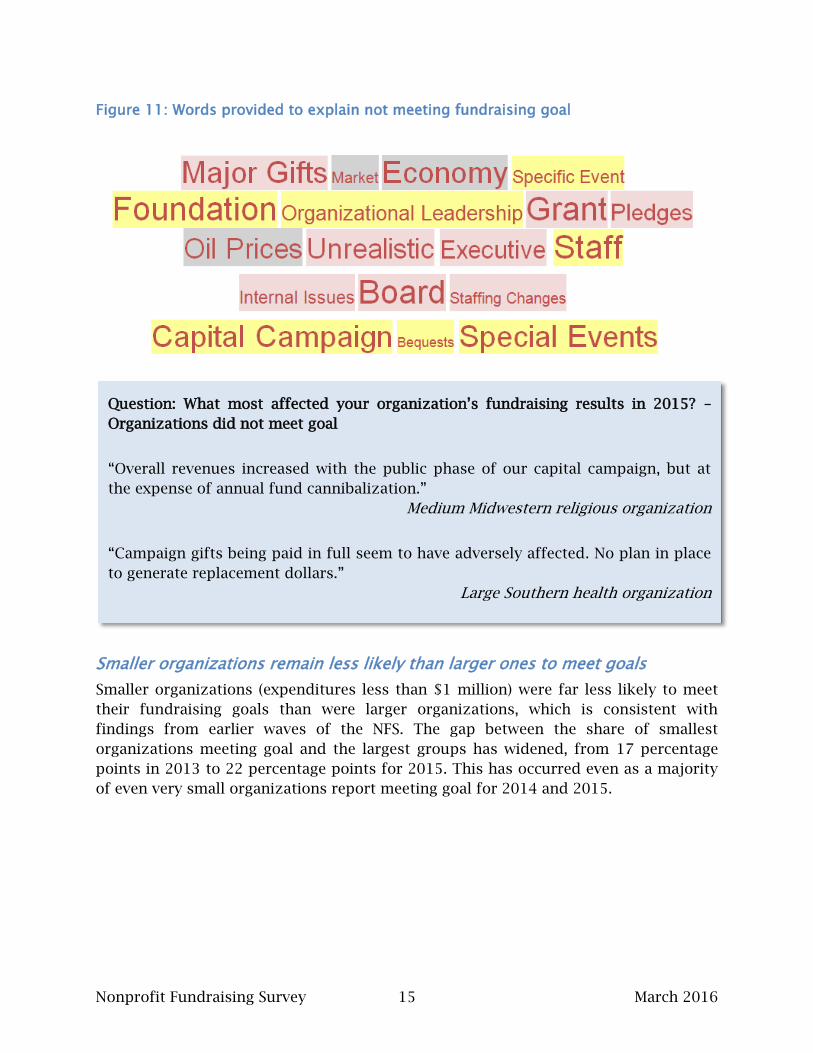
Organizations attribute success to hard work; missing goal linked with
economy or leadership challenges
In word clouds the size of each word indicates the frequency that term was mentioned,
which allows the reader to compare the relative importance of various ideas written in
comments. To further aid interpretation, we have added a color code to help
differentiate ideas.
Used by organizations meeting goals AND by organizations not meeting goals.
External factors that organizations cannot change.
Only on the list for organizations that met their goal.
Only on the list for organizations that did not meet their fundraising goal.
Figure 10: Words provided to explain meeting goals
Question: What most affected your organization’s fundraising results in 2015? –
Organization met goal
“Coming off a successful capital campaign and transitioning to ‘regular’ annual
fundraising.”
Large Canadian higher education organization
Nonprofit Fundraising Survey 15 March 2016
Figure 11: Words provided to explain not meeting fundraising goal
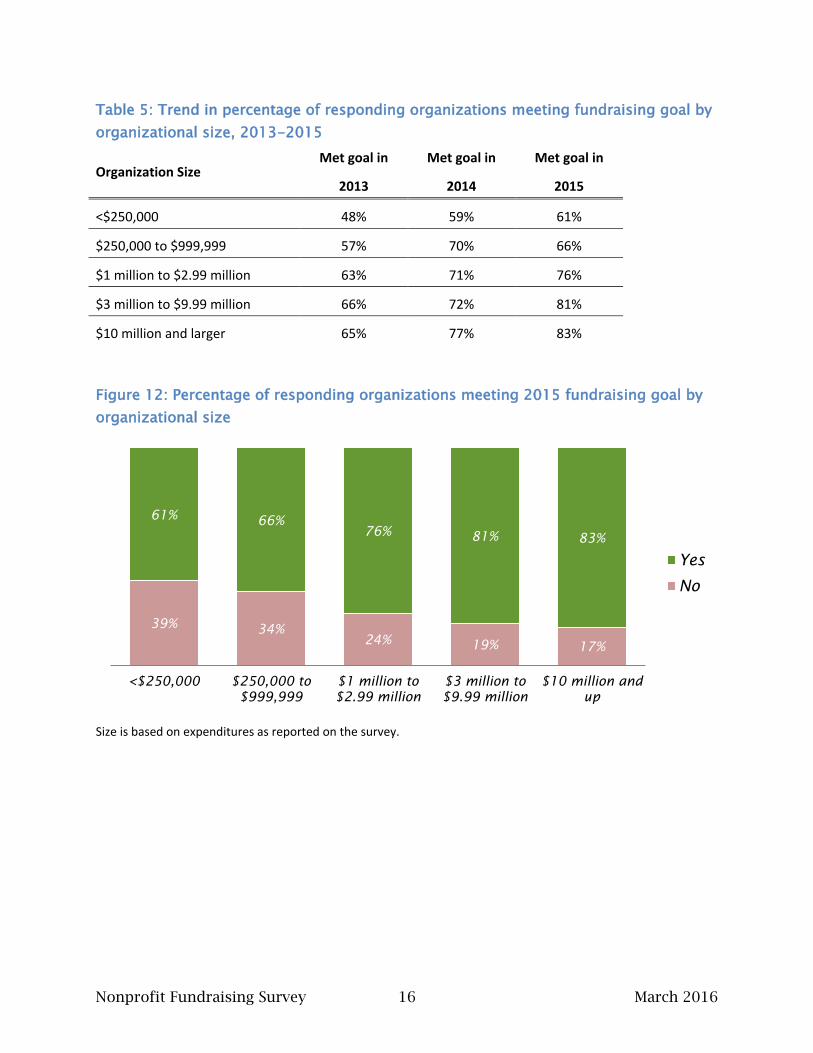
Smaller organizations remain less likely than larger ones to meet goals
Smaller organizations (expenditures less than $1 million) were far less likely to meet
their fundraising goals than were larger organizations, which is consistent with
findings from earlier waves of the NFS. The gap between the share of smallest
organizations meeting goal and the largest groups has widened, from 17 percentage
points in 2013 to 22 percentage points for 2015. This has occurred even as a majority
of even very small organizations report meeting goal for 2014 and 2015.
Question: What most affected your organization’s fundraising results in 2015? –
Organizations did not meet goal
“Overall revenues increased with the public phase of our capital campaign, but at
the expense of annual fund cannibalization.”
Medium Midwestern religious organization
“Campaign gifts being paid in full seem to have adversely affected. No plan in place
to generate replacement dollars.”
Large Southern health organization
Nonprofit Fundraising Survey 16 March 2016
Table 5: Trend in percentage of responding organizations meeting fundraising goal by
organizational size, 2013-2015
Organization Size Met goal in
2013
Met goal in
2014
Met goal in
2015
<$250,000 48% 59% 61%
$250,000 to $999,999 57% 70% 66%
$1 million to $2.99 million 63% 71% 76%
$3 million to $9.99 million 66% 72% 81%
$10 million and larger 65% 77% 83%
Figure 12: Percentage of responding organizations meeting 2015 fundraising goal by
organizational size
Size is based on expenditures as reported on the survey.
39% 34%
24% 19% 17%
61% 66%
76% 81% 83%
<$250,000 $250,000 to
$999,999
$1 million to
$2.99 million
$3 million to
$9.99 million
$10 million and
up
Yes
No
Nonprofit Fundraising Survey 17 March 2016
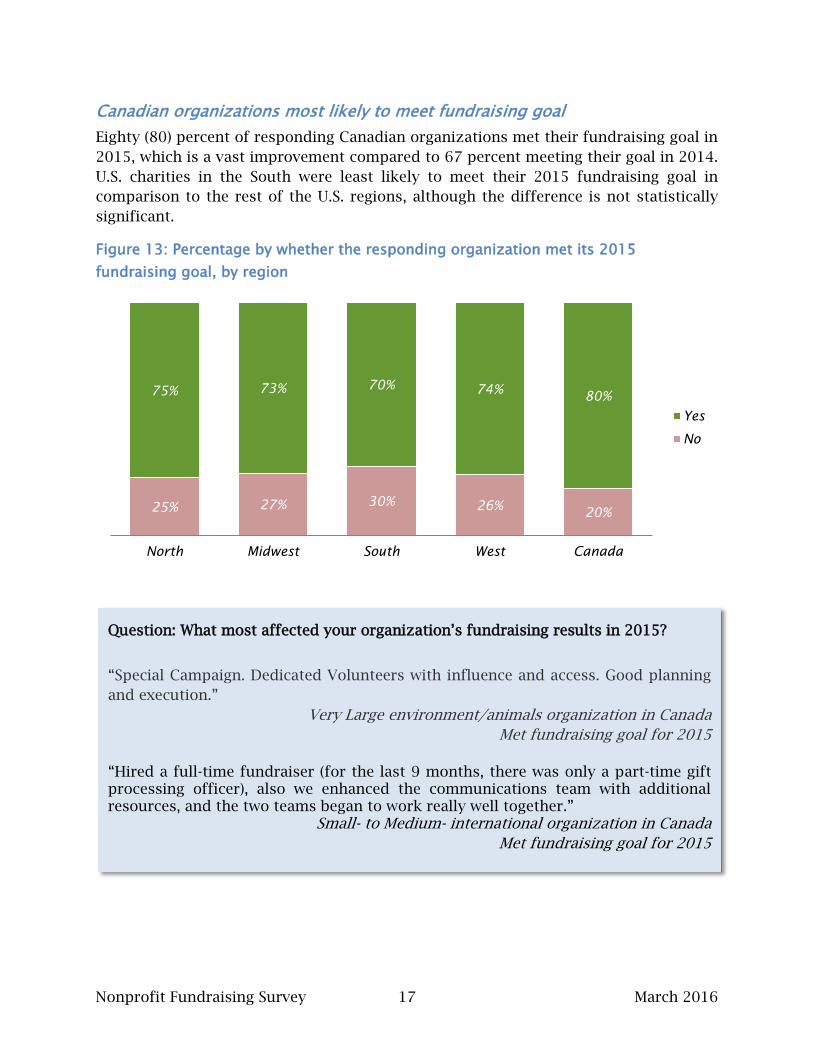
Canadian organizations most likely to meet fundraising goal
Eighty (80) percent of responding Canadian organizations met their fundraising goal in
2015, which is a vast improvement compared to 67 percent meeting their goal in 2014.
U.S. charities in the South were least likely to meet their 2015 fundraising goal in
comparison to the rest of the U.S. regions, although the difference is not statistically
significant.
Figure 13: Percentage by whether the responding organization met its 2015
fundraising goal, by region
25% 27% 30% 26%
20%
75% 73% 70% 74%
80%
North Midwest South West Canada
Yes
No
Question: What most affected your organization’s fundraising results in 2015?
“Special Campaign. Dedicated Volunteers with influence and access. Good planning
and execution.”
Very Large environment/animals organization in Canada
Met fundraising goal for 2015
“Hired a full-time fundraiser (for the last 9 months, there was only a part-time gift processing officer), also we enhanced the communications team with additional resources, and the two teams began to work really well together.”
Small- to Medium- international organization in Canada
Met fundraising goal for 2015
Nonprofit Fundraising Survey 18 March 2016
Question: What most affected your organization’s fundraising results in 2015?
“Consistent and systematic organization and reapplication of formal annual giving
program (2015 is year two); increased donor engagement and recognition,
systematic communication, community outreach; exceeding annual fund (two
primary appeals) expectations; segmentation of data base; strong reception and
attendance at primary annual fundraising event.”
Small- to Medium-sized Northern environmental organization
Met 2015 fundraising goal
“In addition to changes in the economy, our fundraising efforts were affected by
organizational staffing changes in 2014 and 2015 that prevented our Donor
Relations Department from being fully staffed.”
Medium Southern human services organization
Did not meet 2015 fundraising goal
Nonprofit Fundraising Survey 19 March 2016
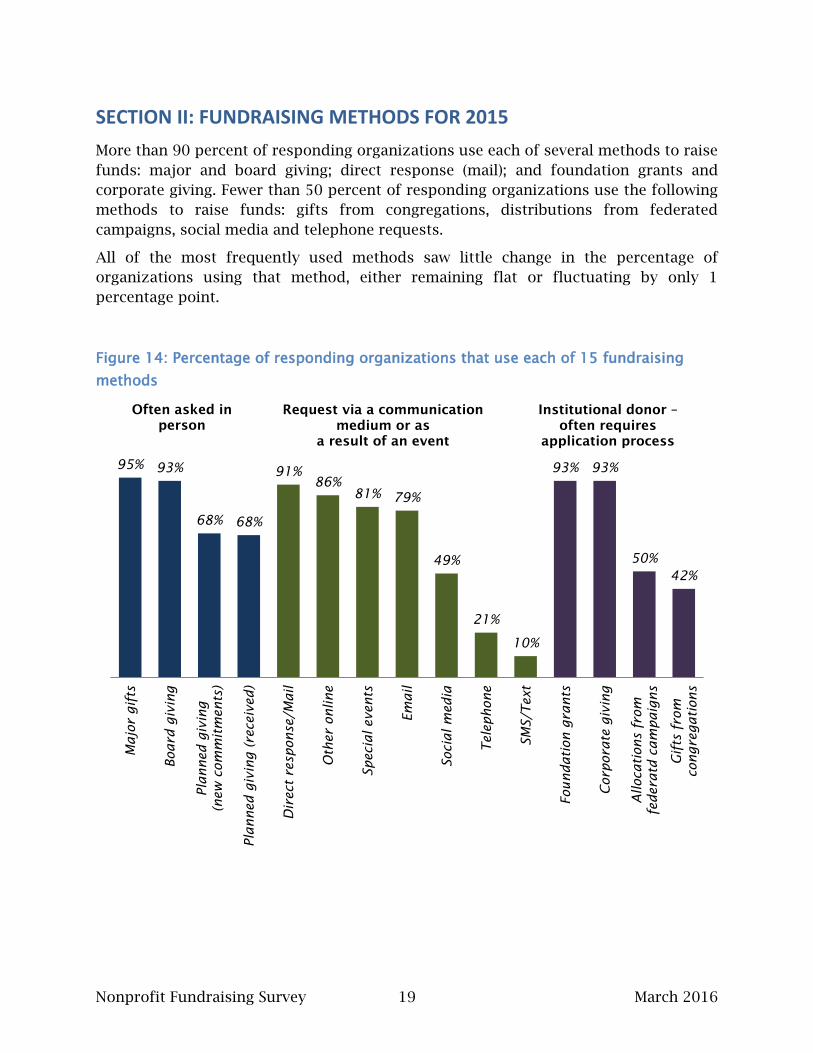
SECTION II: FUNDRAISING METHODS FOR 2015
More than 90 percent of responding organizations use each of several methods to raise
funds: major and board giving; direct response (mail); and foundation grants and
corporate giving. Fewer than 50 percent of responding organizations use the following
methods to raise funds: gifts from congregations, distributions from federated
campaigns, social media and telephone requests.
All of the most frequently used methods saw little change in the percentage of
organizations using that method, either remaining flat or fluctuating by only 1
percentage point.
Figure 14: Percentage of responding organizations that use each of 15 fundraising
methods
95% 93%
68% 68%
91%
86%
81% 79%
49%
21%
10%
93% 93%
50%
42%
Major gifts
Board giving
Planned giving
(new
com
mitm
ents)
Planned giving (received)
Direct response/M
ail
Other online
Special events
Em
ail
Social m
edia
Telephone
SM
S/Text
Foundation grants
Corporate giving
Allocations from
federatd cam
paigns
Gifts from
congregations
Often asked in
person
Request via a communication
medium or as
a result of an event
Institutional donor –
often requires
application process
Nonprofit Fundraising Survey 20 March 2016
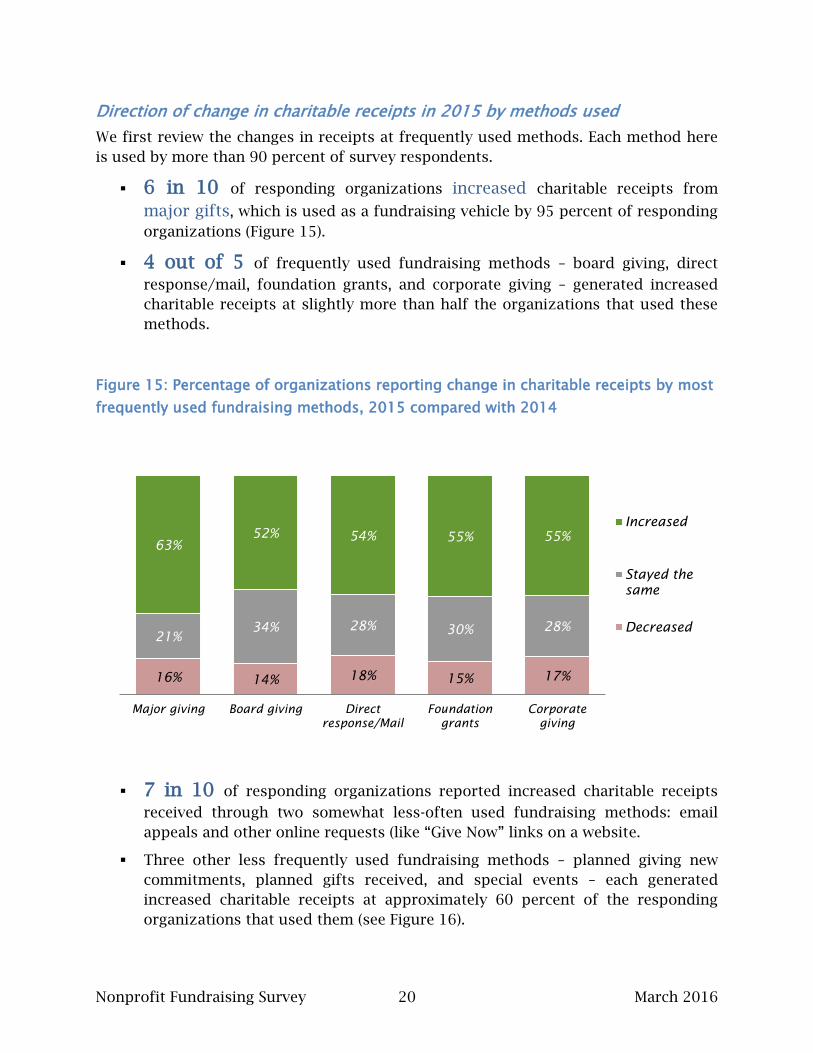
Direction of change in charitable receipts in 2015 by methods used
We first review the changes in receipts at frequently used methods. Each method here
is used by more than 90 percent of survey respondents.
6 in 10 of responding organizations increased charitable receipts from
major gifts, which is used as a fundraising vehicle by 95 percent of responding
organizations (Figure 15).
4 out of 5 of frequently used fundraising methods – board giving, direct
response/mail, foundation grants, and corporate giving – generated increased
charitable receipts at slightly more than half the organizations that used these
methods.
Figure 15: Percentage of organizations reporting change in charitable receipts by most
frequently used fundraising methods, 2015 compared with 2014
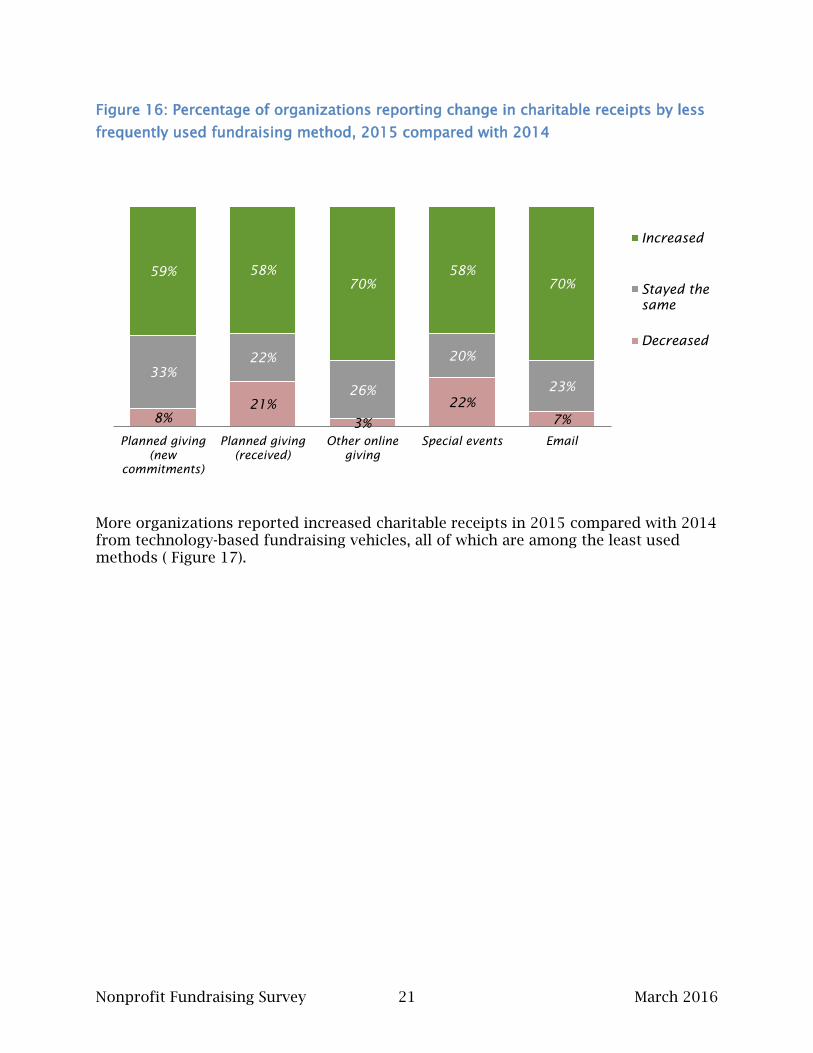
7 in 10 of responding organizations reported increased charitable receipts
received through two somewhat less-often used fundraising methods: email
appeals and other online requests (like “Give Now” links on a website.
Three other less frequently used fundraising methods – planned giving new
commitments, planned gifts received, and special events – each generated
increased charitable receipts at approximately 60 percent of the responding
organizations that used them (see Figure 16).
16% 14% 18% 15% 17%
21%
34% 28% 30% 28%
63%
52% 54% 55% 55%
Major giving Board giving Direct
response/Mail
Foundation
grants
Corporate
giving
Increased
Stayed the
same
Decreased
Nonprofit Fundraising Survey 21 March 2016
Figure 16: Percentage of organizations reporting change in charitable receipts by less
frequently used fundraising method, 2015 compared with 2014
More organizations reported increased charitable receipts in 2015 compared with 2014 from technology-based fundraising vehicles, all of which are among the least used methods ( Figure 17).
8%
21%
3%
22%
7%
33%
22%
26%
20%
23%
59% 58%
70%
58%
70%
Planned giving
(new
commitments)
Planned giving
(received)
Other online
giving
Special events Email
Increased
Stayed the
same
Decreased
Nonprofit Fundraising Survey 22 March 2016
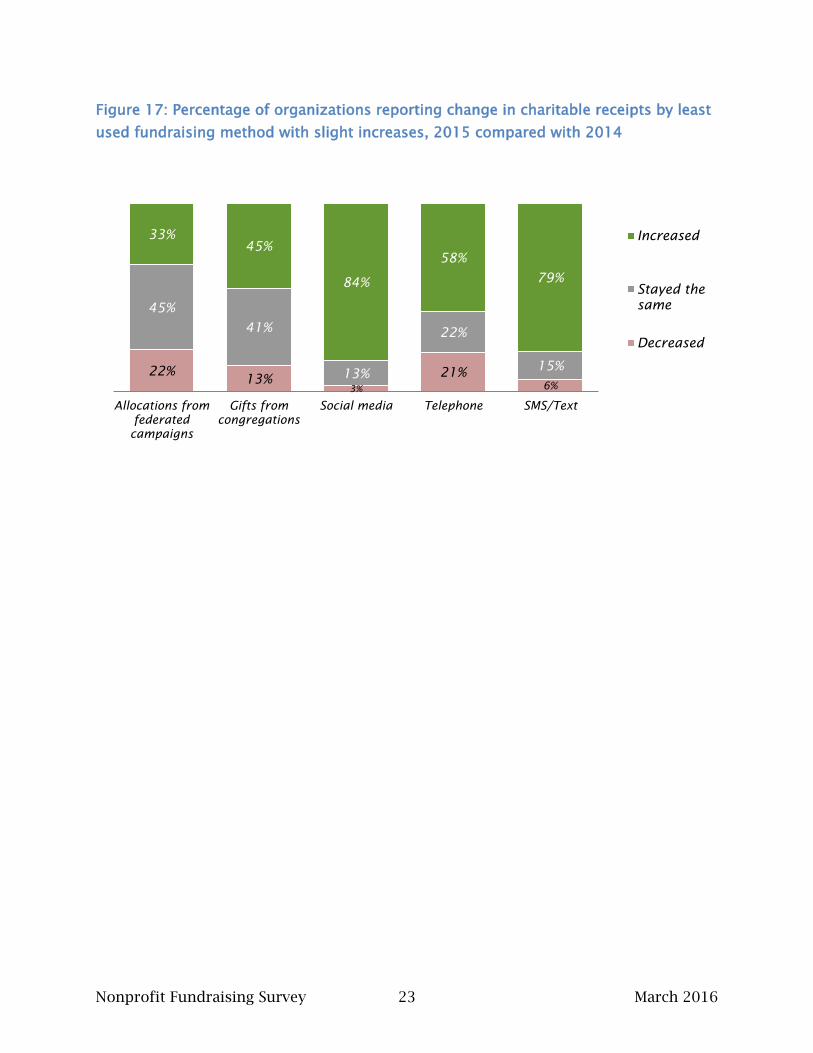
84% of responding organizations indicated growth in charitable gifts received
through social media, which is the highest percentage of any method.
However, still less than half (49%) of responding organizations used social
media as a fundraising method, up from 46 percent reported in 2014.
79% of organizations using the method reported increased gifts received
through SMS/text requests, which is 11 percentage points higher than the 68
percent in 2014. This is the greatest change of any method; it is also the least
used method, reported by just 10 percent of charities in this study.
45% of organizations that use the method reported increased gifts from
congregations in 2015, which is 9 percentage points higher than the 36
percent in 2014.
Nonprofit Fundraising Survey 23 March 2016
Figure 17: Percentage of organizations reporting change in charitable receipts by least
used fundraising method with slight increases, 2015 compared with 2014
22% 13%
3%
21%
6%
45%
41%
13%
22%
15%
33%
45%
84%
58%
79%
Allocations from
federated
campaigns
Gifts from
congregations
Social media Telephone SMS/Text
Increased
Stayed the
same
Decreased
Nonprofit Fundraising Survey 24 March 2016
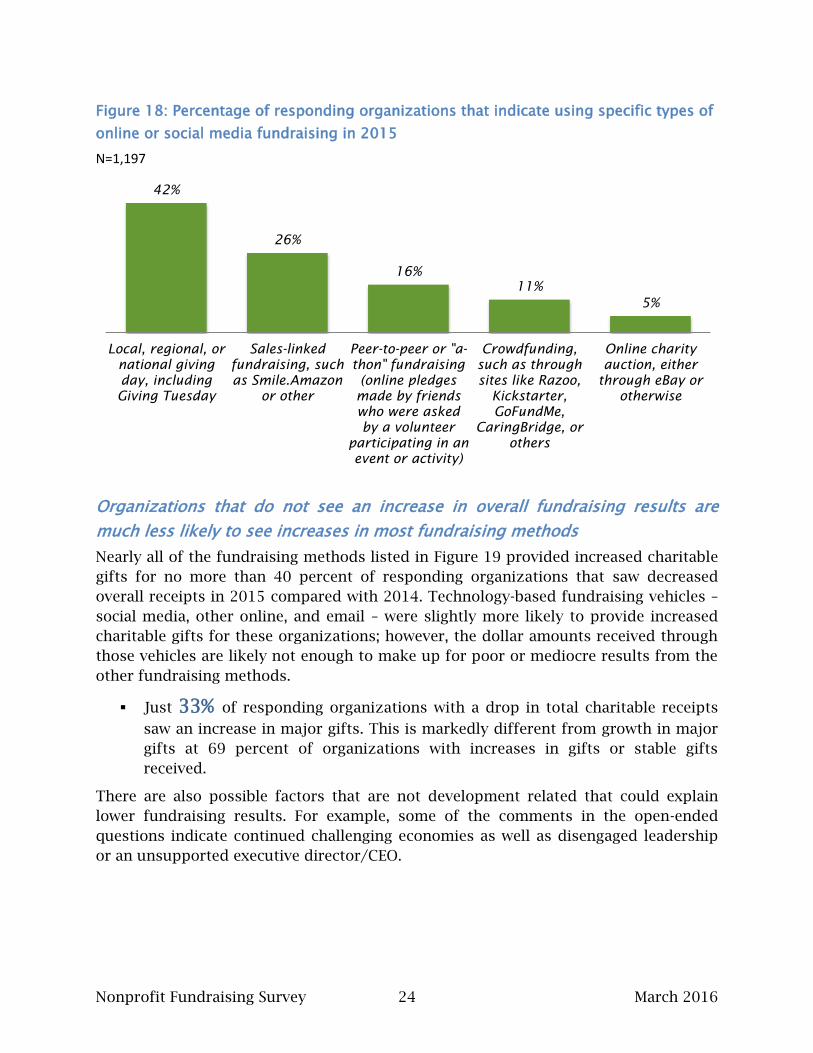
Figure 18: Percentage of responding organizations that indicate using specific types of
online or social media fundraising in 2015
N=1,197
Organizations that do not see an increase in overall fundraising results are
much less likely to see increases in most fundraising methods
Nearly all of the fundraising methods listed in Figure 19 provided increased charitable
gifts for no more than 40 percent of responding organizations that saw decreased
overall receipts in 2015 compared with 2014. Technology-based fundraising vehicles –
social media, other online, and email – were slightly more likely to provide increased
charitable gifts for these organizations; however, the dollar amounts received through
those vehicles are likely not enough to make up for poor or mediocre results from the
other fundraising methods.
Just 33% of responding organizations with a drop in total charitable receipts
saw an increase in major gifts. This is markedly different from growth in major
gifts at 69 percent of organizations with increases in gifts or stable gifts
received.
There are also possible factors that are not development related that could explain
lower fundraising results. For example, some of the comments in the open-ended
questions indicate continued challenging economies as well as disengaged leadership
or an unsupported executive director/CEO.
42%
26%
16%
11%
5%
Local, regional, or
national giving
day, including
Giving Tuesday
Sales-linked
fundraising, such
as Smile.Amazon
or other
Peer-to-peer or "a-
thon" fundraising
(online pledges
made by friends
who were asked
by a volunteer
participating in an
event or activity)
Crowdfunding,
such as through
sites like Razoo,
Kickstarter,
GoFundMe,
CaringBridge, or
others
Online charity
auction, either
through eBay or
otherwise
Nonprofit Fundraising Survey 25 March 2016
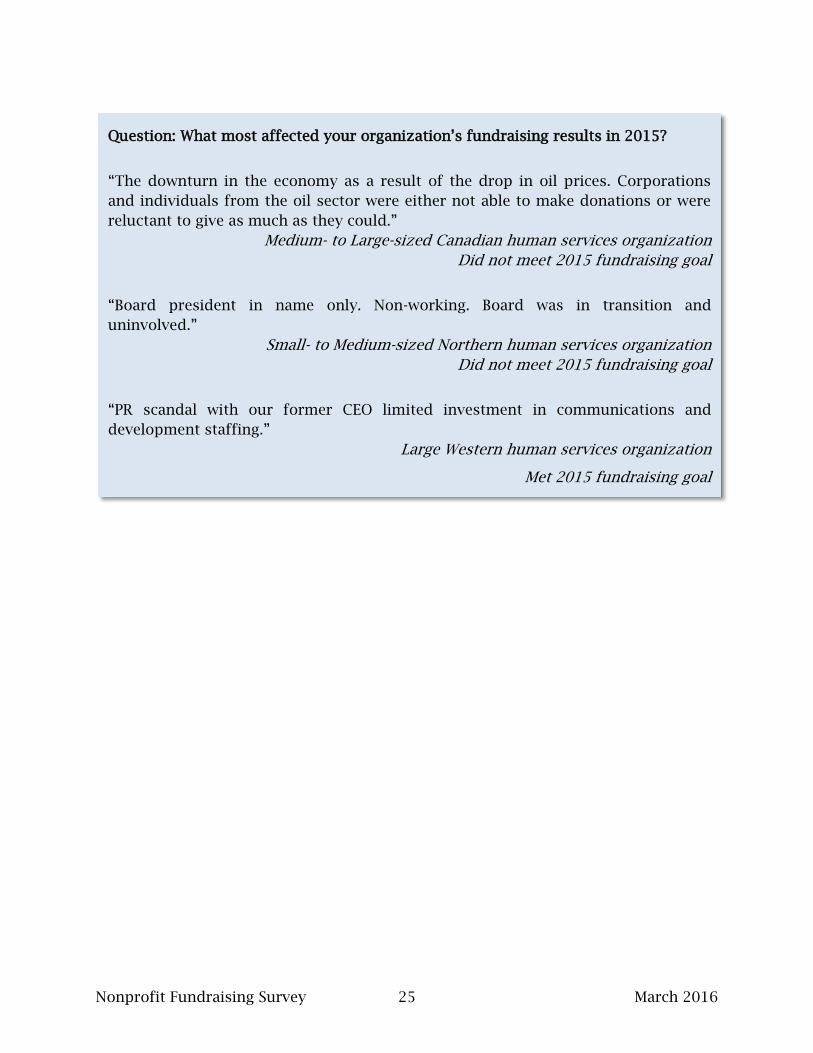
Question: What most affected your organization’s fundraising results in 2015?
“The downturn in the economy as a result of the drop in oil prices. Corporations
and individuals from the oil sector were either not able to make donations or were
reluctant to give as much as they could.”
Medium- to Large-sized Canadian human services organization
Did not meet 2015 fundraising goal
“Board president in name only. Non-working. Board was in transition and
uninvolved.”
Small- to Medium-sized Northern human services organization
Did not meet 2015 fundraising goal
“PR scandal with our former CEO limited investment in communications and
development staffing.”
Large Western human services organization
Met 2015 fundraising goal
Nonprofit Fundraising Survey 26 March 2016
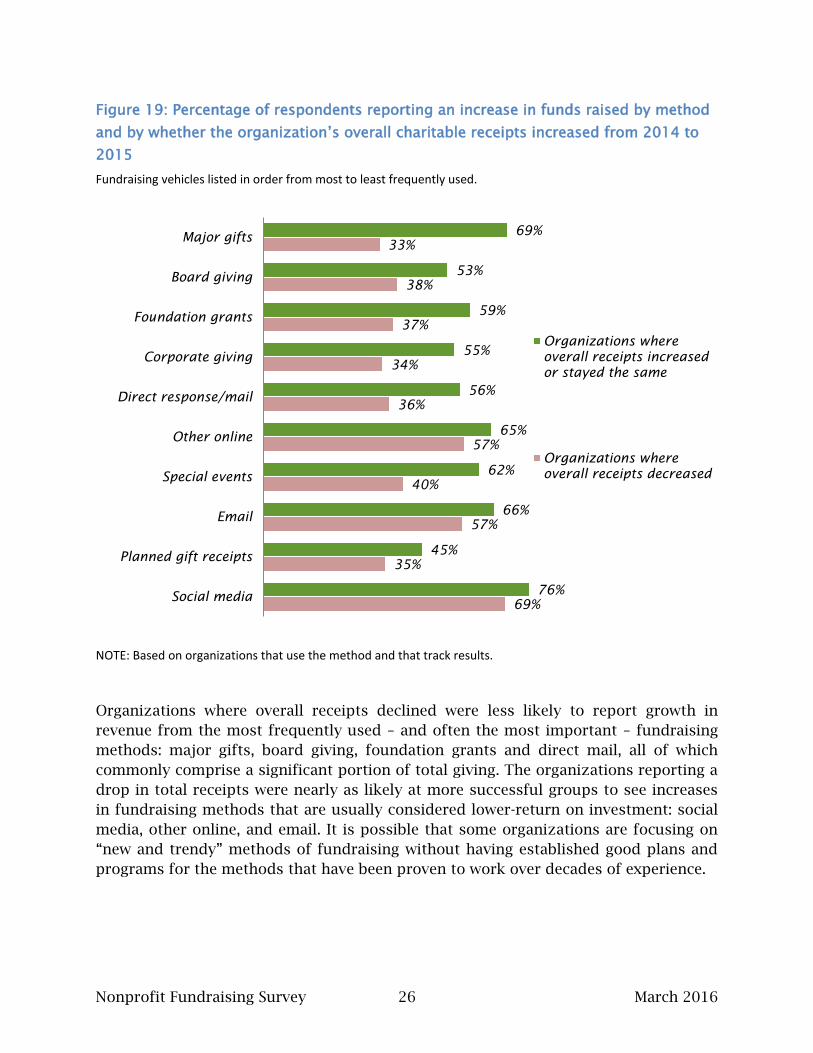
Figure 19: Percentage of respondents reporting an increase in funds raised by method
and by whether the organization’s overall charitable receipts increased from 2014 to
2015
Fundraising vehicles listed in order from most to least frequently used.
NOTE: Based on organizations that use the method and that track results.
Organizations where overall receipts declined were less likely to report growth in
revenue from the most frequently used – and often the most important – fundraising
methods: major gifts, board giving, foundation grants and direct mail, all of which
commonly comprise a significant portion of total giving. The organizations reporting a
drop in total receipts were nearly as likely at more successful groups to see increases
in fundraising methods that are usually considered lower-return on investment: social
media, other online, and email. It is possible that some organizations are focusing on
“new and trendy” methods of fundraising without having established good plans and
programs for the methods that have been proven to work over decades of experience.
69%
35%
57%
40%
57%
36%
34%
37%
38%
33%
76%
45%
66%
62%
65%
56%
55%
59%
53%
69%
Social media
Planned gift receipts
Special events
Other online
Direct response/mail
Corporate giving
Foundation grants
Board giving
Major gifts
Organizations where
overall receipts increased
or stayed the same
Organizations where
overall receipts decreased
Nonprofit Fundraising Survey 27 March 2016
SECTION III: TRENDS SINCE 2005
The Association of Fundraising Professionals (AFP) began conducting surveys in 2002
to track the impact of economic changes on charitable receipts. The Nonprofit
Research Collaborative started asking questions similar to AFP’s in 2010. This year’s
overall results are followed by trends for fundraising methods used, grouped by like
methods and in order of most to least frequently used.
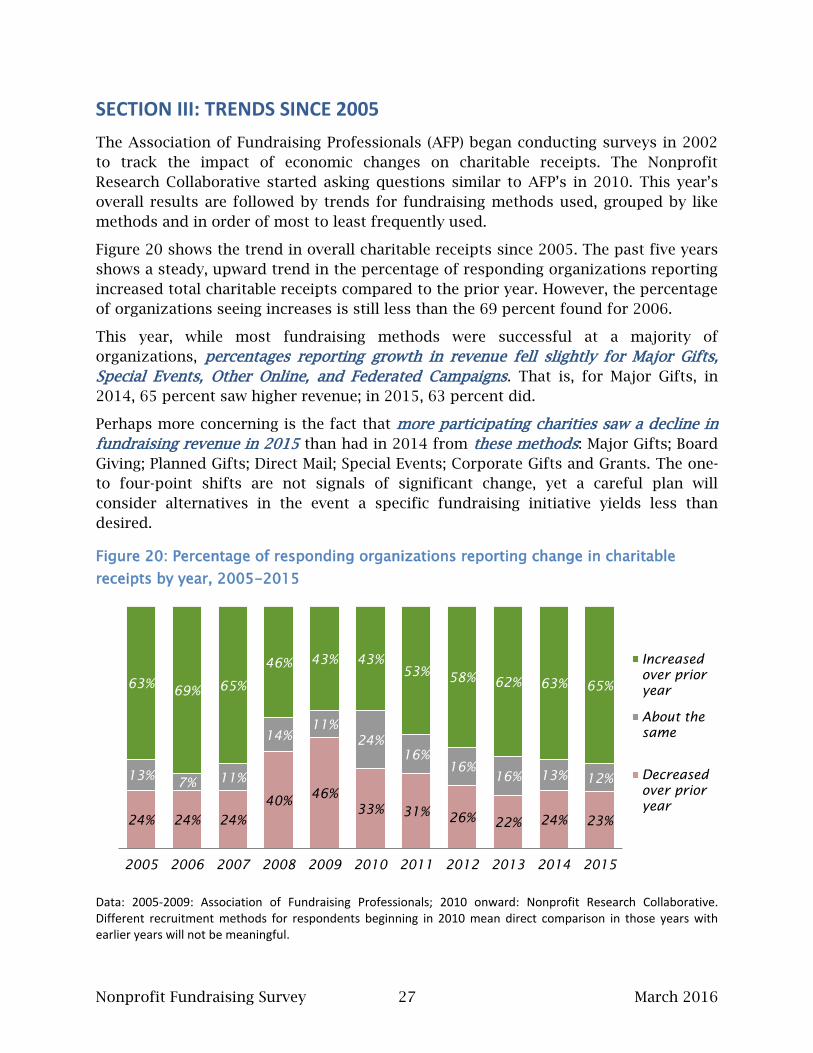
Figure 20 shows the trend in overall charitable receipts since 2005. The past five years
shows a steady, upward trend in the percentage of responding organizations reporting
increased total charitable receipts compared to the prior year. However, the percentage
of organizations seeing increases is still less than the 69 percent found for 2006.
This year, while most fundraising methods were successful at a majority of
organizations, percentages reporting growth in revenue fell slightly for Major Gifts,
Special Events, Other Online, and Federated Campaigns. That is, for Major Gifts, in
2014, 65 percent saw higher revenue; in 2015, 63 percent did.
Perhaps more concerning is the fact that more participating charities saw a decline in
fundraising revenue in 2015 than had in 2014 from these methods: Major Gifts; Board
Giving; Planned Gifts; Direct Mail; Special Events; Corporate Gifts and Grants. The one-
to four-point shifts are not signals of significant change, yet a careful plan will
consider alternatives in the event a specific fundraising initiative yields less than
desired.
Figure 20: Percentage of responding organizations reporting change in charitable
receipts by year, 2005-2015
Data: 2005-2009: Association of Fundraising Professionals; 2010 onward: Nonprofit Research Collaborative. Different recruitment methods for respondents beginning in 2010 mean direct comparison in those years with earlier years will not be meaningful.
24% 24% 24%
40% 46%
33% 31% 26%
22% 24% 23%
13% 7%
11%
14%
11%
24%
16%
16%
16% 13% 12%
63% 69%
65%
46% 43% 43%
53% 58%
62% 63% 65%
2005 2006 2007 2008 2009 2010 2011 2012 2013 2014 2015
Increased
over prior
year
About the
same
Decreased
over prior
year
Nonprofit Fundraising Survey 28 March 2016
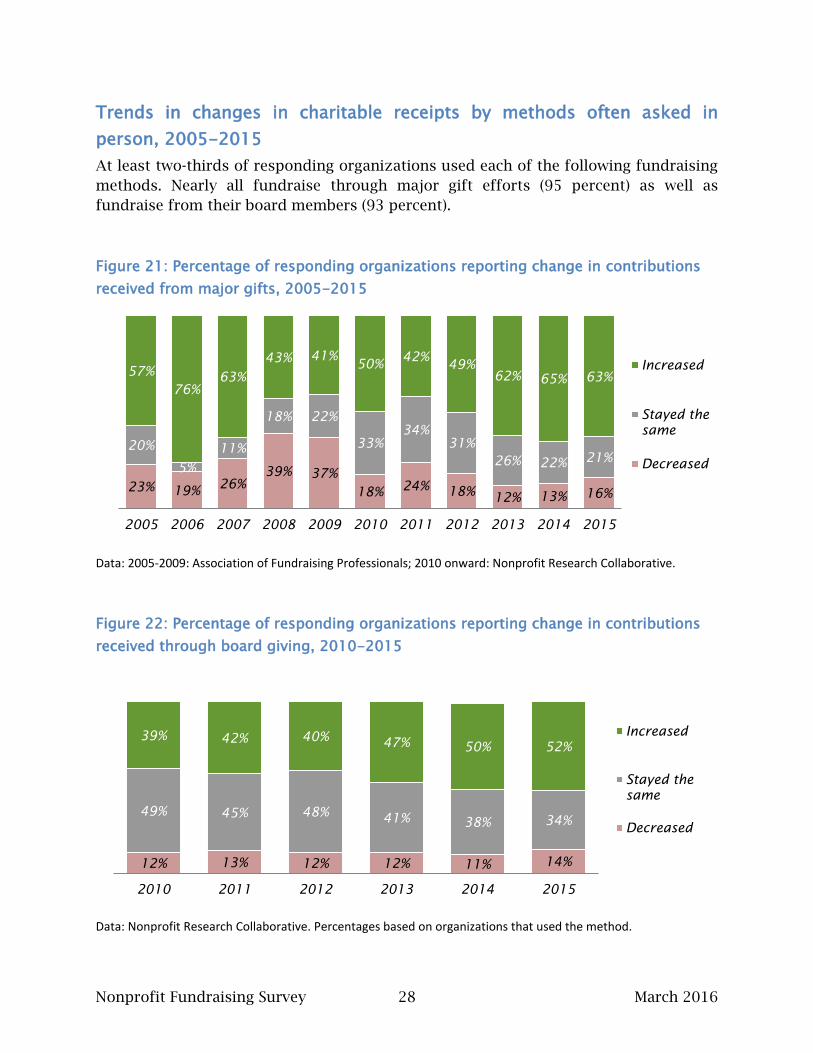
Trends in changes in charitable receipts by methods often asked in
person, 2005-2015
At least two-thirds of responding organizations used each of the following fundraising
methods. Nearly all fundraise through major gift efforts (95 percent) as well as
fundraise from their board members (93 percent).
Figure 21: Percentage of responding organizations reporting change in contributions
received from major gifts, 2005-2015
Data: 2005-2009: Association of Fundraising Professionals; 2010 onward: Nonprofit Research Collaborative.
Figure 22: Percentage of responding organizations reporting change in contributions
received through board giving, 2010-2015
Data: Nonprofit Research Collaborative. Percentages based on organizations that used the method.
23% 19%
26%
39% 37%
18% 24%
18% 12% 13% 16%
20%
5%
11%
18% 22%
33%
34%
31%
26% 22% 21%
57%
76%
63%
43% 41% 50%
42% 49%
62% 65% 63%
2005 2006 2007 2008 2009 2010 2011 2012 2013 2014 2015
Increased
Stayed the
same
Decreased
12% 13% 12% 12% 11% 14%
49% 45% 48% 41%
38% 34%
39% 42% 40% 47%
50% 52%
2010 2011 2012 2013 2014 2015
Increased
Stayed the
same
Decreased
Nonprofit Fundraising Survey 29 March 2016
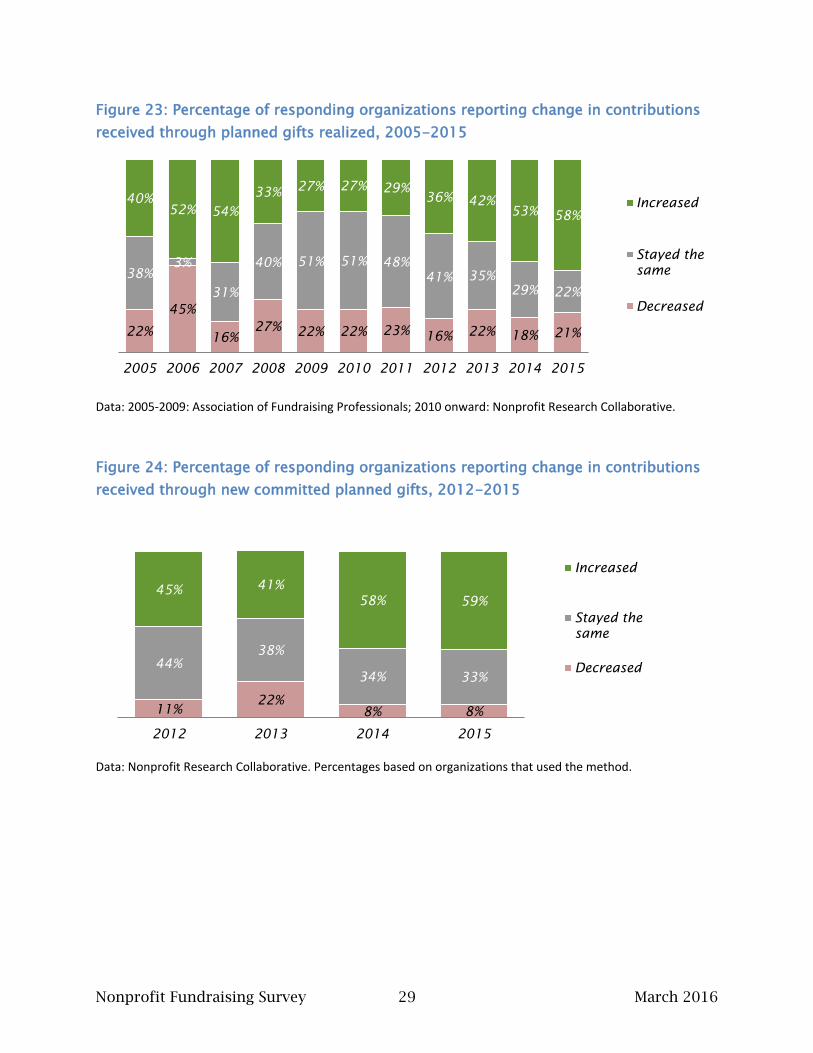
Figure 23: Percentage of responding organizations reporting change in contributions
received through planned gifts realized, 2005-2015
Data: 2005-2009: Association of Fundraising Professionals; 2010 onward: Nonprofit Research Collaborative.
Figure 24: Percentage of responding organizations reporting change in contributions
received through new committed planned gifts, 2012-2015
Data: Nonprofit Research Collaborative. Percentages based on organizations that used the method.
22%
45%
16%
27% 22% 22% 23%
16% 22%
18% 21%
38%
3%
31%
40% 51% 51% 48%
41% 35%
29% 22%
40%
52% 54%
33% 27% 27% 29%
36% 42%
53% 58%
2005 2006 2007 2008 2009 2010 2011 2012 2013 2014 2015
Increased
Stayed the
same
Decreased
11% 22%
8% 8%
44%
38%
34% 33%
45% 41%
58% 59%
2012 2013 2014 2015
Increased
Stayed the
same
Decreased
Nonprofit Fundraising Survey 30 March 2016
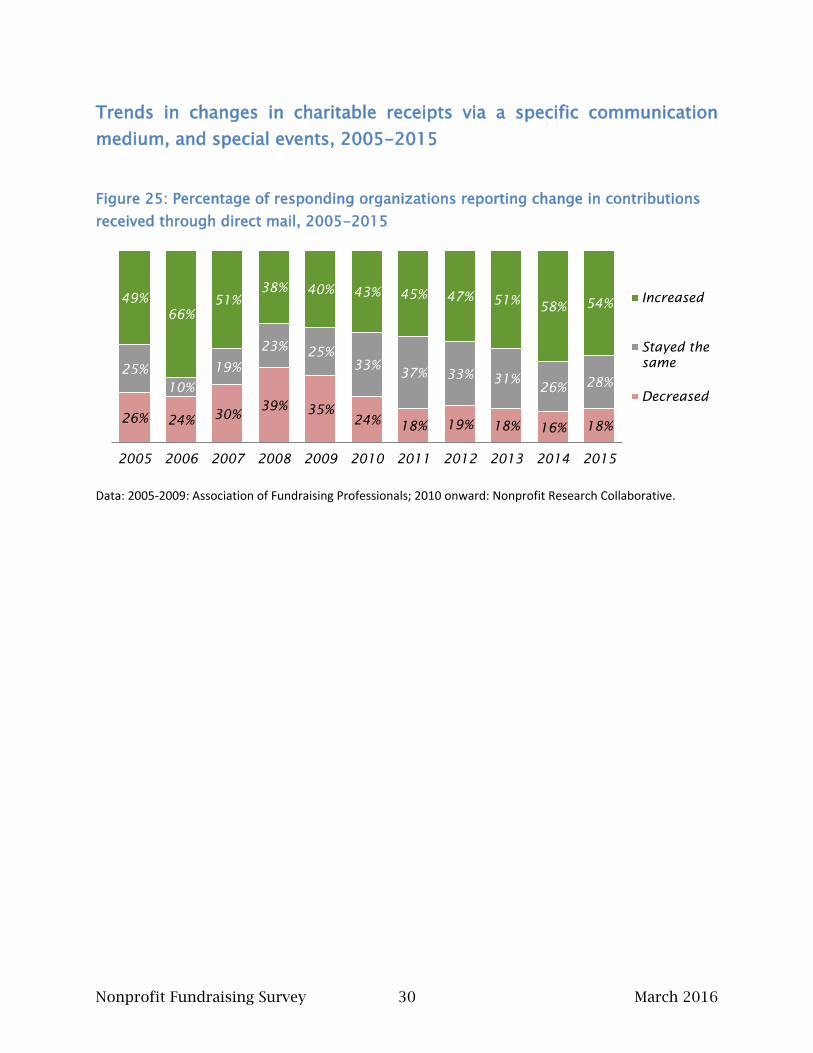
Trends in changes in charitable receipts via a specific communication
medium, and special events, 2005-2015
Figure 25: Percentage of responding organizations reporting change in contributions
received through direct mail, 2005-2015
Data: 2005-2009: Association of Fundraising Professionals; 2010 onward: Nonprofit Research Collaborative.
26% 24% 30%
39% 35%
24% 18% 19% 18% 16% 18%
25%
10%
19%
23% 25%
33% 37% 33%
31% 26%
28%
49%
66%
51%
38% 40% 43% 45% 47% 51% 58% 54%
2005 2006 2007 2008 2009 2010 2011 2012 2013 2014 2015
Increased
Stayed the
same
Decreased
Nonprofit Fundraising Survey 31 March 2016
Figure 26: Percentage of responding organizations reporting change in contributions
received by other online, 2005-2015
Data: 2005-2009: Association of Fundraising Professionals; 2010 onward: Nonprofit Research Collaborative.
Figure 27: Percentage of responding organizations reporting change in contributions
received through special events, 2005-2015
Data: 2005-2009: Association of Fundraising Professionals; 2010 onward: Nonprofit Research Collaborative.
12% 7% 11% 14%
9% 8% 7% 6% 5% 3% 3%
33%
5%
28%
33%
31% 34% 34% 34% 27%
26% 26%
55%
88%
61% 53%
60% 58% 59% 60% 68% 71% 70%
2005 2006 2007 2008 2009 2010 2011 2012 2013 2014 2015
Increased
Stayed the
same
Decreased
23% 17%
24% 33%
40%
22% 27%
18% 20% 17% 22%
22%
9%
19%
24%
27%
27%
27%
28% 18% 23%
20%
55%
74%
57%
43%
33%
50% 45%
53% 62% 60% 58%
2005 2006 2007 2008 2009 2010 2011 2012 2013 2014 2015
Increased
Stayed the
same
Decreased
Nonprofit Fundraising Survey 32 March 2016
Figure 28: Percentage of responding organizations reporting change in contributions
received through telephone appeals, 2005-2015
Data: 2005-2009: Association of Fundraising Professionals; 2010 onward: Nonprofit Research Collaborative.
23% 24% 26% 20% 20% 20%
12% 17%
22% 18% 21%
27%
11%
28% 49%
64% 54%
61%
41% 35%
26% 22%
50%
65%
46%
31%
16% 24% 26%
41% 43%
56% 58%
2005 2006 2007 2008 2009 2010 2011 2012 2013 2014 2015
Increased
Stayed the
same
Decreased
Nonprofit Fundraising Survey 33 March 2016
Trends in changes in charitable receipts from institutional donors, 2005-
2015
Figure 29: Percentage of responding organizations reporting change in contributions
received through foundation grantmaking, 2010-2015
Data: Nonprofit Research Collaborative. Percentages based on organizations that used the method.
Figure 30: Percentage of responding organizations reporting change in contributions
received through corporate giving and corporate foundation grantmaking, 2010-2015
Data: Nonprofit Research Collaborative. Percentages based on organizations that used the method.
27% 22%
11% 17% 15% 15%
33% 36%
44% 33% 32% 30%
40% 42% 44% 50% 53% 55%
2010 2011 2012 2013 2014 2015
Increased
Stayed the
same
Decreased
22% 19% 17% 14% 17%
44% 42%
36% 33% 28%
34% 39%
47% 53% 55%
2010 2011 2012 2013 2014 2015
Increased
Stayed the
same
Decreased
No data
Nonprofit Fundraising Survey 34 March 2016
Figure 31: Percentage of responding organizations reporting change in contributions
received through federated campaigns, 2011-2015
Data: Nonprofit Research Collaborative. Percentages based on organizations that used the method.
Figure 32: Percentage of responding organizations reporting change in contributions
received from congregations, 2011-2015
Data: Nonprofit Research Collaborative. Percentages based on organizations that used the method.
21% 21% 27%
18% 22%
58% 55% 52%
48% 45%
21% 25% 21%
34% 33%
2011 2012 2013 2014 2015
Increased
Stayed the
same
Decreased
17% 16% 18% 18% 13%
63% 59% 57%
46%
41%
20% 23% 25%
36% 45%
2011 2012 2013 2014 2015
Increased
Stayed the
same
Decreased
Nonprofit Fundraising Survey 35 March 2016
SECTION IV: SPECIAL SECTION ON BEQUESTS
The Nonprofit Research Collaborative (NRC) asked several questions about bequests,
including how many organizations received gifts through bequests and average
amount of bequests. This section summarizes findings about bequests.
More than 2/3rds of organizations raise funds with bequests
Of all survey respondents, 68 percent reported either bequests or new commitments
for planned gifts (see Figure 14).
58% of responding organizations reported increased planned gift receipts in
2015, which is the highest in our decade of trends.
45% of responding organizations with increased fundraising results overall saw
increases in planned giving receipts.
By contrast among organizations that had a decline in total receipts, just 35%saw increases in planned giving receipts.
This wave of the Nonprofit Fundraising Survey asked additional questions about the
amounts received from estates in 2015. For this group of questions, 760 survey
participants responded, and half of those reported receiving bequest dollars in 2015.
The balance of this section explores more thoroughly the data about bequests
provided in that section of the survey.
Nonprofit Fundraising Survey 36 March 2016
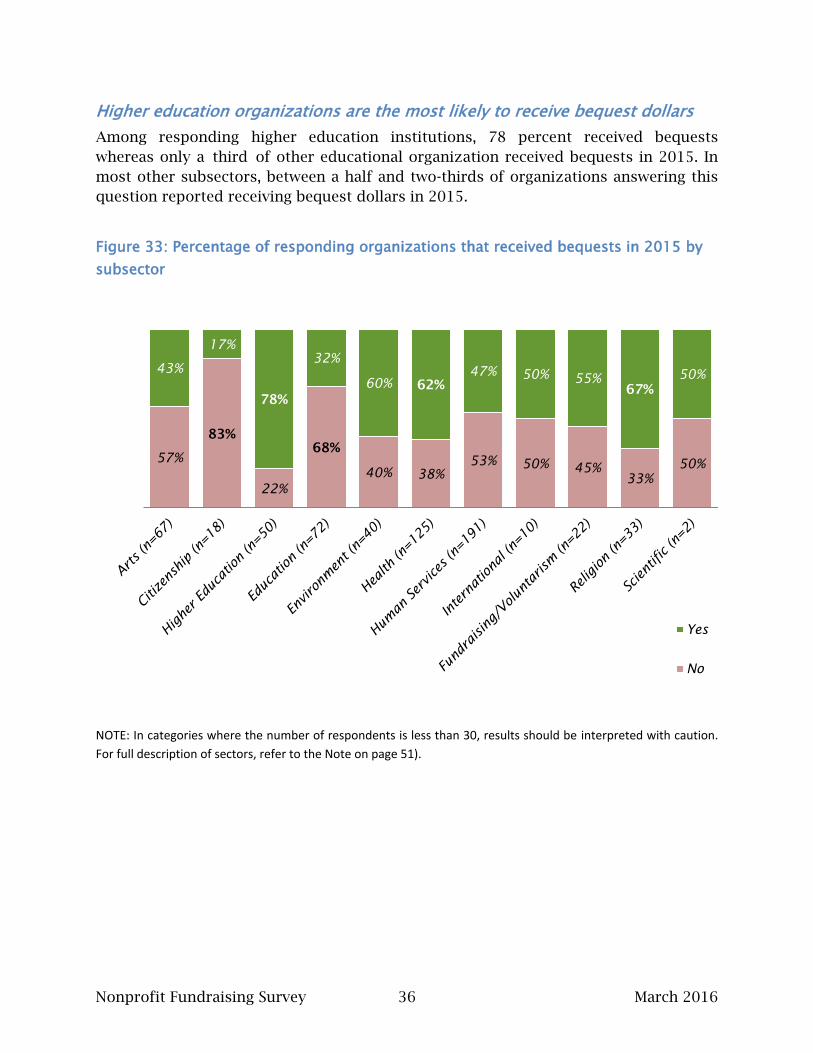
Higher education organizations are the most likely to receive bequest dollars
Among responding higher education institutions, 78 percent received bequests
whereas only a third of other educational organization received bequests in 2015. In
most other subsectors, between a half and two-thirds of organizations answering this
question reported receiving bequest dollars in 2015.
Figure 33: Percentage of responding organizations that received bequests in 2015 by
subsector
NOTE: In categories where the number of respondents is less than 30, results should be interpreted with caution.
For full description of sectors, refer to the Note on page 51).
57%
83%
22%
68%
40% 38%
53% 50% 45%
33%
50%
43%
17%
78%
32%
60% 62%
47% 50% 55%
67%
50%
Yes
No
Nonprofit Fundraising Survey 37 March 2016
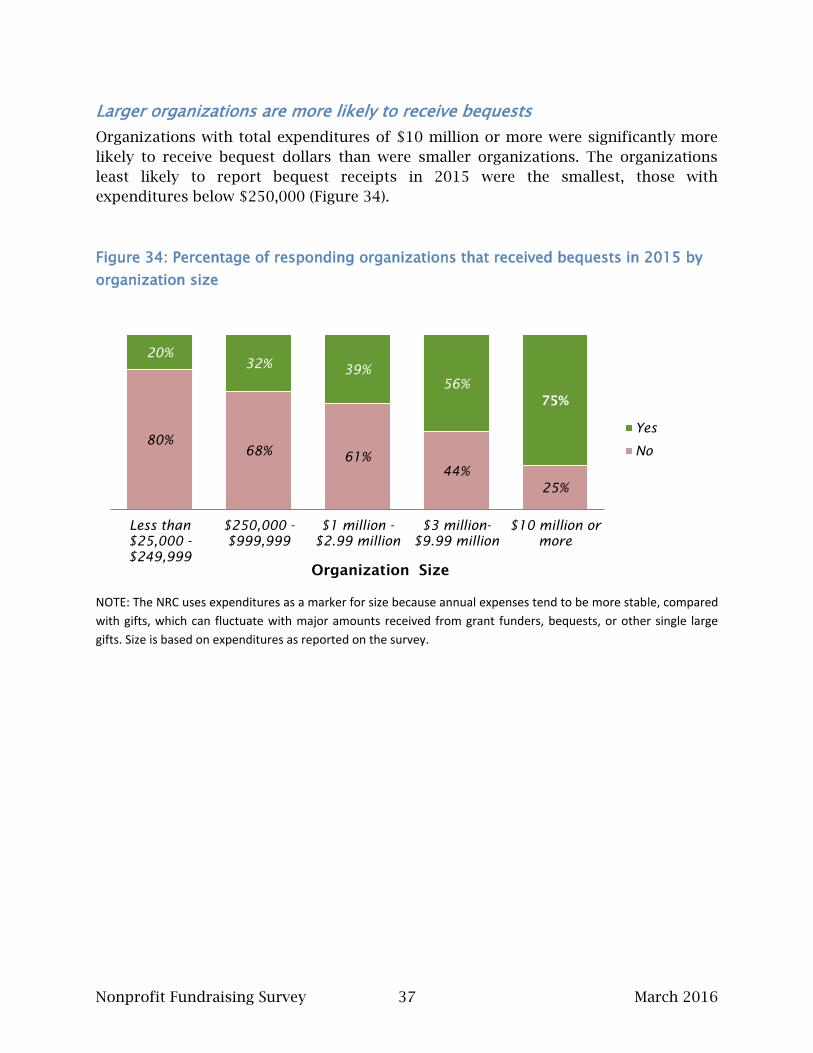
Larger organizations are more likely to receive bequests
Organizations with total expenditures of $10 million or more were significantly more
likely to receive bequest dollars than were smaller organizations. The organizations
least likely to report bequest receipts in 2015 were the smallest, those with
expenditures below $250,000 (Figure 34).
Figure 34: Percentage of responding organizations that received bequests in 2015 by
organization size
NOTE: The NRC uses expenditures as a marker for size because annual expenses tend to be more stable, compared
with gifts, which can fluctuate with major amounts received from grant funders, bequests, or other single large
gifts. Size is based on expenditures as reported on the survey.
80%
68% 61%
44%
25%
20%
32% 39%
56%
75%
Less than
$25,000 -
$249,999
$250,000 -
$999,999
$1 million -
$2.99 million
$3 million-
$9.99 million
$10 million or
more
Yes
No
Organization Size
Nonprofit Fundraising Survey 38 March 2016
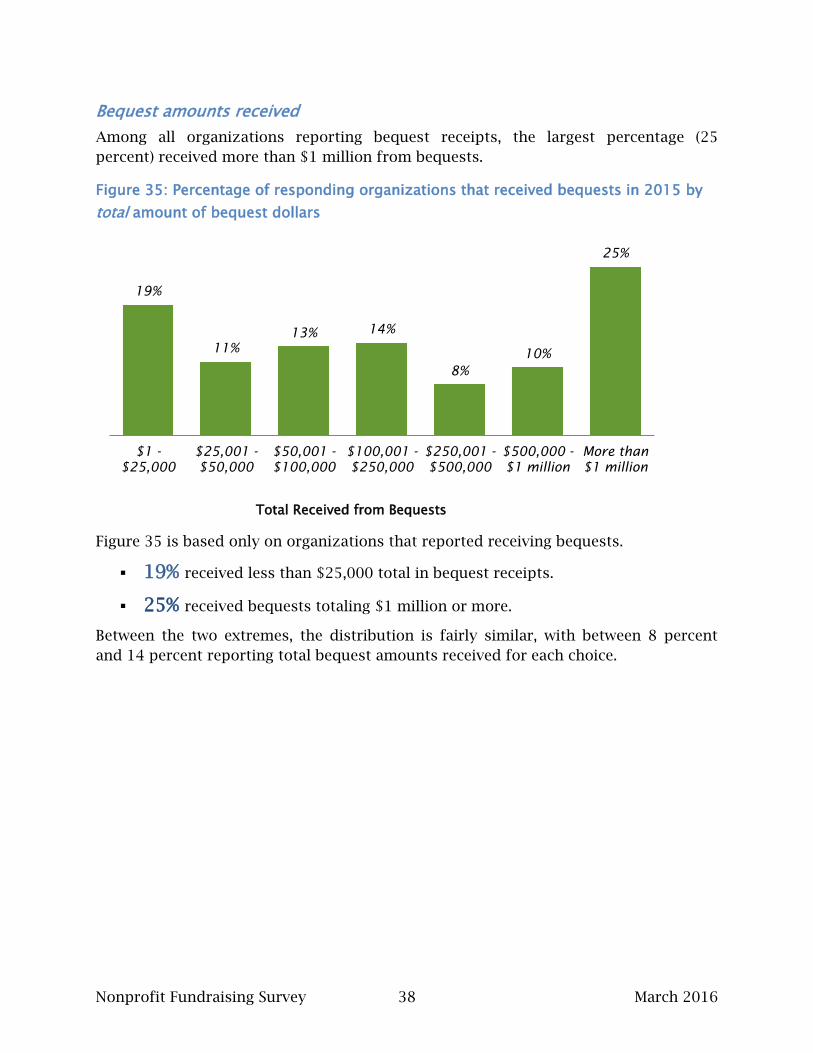
Bequest amounts received
Among all organizations reporting bequest receipts, the largest percentage (25
percent) received more than $1 million from bequests.
Figure 35: Percentage of responding organizations that received bequests in 2015 by
total amount of bequest dollars
Figure 35 is based only on organizations that reported receiving bequests.
19% received less than $25,000 total in bequest receipts.
25% received bequests totaling $1 million or more.
Between the two extremes, the distribution is fairly similar, with between 8 percent
and 14 percent reporting total bequest amounts received for each choice.
19%
11%
13% 14%
8%
10%
25%
$1 -
$25,000
$25,001 -
$50,000
$50,001 -
$100,000
$100,001 -
$250,000
$250,001 -
$500,000
$500,000 -
$1 million
More than
$1 million
Total Received from Bequests
Nonprofit Fundraising Survey 39 March 2016
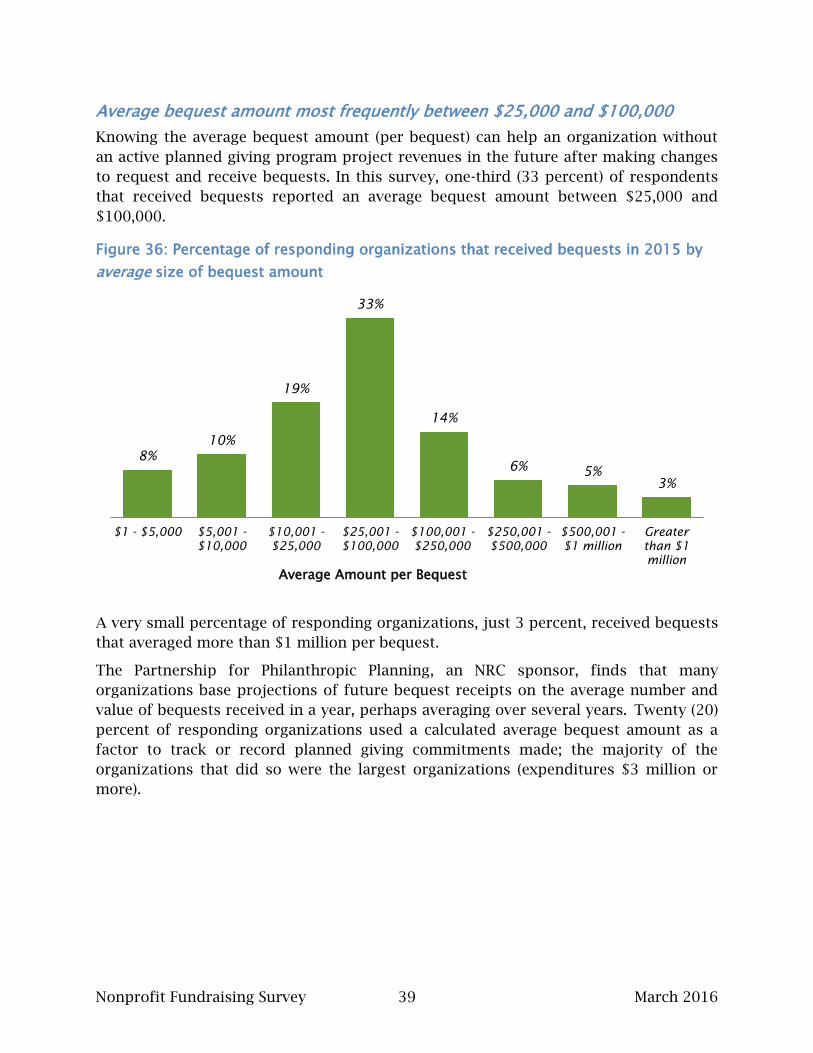
Average bequest amount most frequently between $25,000 and $100,000
Knowing the average bequest amount (per bequest) can help an organization without
an active planned giving program project revenues in the future after making changes
to request and receive bequests. In this survey, one-third (33 percent) of respondents
that received bequests reported an average bequest amount between $25,000 and
$100,000.
Figure 36: Percentage of responding organizations that received bequests in 2015 by
average size of bequest amount
A very small percentage of responding organizations, just 3 percent, received bequests
that averaged more than $1 million per bequest.
The Partnership for Philanthropic Planning, an NRC sponsor, finds that many
organizations base projections of future bequest receipts on the average number and
value of bequests received in a year, perhaps averaging over several years. Twenty (20)
percent of responding organizations used a calculated average bequest amount as a
factor to track or record planned giving commitments made; the majority of the
organizations that did so were the largest organizations (expenditures $3 million or
more).
8%
10%
19%
33%
14%
6% 5%
3%
$1 - $5,000 $5,001 -
$10,000
$10,001 -
$25,000
$25,001 -
$100,000
$100,001 -
$250,000
$250,001 -
$500,000
$500,001 -
$1 million
Greater
than $1
million
Average Amount per Bequest
Nonprofit Fundraising Survey 40 March 2016
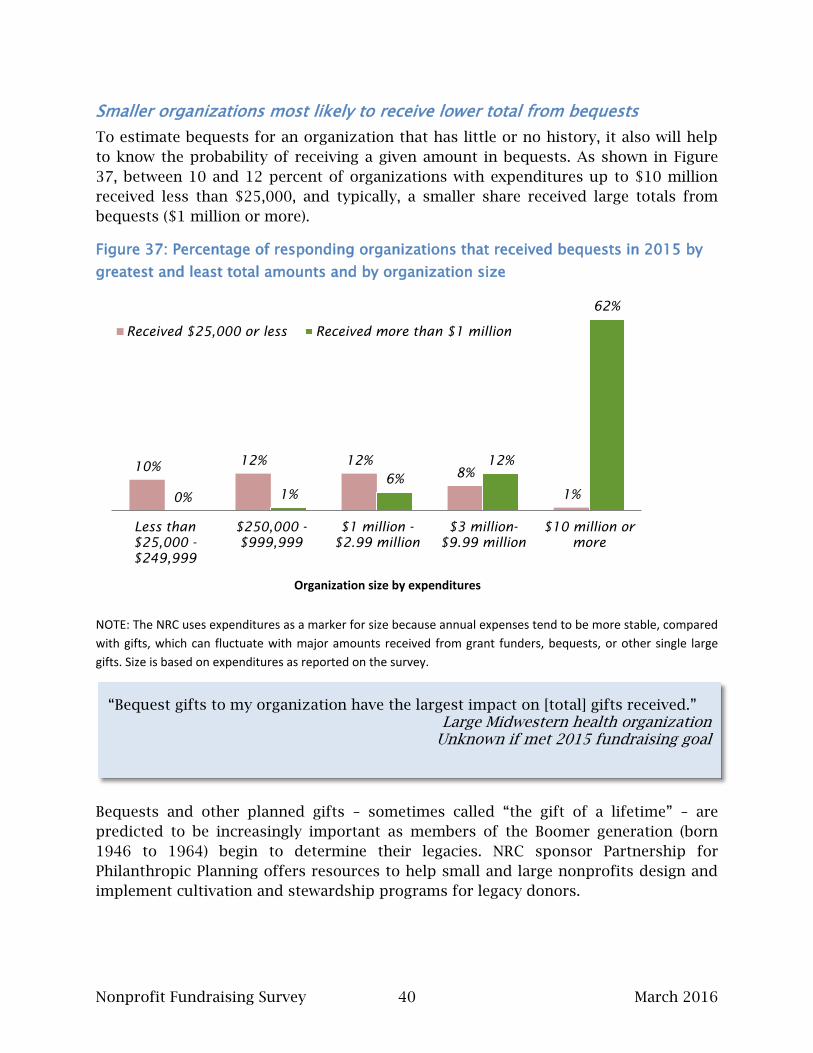
Smaller organizations most likely to receive lower total from bequests
To estimate bequests for an organization that has little or no history, it also will help
to know the probability of receiving a given amount in bequests. As shown in Figure
37, between 10 and 12 percent of organizations with expenditures up to $10 million
received less than $25,000, and typically, a smaller share received large totals from
bequests ($1 million or more).
Figure 37: Percentage of responding organizations that received bequests in 2015 by
greatest and least total amounts and by organization size
NOTE: The NRC uses expenditures as a marker for size because annual expenses tend to be more stable, compared
with gifts, which can fluctuate with major amounts received from grant funders, bequests, or other single large
gifts. Size is based on expenditures as reported on the survey.
Bequests and other planned gifts – sometimes called “the gift of a lifetime” – are
predicted to be increasingly important as members of the Boomer generation (born
1946 to 1964) begin to determine their legacies. NRC sponsor Partnership for
Philanthropic Planning offers resources to help small and large nonprofits design and
implement cultivation and stewardship programs for legacy donors.
10% 12% 12%
8%
1% 0% 1%
6%
12%
62%
Less than
$25,000 -
$249,999
$250,000 -
$999,999
$1 million -
$2.99 million
$3 million-
$9.99 million
$10 million or
more
Received $25,000 or less Received more than $1 million
“Bequest gifts to my organization have the largest impact on [total] gifts received.” Large Midwestern health organization
Unknown if met 2015 fundraising goal
Organization size by expenditures
Nonprofit Fundraising Survey 41 March 2016
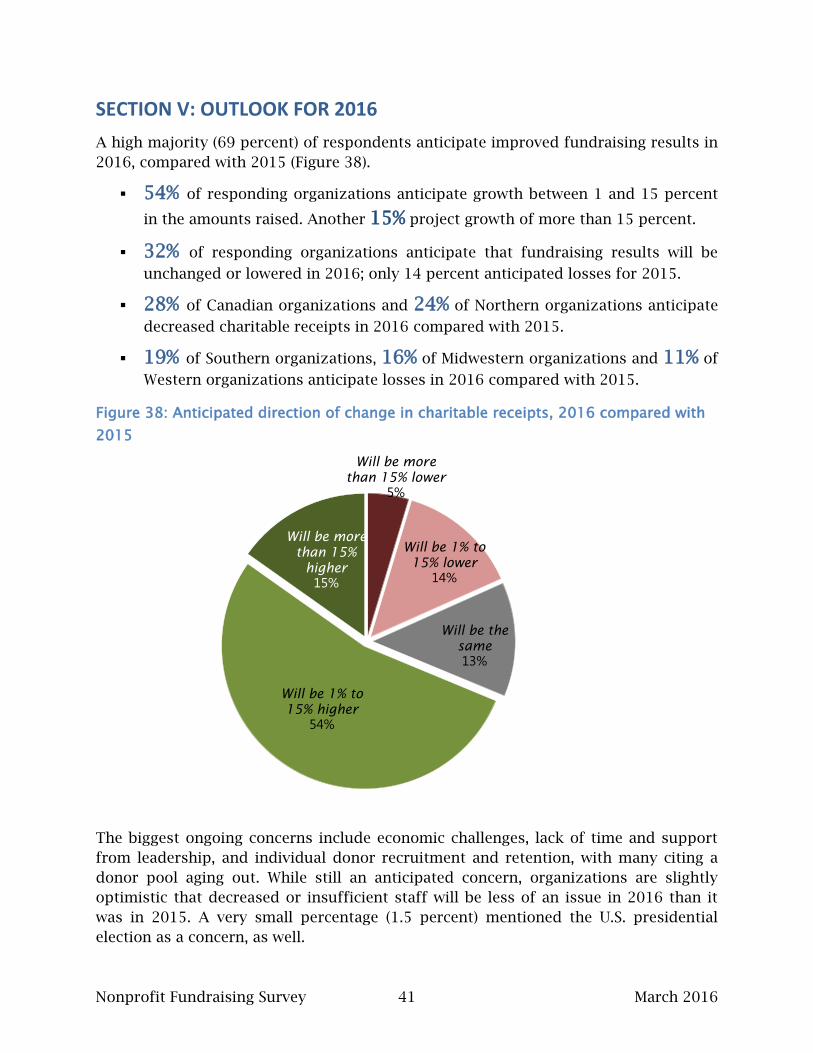
SECTION V: OUTLOOK FOR 2016
A high majority (69 percent) of respondents anticipate improved fundraising results in
2016, compared with 2015 (Figure 38).
54% of responding organizations anticipate growth between 1 and 15 percent
in the amounts raised. Another 15% project growth of more than 15 percent.
32% of responding organizations anticipate that fundraising results will be
unchanged or lowered in 2016; only 14 percent anticipated losses for 2015.
28% of Canadian organizations and 24% of Northern organizations anticipate
decreased charitable receipts in 2016 compared with 2015.
19% of Southern organizations, 16% of Midwestern organizations and 11% of
Western organizations anticipate losses in 2016 compared with 2015.
Figure 38: Anticipated direction of change in charitable receipts, 2016 compared with
2015
The biggest ongoing concerns include economic challenges, lack of time and support
from leadership, and individual donor recruitment and retention, with many citing a
donor pool aging out. While still an anticipated concern, organizations are slightly
optimistic that decreased or insufficient staff will be less of an issue in 2016 than it
was in 2015. A very small percentage (1.5 percent) mentioned the U.S. presidential
election as a concern, as well.
Will be more
than 15% lower
5%
Will be 1% to
15% lower
14%
Will be the
same
13%
Will be 1% to
15% higher
54%
Will be more
than 15%
higher
15%
Nonprofit Fundraising Survey 42 March 2016
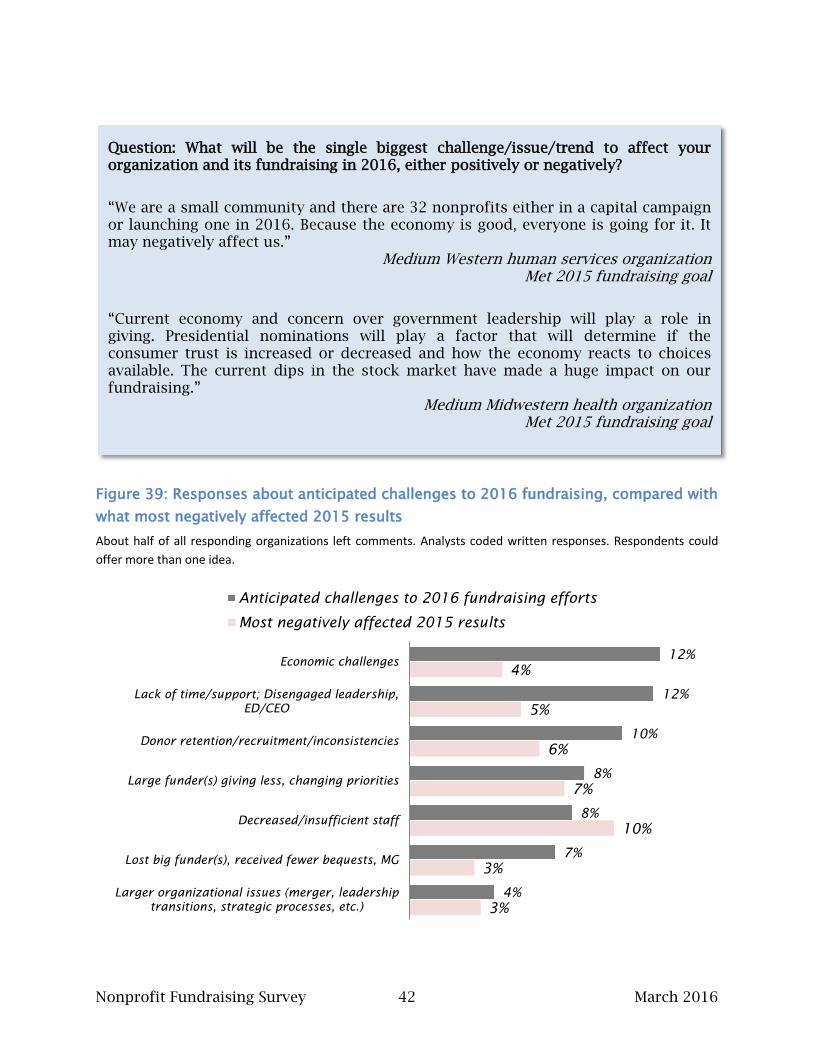
Figure 39: Responses about anticipated challenges to 2016 fundraising, compared with
what most negatively affected 2015 results
About half of all responding organizations left comments. Analysts coded written responses. Respondents could
offer more than one idea.
3%
3%
10%
7%
6%
5%
4%
4%
7%
8%
8%
10%
12%
12%
Larger organizational issues (merger, leadership
transitions, strategic processes, etc.)
Lost big funder(s), received fewer bequests, MG
Decreased/insufficient staff
Large funder(s) giving less, changing priorities
Donor retention/recruitment/inconsistencies
Lack of time/support; Disengaged leadership,
ED/CEO
Economic challenges
Anticipated challenges to 2016 fundraising efforts
Most negatively affected 2015 results
Question: What will be the single biggest challenge/issue/trend to affect your organization and its fundraising in 2016, either positively or negatively?
“We are a small community and there are 32 nonprofits either in a capital campaign or launching one in 2016. Because the economy is good, everyone is going for it. It may negatively affect us.”
Medium Western human services organization Met 2015 fundraising goal
“Current economy and concern over government leadership will play a role in giving. Presidential nominations will play a factor that will determine if the consumer trust is increased or decreased and how the economy reacts to choices available. The current dips in the stock market have made a huge impact on our fundraising.”
Medium Midwestern health organization Met 2015 fundraising goal
Nonprofit Fundraising Survey 43 March 2016
For the most part, more respondents project challenges in 2016 from issues that
negatively affected fundraising results in 2015. The area of most concern – and the
area with the largest change from 2015 actual impact to projected 2016 impact, is the
economy (Figure 39).
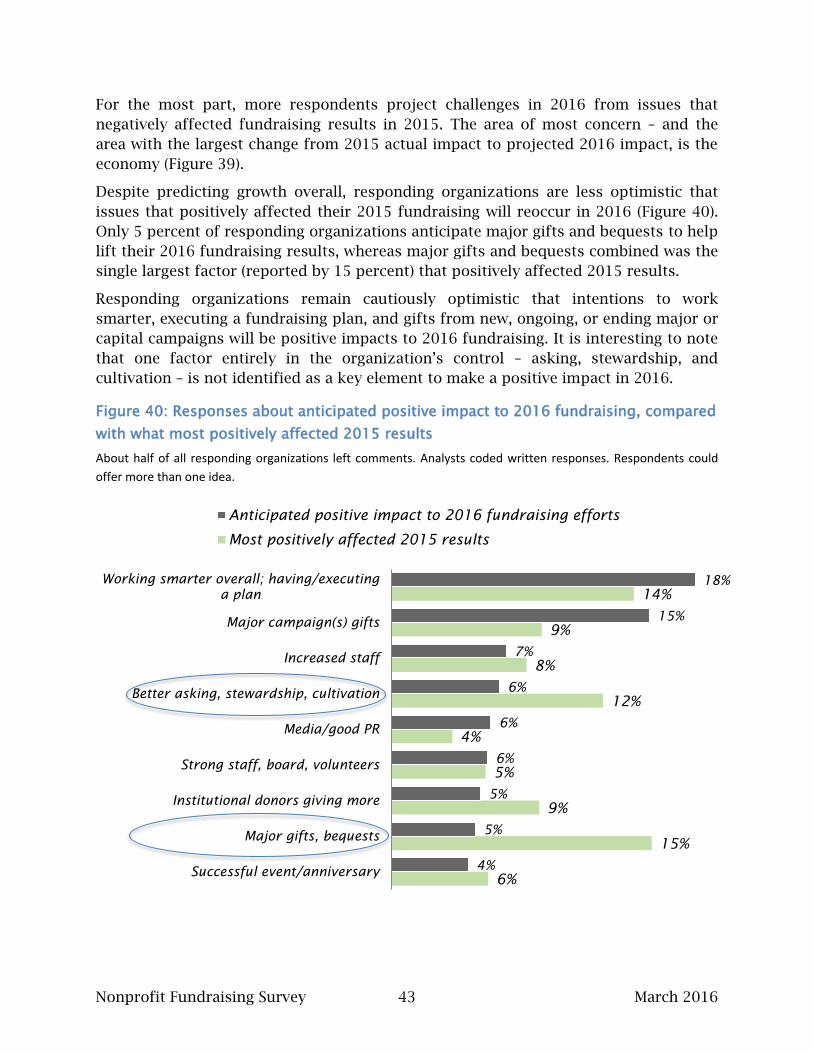
Despite predicting growth overall, responding organizations are less optimistic that
issues that positively affected their 2015 fundraising will reoccur in 2016 (Figure 40).
Only 5 percent of responding organizations anticipate major gifts and bequests to help
lift their 2016 fundraising results, whereas major gifts and bequests combined was the
single largest factor (reported by 15 percent) that positively affected 2015 results.
Responding organizations remain cautiously optimistic that intentions to work
smarter, executing a fundraising plan, and gifts from new, ongoing, or ending major or
capital campaigns will be positive impacts to 2016 fundraising. It is interesting to note
that one factor entirely in the organization’s control – asking, stewardship, and
cultivation – is not identified as a key element to make a positive impact in 2016.
Figure 40: Responses about anticipated positive impact to 2016 fundraising, compared
with what most positively affected 2015 results
About half of all responding organizations left comments. Analysts coded written responses. Respondents could
offer more than one idea.
6%
15%
9%
5%
4%
12%
8%
9%
14%
4%
5%
5%
6%
6%
6%
7%
15%
18%
Successful event/anniversary
Major gifts, bequests
Institutional donors giving more
Strong staff, board, volunteers
Media/good PR
Better asking, stewardship, cultivation
Increased staff
Major campaign(s) gifts
Working smarter overall; having/executing
a plan
Anticipated positive impact to 2016 fundraising efforts
Most positively affected 2015 results
Nonprofit Fundraising Survey 44 March 2016
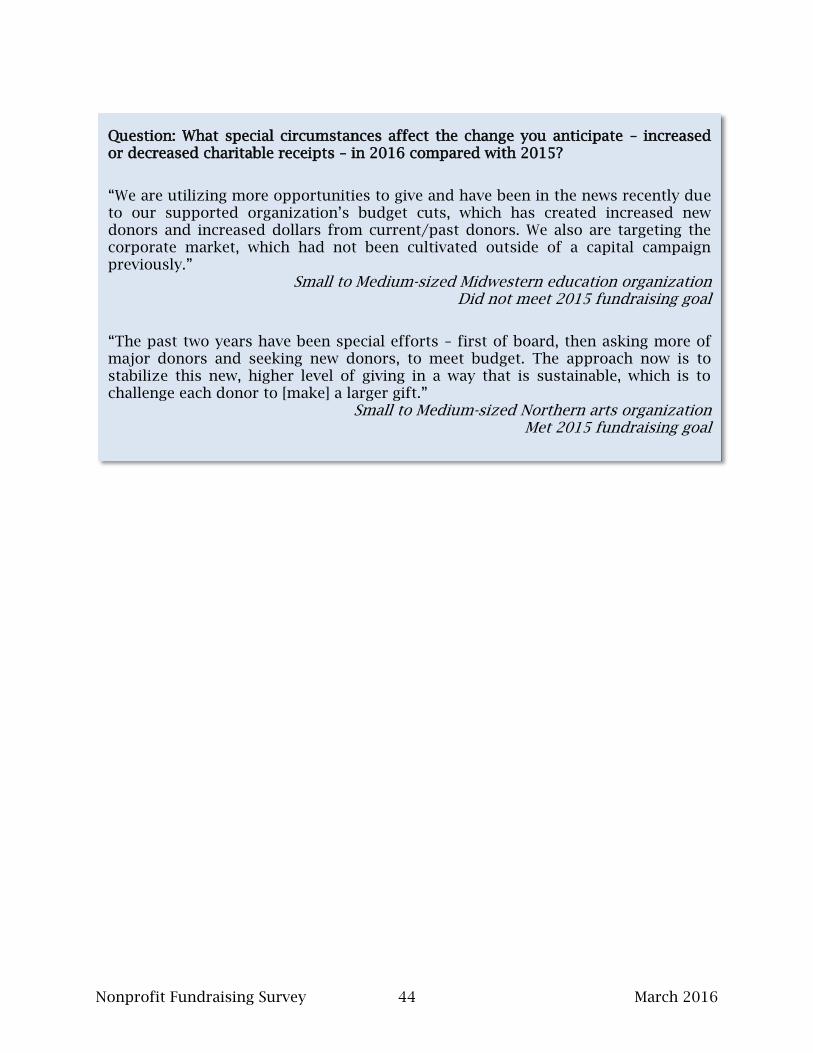
Question: What special circumstances affect the change you anticipate – increased or decreased charitable receipts – in 2016 compared with 2015?
“We are utilizing more opportunities to give and have been in the news recently due to our supported organization’s budget cuts, which has created increased new donors and increased dollars from current/past donors. We also are targeting the corporate market, which had not been cultivated outside of a capital campaign previously.”
Small to Medium-sized Midwestern education organization Did not meet 2015 fundraising goal
“The past two years have been special efforts – first of board, then asking more of major donors and seeking new donors, to meet budget. The approach now is to stabilize this new, higher level of giving in a way that is sustainable, which is to challenge each donor to [make] a larger gift.”
Small to Medium-sized Northern arts organization Met 2015 fundraising goal
Nonprofit Fundraising Survey 45 March 2016
CONCLUSION
Charitable organizations in the United States and Canada report a slight upswing in
the percentage seeing increases in fundraising revenue received in 2015 compared
with 2014. The majority (65 percent) of responding organizations reported an increase
in charitable receipts. Nearly three-quarters (73 percent) said they met their
fundraising goals.
Meeting goal and raising more are both strongly associated with total expenditures in
the organization, with larger organizations more likely to report fundraising success
overall. In this year’s study, unlike some prior years, we do find regional differences.
Organizations in the U.S. West and Canada were likely to report growth in funds raised,
whereas the U.S South was substantially less likely compared with other regions to see
an increase.
Among the fundraising methods used, results are generally similar to 2014, with the
notable difference that in several methods, more organizations report a drop in 2015
than did in 2014. Fewer organizations reported gift receipts remaining the same in
most of these methods. That is, the types of organizations that might have reported
stable fundraising in 2014 become somewhat more likely in 2015 to report a decline
for some methods, including major gifts, direct mail corporate giving, and others that
often form a large portion of an organization’s portfolio.
Bequests play an important role, with about two-thirds of organizations reporting
bequest activity – either actual funds received or new planned gift commitments
documented. The largest portion of organizations (33 percent) reported receiving
bequests that averaged between $25,000 and $100,000 per estate. This information
may be useful for organizations that are just beginning active donor engagement for
legacy gifts.
Despite a highly volatile, and even declining, stock market toward the end of 2015 and
in early 2016 when we were in the field, organizations in this study remain optimistic
that 2016 will be a successful year for fundraising. Nearly 7 in 10 predict growth in
funds received and just 14 percent expect a decline.
Nonprofit Fundraising Survey 46 March 2016
METHODOLOGY
The survey invitation was sent by email and through social media postings beginning
on January 19, 2016. The online-only survey response remained open through
February 5, 2016.
Invitations were sent by email and using social media to several distinct groups:
Prior participants in NRC surveys
Individuals who have signed up to receive communications from NRC (sign up is
at www.npresearch.org)
A random sample of 2,500 members of the Association of Fundraising
Professionals (AFP) located in the United States
All members of AFP in Canada
All members of Association of Philanthropic Counsel
Individuals on the email lists maintained by Partnership for Philanthropic
Planning and by CFRE International
An email list maintained by the Urban Institute National Center for Charitable
Statistics
Client organizations of consulting firms that are members of Giving USA
A contact list for Melissa S. Brown & Associates
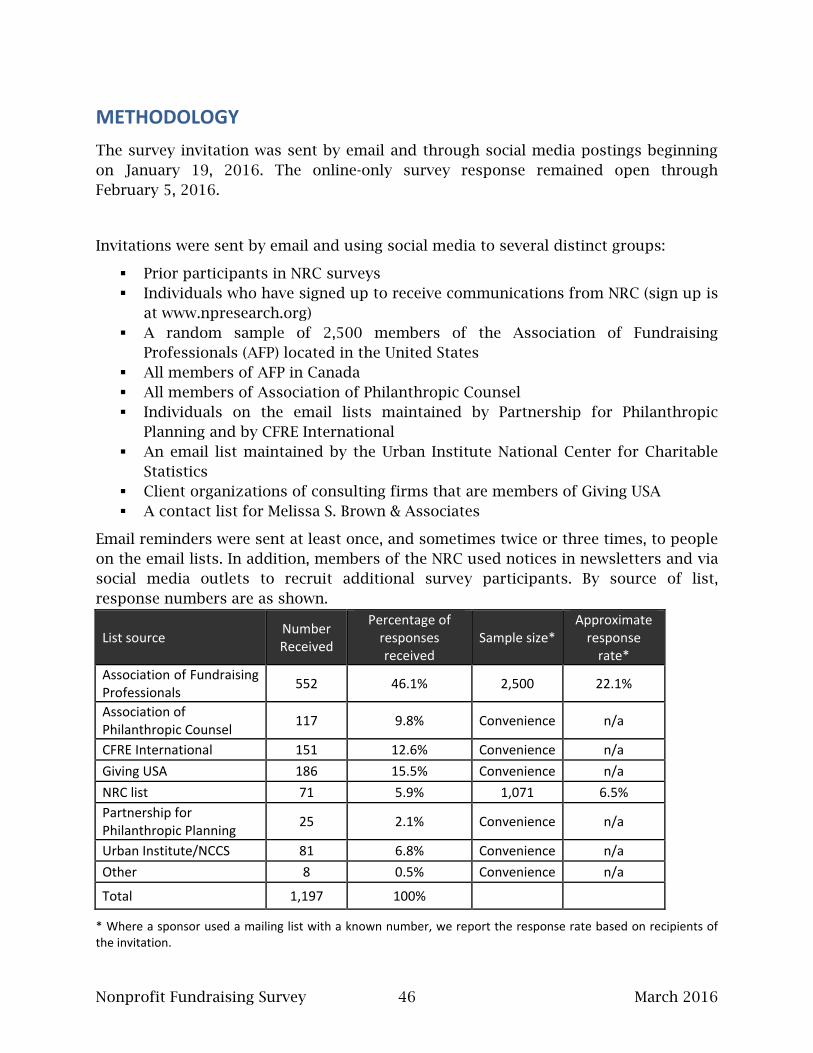
Email reminders were sent at least once, and sometimes twice or three times, to people
on the email lists. In addition, members of the NRC used notices in newsletters and via
social media outlets to recruit additional survey participants. By source of list,
response numbers are as shown.
List source Number Received
Percentage of responses received
Sample size* Approximate
response rate*
Association of Fundraising Professionals
552 46.1% 2,500 22.1%
Association of Philanthropic Counsel
117 9.8% Convenience n/a
CFRE International 151 12.6% Convenience n/a
Giving USA 186 15.5% Convenience n/a
NRC list 71 5.9% 1,071 6.5%
Partnership for Philanthropic Planning
25 2.1% Convenience n/a
Urban Institute/NCCS 81 6.8% Convenience n/a
Other 8 0.5% Convenience n/a
Total 1,197 100%
* Where a sponsor used a mailing list with a known number, we report the response rate based on recipients ofthe invitation.
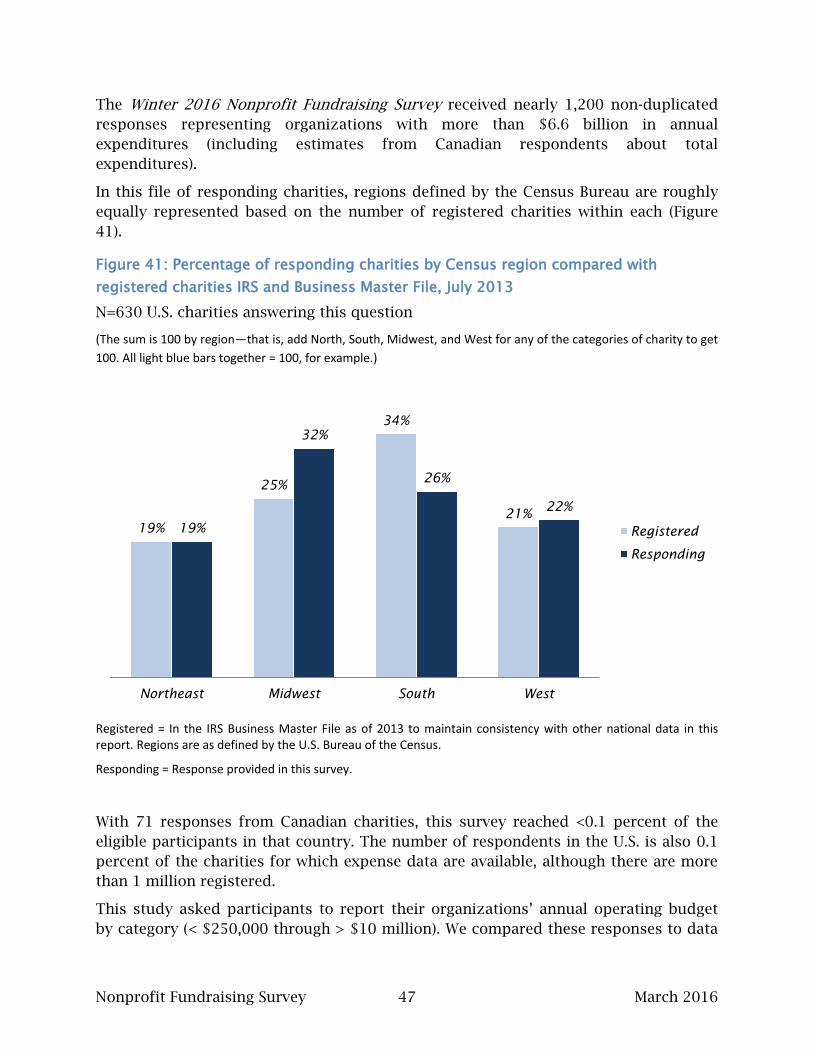
Nonprofit Fundraising Survey 47 March 2016
The Winter 2016 Nonprofit Fundraising Survey received nearly 1,200 non-duplicated
responses representing organizations with more than $6.6 billion in annual
expenditures (including estimates from Canadian respondents about total
expenditures).
In this file of responding charities, regions defined by the Census Bureau are roughly
equally represented based on the number of registered charities within each (Figure
41).
Figure 41: Percentage of responding charities by Census region compared with
registered charities IRS and Business Master File, July 2013
N=630 U.S. charities answering this question
(The sum is 100 by region—that is, add North, South, Midwest, and West for any of the categories of charity to get
100. All light blue bars together = 100, for example.)
Registered = In the IRS Business Master File as of 2013 to maintain consistency with other national data in this report. Regions are as defined by the U.S. Bureau of the Census.
Responding = Response provided in this survey.
With 71 responses from Canadian charities, this survey reached <0.1 percent of the
eligible participants in that country. The number of respondents in the U.S. is also 0.1
percent of the charities for which expense data are available, although there are more
than 1 million registered.
This study asked participants to report their organizations’ annual operating budget
by category (< $250,000 through > $10 million). We compared these responses to data
19%
25%
34%
21%
19%
32%
26%
22%
Northeast Midwest South West
Registered
Responding
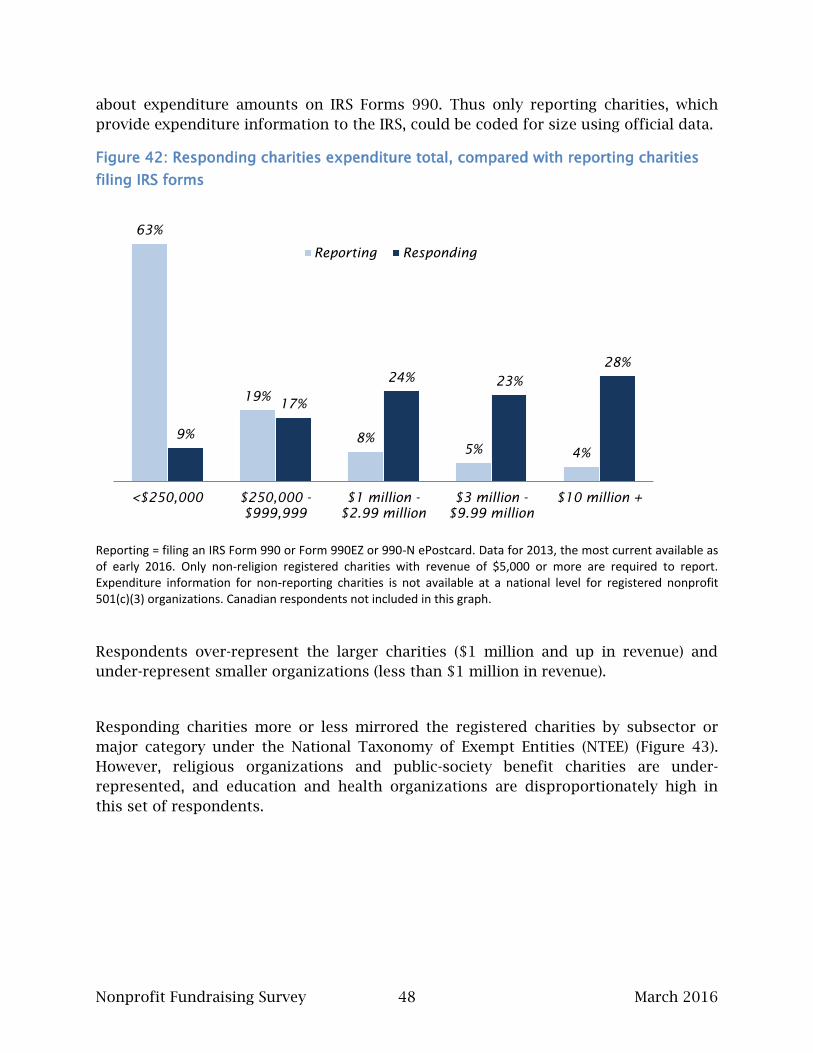
Nonprofit Fundraising Survey 48 March 2016
about expenditure amounts on IRS Forms 990. Thus only reporting charities, which
provide expenditure information to the IRS, could be coded for size using official data.
Figure 42: Responding charities expenditure total, compared with reporting charities
filing IRS forms
Reporting = filing an IRS Form 990 or Form 990EZ or 990-N ePostcard. Data for 2013, the most current available as of early 2016. Only non-religion registered charities with revenue of $5,000 or more are required to report. Expenditure information for non-reporting charities is not available at a national level for registered nonprofit 501(c)(3) organizations. Canadian respondents not included in this graph.
Respondents over-represent the larger charities ($1 million and up in revenue) and
under-represent smaller organizations (less than $1 million in revenue).
Responding charities more or less mirrored the registered charities by subsector or
major category under the National Taxonomy of Exempt Entities (NTEE) (Figure 43).
However, religious organizations and public-society benefit charities are under-
represented, and education and health organizations are disproportionately high in
this set of respondents.
63%
19%
8%
5% 4%
9%
17%
24% 23%
28%
<$250,000 $250,000 -
$999,999
$1 million -
$2.99 million
$3 million -
$9.99 million
$10 million +
Reporting Responding
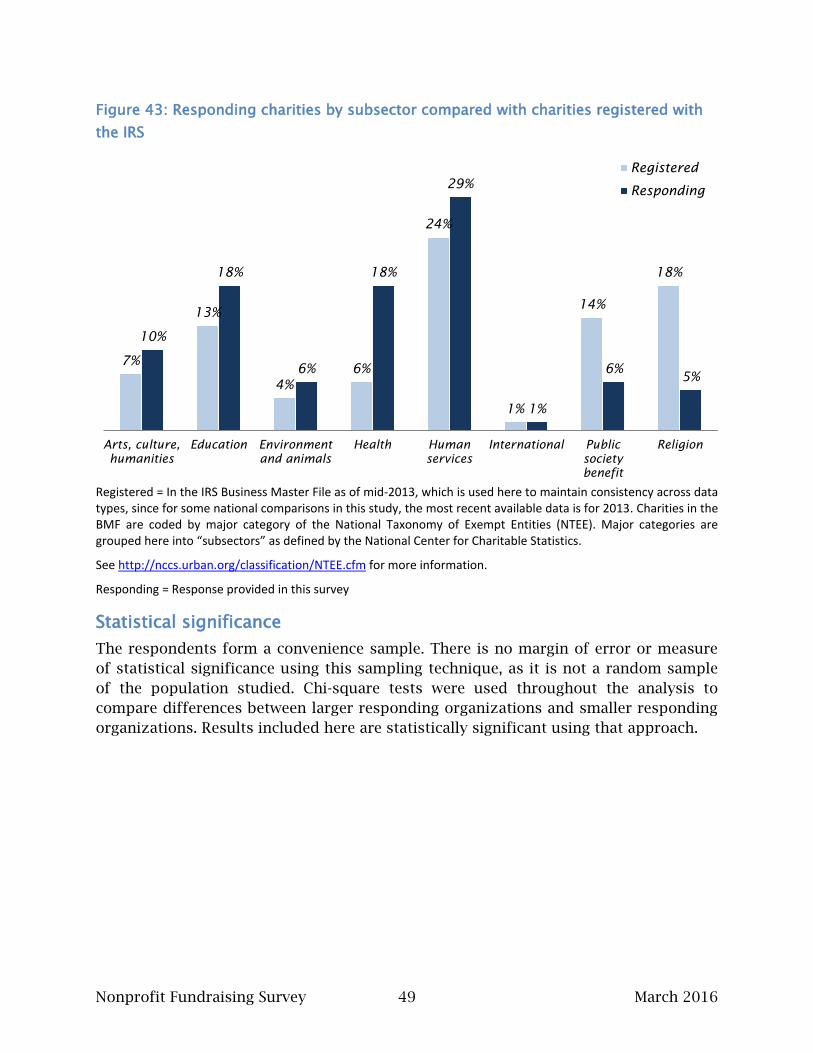
Nonprofit Fundraising Survey 49 March 2016
Figure 43: Responding charities by subsector compared with charities registered with
the IRS
Registered = In the IRS Business Master File as of mid-2013, which is used here to maintain consistency across data types, since for some national comparisons in this study, the most recent available data is for 2013. Charities in the BMF are coded by major category of the National Taxonomy of Exempt Entities (NTEE). Major categories are grouped here into “subsectors” as defined by the National Center for Charitable Statistics.
See http://nccs.urban.org/classification/NTEE.cfm for more information.
Responding = Response provided in this survey
Statistical significance
The respondents form a convenience sample. There is no margin of error or measure
of statistical significance using this sampling technique, as it is not a random sample
of the population studied. Chi-square tests were used throughout the analysis to
compare differences between larger responding organizations and smaller responding
organizations. Results included here are statistically significant using that approach.
7%
13%
4%
6%
24%
1%
14%
18%
10%
18%
6%
18%
29%
1%
6% 5%
Arts, culture,
humanities
Education Environment
and animals
Health Human
services
International Public
society
benefit
Religion
Registered
Responding
Nonprofit Fundraising Survey 50 March 2016
ABOUT THE NONPROFIT RESEARCH COLLABORATIVE Several organizations formed the NRC. These entities have a decade or more of direct
experience collecting information from nonprofits concerning charitable receipts,
fundraising practices, and/or grantmaking activities. The collaborating partners are:
Association of Fundraising Professionals, which surveyed members for an
annual state of fundraising study from 2002 through 2010.
Association of Philanthropic Counsel, an international professional association
of consultants whose members survey nonprofit organizations as part of their
services.
CFRE International, which encourages research that helps fundraising
professional achieve the highest standards of professional competence and
ethical practice.
Campbell Rinker, which publishes the bi-monthly Donor Confidence Report and
conducts numerous studies among nonprofit donors and nonprofit
professionals.
Giving USA Foundation, which has published the Giving USA Annual Report on
Philanthropy for more than 60 years.
The Partnership for Philanthropic Planning, which conducts research, education,
advocacy, community dialogue and the setting of standards and best practices
in philanthropic planning.
The National Center for Charitable Statistics at the Urban Institute, which tracks
the finances and activities of nonprofit organizations and prepares and other
publications and resources.
The collaborative effort reduces the burden on charities, which receive fewer requests
for survey participation. Survey respondents will form a panel over time, allowing for
trend comparisons among the same organizations. This approach provides more
useful benchmarking information than repeated cross-sectional studies.
The Nonprofit Research Collaborative (NRC) conducts surveys twice a year. Melissa S.
Brown & Associates manages the NRC. She can be reached at [email protected]
or at 530-690-5746.
Nonprofit Fundraising Survey 51 March 2016
NOTE 1 iNTEE CATEGORIES:
Arts, Culture or Humanities
Citizenship/Civic Improvement including voter registration, civil rights, community or economic
development
Education including pre-school, K-12, higher education, libraries tutoring programs, vocational
education
Environment/animals including zoos, aquariums, conservation, habitat preservation, humane societies,
advocacy
Health including care, research about health or disease, support and advocacy. Includes mental and oral
health
Human Services including youth programs, senior services not focused on health, help to meet basic
needs (housing, food), employment services, legal aid, general social services, sports and recreation,
disaster relief
International Aid, Relief, Development
Philanthropy, Fundraising, Voluntarism, or Grantmaking including community foundations, donor
advised funds, United Ways, Jewish Federations, volunteer matching services, etc.
Religion including houses of worship, media ministries, organizing bodies of faith groups (synod,
diocese, etc.)
Scientific or Social Scientific Research
Citizenship/Civic Improvement; Philanthropy, Fundraising, Voluntarism, or Grantmaking; and Scientific or
Social Scientific Research were previously categorized together as Public Society Benefit organizations
Appendix I - 1
Are you answering for a U.S. charitable organization that raises funds or for a Canadian registered charity or nonprofit that raises funds?
Yes No
Which option best describes your organization?
Nonprofit organization registered in the U.S. as a 501(c)3 charity
Nonprofit organization or registered charity in Canada
501(c)(3) private foundation (U.S.) Grantmaking foundation in Canada
Group with a charitable purpose but not registered. Includes new charities and congregations.
I am not affiliated with a charitable organization located in the U.S. or in Canada.
Other Please specify
What were your organization's cumulative gross dollars raised in 2015 (or FY 2015 if you are answering for the fiscal year that ended in that year)? Please include funds raised from all private philanthropic sources.
Less than $250,000
$250,000 - $499,999
$500,000 - $999,999
$1 million - $2.99 million
$3 million - $4.99 million
$5 million - $9.99 million
$10 million - $49.99 million
$50 million - $75 million
More than $75 million
Does your organization use a calendar year for tracking gifts?
Yes
No
Don’t know
How did your organization's gross dollars raised from all philanthropic sources change when comparing 2015 with 2014?
Dollars received decreased by more than 15%. Dollars received decreased by 1% to 15%.
Dollars received stayed the same.
Dollars received increased by 1% to 15%. Dollars received increased by more than 15%. Don't know.
Did your organization meet fundraising goals for the year (or fiscal year) ending in 2015?Note that for some organizations, this fiscal year may have already closed. For others, it is now underway.
Yes No
Don't know
What most affected your organization's fundraising results?
Appendix I : Questions on the Nonprofit Fundraising Survey, Winter 2016
Appendix I - 2
For each method that you used, please indicate how contributions compared in 2015 with 2014.
Board giving
Gift amount received decreased.
Gift amount received stayed the same. Gift amount received increased.
We use this method but do not track results.
We began this method in 2015 so cannot compare with 2014. We do not use this method.
Don't know.
Major gifts (however your organization defines them) that are not from board members
Amount received decreased. Amount received stayed the same. Amount received increased.
We use this method but do not track it separately.
We began this method in 2015 so cannot compare with 2014. We do not receive funds from this method.
Don't know.
Planned gift amounts received
Amount received decreased. Amount received stayed the same. Amount received increased.
We use this method but do not track separately.
We began this method in 2015 so cannot compare with 2014. We do not receive gifts from this method.
Don't know.
Planned gifts: New commitments
Number of commitments decreased.
Number of commitments stayed about the same. Number of new commitments increased.
We use this method but do not track number of new commitments. We began this method in 2015 so cannot compare with 2014.
We do not receive funds through this method. Don't know.
Requests sent by regular mail
Amount received decreased. Amount received stayed the same. Amount received increased.
We use this method but do not track separately.
We began this method in 2015 so cannot compare with 2014. We do not receive funds from this method.
Don't know.
Requests sent by email
Amount received decreased. Amount received stayed the same. Amount received increased.
We use this method but do not track separately.
We began this method in 2015 so cannot compare with 2014. We do not receive funds from this method.
Don't know.
Appendix I - 3
Net proceeds from special events
Amount received decreased. Amount received stayed the same. Amount received increased.
We use this method but do not track separately.
We began this method in 2015 so cannot compare with 2014. We do not receive funds from this method.
Amount received decreased. Don't know.
Telephone appeals
Amount received decreased.
Amount received stayed the same. Amount received increased.
We use this method but do not track separately.
We began this method in 2015 so cannot compare with 2014. We do not receive funds from this method.
Don't know.
Appeals on Facebook, LinkedIn or other social media
Amount received decreased. Amount received stayed the same. Amount received increased.
We use this method but do not track separately.
We began this method in 2015 so cannot compare with 2014. We do not receive funds from this method.
Don't know.
Gifts via text message/SMS (short message service)
Amount received decreased. Amount received stayed the same. Amount received increased.
We use this method but do not track separately.
We began this method in 2015 so cannot compare with 2014. We do not receive funds from this method.
Don't know.
Online gifts not included above, such as responses to "give now" at your website
Amount received decreased. Amount received stayed the same. Amount received increased.
We use this method but do not track separately.
We began this method in 2015 so cannot compare with 2014. We do not receive funds from this method.
Don't know.
Which of the following social media or online fundraising methods is your organization using? Please select all that apply.
Crowdfunding, such as through sites like Razoo, Kickstarter, GoFundMe, CaringBridge, or others. Local, regional, or national giving day, including Giving Tuesday.
Online charity auction, either through eBay or otherwise.
Peer-to-peer or "a-thon" fundraising (online pledges made by friends of people who are asked by a volunteer participating in an event or activity).
Sales-linked fundraising, such as Smile.Amazon or other. Other Please specify in the text box below
Appendix I - 4
Funds from congregations or the governing bodies of faith communities (e.g. synod, diocese, association)
Amount received decreased. Amount received stayed the same. Amount received increased.
We use this method but do not track separately.
We began this method in 2015 so cannot compare with 2014. We do not receive funds from this method.
Don't know.
Federated campaigns or other charities that are not congregations or faith communities
Amount received decreased. Amount received stayed the same. Amount received increased.
We use this method but do not track separately.
We began this method in 2015 so cannot compare with 2014. We do not receive funds from this method.
Don't know.
Grants from private or community foundations
Amount received decreased. Amount received stayed the same. Amount received increased.
We use this method but do not track separately.
We began this method in 2015 so cannot compare with 2014. We do not receive funds from this method.
Don't know.
Corporate gifts or corporate foundation grants
Amount received decreased.
Amount received stayed the same.
Amount received increased.
We use this method but do not track separately.
We began this method in 2015 so cannot compare with 2014.
We do not receive funds from this method.
Don't know.
REPORT NOT YET AVAILABLE FOR THESE SECTIONS as of March 2016
Does your organization use ANY type of metric?
Yes No
Don't know
How often does your organization (or unit if you fundraise for a portion of the entire charity) use the following data or reports make decisions about fundraising? Click the box under "Frequency" to select a choice that appears. [options ranged from once a month or more frequently to sometimes but not annually]
Number (or percentage) of donors based on amount given (< $100; > $xx, etc.)
Percentage of funds received from a number of donors (e.g., % of $ from top 10 donors or top 10% of donors)
Donors that upgraded (gave more than last year)
Donors who downgraded (gave less than last year)
Donors who lapsed in the past year
Donors who renewed
Comments about the metrics or frequencies you identified above, if any.
Appendix I - 5
How often, if at all, do you run reports using the following types of information about donors as part of your planning for fundraising? [options ranged from once a month or more frequently to sometimes but not annually]
Average number of years a donor or group of donors has been active (giving annually or more often)
Frequency of gifts from a donor or group of donors (once a year, more often, less often)?
Participation in other activities (e.g., as volunteers, guests at gala, ticket purchasers, etc.)
Comments about metrics or frequencies above, if any.
What other metrics about donors do you use, if any?
Is there anything else you’d like to tell us about the metrics your organization uses?
How often to you use the following types of data about funds received to make decisions about fundraising? [options ranged from once a month or more frequently to sometimes but not annually]
Percentage of dollars grouped by amount given (y% of gift dollars in gifts < $100, then z% in gifts from $100 to $250 and so on)
Percentage of dollars contributed by donors who upgraded (gave more than last year)
Percentage of dollars contributed by donors who downgraded (gave less than last year)
Percentage of dollars that originated from repeat (renewing) donors
Average gift amount per donor in a year or other period
Average gift amount received per tactic (direct mail, online, etc.) used
Comments
What else would you like us to know about metrics?
Does your organization track the cost of staff time for fundraising?
Yes, routinely
Yes, sometimes (for some staff or for some fundraising methods) No, never
Don't know
Comment
Does your organization track fundraising expenses, such as for postage, supplies, consulting, printing, hosting events, etc.?
Yes, routinely
Yes, sometimes for some approaches No, never
Don't know
Comments
If yes to either of the above, does your organization use information about the cost of fundraising in planning future fundraising activity?
Yes, routinely Yes, sometimes No, never
Don't know
Comment
Appendix I - 6
Which fundraising software or donor database system do you use to generate the reports used for fundraising metrics? If more than one, mark all that apply.
Excel or Access
@ease or Batch group Abila
Agilon/One Avectra
Blackbaud: eTapestry Blackbaud: Raiser's Edge Bloomerang
Christensen Computer Company Clearview CRM Softrek
Daxko Donor2 DonorPerfect DonorPro
e-Finesstri FundTrack Giftworks
Income Manager Little Green Light
MatchMaker FundRaising Software Metafile
NeonCRM by Z2 Systems, Inc. Net Ventures: Trinexum Orange Leap
Personify
PhilanthrAppeal [Fund Track]
Protivity
Quicken or QuickBooks Results Plus, Metafile ROI Solutions
Sage
Salesforce (Nonprofit Starter Pack CRM) Talisma/ Campus Management
Team Approach Telosa
Trail Blazer
Other (please specify)
Please mark the answer that reflects your organization's budget for fundraising for 2015.
< $25,000
$25,001 - $50,000
$50,001 - $100,000
$100,001 - $250,000
$250,001 - $500,000
$500,001 - $1 million More than $1 million Don't know.
Comments
Does the budget amount you selected above include salaries for fundraising staff?
Yes No
Don't know
Comment
There are some resources available for evaluating fundraising effectiveness. Please review these and select the response that fits you. [options ranged from know it and use it to have not heard of it]
Fundraising Fitness Test
Growth in Giving Initiative
Fundraising Effectiveness Project
Calculate ROI or CTRD (cost to raise a dollar)
Response rate for direct mail
Average gift amount
Number/percentage of new donors
Number/percentage of renewed donors
Analysis product(s) from your database vendor(s)
Appendix I - 7
Compared to 2015, what change do you anticipate seeing in the amount of funds raised in 2016? Funds raised in 2016...
Will be more than 15% lower than in 2015 Will be 1% to 15% lower than in 2015
Will be the same as in 2015
Will be 1% to 15% higher than in 2015
Will be more than 15% higher than in 2015
Please note any special circumstances that help explain your answer to the prior question (e.g., ending or starting a capital campaign, knowing that a particular funder will or will not give in FY2016, etc.)
In your own words, what do you think will be the single biggest challenge/issue/trend to affect your organization and its fundraising in 2016, either positively or negatively?
How is fundraising organized at your organization?
There is a single development staff/office for the entire organization. (Note: This is typical for local organizations and for affiliates of national charities.)
We have more than one development office serving our organization. (Note: This might apply in a university, with a development staff for each school. It might apply for a larger organization with development in several locations.)
Don't know.
Other (please specify)
In 2015, did your fundraising team have open positions for staff related to fundraising at any point in the year?
Yes No
If yes above, please select the type of position and length of time it was open.
Number of months in 2015 the position was open
Part-time position
1 full-time position
Another full-time position
Any other (3rd or more) full-time position(s)
What is the name and ZIP or postal code of the main office of your organization? Please note that all responses are kept confidential, and this is only for coding purposes.
Organization Name:
ZIP/Postal Code:
Appendix I - 8
What is the main subject category in which your organization works?
Arts, Culture or Humanities
Citizenship/Civic Action includes voter registration, civil rights advocacy, community or economic development, support for recognized groups based on identity or military service but not related specifically to health or human services. Also includes mutual benefit organizations.
Higher Education - community college, college, or university; college preparatory programs; and college scholarship programs. Also includes sorority and fraternity fundraising entities.
Education - pre-school, K-12 schools, libraries, tutoring, literacy programs, vocational training, etc.
Environment or animals includes zoos and aquaria, conservation or habitat preservation, humane societies, advocacy on behalf of animals or the environment
Health includes providing care, research focused on health or disease, and support and advocacy for people living with health- related conditions. Includes mental health, dental or oral health
Human Services includes youth development, senior services not focused on health, helping to meet basic needs such as for housing, food, or employment services, legal aid, general social services, sports and recreation. Also includes disaster preparedness or response.
International Aid, Relief, Development
Philanthropy, Fundraising, Voluntarism, or Grantmaking includes community foundations, independent sponsors of donor- advised funds, United Ways, Jewish Federations, volunteer matching services, etc.
Religion includes houses of worship, media ministries, organizing bodies of faith groups (synod, diocese, etc.)
Scientific or Social Scientific Research Don't Know
Other Please specify in the text box below
Referencing the map below [not shown here], please indicate in which region your organization's main office is located.
Northeastern U.S. Southern U.S. Midwestern U.S. Western U.S. Canada
What was your organization's annual operating budget in FY2015?
Less than $25,000
$25,000 - $99,999
$100,000 - $249,999
$250,000 - $499,999
$500,000 - $999,999
$1,000,000 - $2.99 million
$3,000,000 - $4.99 million
$5,000,000 - $9.99 million
$10,000,000 - $49.99 million
$50,000,000 - $75 million More than $75 million Don't know
Other Please specify in the text box below.