wire and wireless (india) limited - digital cable tv · pdf fileobjectives and projections of...
TRANSCRIPT

Wire and Wireless (India) Limited
August 2011
1

Disclaimer
2
Some of the statements made in this presentation are forward-looking statements
and are based on the current beliefs, assumptions ,expectations, estimates,
objectives and projections of the directors and management of Wire and Wireless
(India) Limited (WWIL) about its business and the industry and markets in which it
operates.
These forward-looking statements include, without limitation, statements relating to
revenues and earnings. The words “believe”, “anticipate”, “expect”, “estimate”,
“intend”, “project” and similar expressions are also intended to identify forward
looking statements.
These statements are not guarantees of future performance and are subject to
risks, uncertainties and other factors, some of which are beyond the control of the
Company and are difficult to predict. Consequently, actual results could differ
materially from those expressed or forecast in the forward-looking statements as a
result of, among other factors, changes in economic and market conditions,
changes in the regulatory environment and other business and operational risks.
WWIL does not undertake to update these forward-looking statements to reflect
events or circumstances that may arise after publication.

India: Television Distribution
3
Year to 31st
(HHs in mn) 2007A 2009E 2011E 2013E 2015E
1 Indian Households 222 230 239 250 262
CAGR of 2.5% to 2015
2 Total television Households 117 131 140 148 163
TV penetration in India 53% 57% 59% 59% 62%
CAGR of 6.2% to 2015
3Cable & Satellite Households
(C&S)65 82 105 127 146
C&S penetration in India 56% 63% 75% 86% 90%
CAGR of 10.6%to 2015
4 Analogue Cable Households 61 62 51 38 26
5 Digital Households 4 20 54 89 120
6 Market share in C&S HHs
Analogue Cable HHs 94% 76% 49% 30% 18%
DTH HHs 4% 14% 30% 40% 46%
Other Digital HHs 2% 10% 21% 30% 36%
• Fragmented market
• Poised for digitization
• Driven by
• Regulatory - CAS
• Customer need for better quality
• Technology
• Third largest television
market in the world
Source: Company estimates
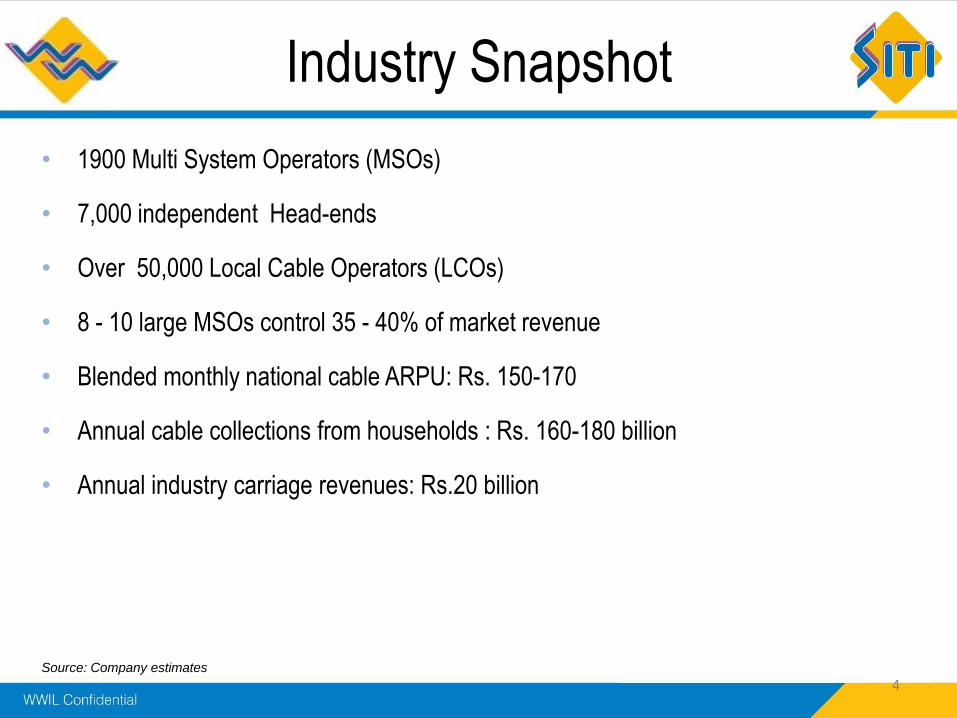
Industry Snapshot
• 1900 Multi System Operators (MSOs)
• 7,000 independent Head-ends
• Over 50,000 Local Cable Operators (LCOs)
• 8 - 10 large MSOs control 35 - 40% of market revenue
• Blended monthly national cable ARPU: Rs. 150-170
• Annual cable collections from households : Rs. 160-180 billion
• Annual industry carriage revenues: Rs.20 billion
4Source: Company estimates
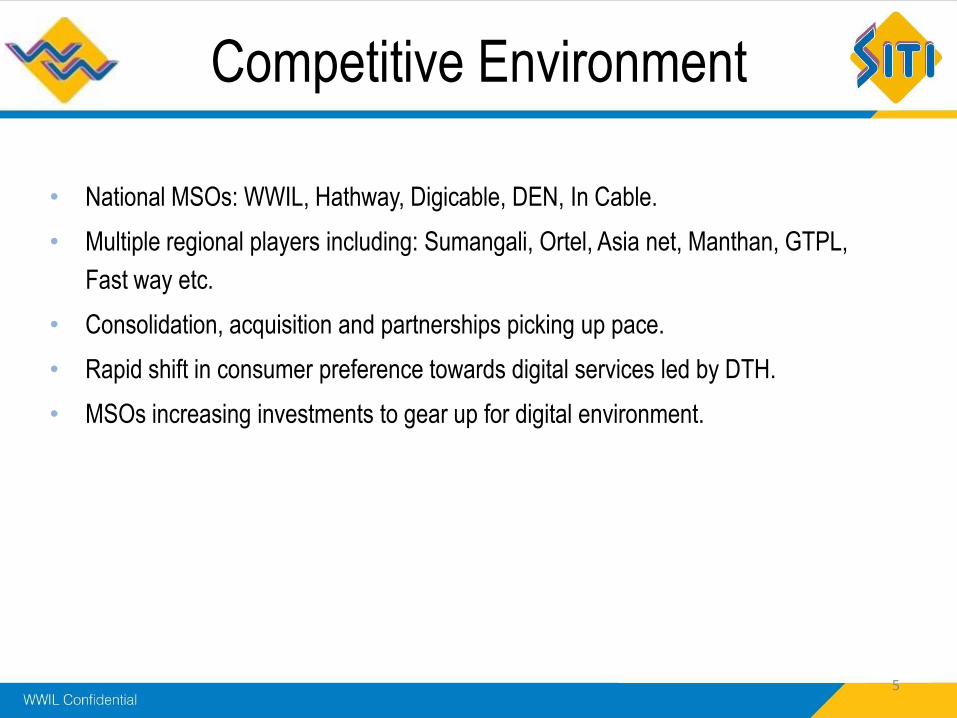
Competitive Environment
• National MSOs: WWIL, Hathway, Digicable, DEN, In Cable.
• Multiple regional players including: Sumangali, Ortel, Asia net, Manthan, GTPL,
Fast way etc.
• Consolidation, acquisition and partnerships picking up pace.
• Rapid shift in consumer preference towards digital services led by DTH.
• MSOs increasing investments to gear up for digital environment.
5
Industry: Regulatory Environment
• Regulator TRAI has advocated adoption of digital technology in cable television
• The regulator has recommended mandatory digitalization with Sun Set Clauses –
PAN India Digitalization by Mar 2015.
• Increase in Foreign investment.
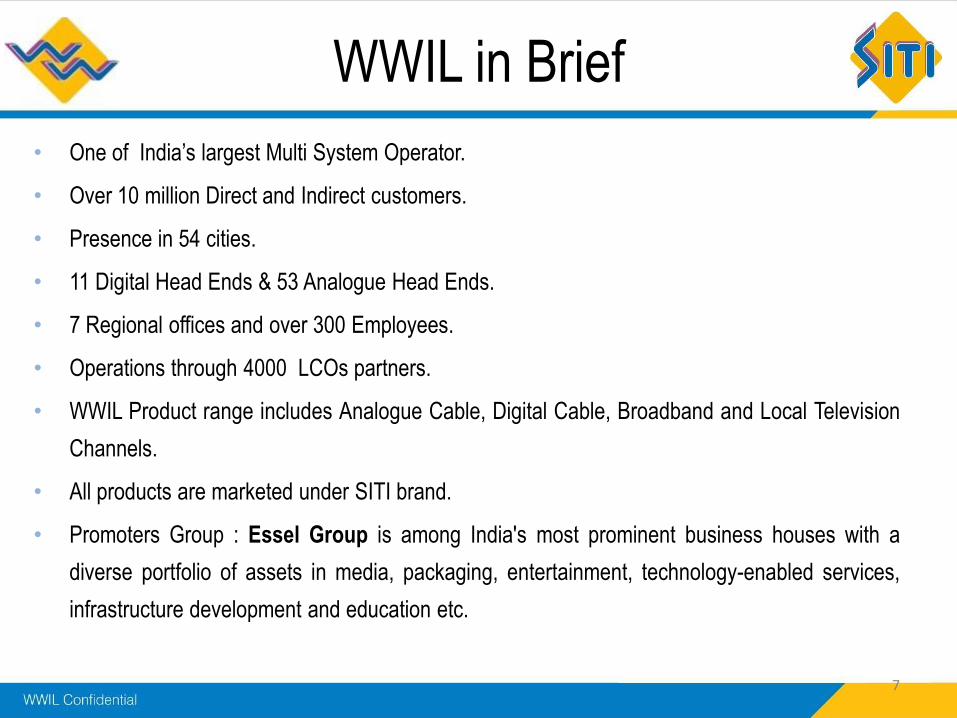
WWIL in Brief
• One of India’s largest Multi System Operator.
• Over 10 million Direct and Indirect customers.
• Presence in 54 cities.
• 11 Digital Head Ends & 53 Analogue Head Ends.
• 7 Regional offices and over 300 Employees.
• Operations through 4000 LCOs partners.
• WWIL Product range includes Analogue Cable, Digital Cable, Broadband and Local Television
Channels.
• All products are marketed under SITI brand.
• Promoters Group : Essel Group is among India's most prominent business houses with a
diverse portfolio of assets in media, packaging, entertainment, technology-enabled services,
infrastructure development and education etc.
7
The WWIL Advantage
• One of India’s largest MSOs.
• Pan India dominance.
• Presence across Analogue Cable ,Digital Cable & CAS .
• Robust backend in place.
• Legacy advantages – Management bandwidth ,technology, relationships.
• Backed by one of India’s most prominent Business house – Essel Group.
8
• India’s first and the largest Multi-System Operator (MSO) in the country
• First MSO to bring a Right Issue.
• First Company to carry city specific content on SITI channels.
• One of the largest Cable TV Network : SITI Network
• Most popular local cable Channel : SITI
WWIL : Many No.1 position
9
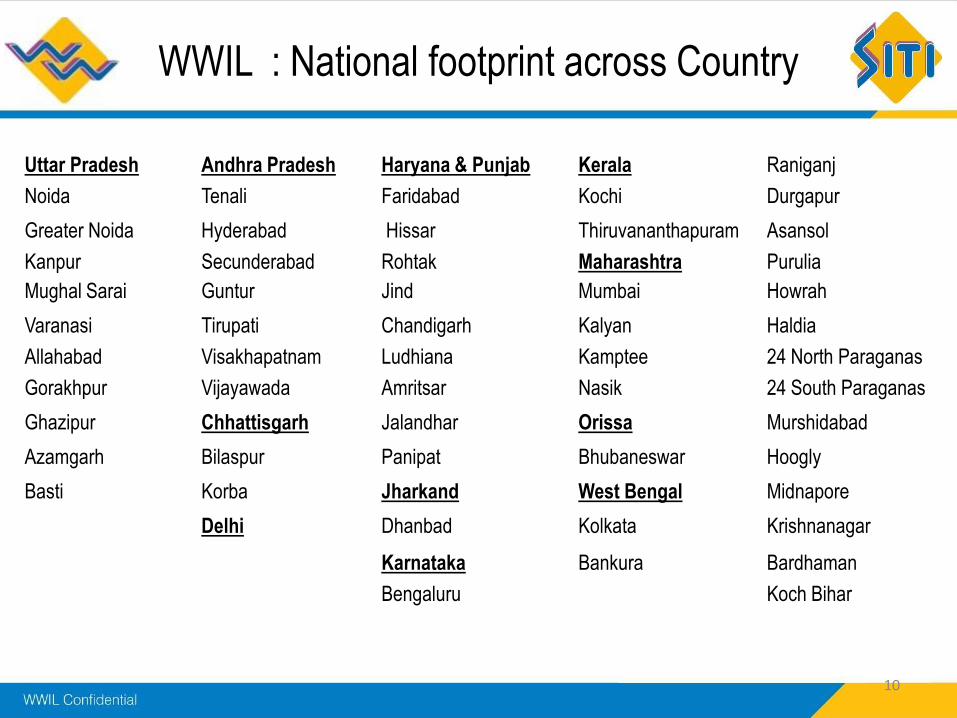
WWIL : National footprint across Country
10
Uttar Pradesh Andhra Pradesh Haryana & Punjab Kerala Raniganj
Noida Tenali Faridabad Kochi Durgapur
Greater Noida Hyderabad Hissar Thiruvananthapuram Asansol
Kanpur Secunderabad Rohtak Maharashtra Purulia
Mughal Sarai Guntur Jind Mumbai Howrah
Varanasi Tirupati Chandigarh Kalyan Haldia
Allahabad Visakhapatnam Ludhiana Kamptee 24 North Paraganas
Gorakhpur Vijayawada Amritsar Nasik 24 South Paraganas
Ghazipur Chhattisgarh Jalandhar Orissa Murshidabad
Azamgarh Bilaspur Panipat Bhubaneswar Hoogly
Basti Korba Jharkand West Bengal Midnapore
Delhi Dhanbad Kolkata Krishnanagar
Karnataka Bankura Bardhaman
Bengaluru Koch Bihar
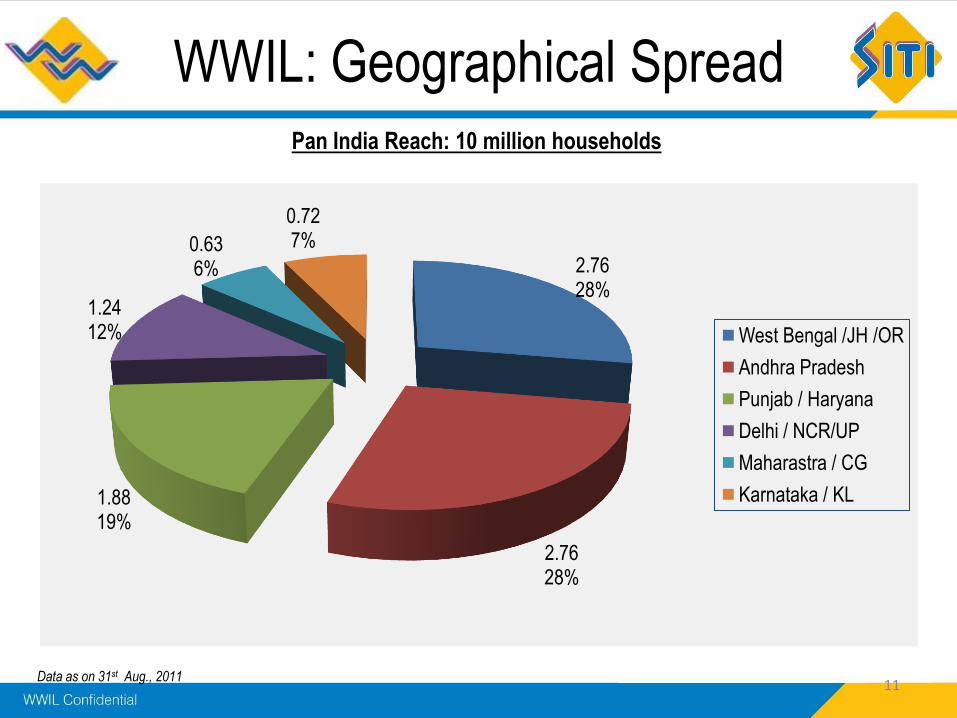
WWIL: Geographical SpreadPan India Reach: 10 million households
Data as on 31st Aug., 2011
2.7628%
2.7628%
1.8819%
1.2412%
0.636%
0.727%
West Bengal /JH /OR
Andhra Pradesh
Punjab / Haryana
Delhi / NCR/UP
Maharastra / CG
Karnataka / KL
11
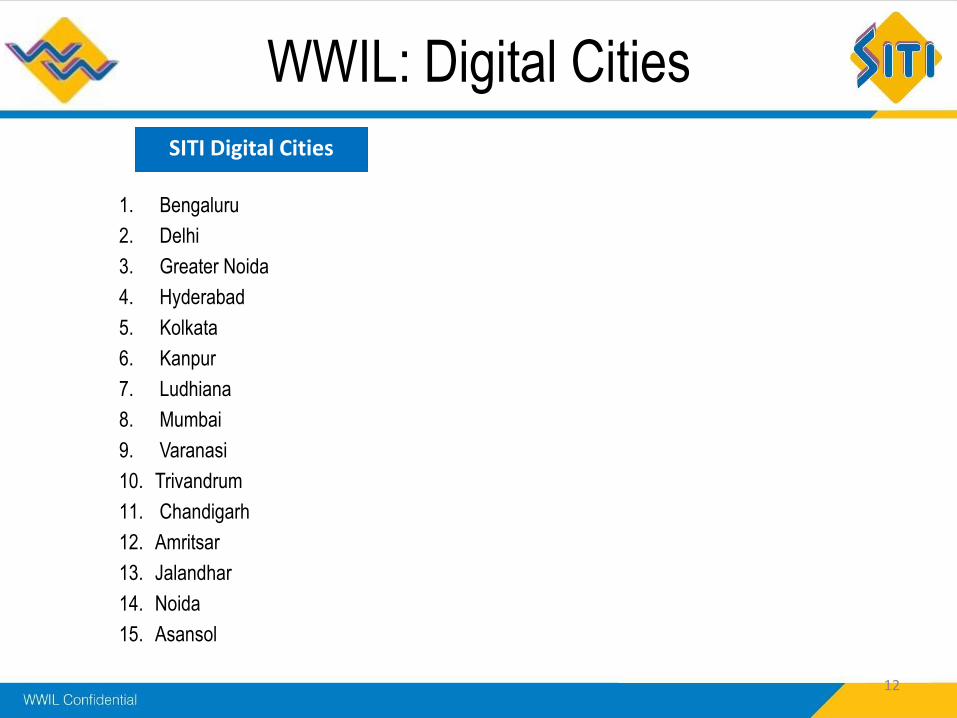
1. Bengaluru
2. Delhi
3. Greater Noida
4. Hyderabad
5. Kolkata
6. Kanpur
7. Ludhiana
8. Mumbai
9. Varanasi
10. Trivandrum
11. Chandigarh
12. Amritsar
13. Jalandhar
14. Noida
15. Asansol
SITI Digital Cities
WWIL: Digital Cities
12
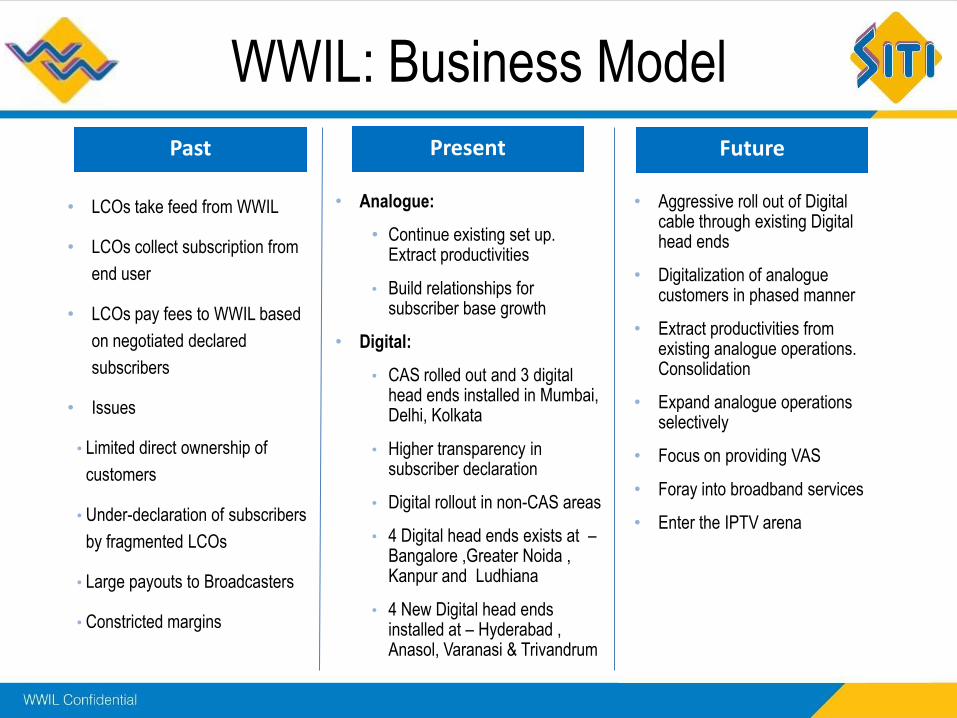
WWIL: Business Model
• LCOs take feed from WWIL
• LCOs collect subscription from
end user
• LCOs pay fees to WWIL based
on negotiated declared
subscribers
• Issues
• Limited direct ownership of
customers
• Under-declaration of subscribers
by fragmented LCOs
• Large payouts to Broadcasters
• Constricted margins
• Analogue:
• Continue existing set up. Extract productivities
• Build relationships for subscriber base growth
• Digital:
• CAS rolled out and 3 digital head ends installed in Mumbai, Delhi, Kolkata
• Higher transparency in subscriber declaration
• Digital rollout in non-CAS areas
• 4 Digital head ends exists at –Bangalore ,Greater Noida , Kanpur and Ludhiana
• 4 New Digital head ends installed at – Hyderabad , Anasol, Varanasi & Trivandrum
• Aggressive roll out of Digital cable through existing Digital head ends
• Digitalization of analogue customers in phased manner
• Extract productivities from existing analogue operations. Consolidation
• Expand analogue operations selectively
• Focus on providing VAS
• Foray into broadband services
• Enter the IPTV arena
FuturePresentPast
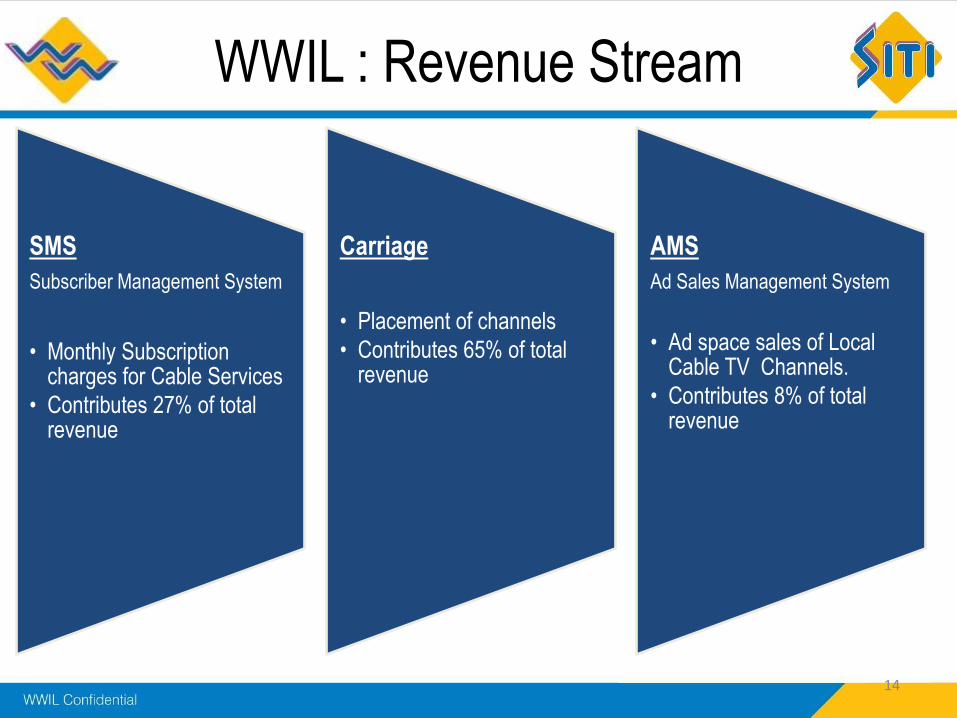
WWIL : Revenue Stream
SMS
Subscriber Management System
• Monthly Subscription charges for Cable Services
• Contributes 27% of total revenue
Carriage
• Placement of channels
• Contributes 65% of total revenue
AMS
Ad Sales Management System
• Ad space sales of Local Cable TV Channels.
• Contributes 8% of total revenue
14
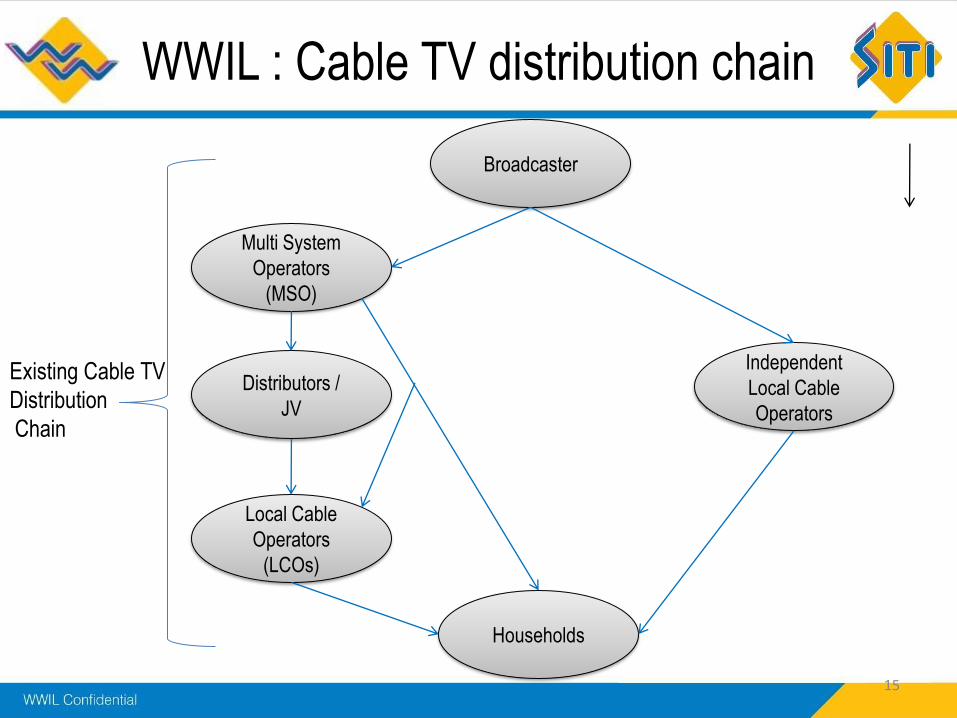
Broadcaster
Multi System
Operators
(MSO)
Independent
Local Cable
Operators
Local Cable
Operators
(LCOs)
Households
Distributors /
JV
WWIL : Cable TV distribution chain
Existing Cable TV
Distribution
Chain
15
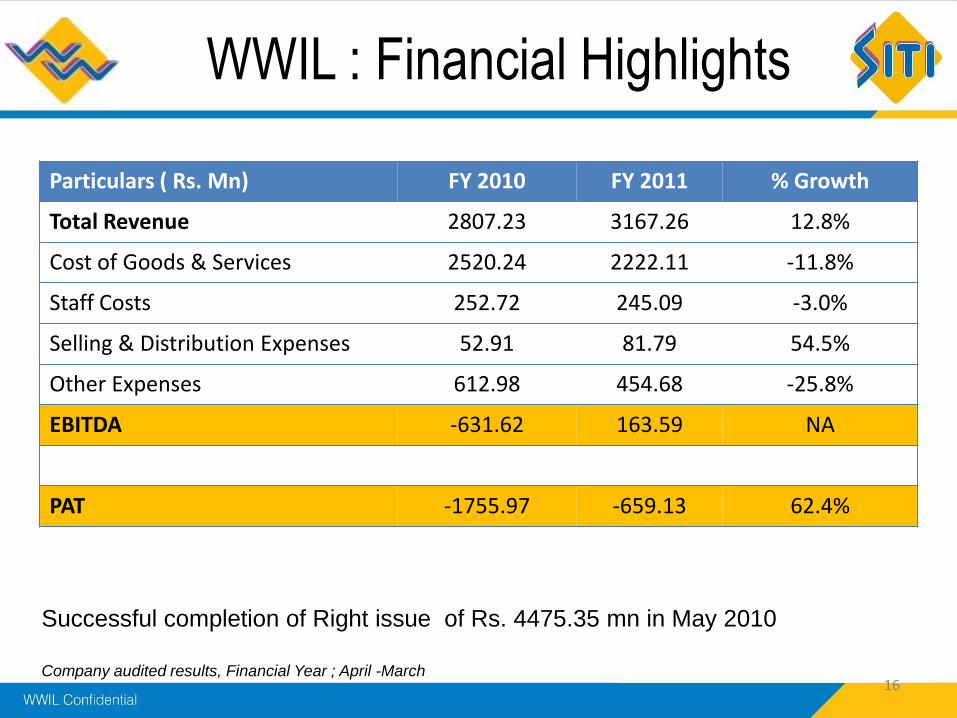
WWIL : Financial Highlights
Particulars ( Rs. Mn) FY 2010 FY 2011 % Growth
Total Revenue 2807.23 3167.26 12.8%
Cost of Goods & Services 2520.24 2222.11 -11.8%
Staff Costs 252.72 245.09 -3.0%
Selling & Distribution Expenses 52.91 81.79 54.5%
Other Expenses 612.98 454.68 -25.8%
EBITDA -631.62 163.59 NA
PAT -1755.97 -659.13 62.4%
16
Successful completion of Right issue of Rs. 4475.35 mn in May 2010
Company audited results, Financial Year ; April -March
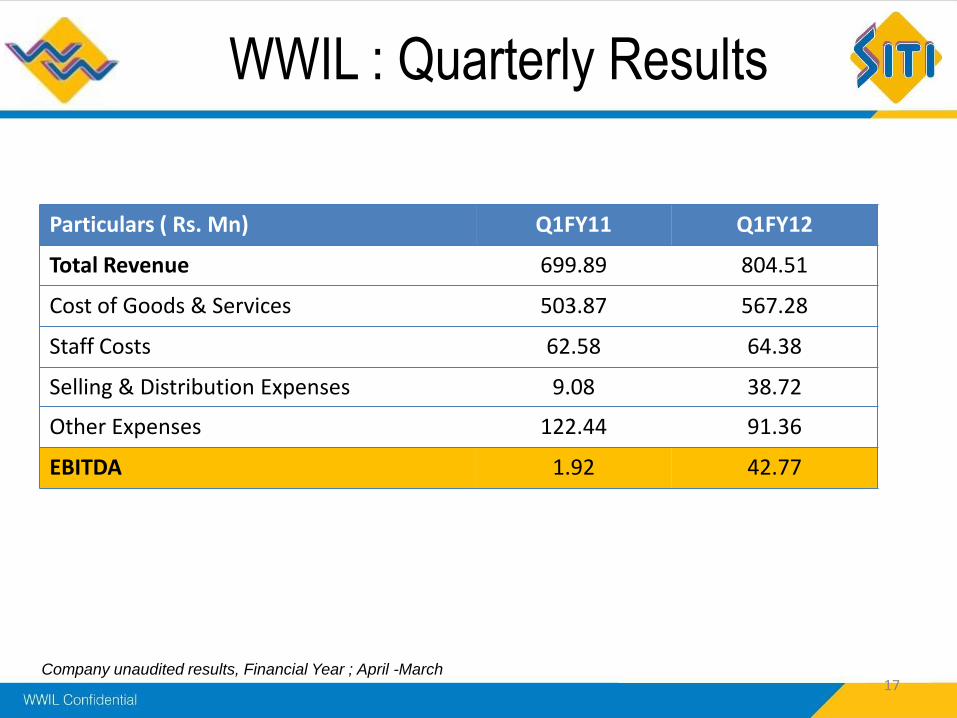
WWIL : Quarterly Results
17
Particulars ( Rs. Mn) Q1FY11 Q1FY12
Total Revenue 699.89 804.51
Cost of Goods & Services 503.87 567.28
Staff Costs 62.58 64.38
Selling & Distribution Expenses 9.08 38.72
Other Expenses 122.44 91.36
EBITDA 1.92 42.77
Company unaudited results, Financial Year ; April -March
WWIL: Way Forward
• Consolidation of market
• Increase in subscriber base through tapping under declaration
• Increase connectivity by adding LCOs
• Strategic acquisition and partnership
• Value added Services
• Geographical dispersion in new areas – UP, Rajasthan, Haryana, East, North East etc
• Continued cost optimization
18
Thank You
19