wisconsin health information organization...
TRANSCRIPT
Wisconsin Health Information Organization
(WHIO) Presentation to the
Group Insurance Board
November 12th, 2013
Wisconsin Health Information Organization 1

WHIO Driving Transparency to Improve
Your Healthcare
• An “All Payer Claims Datamart” (APCD) • Collects healthcare data from payers, aggregates the data
and then distributes HIPAA compliant data to approximately 200 end users
• Formed in 2005 by a multi-stakeholder group of healthcare professionals
• A Non-profit 501 c 3
Wisconsin Health Information Organization 2
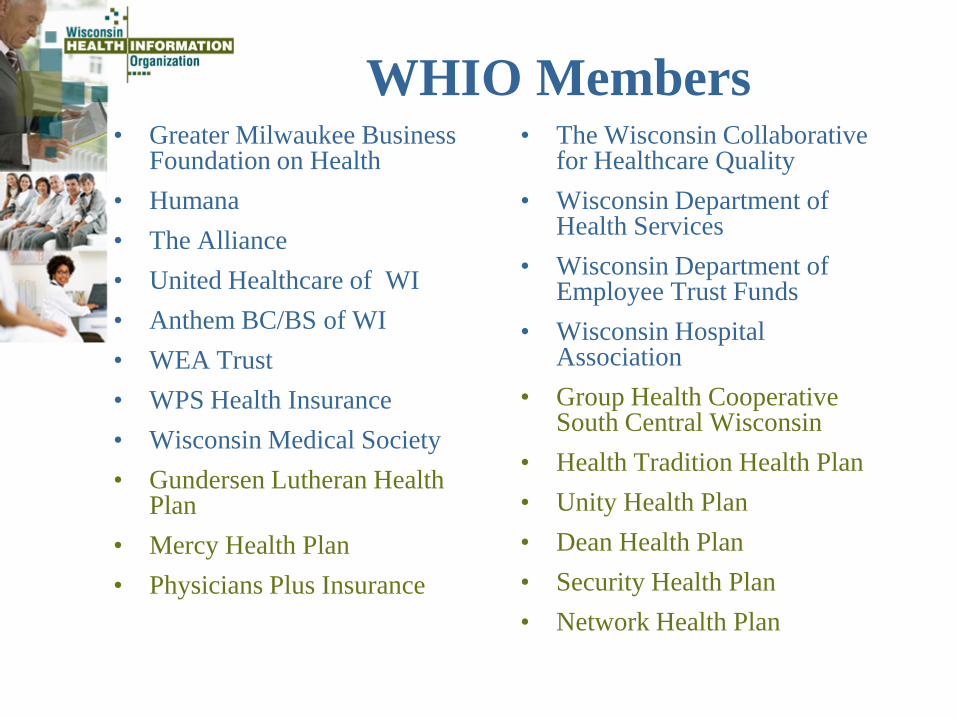
WHIO Members • Greater Milwaukee Business
Foundation on Health • Humana • The Alliance • United Healthcare of WI • Anthem BC/BS of WI • WEA Trust • WPS Health Insurance • Wisconsin Medical Society • Gundersen Lutheran Health
Plan • Mercy Health Plan • Physicians Plus Insurance
• The Wisconsin Collaborative for Healthcare Quality
• Wisconsin Department of Health Services
• Wisconsin Department of Employee Trust Funds
• Wisconsin Hospital Association
• Group Health Cooperative South Central Wisconsin
• Health Tradition Health Plan • Unity Health Plan • Dean Health Plan • Security Health Plan • Network Health Plan

WHIO Subscribers • Aurora Health • NEWHVN • Aspirus • Bellin Health • ThedaCare • Froedtert Health • Children’s Hospital of WI • Centene/MHS • WIPHCA

Datamart growth and stabilization
Wisconsin Health Information Organization
DMV2 DMV3 DMV4 DMV5 DMV6 DMV7 DMV8 Members Included 1.51 M 2.82 M 3.44 M 3.73 M 3.86 M 3.94 M 3.95 M % WI Population 26.8% 47.1% 58.0% 62.8% 64.9% 65.6% 65.7% Claims Included 72.7 M 136.8 M 207.1 M 233.5 M 247.6 M 249.6 M 247 M
% Commercial Claims 92% 52% 40% 42% 42% 42% 40% % Medicaid FFS Claims 0% 42% 29% 26% 25% 24% 24% % Medicaid HMO Claims 0% 0% 20% 19% 20% 20% 22% % Medicare Claims 8% 6% 11% 13% 13% 14% 14%
Claim $ Included (Std. Cost/ Billed)
$20.7 B / $35.7 B
$28.9 B / $51.6 B
$32.2 B / $59.3 B
$34.4 B / $64 B
$35.7 B / $66 B
$36.8 B / $67.5 B
Episodes of Care 7.3 M 11.1 M 18.8 M 21.5 M 23.1 M 23.7 M 23.9 M Providers Included 133,845 88,171 93,245 95,214 98,278 90,956
10/2006 - 12/2008
10/2007 - 12/2009
4/2008 - 6/2010
10/2008 - 12/2010
4/2009 - 6/2011
10/2010 - 12/2011
4/2010 - 6/2011
Datamart Published: October, 2009
April, 2010 October, 2010
April, 2011 October, 2011
April, 2012 December, 2012
DMV3 DMV4 DMV5 DMV6 DMV7 DMV8Anthem WI Medicaid
(FFS)WI Medicaid
(HMO)Network HP Health
TraditionsThe Alliance No new data
contributors
Humana Gundersen Lutheran
Dean Physicians Plus
Unity
UHC WI Security
WEA MercyCare
WPS GHC-SW
Original Data
ContributorsNew data contributors added

CAUTION! • Please note that these slides are EXAMPLES of the type
of information that can be obtain by analyzing WHIO Administrative Claims Data.
• This type of high level analysis requires “deeper dives” into the details and ultimate causes.
• The analyzes provide directional information as to where to focus further analytic efforts.
• All of the analyzes are based entirely on medical and pharmacy claims submitted to payers by providers for services delivered.
Wisconsin Health Information Organization 6

Population Data • WHIO contains a vast amount of health care service data
(~ 250M claims; $66B billed) for Commercial, Medicaid, and Medicare Advantage populations – Condition-specific cost and utilization; Total Cost of Care – Service utilization per 1,000 population by Type of
Service (e.g. ER visits; MRIs) – Prescription drug utilization and prescribing patterns – Inpatient confinements, days per 1000, ALOS – Compliance with evidence-based quality process
measures – Stratification by geography; clinical condition; risk;
provider affiliation; age/gender; product
12/6/2012 Wisconsin Health Information Organization 7

WHIO Population-based Analysis and Total Cost of Care
Analyzing Populations and Health Risk
2/21/2013 Wisconsin Health Information Organization 8

WHIO DMV8 Retrospective Risk - Current Year, All Payers
Bayfield
Buffalo
Burnett
Crawford
Florence
Forest
Iron
Lafayette
Marquette
Menominee
Pepin
Rusk
Sawyer Washburn
0.72 La Crosse
0.74 Vernon
0.76 Trempealeau
0.80 Sauk
0.80 Iowa
0.82 Monroe
0.82 Grant
0.82 St Croix
0.84 Columbia
0.84 Green
0.84 Pierce
0.84 Door
0.85 Jefferson
0.85 Dane
0.88 Jackson
0.89 Richland
0.89 Walworth
0.92 Juneau
0.92 Polk
0.92 Washington
0.94 Rock
0.95 Dodge
0.95 Kewaunee
0.95 Dunn
0.95 Ozaukee
0.97 Outagamie
0.98 Waukesha
0.98 Sheboygan
0.99 Eau Claire
1.00 Calumet
1.01 Oconto
1.02 Shawano
1.02 Brown
1.02 Chippewa
1.02 Marinette
1.03 Kenosha
1.06 Fond Du Lac
1.06 Adams
1.06 Portage
1.07 Manitowoc
1.08 Barron
1.08 Green Lake
1.09 Ashland
1.09 Racine
1.09 Marathon
1.10 Taylor
1.10 Waupaca
1.12 Clark
1.13 Winnebago
1.13 Vilas
1.14 Oneida
1.15 Waushara
1.15 Wood
1.16 Langlade
1.16 Milwaukee
1.17 Douglas
1.18 Price
1.19 Lincoln
Retrospective Risk Range 0.72 to 0.90, 17 29.3% 0.90 to 1.00, 12 20.7% 1.00 to 1.05, 7 12.1% 1.05 to 1.13, 13 22.4% 1.13 to 1.20, 9 15.5% No data

WHIO DMV8 Commercial Population Retrospective Risk
Bayfield
Buffalo
Burnett
Crawford
Florence
Forest
Iron
Lafayette
Marquette
Menominee
Pepin
Rusk
Sawyer Washburn
0.59 La Crosse
0.63 Trempealeau
0.65 Vernon
0.70 Monroe
0.74 St Croix
0.78 Grant
0.81 Polk
0.83 Iowa
0.83 Jackson
0.85 Sauk
0.86 Barron
0.86 Pierce
0.88 Douglas
0.90 Eau Claire
0.90 Richland
0.91 Dunn
0.91 Shawano
0.91 Chippewa
0.92 Jefferson
0.92 Sheboygan
0.92 Oconto
0.92 Kewaunee
0.94 Juneau
0.94 Door
0.95 Taylor
0.95 Fond Du Lac
0.95 Brown
0.96 Dodge
0.96 Green
0.97 Walworth
0.97 Washington
0.98 Calumet
0.99 Outagamie
0.99 Columbia
0.99 Manitowoc
1.01 Waupaca
1.01 Adams
1.01 Ozaukee
1.01 Clark
1.02 Rock
1.03 Dane
1.03 Ashland
1.04 Price
1.04 Green Lake
1.04 Waukesha
1.05 Marathon
1.06 Marinette
1.08 Oneida
1.09 Langlade
1.10 Vilas
1.11 Wood
1.11 Winnebago
1.11 Milwaukee
1.12 Portage
1.12 Kenosha
1.13 Waushara
1.17 Lincoln
1.21 Racine
0.58 to 0.88 0.88 to 1.00 1.00 to 1.05 1.05 to 1.12 1.12 to 1.22 No data
12/6/2012 Wisconsin Health Information Organization 11
Bro
wn
Out
agam
ie
Win
neba
go
Fond
Du
Lac
Cal
umet
S
hebo
ygan
M
anito
woc
W
aupa
ca
Sha
wan
o M
arin
ette
O
cont
o W
aush
ara
Doo
r G
reen
Lak
e K
ewau
nee
Mar
atho
n W
ood
Ash
land
P
orta
ge
Linc
oln
One
ida
Pric
e V
ilas
Tayl
or
Lang
lade
M
ilwau
kee
Wau
kesh
a R
acin
e K
enos
ha
Was
hing
ton
Wal
wor
th
Jeffe
rson
O
zauk
ee
Dan
e R
ock
Dod
ge
Sau
k C
olum
bia
Gra
nt
Gre
en
Ric
hlan
d Ju
neau
Io
wa
Ada
ms
Ver
non
Eau
Cla
ire
La C
ross
e C
hipp
ewa
St.
Cro
ix
Bar
ron
Mon
roe
Dou
glas
C
lark
D
unn
Pol
k Tr
empe
alea
u P
ierc
e Ja
ckso
n
WI: NORTHEASTERN WI: NORTHERN WI: SOUTHEASTERN WI: SOUTHERN WI: WESTERN
0.0
0.1
0.2
0.3
0.4
0.5
0.6
0.7
0.8
0.9
1.0
0.0
0.1
0.2
0.3
0.4
0.5
0.6
0.7
0.8
0.9
1.0
Bro
wn
Out
agam
ie
Win
neba
go
Fond
Du
Lac
Cal
umet
S
hebo
ygan
M
anito
woc
W
aupa
ca
Sha
wan
o M
arin
ette
O
cont
o W
aush
ara
Doo
r G
reen
Lak
e K
ewau
nee
Mar
atho
n W
ood
Ash
land
P
orta
ge
Linc
oln
One
ida
Pric
e V
ilas
Tayl
or
Lang
lade
M
ilwau
kee
Wau
kesh
a R
acin
e K
enos
ha
Was
hing
ton
Wal
wor
th
Jeffe
rson
O
zauk
ee
Dan
e R
ock
Dod
ge
Sau
k C
olum
bia
Gra
nt
Gre
en
Ric
hlan
d Ju
neau
Io
wa
Ada
ms
Ver
non
Eau
Cla
ire
La C
ross
e C
hipp
ewa
St.
Cro
ix
Bar
ron
Mon
roe
Dou
glas
C
lark
D
unn
Pol
k Tr
empe
alea
u P
ierc
e Ja
ckso
n
WI: NORTHEASTERN WI: NORTHERN WI: SOUTHEASTERN WI: SOUTHERN WI: WESTERN
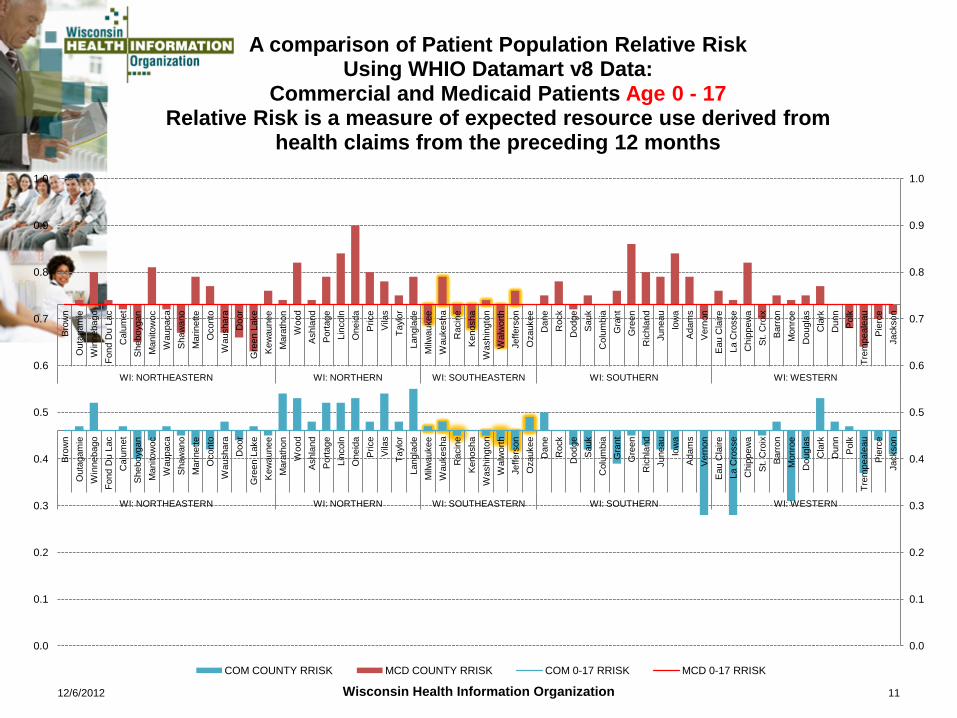
A comparison of Patient Population Relative Risk Using WHIO Datamart v8 Data:
Commercial and Medicaid Patients Age 0 - 17 Relative Risk is a measure of expected resource use derived from
health claims from the preceding 12 months
COM COUNTY RRISK MCD COUNTY RRISK COM 0-17 RRISK MCD 0-17 RRISK

2/21/2013 Wisconsin Health Information Organization 12
Western Region - Commercial members only
Member CountyNumber of Members
Actual Tota l Bi l led
ERG Retrospective Risk
Risk Index (vs . WI avg)
Actual Bi l led PMPM
Member Months
Risk Adj bi l led PMPM
LA CROSSE 51,438 $168,617,935 0.62 0.59 $300 561,949 $480
EAU CLAIRE 18,944 $88,218,334 0.95 0.90 $518 170,367 $546
CHIPPEWA 11,425 $64,834,500 0.97 0.91 $584 110,966 $603
CLARK 9,457 $60,190,133 1.07 1.01 $580 103,785 $541
MONROE 11,596 $45,257,263 0.74 0.70 $372 121,575 $500
BARRON 7,691 $41,523,981 0.91 0.86 $528 78,613 $582
TREMPEALEAU 10,566 $39,235,320 0.67 0.63 $351 111,812 $526
JACKSON 6,139 $33,039,177 0.88 0.83 $499 66,265 $564
ST. CROIX 8,063 $30,029,812 0.78 0.74 $447 67,202 $570
DUNN 5,782 $29,110,593 0.96 0.91 $532 54,688 $555
PIERCE 5,620 $27,902,124 0.91 0.86 $542 51,445 $595
POLK 4,892 $21,696,822 0.86 0.81 $477 45,530 $553
DOUGLAS 3,210 $13,320,571 0.93 0.88 $425 31,310 $455
Region total 154,823 $662,976,565 0.79 0.75 $421 1,575,507 $532
Southeastern Region - Commercial members onlyMILWAUKEE 200,043 $1,512,074,550 1.18 1.11 $749 2,018,291 $635
WAUKESHA 128,252 $944,325,530 1.11 1.04 $710 1,330,397 $642
RACINE 48,209 $413,448,371 1.28 1.21 $834 495,637 $650
WASHINGTON 43,661 $296,229,552 1.03 0.97 $650 455,589 $632
KENOSHA 29,468 $243,984,339 1.19 1.12 $816 299,028 $686
OZAUKEE 32,346 $239,594,349 1.07 1.01 $701 341,954 $655
JEFFERSON 32,380 $177,489,109 0.97 0.92 $554 320,364 $569
WALWORTH 26,663 $175,661,735 1.03 0.97 $670 262,104 $652
Region total 541,022 $4,002,807,534 1.13 1.07 $725 5,523,364 $640
Wiscosin Total 1,801,300 $11,301,546,514 1.06 1.00 $606 18,651,864 $572

Racine County: Drill down to Practice Level
2/21/2013 Wisconsin Health Information Organization 13
Family Practice LocationNumber of Providers
Number of Imputed Members
Overall Resource Use Index
Overall Quality Index
BURLINGTON 10 3,371 1.16 0.86
RACINE - EAST 7 3,301 1.12 0.89
SPRING STREET 7 3,242 1.02 0.77
UNION GROVE 3 1,369 1.20 0.96
FOUR MILE RD 3 1,046 1.16 0.97
RACINE - NORTH 2 702 1.08 0.91
BANKERS RD 2 688 1.12 0.89
WATERFORD 2 683 1.14 0.93
DRS SC 2 458 1.11 0.84

Drill down to Service Categories: Overall Resource Use Index
2/21/2013 Wisconsin Health Information Organization 14
ERHospital Services Laboratory Pharmacy
Primary Care Core Radiology
Specialty Care Summary
DR. A 1.55 1.89 1.44 1.00 1.18 2.17 1.41 1.49 DR. B 1.26 1.17 1.04 1.06 1.17 1.61 1.08 1.16 DR. C 1.15 1.36 1.13 1.26 1.13 1.28 1.11 1.21 DR. D 0.94 1.01 1.05 1.50 0.92 0.91 0.86 1.02 DR. E 1.02 1.38 0.99 1.09 1.09 1.26 1.22 1.21 DR. F 0.51 1.06 1.22 0.66 0.88 1.90 1.46 1.19 DR.G 1.62 1.11 0.74 0.66 0.89 1.37 0.99 0.98 DR. H 1.44 1.11 1.15 0.56 0.93 1.26 1.18 1.04 DR. I 0.57 1.11 1.23 2.20 0.81 1.66 1.21 1.32 DR. J 0.90 1.44 1.45 1.36 0.98 1.64 1.18 1.30 DR. K 0.54 1.54 1.41 1.47 0.84 1.56 1.28 1.33
1.11 1.35 1.20 1.14 0.99 1.49 1.17 1.21
BURLINGTON
BURLINGTON

DRIVERS OF HEALTH CARE COSTS
Wisconsin Health Information Organization 15
12/6/2012 Wisconsin Health Information Organization 16
$ M
$100 M
$200 M
$300 M
$400 M
$500 M
$600 M
Neo
nate
s
Men
tal H
ealth
Oth
er E
NT
infla
mm
atio
n in
fect
ion
Dep
ress
ion
Frac
ture
s an
d D
islo
catio
ns
Oth
er In
fect
ions
and
Infla
mm
ator
y D
isea
se o
f CN
S Otit
is M
edia
Infe
ctio
ns/in
flam
mat
ions
of t
he G
I sy
stem
Con
geni
tal D
isor
der,
Car
diac
Infla
mm
atio
n/In
fect
ion
of s
kin
Asth
ma
Burn
s, tr
aum
a of
ski
n
Pneu
mon
ia
Orth
oped
ic d
efor
mity
Trau
ma,
Bra
in/S
pina
l
Sinu
sitis
Dis
ease
s of
ora
l cav
ity
Oth
er In
fect
ious
Dis
ease
s
Endo
crin
e di
sord
er
Infe
ctio
ns o
f Gen
itour
inar
y tra
ct
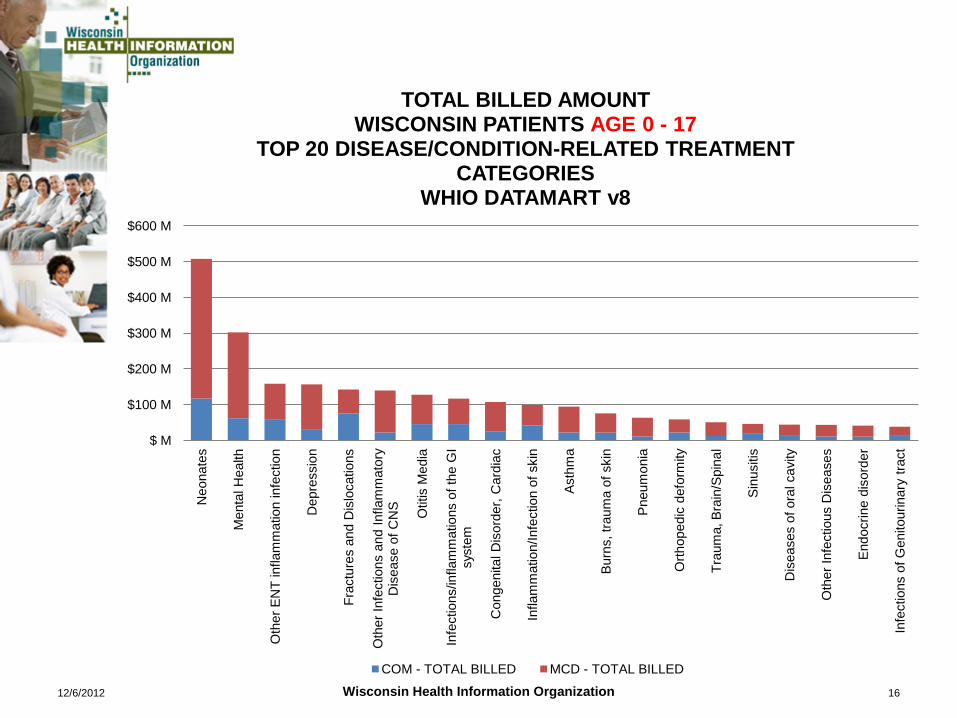
TOTAL BILLED AMOUNT WISCONSIN PATIENTS AGE 0 - 17
TOP 20 DISEASE/CONDITION-RELATED TREATMENT CATEGORIES
WHIO DATAMART v8
COM - TOTAL BILLED MCD - TOTAL BILLED

$1.5
B
$1.4
B
$2.3
B
$1.8
B
$851
M
$840
M
$105
7 M
$530
M
$351
M
$702
M
$494
M
$425
M
$628
M
$304
M
$255
M
$211
M
$423
M
$301
M
$247
M
$264
M
$275
M
$90
M
$0 B
$1 B
$2 B
$3 B
$4 B
$5 B O
rthop
edic
s an
d R
heum
atol
ogy
Car
diol
ogy
Psy
chia
try
Neu
rolo
gy
Gas
troen
tero
logy
End
ocrin
olog
y
Pul
mon
olog
y
Oto
lary
ngol
ogy
Gyn
ecol
ogy
Obs
tetri
cs
Pre
vent
ativ
e an
d A
dmin
istra
tive
Der
mat
olog
y
Nep
hrol
ogy
Uro
logy
Hem
atol
ogy
Oph
thal
mol
ogy
Neo
nato
logy
Infe
ctio
us D
isea
ses
Hep
atol
ogy
Che
mic
al D
epen
denc
y
Late
Effe
cts,
Env
ironm
enta
l …
Isol
ated
Sig
ns a
nd S
ympt
oms
TOTAL STANDARD COST BY MAJOR PRACTICE CATEGORY
COMMERCIAL MEDICAID MEDICARE

$190,924,001
$154,224,186
$101,762,540 $91,695,383 $82,138,289
$0 M
$50 M
$100 M
$150 M
$200 M
$250 M P
sych
otic
& s
chiz
ophr
enic
…
Moo
d di
sord
er, d
epre
ssed
Moo
d di
sord
er, b
ipol
ar
Atte
ntio
n de
ficit
diso
rder
Oth
er n
euro
psyc
holo
gica
l or …
Men
tal r
etar
datio
n
Dem
entia
Aut
ism
& c
hild
psy
chos
es
Org
anic
dru
g or
met
abol
ic …
Dev
elop
men
t dis
orde
r
Anx
iety
dis
orde
r or p
hobi
as
Ong
oing
Rx
Tx w
o P
rov …
Ong
oing
Rx
Tx w
o P
rov …
Psy
chia
tric
dise
ases
sig
ns …
Eat
ing
diso
rder
Ong
oing
Rx
Tx w
o P
rov …
Per
sona
lity
diso
rder
Som
atof
orm
dis
orde
r
Psy
chos
exua
l dis
orde
r
Ong
oing
Rx
Tx w
o P
rov …
TOTAL STANDARD COST FOR PSYCHIATRY ETGs MEDICAID ONLY, BY TYPE OF SERVICE
Ancillary Facility Inpatient Facility Outpatient Pharmacy Professional Services

Ancillary $57.0 M
7%
Facility Inpatient $185.1 M
22%
Facility Outpatient $43.9 M
5%
Pharmacy $201.9 M
24%
Professional Services $358.3 M
42%
TOTAL STANDARD COST FOR ALL PSYCHIATRY ETGs MEDICAID ONLY, BY TYPE OF SERVICE

Behavioral Health 43%
Other Providers 17%
Home Care 10%
Other Professional
Providers 8%
Psychiatry 7%
Primary Care Specialties
6%
Rehabilitative Services
2%
Nursing Service
Providers 2%
Emergency Medicine
2%
Laboratory 1%
Physicians Assistant
1%
Neurology 0%
All other professionals
1%
TOTAL STANDARD COST FOR ALL PSYCHIATRY ETGs MEDICAID ONLY, BY SERVICE PROVIDER SPECIALTY

Wisconsin Medicaid population (all ages) Disease Prevalence Total Billed cost of care and condition-related treatment
Facility Inpatient
Facility Outpatient Ancillary
Professional Services Pharmacy Total
Depression115,557 $3.2 B
Total Billed PMPM $584 $487 $148 $834 $329 $2,382Disease-related $67 $41 $8 $142 $107 $366 15%
Diabetes65,350 $2.5 B
Total Billed PMPM $1,065 $773 $293 $980 $319 $3,431Disease-related $90 $68 $30 $110 $98 $395 12%
Hypertension81,512 $3.8 B
Total Billed PMPM $1,346 $987 $324 $1,219 $220 $4,096Disease-related $26 $67 $10 $85 $18 $206 5%
Asthma40,023 $977.0 M
Total Billed PMPM $436 $512 $153 $777 $218 $2,097Disease-related $30 $70 $24 $80 $66 $271 13%
Back and Spine, pain or condition54,160 $1.7 B
Total Billed PMPM $580 $689 $165 $1,098 $239 $2,772Disease-related $85 $151 $9 $279 $37 $562 20%
# of Members with Condition
Total Billed - all care for Member
Disease-related Billed Amount% of Billed that is Condition-
related
Wisconsin Health Information Organization 21

Wisconsin Health Information Organization 22
-
10.00
20.00
30.00
40.00
50.00
60.00
70.00 B
row
n C
alum
et
Doo
r Fo
nd D
u La
c G
reen
Lak
e K
ewau
nee
Man
itow
oc
Mar
inet
te
Oco
nto
Out
agam
ie
Sha
wan
o S
hebo
ygan
W
aupa
ca
Wau
shar
a W
inne
bago
A
shla
nd
Lang
lade
Li
ncol
n M
arat
hon
One
ida
Por
tage
P
rice
Tayl
or
Vila
s W
ood
Jeffe
rson
K
enos
ha
Milw
auke
e O
zauk
ee
Rac
ine
Wal
wor
th
Was
hing
ton
Wau
kesh
a A
dam
s C
olum
bia
Dan
e D
odge
G
rant
G
reen
Io
wa
June
au
Ric
hlan
d R
ock
Sau
k V
erno
n B
arro
n C
hipp
ewa
Cla
rk
Dou
glas
D
unn
Eau
Cla
ire
Jack
son
La C
ross
e M
onro
e P
ierc
e P
olk
St.
Cro
ix
Trem
peal
eau
WI: NORTHEASTERN WI: NORTHERN WI: SOUTHEASTERN WI: SOUTHERN WI: WESTERN
INCIDENCE PER 1,000 POPULATION PATIENTS AGE 0 - 17 WITH INDICATION OF ASTHMA
WHIO DATAMART v8
COM MCD COM - REGION MCD - REGION
COM - STATEWIDE MCD - STATEWIDE STATEWIDE AVG

Wisconsin Health Information Organization 23
-
5.00
10.00
15.00
20.00
25.00
30.00
35.00
40.00
45.00
50.00 B
row
n C
alum
et
Doo
r Fo
nd D
u La
c G
reen
Lak
e K
ewau
nee
Man
itow
oc
Mar
inet
te
Oco
nto
Out
agam
ie
Sha
wan
o S
hebo
ygan
W
aupa
ca
Wau
shar
a W
inne
bago
A
shla
nd
Lang
lade
Li
ncol
n M
arat
hon
One
ida
Por
tage
P
rice
Tayl
or
Vila
s W
ood
Jeffe
rson
K
enos
ha
Milw
auke
e O
zauk
ee
Rac
ine
Wal
wor
th
Was
hing
ton
Wau
kesh
a A
dam
s C
olum
bia
Dan
e D
odge
G
rant
G
reen
Io
wa
June
au
Ric
hlan
d R
ock
Sau
k V
erno
n B
arro
n C
hipp
ewa
Cla
rk
Dou
glas
D
unn
Eau
Cla
ire
Jack
son
La C
ross
e M
onro
e P
ierc
e P
olk
St.
Cro
ix
Trem
peal
eau
WI: NORTHEASTERN WI: NORTHERN WI: SOUTHEASTERN
WI: SOUTHERN WI: WESTERN
INCIDENCE PER 1,000 POPULATION PATIENTS AGE 0 - 17 WITH INDICATION OF DEPRESSION
WHIO DATAMART v8
COM MCD COM - REGION MCD - REGION
COM - STATEWIDE MCD - STATEWIDE STATEWIDE AVG
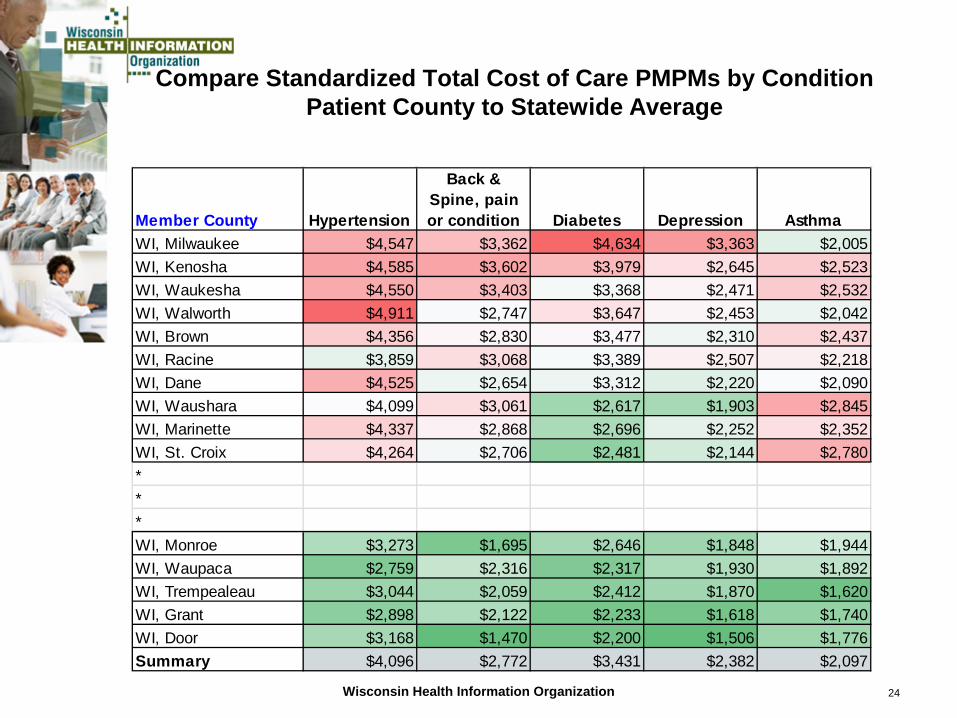
Compare Standardized Total Cost of Care PMPMs by Condition Patient County to Statewide Average
Member County Hypertension
Back & Spine, pain or condition Diabetes Depression Asthma
WI, Milwaukee $4,547 $3,362 $4,634 $3,363 $2,005 WI, Kenosha $4,585 $3,602 $3,979 $2,645 $2,523 WI, Waukesha $4,550 $3,403 $3,368 $2,471 $2,532 WI, Walworth $4,911 $2,747 $3,647 $2,453 $2,042 WI, Brown $4,356 $2,830 $3,477 $2,310 $2,437 WI, Racine $3,859 $3,068 $3,389 $2,507 $2,218 WI, Dane $4,525 $2,654 $3,312 $2,220 $2,090 WI, Waushara $4,099 $3,061 $2,617 $1,903 $2,845 WI, Marinette $4,337 $2,868 $2,696 $2,252 $2,352 WI, St. Croix $4,264 $2,706 $2,481 $2,144 $2,780 ***WI, Monroe $3,273 $1,695 $2,646 $1,848 $1,944 WI, Waupaca $2,759 $2,316 $2,317 $1,930 $1,892 WI, Trempealeau $3,044 $2,059 $2,412 $1,870 $1,620 WI, Grant $2,898 $2,122 $2,233 $1,618 $1,740 WI, Door $3,168 $1,470 $2,200 $1,506 $1,776 Summary $4,096 $2,772 $3,431 $2,382 $2,097
Wisconsin Health Information Organization 24

COMPLIANCE WITH EVIDENCE-BASED STANDARDS OF CARE
Wisconsin Health Information Organization 25

12/6/2012 Wisconsin Health Information Organization 26
0.0%
10.0%
20.0%
30.0%
40.0%
50.0%
60.0%
70.0%
80.0%
90.0%
100.0% N
OR
THEA
STER
N
NO
RTH
ERN
SOU
THEA
STER
N
SOU
THER
N
WES
TER
N
NO
RTH
EAST
ERN
NO
RTH
ERN
SOU
THEA
STER
N
SOU
THER
N
WES
TER
N
NO
RTH
EAST
ERN
NO
RTH
ERN
SOU
THEA
STER
N
SOU
THER
N
WES
TER
N
NO
RTH
EAST
ERN
NO
RTH
ERN
SOU
THEA
STER
N
SOU
THER
N
WES
TER
N
NO
RTH
EAST
ERN
NO
RTH
ERN
SOU
THEA
STER
N
SOU
THER
N
WES
TER
N
NO
RTH
EAST
ERN
NO
RTH
ERN
SOU
THEA
STER
N
SOU
THER
N
WES
TER
N
NO
RTH
EAST
ERN
NO
RTH
ERN
SOU
THEA
STER
N
SOU
THER
N
WES
TER
N
Pt(s) 5 - 40 yrs of age that had an OV for asthma care in
last 12 rpt mos.
Pt(s) betw the ages of 10 and 17 w/
presumed persistent asthma using an inhaled corticosteroid or
acceptable alternative.
Pt(s) between the ages of 5 and 9 with presumed
persistent asthma using an inhaled corticosteroid or
acceptable alternative.
Pt(s) compl w/ presc inhaled
glucocorticoids (minimum
compliance 70%).
Pt(s) compl w/ presc leukotriene
modifier (minimum compliance 70%).
Pt(s) exhibiting problematic asthma
control who had pulmonary or
allergy consult in last 12 rpt mos.
Pt(s) w/ an asthma related hosp or ER encounter in last 3
rpt mos or freq using SABA
inhalers that had an OV in last 3 rpt
mos.
ASTHMA PROCESS QUALITY MEASURES BY PATIENT REGION WISCONSIN COMMERCIAL AND MEDICAID PATIENTS AGE 0-17
WHIO DATAMART v8
COMMERCIAL MEDICAID

Wisconsin Health Information Organization 27
88.4%
37.7%
79.8% 81.5% 82.4%
41.4%
72.6% 69.7%
0.0%
10.0%
20.0%
30.0%
40.0%
50.0%
60.0%
70.0%
80.0%
90.0%
100.0%
Pt(s) 18 - 75 yrs of age that had a HbA1c test in last 12
reported mos.
Pt(s) 18 - 75 yrs of age that had an annual screening test
for diabetic retinopathy.
Pt(s) 18 - 75 yrs of age that had annual screening for
nephropathy or evidence of nephropathy.
Pt(s) 18 - 75 yrs of age with a LDL cholesterol in last 12
mos.
Comparison of Compliance with Diabetes Managment National Standard Measures
COMMERCIAL MEDICAID
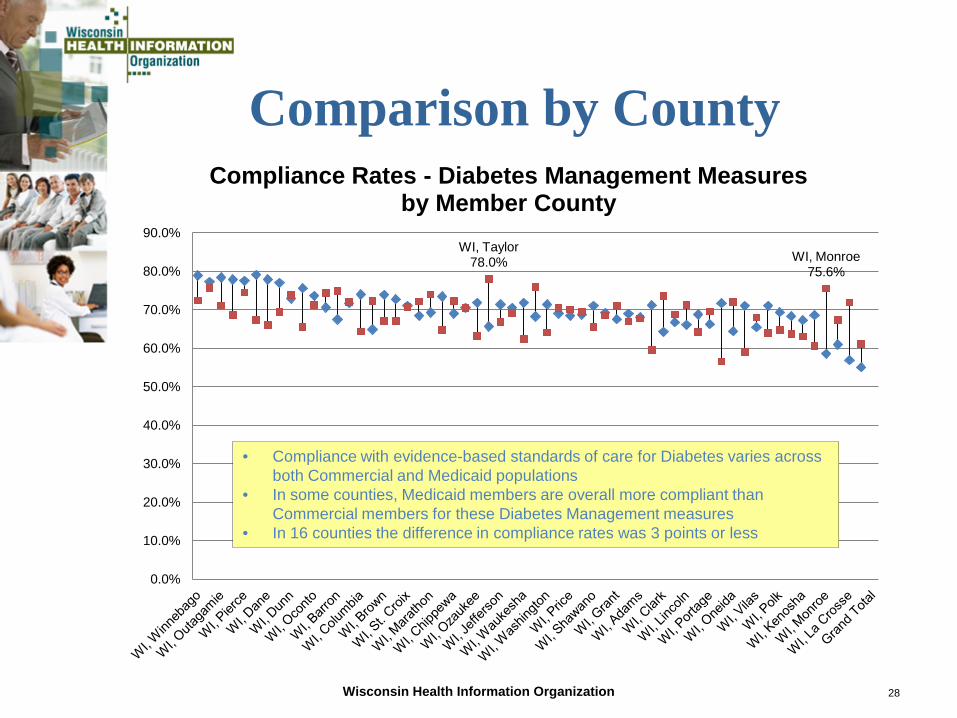
Comparison by County
Wisconsin Health Information Organization 28
WI, Taylor 78.0% WI, Monroe
75.6%
0.0%
10.0%
20.0%
30.0%
40.0%
50.0%
60.0%
70.0%
80.0%
90.0%
Compliance Rates - Diabetes Management Measures by Member County
• Compliance with evidence-based standards of care for Diabetes varies across both Commercial and Medicaid populations
• In some counties, Medicaid members are overall more compliant than Commercial members for these Diabetes Management measures
• In 16 counties the difference in compliance rates was 3 points or less

Medicaid Diabetics are Higher Risk
Wisconsin Health Information Organization 29
20%
6%
29%
20%
0%
5%
10%
15%
20%
25%
30%
35%
Lowest risk Highest risk
Diabetic Members Risk Distrubtion
Commercial Diabetics Medicaid Diabetics

Both populations have incidence of Diabetes with Depression
Wisconsin Health Information Organization 30
10,052 14,691
0
10,000
20,000
30,000
40,000
50,000
60,000
70,000
COM Diabetics MCD Diabetics
Diabetes with Depression
no indication of Depression also has Depression
• 15% of COM diabetics have indication of depression
• 23% of MCD diabetics have indication of depression
$0 M
$20 M
$40 M
$60 M
$80 M
$100 M
$120 M
Dia
bete
s
Moo
d di
sord
er, d
epre
ssed
Atte
ntio
n de
ficit
diso
rder
Ast
hma
Hyp
erlip
idem
ia, o
ther
Hyp
erte
nsio
n
Mul
tiple
scl
eros
is
Moo
d di
sord
er, b
ipol
ar
Join
t deg
ener
atio
n, lo
caliz
ed
Psy
chot
ic &
sch
izop
hren
ic …
Infla
mm
atio
n of
eso
phag
us
Adu
lt rh
eum
atoi
d ar
thrit
is
Infla
mm
ator
y bo
wel
dis
ease
Isch
emic
hea
rt di
seas
e
Epi
leps
y
Pso
riasi
s
Con
trace
ptiv
e m
anag
emen
t
Oth
er n
euro
psyc
holo
gica
l or …
Acn
e
Mig
rain
e he
adac
he
Chr
onic
obs
truct
ive
pulm
onar
y …
Chr
onic
sin
usiti
s
Anx
iety
dis
orde
r or p
hobi
as
AID
S
Hem
ophi
lia
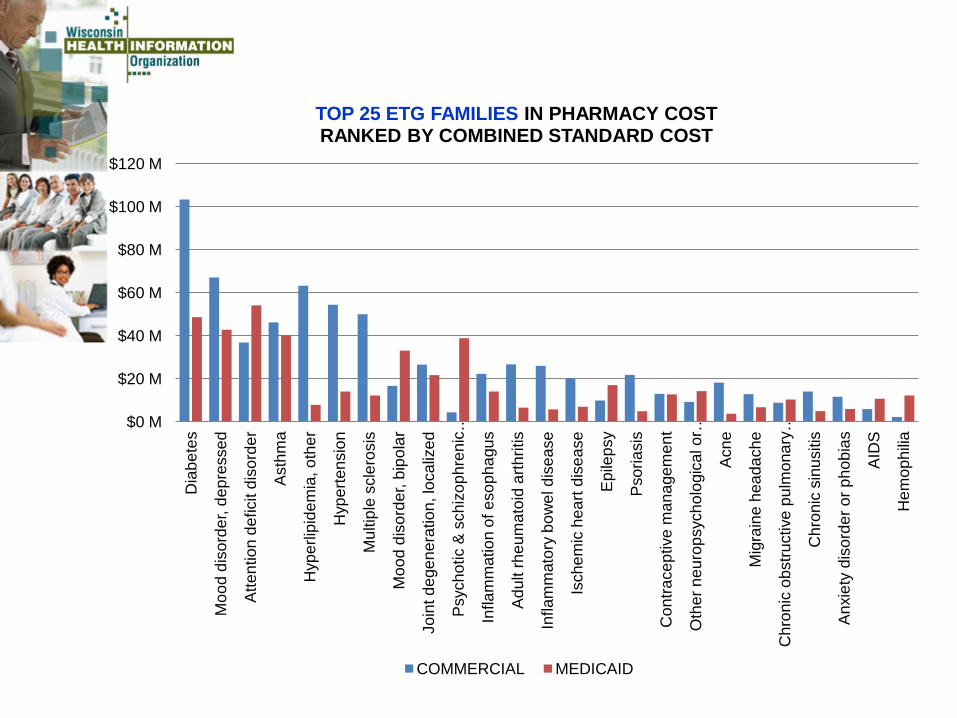
TOP 25 ETG FAMILIES IN PHARMACY COST RANKED BY COMBINED STANDARD COST
COMMERCIAL MEDICAID

LEVERAGING VALUE-BASED PURCHASING
Wisconsin Health Information Organization 32

Family Practice
0.9
0.95
1
1.05
1.1
0.8 0.85 0.9 0.95 1 1.05 1.1 1.15 1.2
OVE
RAL
L Q
UAL
ITY
IND
EX
OVERALL STANDARD COST INDEX
PROVIDER NETWORK ASSESSMENT FAMILY PRACTICE PEER GROUP DATAMART RELEASE OCTOBER 2011
MILWAUKEE, RACINE, AND WAUKESHA COUNTY HEALTH SYSTEM PROVIDERS
WHEATON FRANCISCAN HEALTHCARE - SOUTHEAST WISCONSIN INC AMG AURORA MEDICAL GROUP CORPORATE OFFICE AURORA ADVANCED HEALTHCARE INC COLUMBIA ST MARYS INC - COLUMBIA CAMPUS FROEDTERT HEALTH PROHEALTH SOLUTIONS LLC
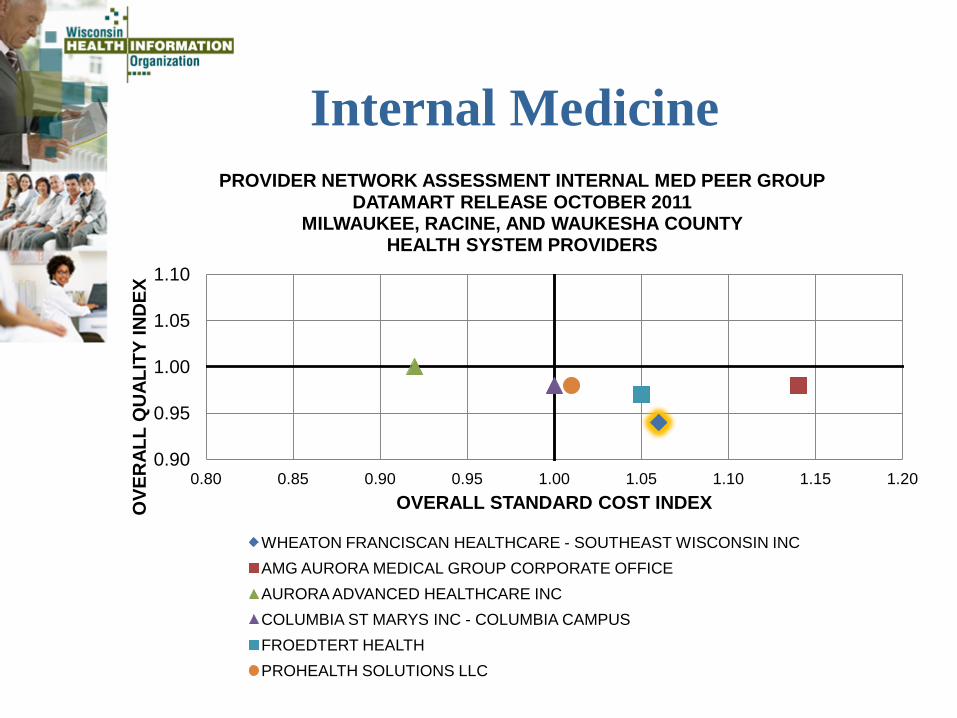
Internal Medicine
0.90
0.95
1.00
1.05
1.10
0.80 0.85 0.90 0.95 1.00 1.05 1.10 1.15 1.20
OVE
RAL
L Q
UAL
ITY
IND
EX
OVERALL STANDARD COST INDEX
PROVIDER NETWORK ASSESSMENT INTERNAL MED PEER GROUP DATAMART RELEASE OCTOBER 2011
MILWAUKEE, RACINE, AND WAUKESHA COUNTY HEALTH SYSTEM PROVIDERS
WHEATON FRANCISCAN HEALTHCARE - SOUTHEAST WISCONSIN INC AMG AURORA MEDICAL GROUP CORPORATE OFFICE AURORA ADVANCED HEALTHCARE INC COLUMBIA ST MARYS INC - COLUMBIA CAMPUS FROEDTERT HEALTH PROHEALTH SOLUTIONS LLC

Wheaton Family Practice Peers by Location
0.80
0.85
0.90
0.95
1.00
1.05
1.10
0.80 0.90 1.00 1.10 1.20 1.30 1.40 1.50 1.60
WHIO DATA MART RELEASE OCTOBER 2011 PROVIDER NETWORK ASSESSMENT
Bubble size relates to # of Episodes at the location
METRO PHYSICIANS WHEATON FRANCISCAN HEALTHCARE WHEATON FRANCISCAN MEDICAL GROUP
Wheaton Franciscan Medical Group – Rawson Medical Clinic
Wheaton Franciscan Healthcare – All Saints Spring Street Campus

Rawson Medical Clinic - Quality
0.90
0.95
1.00
1.05
1.10 P
t(s) t
akin
g an
NS
AID
med
.
Pt(s
) tha
t had
a s
erum
cr
eatin
ine
in la
st 1
2 rp
t mos
.
Pt(s
) tha
t had
an
annu
al
phys
icia
n vi
sit.
Pt(s
) tha
t had
a s
inus
CT
or
MR
I tes
t.
Pt(s
) tha
t had
a s
inus
ra
diog
raph
ic te
st.
Pt(s
) w/ a
HD
L ch
oles
tero
l te
st in
last
12
rpt m
os.
Pt(s
) w/ a
LD
L ch
oles
tero
l te
st in
last
12
rpt m
os.
Pt(s
) w/ a
trig
lyce
ride
test
in
last
12
rpt m
os.
Pt(s
) 18
- 75
yrs
of a
ge th
at
had
an a
nnua
l scr
eeni
ng
test
for d
iabe
tic re
tinop
athy
.
Pt(s
) 18
- 75
yrs
of a
ge th
at
had
annu
al s
cree
ning
for
neph
ropa
thy
or e
vide
nce …
Pt(s
) 18
- 75
yrs
of a
ge w
ith
a LD
L ch
oles
tero
l in
last
12
mos
.
HTN Sinusitis, Acute Hyperlipidemia Diabetes (NS)
Wheaton Franciscan Medical Group - Rawson Medical Clinic Quality Index for top volume process measures
Quality Index Peer group average

Rawson Medical Clinic - Cost
0.00 0.20 0.40 0.60 0.80 1.00 1.20 1.40
Hyp
erte
nsio
n
Hyp
erlip
idem
ia, o
ther
Acu
te b
ronc
hitis
Acu
te s
inus
itis,
w/o
su
rger
y To
nsill
itis,
ade
noid
itis
or
phar
yngi
tis, w
/o s
urge
ry
Otit
is m
edia
, w/o
sur
gery
Dia
bete
s, w
/o s
urge
ry
Hyp
o-fu
nctio
ning
thyr
oid
glan
d, w
/o s
urge
ry
Moo
d di
sord
er,
depr
esse
d
Ast
hma
Infe
ctio
n of
low
er
geni
tour
inar
y sy
stem
, …
Oth
er m
inor
orth
oped
ic
diso
rder
s - b
ack
Nut
ritio
nal d
efic
ienc
y,
w/o
sur
gery
A
nxie
ty d
isor
der o
r ph
obia
s
Bac
teria
l inf
ectio
n of
ski
n
Wheaton Franciscan Medical Group - Rawson Medical Clinic Total Standard Cost Index by top volume ETGs
Total Std Cost Index Peer Group Avg

All Saints Spring St. - Quality
0.00
0.20
0.40
0.60
0.80
1.00
1.20 Pt
(s) t
hat h
ad a
sin
us C
T or
MR
I te
st.
Pt(s
) tha
t had
a s
inus
ra
diog
raph
ic te
st.
Pt(s
) tak
ing
an N
SAID
med
.
Pt(s
) tha
t had
an
annu
al p
hysi
cian
vi
sit.
Pt(s
) tha
t had
a s
erum
cre
atin
ine
in la
st 1
2 rp
t mos
.
Pt(s
) w/ a
dx
of U
RI t
hat d
id n
ot
have
a p
resc
for a
n ab
x on
or 3
dy
s af
ter t
he in
itiat
ing
visi
t.
Pt(s
) tha
t had
a b
lood
glu
cose
te
st in
last
12
rpt m
os.
Adul
t(s) w
/ a H
DL
chol
este
rol t
est
in la
st 1
2 rp
t mos
.
Adul
t(s) w
/ a L
DL
chol
este
rol t
est
in la
st 1
2 rp
t mos
.
Adul
t(s) w
/ a tr
igly
cerid
e te
st in
la
st 1
2 rp
t mos
.
Pt(s
) 16
- 24
yrs
of a
ge th
at h
ad a
ch
lam
ydia
scr
eeni
ng te
st in
last
12
rpt m
os.
Pt(s
) 18
- 75
yrs
of a
ge th
at h
ad
an a
nnua
l scr
eeni
ng te
st fo
r di
abet
ic re
tinop
athy
. Pt
(s) 1
8 - 7
5 yr
s of
age
that
had
an
nual
scr
eeni
ng fo
r nep
hrop
athy
or
evi
denc
e of
nep
hrop
athy
.
Pt(s
) 18
- 75
yrs
of a
ge w
ith a
LD
L ch
oles
tero
l in
last
12
mos
.
Sinusitis, Acute HTN URI (NS) Obesity and Overweight Chlamydia Scrn (NS) Diabetes (NS)
Wheaton Franciscan Healthcare - All Saints Spring Street Campus Quality Index for top volume process measures
Quality Index Peer Group Average
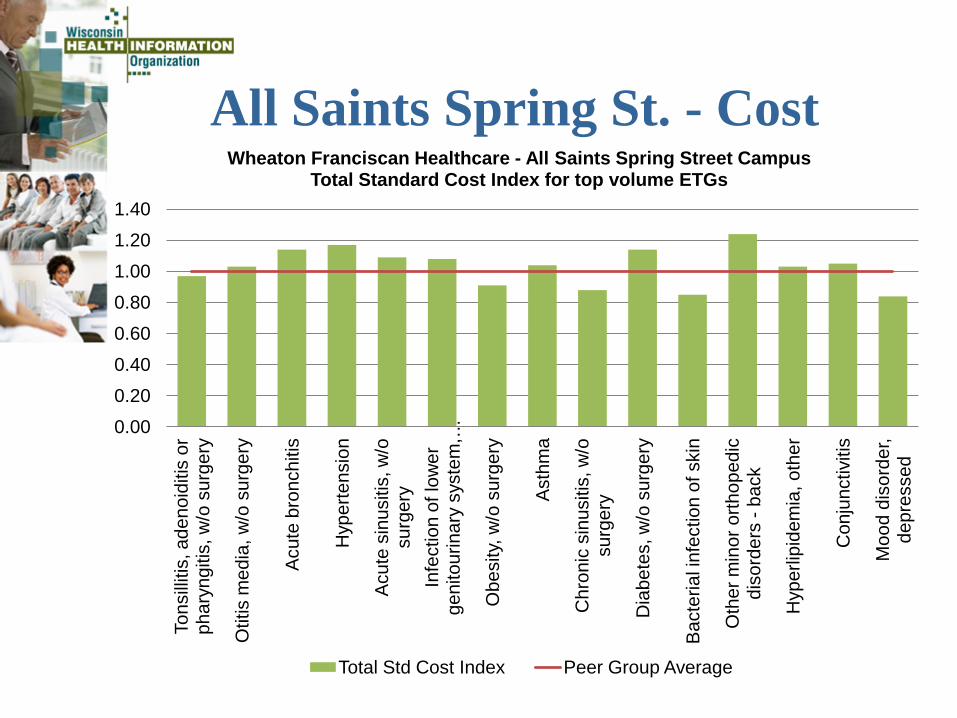
All Saints Spring St. - Cost
0.00
0.20
0.40
0.60
0.80
1.00
1.20
1.40 To
nsill
itis,
ade
noid
itis
or
phar
yngi
tis, w
/o s
urge
ry
Otit
is m
edia
, w/o
sur
gery
Acu
te b
ronc
hitis
Hyp
erte
nsio
n
Acu
te s
inus
itis,
w/o
su
rger
y In
fect
ion
of lo
wer
ge
nito
urin
ary
syst
em, …
Obe
sity
, w/o
sur
gery
Ast
hma
Chr
onic
sin
usiti
s, w
/o
surg
ery
Dia
bete
s, w
/o s
urge
ry
Bac
teria
l inf
ectio
n of
ski
n
Oth
er m
inor
orth
oped
ic
diso
rder
s - b
ack
Hyp
erlip
idem
ia, o
ther
Con
junc
tiviti
s
Moo
d di
sord
er,
depr
esse
d
Wheaton Franciscan Healthcare - All Saints Spring Street Campus Total Standard Cost Index for top volume ETGs
Total Std Cost Index Peer Group Average

All Saints Spring St - Providers
0.6
0.7
0.8
0.9
1
1.1
1.2
1.3
1.4
0.60 0.70 0.80 0.90 1.00 1.10 1.20 1.30 1.40
Ove
rall
Qua
lity
Inde
x
Overall Std Cost Index
Wheaton Franciscan Healthcare - All Saints Spring Street Campus Family Practice Peer Group
Individual Provider Cost and Quality Indices
Above Avg Std Cost, Statistically significant Std Cost Index, no statistical significance Below Avg Std Cost, Statistically significant
WHIO ETF Analysis
ETF Member Comparisons to WHIO Commercial and WI Medicaid
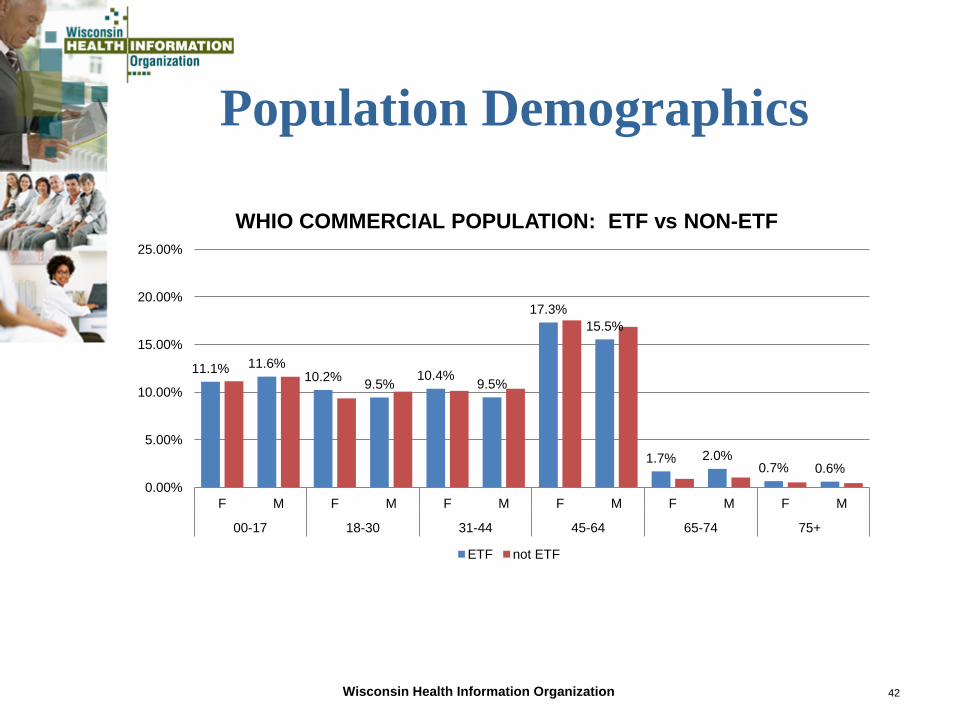
Population Demographics
Wisconsin Health Information Organization 42
11.1% 11.6% 10.2% 9.5% 10.4% 9.5%
17.3% 15.5%
1.7% 2.0% 0.7% 0.6%
0.00%
5.00%
10.00%
15.00%
20.00%
25.00%
F M F M F M F M F M F M
00-17 18-30 31-44 45-64 65-74 75+
WHIO COMMERCIAL POPULATION: ETF vs NON-ETF
ETF not ETF

Episode-based analysis using Episode Treatment Groups (ETGs)
ETGs are a basic illness classification methodology that combine medical and pharmacy services into mutually exclusive and exhaustive categories — they provide a medically meaningful statistical unit representing a complete episode of care.
Wisconsin Health Information Organization 43

ETF Members Total Billed and Episode Volume
by Major Practice Category
Wisconsin Health Information Organization 44
$448,657,443
$261,687,461
$198,681,549
0
20,000
40,000
60,000
80,000
100,000
120,000
140,000
160,000
180,000
200,000
$ M
$50 M
$100 M
$150 M
$200 M
$250 M
$300 M
$350 M
$400 M
$450 M
$500 M
# of
Epi
sode
s
Tota
l Bill
ed
Total Billed # of Episodes
There are over 800 Episode Treatment Groups (ETGs); they are grouped into clinical Major Practice Categories

Proportion of Total Billed Charges ETF vs. Non-ETF Comparison
by Major Practice Category
Wisconsin Health Information Organization 45
21.7
%
9.9%
9.5%
5.9%
5.8%
5.7%
5.2%
3.8%
4.8%
4.1%
4.1%
3.6%
3.7%
2.2%
2.7%
1.8%
1.4%
1.2%
1.1%
0.7%
0.5%
0.4%
0.00%
5.00%
10.00%
15.00%
20.00%
25.00%
30.00%
Orth
oped
ics
and
Rhe
umat
olog
y
Car
diol
ogy
Gas
troen
tero
logy
Endo
crin
olog
y
Gyn
ecol
ogy
Neu
rolo
gy
Oto
lary
ngol
ogy
Pulm
onol
ogy
Psyc
hiat
ry
Prev
enta
tive
and
Adm
inis
trativ
e
Der
mat
olog
y
Uro
logy
Obs
tetri
cs
Hem
atol
ogy
Oph
thal
mol
ogy
Hep
atol
ogy
Neo
nato
logy
Nep
hrol
ogy
Infe
ctio
us D
isea
ses
Che
mic
al D
epen
denc
y
Late
Effe
cts,
Env
ironm
enta
l Tra
uma
and
Pois
onin
gs
Isol
ated
Sig
ns a
nd S
ympt
oms
ETF non ETF Commercial
Ranking and relative proportion of total charges is consistent between ETF and non-ETF Commercial populations
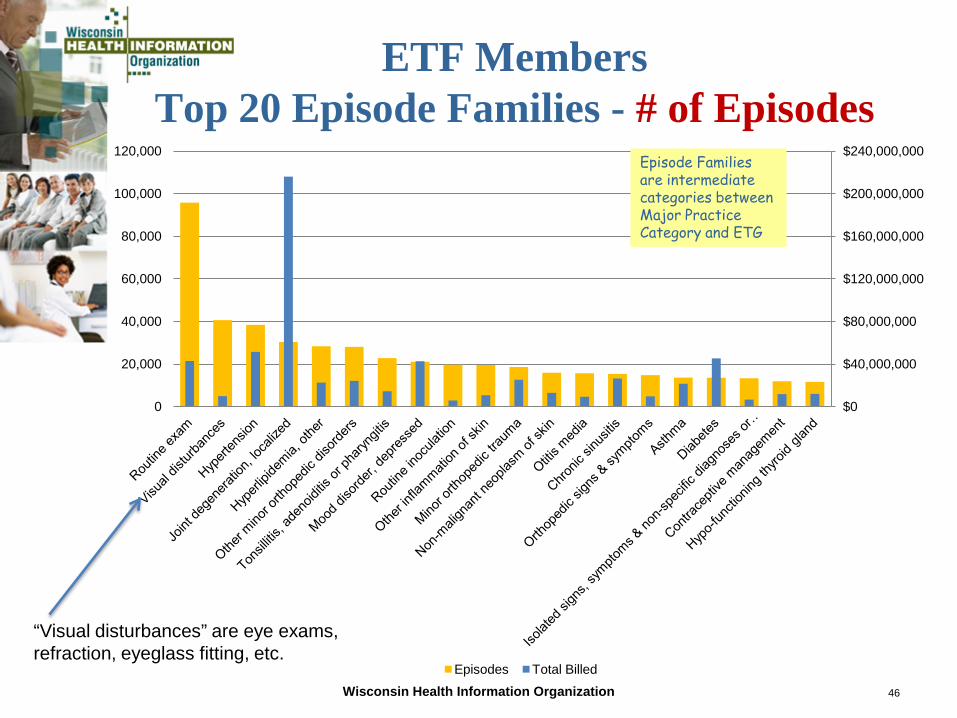
ETF Members Top 20 Episode Families - # of Episodes
Wisconsin Health Information Organization 46
$0
$40,000,000
$80,000,000
$120,000,000
$160,000,000
$200,000,000
$240,000,000
0
20,000
40,000
60,000
80,000
100,000
120,000
Episodes Total Billed
Episode Families are intermediate categories between Major Practice Category and ETG
“Visual disturbances” are eye exams, refraction, eyeglass fitting, etc.
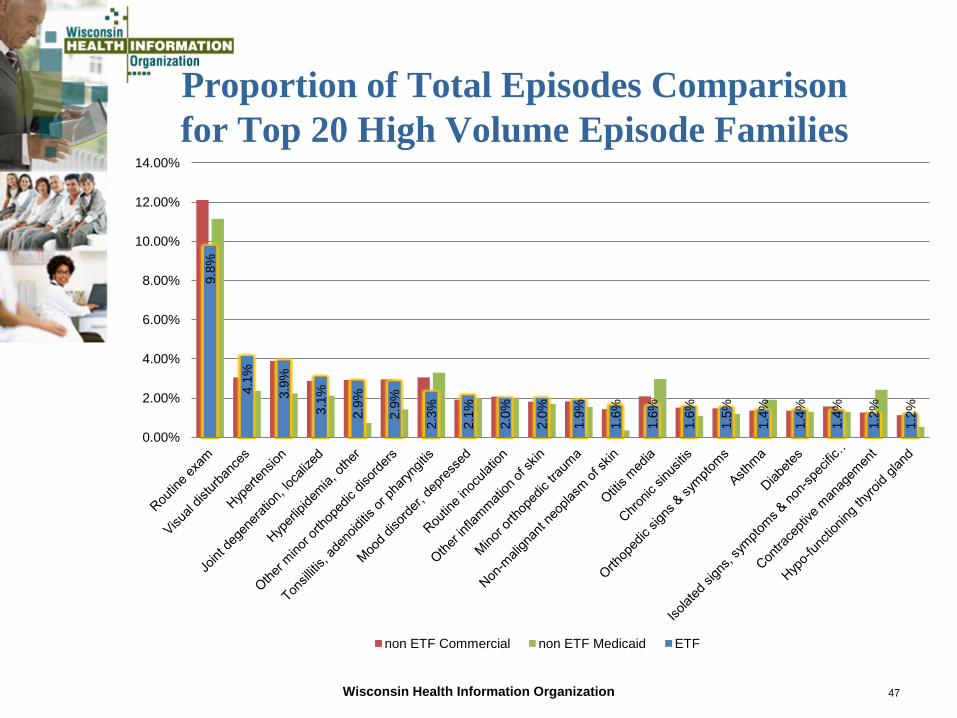
Proportion of Total Episodes Comparison for Top 20 High Volume Episode Families
Wisconsin Health Information Organization 47
9.8%
4.1%
3.9%
3.1%
2.9%
2.9%
2.3%
2.1%
2.0%
2.0%
1.9%
1.6%
1.6%
1.6%
1.5%
1.4%
1.4%
1.4%
1.2%
1.2%
0.00%
2.00%
4.00%
6.00%
8.00%
10.00%
12.00%
14.00%
non ETF Commercial non ETF Medicaid ETF

Top Episode Families • Routine Exam plus the other top 5 episode families account for
24-25% of total billed in both ETF and non ETF Commercial populations
Wisconsin Health Information Organization 48
Total Billed % of Total Billed Episode Family ETF not ETF ETF not ETFtop 20 families Joint degeneration, localized $171.9 M $1.0 B 10.12% 10.25%
Ischemic heart disease $59.4 M $418.9 M 3.50% 4.13%Pregnancy, with delivery $54.0 M $300.0 M 3.18% 2.96%Joint derangement $47.1 M $275.3 M 2.78% 2.72%Routine exam $41.3 M $252.1 M 2.43% 2.49%Hypertension $34.3 M $245.5 M 2.02% 2.42%Malignant neoplasm of breast $32.5 M $225.7 M 1.91% 2.23%Diabetes $32.7 M $223.5 M 1.92% 2.21%Mood disorder, depressed $37.1 M $174.0 M 2.19% 1.72%Closed fracture or dislocation $29.0 M $176.1 M 1.71% 1.74%Non-malignant neoplasm of female genital tract $23.2 M $140.5 M 1.37% 1.39%Non-malignant neoplasm of intestines & abdomen $24.0 M $129.6 M 1.41% 1.28%Inflammation of esophagus $20.7 M $129.4 M 1.22% 1.28%Chronic sinusitis $24.5 M $122.0 M 1.44% 1.20%Minor orthopedic trauma $23.2 M $118.2 M 1.37% 1.17%Hyperlipidemia, other $15.5 M $119.4 M 0.91% 1.18%Other minor orthopedic disorders $21.7 M $104.7 M 1.28% 1.03%Cerebral vascular accident $16.0 M $101.9 M 0.94% 1.01%Chronic renal failure $15.4 M $100.2 M 0.90% 0.99%Cataract $13.9 M $69.4 M 0.82% 0.69%
all other $960.5 M $5669.3 M 56.57% 55.94%Grand Total $1.7 B $10.1 B 100.00% 100.00%

ETF Members Top 5 Total Billed Episode Families – ETG Detail
Wisconsin Health Information Organization 49
0
10000000
20000000
30000000
40000000
50000000
60000000
70000000
Back
Knee
& lo
wer
leg
Nec
k
Thig
h, h
ip &
pel
vis
Shou
lder
Foot
& a
nkle
Han
d, w
rist &
fore
arm
unsp
ecifi
ed
Elbo
w &
upp
er a
rm
Isch
emic
hea
rt di
s
Preg
nanc
y, d
eliv
ered
Knee
& lo
wer
leg
Shou
lder
Han
d, w
rist &
fore
arm
Thig
h, h
ip &
pel
vis
Foot
& a
nkle
Elbo
w &
upp
er a
rm
unsp
ecifi
ed
Hyp
erte
nsio
n
Joint degeneration, localized IHD OB Joint derangement Hypertension
c-section vaginal delivery w/o surgery with surgery HTN

Non ETF Commercial Members Top 5 Total Billed Episode Families – ETG Detail
Wisconsin Health Information Organization 50
0
50000000
100000000
150000000
200000000
250000000
300000000
350000000
400000000
450000000
Back
Knee
& lo
wer
leg
Nec
k
Thig
h, h
ip &
pel
vis
Shou
lder
Foot
& a
nkle
Han
d, w
rist &
fore
arm
unsp
ecifi
ed
Elbo
w &
upp
er a
rm
Isch
emic
hea
rt di
s
Preg
nanc
y, d
eliv
ered
Knee
& lo
wer
leg
Shou
lder
Han
d, w
rist &
fore
arm
Thig
h, h
ip &
pel
vis
Foot
& a
nkle
Elbo
w &
upp
er a
rm
unsp
ecifi
ed
Hyp
erte
nsio
n
Joint degeneration, localized IHD OB Joint derangement Hypertension
c-section vaginal delivery w/o surgery with surgery HTN

REGIONAL VARIATION IN PER-EPISODE RESOURCE USE
Examples
Wisconsin Health Information Organization 51

Hypertension Episodes Regional Variation in Average Billed
Wisconsin Health Information Organization 52
$0
$1,000
$2,000
$3,000
$4,000
$5,000
$6,000
ETF not ETF ETF not ETF ETF not ETF ETF not ETF
1 2 3 4
by Episode Severity Level
WI: NORTHEASTERN WI: NORTHERN WI: SOUTHEASTERN WI: SOUTHERN WI: WESTERN

Hypertension Episodes Regional variation in Average Resource Use
Wisconsin Health Information Organization 53
0
500
1000
1500
2000
2500
3000
3500
ETF not ETF ETF not ETF ETF not ETF ETF not ETF
1 2 3 4
by Episode Severity Level
WI: NORTHEASTERN WI: NORTHERN WI: SOUTHEASTERN WI: SOUTHERN WI: WESTERN

Ischemic Heart Disease w/o Surgery Episodes Regional Variation in Average Billed
Wisconsin Health Information Organization 54
$0
$10,000
$20,000
$30,000
$40,000
$50,000
$60,000
ETF not ETF ETF not ETF ETF not ETF ETF not ETF
1 2 3 4
by Episode Severity Level
WI: NORTHEASTERN WI: NORTHERN WI: SOUTHEASTERN WI: SOUTHERN WI: WESTERN

Ischemic Heart Disease w/o Surgery Episodes Regional variation in Average Resource Use
Wisconsin Health Information Organization 55
0
10,000
20,000
30,000
40,000
50,000
60,000
ETF not ETF ETF not ETF ETF not ETF ETF not ETF
1 2 3 4
by Episode Severity Level
WI: NORTHEASTERN WI: NORTHERN WI: SOUTHEASTERN WI: SOUTHERN WI: WESTERN
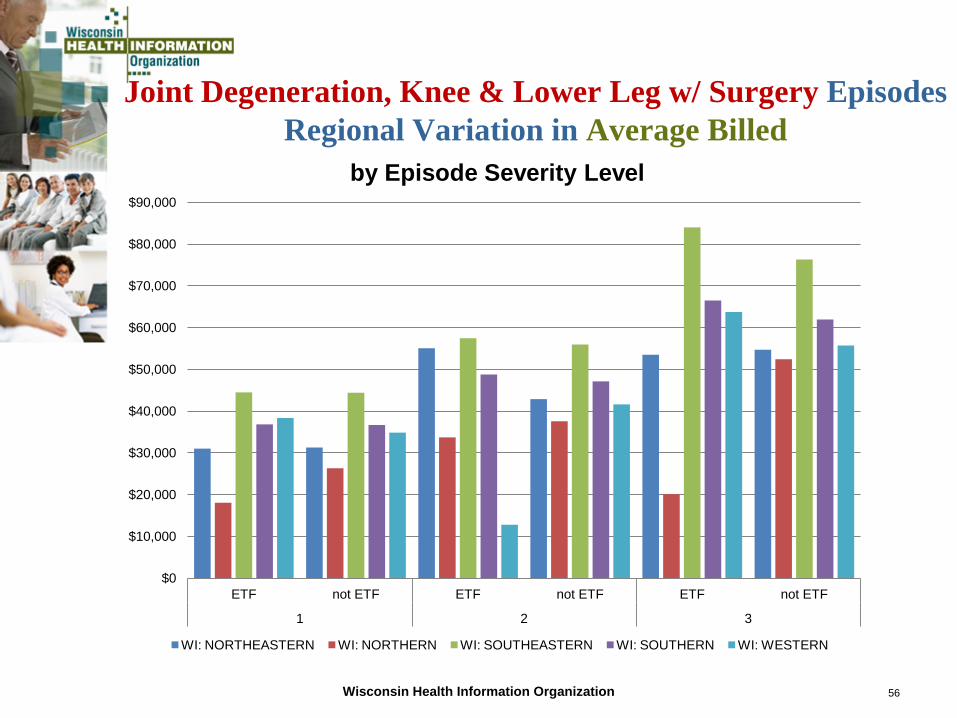
Joint Degeneration, Knee & Lower Leg w/ Surgery Episodes Regional Variation in Average Billed
Wisconsin Health Information Organization 56
$0
$10,000
$20,000
$30,000
$40,000
$50,000
$60,000
$70,000
$80,000
$90,000
ETF not ETF ETF not ETF ETF not ETF
1 2 3
by Episode Severity Level
WI: NORTHEASTERN WI: NORTHERN WI: SOUTHEASTERN WI: SOUTHERN WI: WESTERN

Joint Degeneration, Knee & Lower Leg w/ Surgery Episodes Regional Variation in Average Resource Use
Wisconsin Health Information Organization 57
0
5,000
10,000
15,000
20,000
25,000
30,000
35,000
40,000
ETF not ETF ETF not ETF ETF not ETF
1 2 3
by Episode Severity Level
WI: NORTHEASTERN WI: NORTHERN WI: SOUTHEASTERN WI: SOUTHERN WI: WESTERN
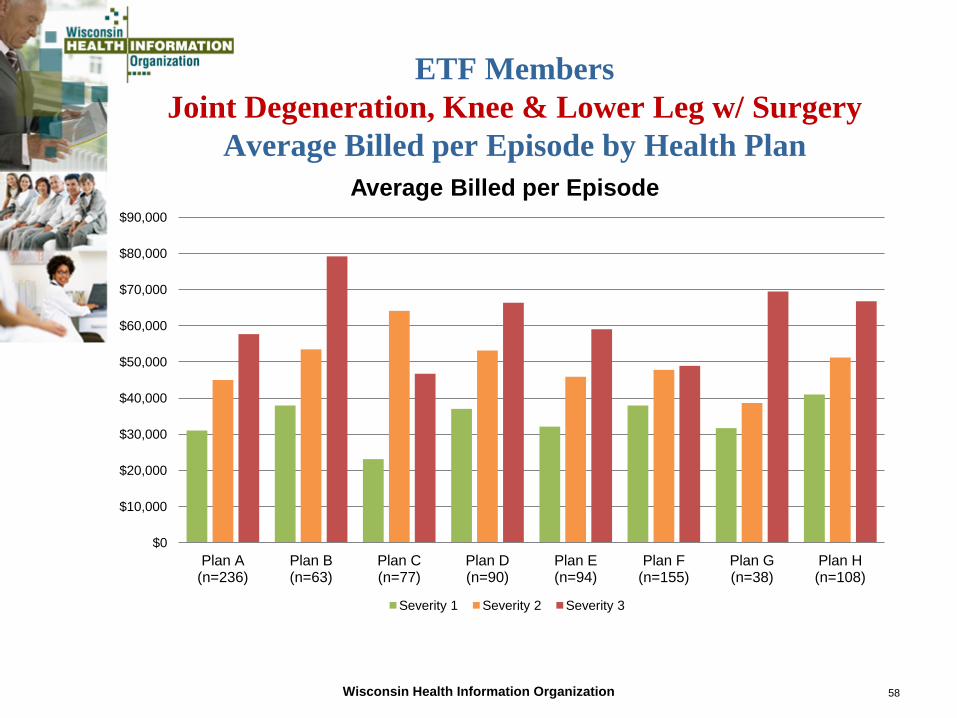
ETF Members Joint Degeneration, Knee & Lower Leg w/ Surgery
Average Billed per Episode by Health Plan
Wisconsin Health Information Organization 58
$0
$10,000
$20,000
$30,000
$40,000
$50,000
$60,000
$70,000
$80,000
$90,000
Plan A (n=236)
Plan B (n=63)
Plan C (n=77)
Plan D (n=90)
Plan E (n=94)
Plan F (n=155)
Plan G (n=38)
Plan H (n=108)
Average Billed per Episode
Severity 1 Severity 2 Severity 3

Top 10 Health Systems
Wisconsin Health Information Organization 59
$434 M
$159 M $119 M $115 M
$45 M $34 M $32 M $31 M $29 M $29 M
$0 M $50 M
$100 M $150 M $200 M $250 M $300 M $350 M $400 M $450 M $500 M
UW
HEA
LTH
DEA
N/S
T M
ARYS
JO
INT
VEN
TUR
E (S
MD
V)
MER
ITER
HO
SPIT
AL
AMG
AU
RO
RA
MED
ICAL
GR
OU
P C
OR
POR
ATE
OFF
ICE
FRO
EDTE
RT
HEA
LTH
WH
EATO
N F
RAN
CIS
CAN
H
EALT
HC
ARE
- SO
UTH
EAST
W
ISC
ON
SIN
INC
CO
LUM
BIA
ST M
ARYS
INC
- C
OLU
MBI
A C
AMPU
S
MER
CY
HEA
LTH
SYS
TEM
C
OR
POR
ATIO
N
BELL
IN H
EALT
H &
TH
EDAC
ARE
PHYS
ICIA
N P
ARTN
ERS
LTD
MAY
O C
LIN
IC H
EALT
H S
YSTE
M
ETF Member Total Billed Charges

ETF has smaller % of members with $0 claims; and with $1 - $5,000
Wisconsin Health Information Organization 60
11.57%
70.26%
22.10%
$1 - 5,000 79.56%
0.00%
10.00%
20.00%
30.00%
40.00%
50.00%
60.00%
70.00%
80.00%
90.00%
100.00%
Range of annual Billed Amount per member
DISTRIBUTION OF MEMBERS BY BILLED CLAIMS RANGE
ETF % Members Non-ETF COM % Members

ETF Members have more episodes
Wisconsin Health Information Organization 61
4.49 4.76
4.22 4.44
3.49 3.69
3.91 3.75 3.69
3.21
0.00
1.00
2.00
3.00
4.00
5.00
6.00
WI: NORTHEASTERN
WI: NORTHERN WI: SOUTHEASTERN
WI: SOUTHERN WI: WESTERN
ANNUAL EPISODES PER MEMBER
ETF Non ETF COM

More members with multiple episodes
Wisconsin Health Information Organization 62
16.3% 16.5% 15.2%
52.0%
23.6% 19.8%
15.9%
40.8%
0.00%
10.00%
20.00%
30.00%
40.00%
50.00%
60.00%
1 2 3 4 or more episodes annually
% o
f Mem
bers
# of Episodes in 1 year
ETF Non ETF COM
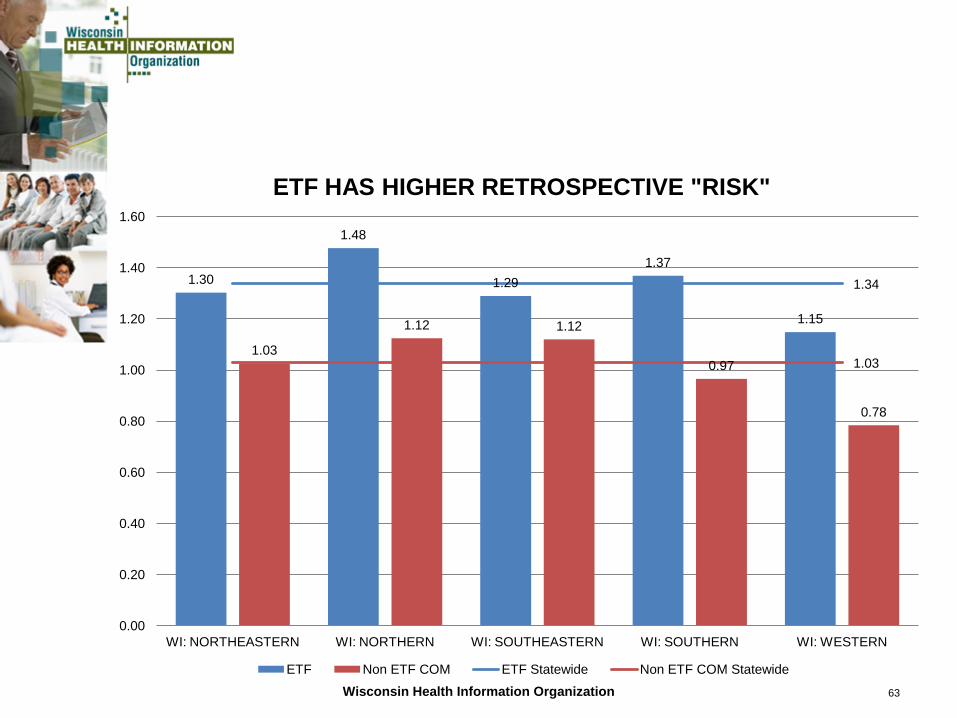
Wisconsin Health Information Organization 63
1.30
1.48
1.29 1.37
1.15
1.03
1.12 1.12
0.97
0.78
1.34
1.03
0.00
0.20
0.40
0.60
0.80
1.00
1.20
1.40
1.60
WI: NORTHEASTERN WI: NORTHERN WI: SOUTHEASTERN WI: SOUTHERN WI: WESTERN
ETF HAS HIGHER RETROSPECTIVE "RISK"
ETF Non ETF COM ETF Statewide Non ETF COM Statewide
Wisconsin Health Information Organization 64
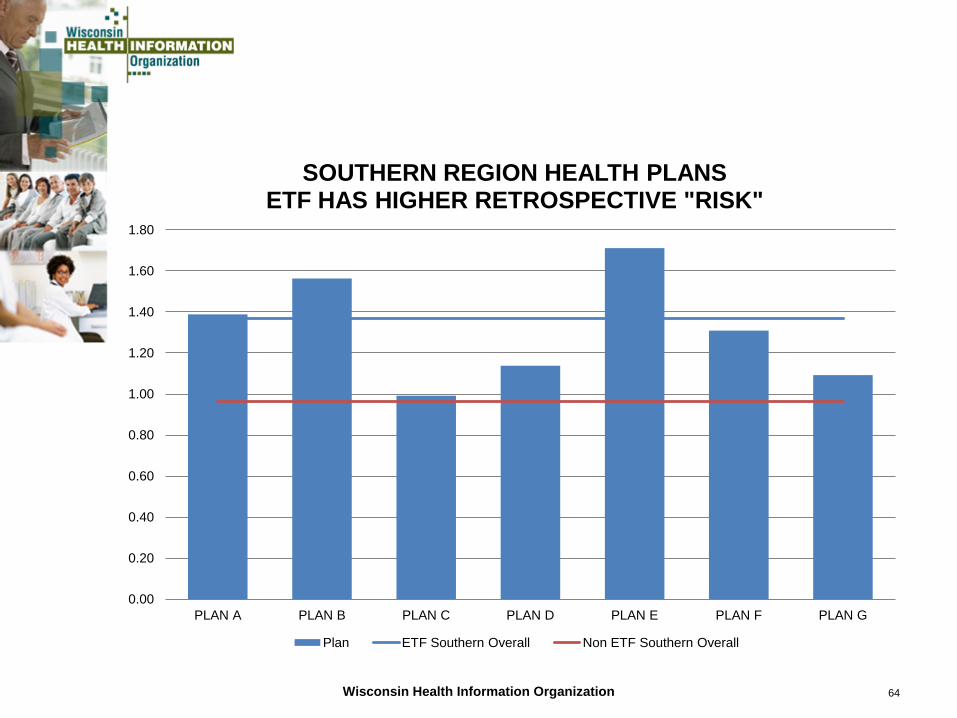
0.00
0.20
0.40
0.60
0.80
1.00
1.20
1.40
1.60
1.80
PLAN A PLAN B PLAN C PLAN D PLAN E PLAN F PLAN G
SOUTHERN REGION HEALTH PLANS ETF HAS HIGHER RETROSPECTIVE "RISK"
Plan ETF Southern Overall Non ETF Southern Overall

Wisconsin Health Information Organization 65
0·~~ .. ,,,,! . .,, ......... (, ..• ,., .. p. 0 I (CO bY(
~ \. bll '.'o.w t"'"' . .:. '"' . ,..,. . ..,
MyHealth ..
• Select a Reg lOll
XL~ ----~-------------------------
F;.o Al:nrll 11:. ( .. :~rt .J$.
vour LC<.ntn ~n:n
~••>1 ~ I '"''"~' 11 '"1 '" '"""~""'" "' t'"' "r"'"••l(l l ~oo i.,IJ""'"Uim "' '" "''" ,.,;.,-, ""'"' .,," • • ~' *'" ..... ., ... ,.;,,.,., o!i> .. ' " "' .,,,o:•• lo ~\·ol. -'1( 11 1 : 1.1 ~ .. $, ... . """ " " ' '·
with confidence
