wisconsin's racial and ethnic diversity - apls racial and ethnic diversity wisconsin's...
TRANSCRIPT
Wisconsin'sRacial and EthnicDiversity
Wisconsin'sRacial and EthnicDiversity
Census 2000 Population & Percentages
Report Prepared for:UW-Extension
Wisconsin Associated CountyExtension Committees Annual Conference
Manitowoc, WisconsinJune 24-26, 2001
Prepared by:University of Wisconsin Extension& Applied Population LaboratoryAgriculture Hall1450 Linden DriveMadison, WI 53706

EXECUTIVE SUMMARY
Wisconsin’s Racial Diversity Increasing*
• While Non-white persons are still a small minority of Wisconsin’s population, Non-whites as apercentage of the state’s total population rose from 7.8% in 1990 to 11.1% in 2000.
• In 2000, 11 Wisconsin counties had populations that were 10% or more minority. By contrast, onlyfive counties fit this description in 1990.
• The counties with the five largest minority populations as a percentage of the population are:Menominee (88.4%), Milwaukee (34.4%), Sawyer (18.3%), Racine (17%), and Forest (14.1%).
• From 1990 to 2000, Non-whites grew from 36.6% to 50% of the population in Milwaukee city.
Hispanics or Latinos Are Fastest Growing Racial or Ethnic Group in Wisconsin**
• From 1990 to 2000, the Hispanic or Latino population in Wisconsin more than doubled (107%increase), the biggest increase of any racial or ethnic group in the state. By contrast, the largest racialgroup in Wisconsin, Whites, increased by only 4.8%.
• The Hispanic or Latino population in Wisconsin was 3.6% of the states’ total population in 2000,compared to 1.9% in 1990.
• The Hispanic or Latino population in Wisconsin is concentrated in the Southeastern part of the state. Four counties have more than 10,000 Hispanic or Latino persons: Milwaukee (82,406), Racine(14,900), Dane (14,387), and Kenosha (10,757).
Black or African American Persons Increased by Nearly 25%
• Wisconsin’s Black or African American population increased 24.5% from 1990 to 2000. Blacks orAfrican American persons are the second largest racial group in Wisconsin and are 5.7% of the state’stotal population compared to 5% in 1990.
• The Black or African American population is mostly concentrated in southeastern and south centralWisconsin. The five counties with the largest Black or African American populations are: Milwaukee(231,157), Racine (19,777), Dane (17,067), Kenosha (7,600), and Rock (7,048). Nearly 76% ofBlack or African American persons in the state reside in Milwaukee County alone.
• Two counties have Black or African American populations that are more than 10% of thepopulation–Milwaukee (24.6%) and Racine (10.5%).

American Indian and Alaska Native Population Increased by 20%
• The number of people of American Indian and Alaska Native origin increased 19.9% from 1990 to2000 in Wisconsin. They represent 0.9% of the state’s overall population.
• The largest populations of American Indian and Alaska Native people are in Milwaukee County(6,794) and Brown County (5,191). From 1990 to 2000, the American Indian and Alaska Nativepopulation fell by 2.9% in Milwaukee County and rose 34.2% in Brown County.
• When considered as a percentage of the total population, northern Wisconsin counties have thehighest percentages of American Indian and Alaska Native persons. Four counties have populationsthat are more than 10% American Indian and Alaska Native: Menominee (87.3%), Sawyer (16.1%),Forest (11.3%), and Ashland (10.3%).
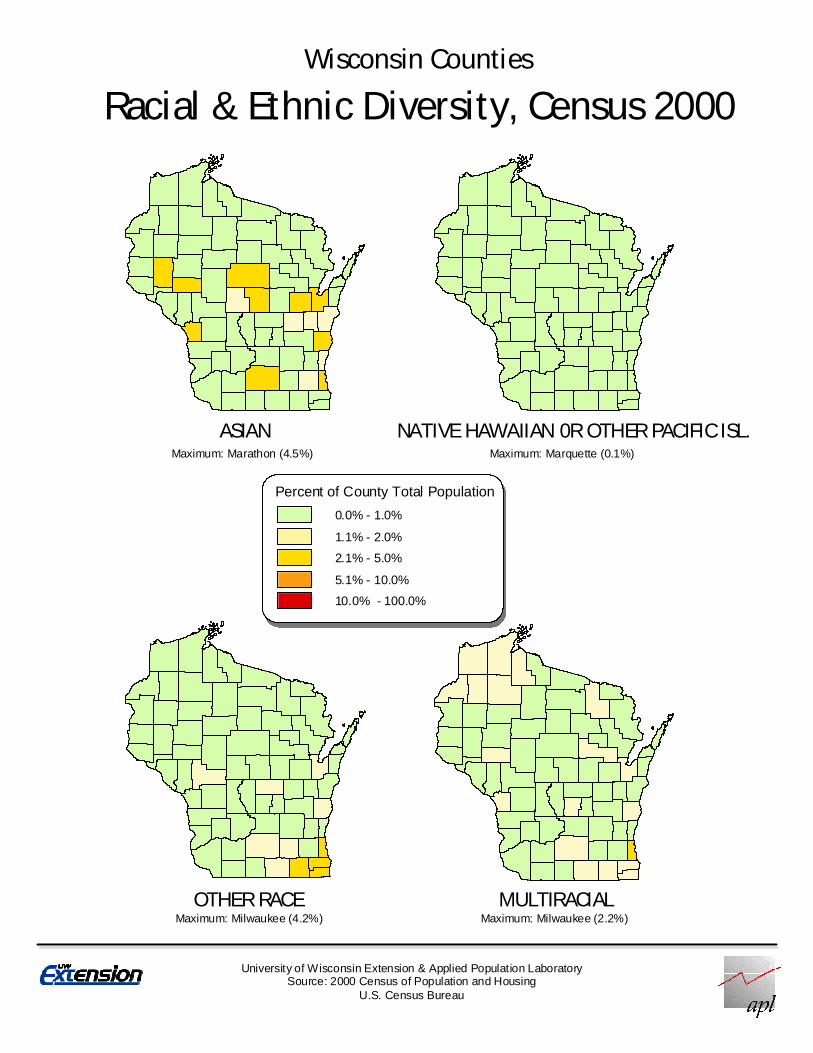
Asian Population Concentrated in Pockets in Southern and Central Portions of the State
• Asians are the third largest racial group in the state of Wisconsin with 88,763 persons. Theyrepresent 1.7% of the state’s total population.
• Although the Asian population is numerically greatest in southeastern and south central Wisconsin,there are also relatively large numbers of Asian persons in the central and east central regions of thestate. The counties with the five largest Asian populations are: Milwaukee (24,145), Dane (14,735),Marathon (5,715), Waukesha (5,381), and Brown (4,935).
• Twenty-seven percent of Wisconsin’s Asian population lives in Milwaukee County. MarathonCounty has the highest percentage of Asians (4.5%).
Notes:
* Two changes in racial classification for the 2000 Census are especially important to keep in mind when interpretingthis data. In 2000, for the first time, the U.S. Census gave people the option to identify themselves as being of two ormore races (multiracial). Only 1.2% of the state’s population chose this option. To simplify presentation, the racialcategories included in this booklet represent persons who identify themselves as being of a single race. If personsidentifying themselves as multiracial were included, the numbers for each race would be slightly higher. One othersignificant change in the census is that the previous “Asian and Other Pacific Islander” category has been split intotwo separate categories: “Asian” and “Native Hawaiian and Other Pacific Islander.”
** It should be noted that in data from the U.S. Census Bureau, Hispanic or Latino is an ethnicity, not a racialcategory. The Hispanic or Latino persons represented in this data can be of any race.

Hispanic or Latino Population, 2000
20 0 20 Miles
N
University of Wisconsin Extension & Applied Population LaboratorySource: 2000 Census of Population and Housing
U. S. Census Bureau
Wisconsin Counties
DANE
PRICE
CLARK
POLK
VILAS
GRANT
RUSK
ONEIDA
IRON
BAYFIELD
SAUK
SAWYER
DUNN
IOWA
MARATHON
DOUGLAS
FOREST
ROCK
MARINETTE
DODGE
TAYLOR
WOOD
OCONTO
JACKSON
LINCOLN
BARRON
ASHLAND
MONROE
JUNEAU
ADAMS
CHIPPEWA
VERNON
BURNETT
SHAWANO
PORTAGE
LANGLADE
GREEN
PIERCE
BUFFALO
DOOR
COLUMBIA
WAUPACA
WASHBURN
BROWN
RICHLAND
SAINT CROIX
FOND DU LAC
LAFAYETTE
WAUSHARA
EAU CLAIRE
OUTAGAMIE
CRAWFORD
WAUKESHA
TREM-PEALEAU
JEFFERSON
WALWORTH
MANITOWOCWINNEBAGO
FLORENCE
RACINE
LA CROSSE
CALUMET
PEPIN
SHEBOYGAN
MAR-QUETTE
WASHIN-GTON
KEWAUNEE
GREENLAKE
MENOMINEE
KENOSHA
OZAUKEE
MILWAUKEE
Hispanic or Latino Persons
0 - 500
500 - 2,500
2,500 - 5,000
5,000 - 10,000
10,000 - 15,000
82,406
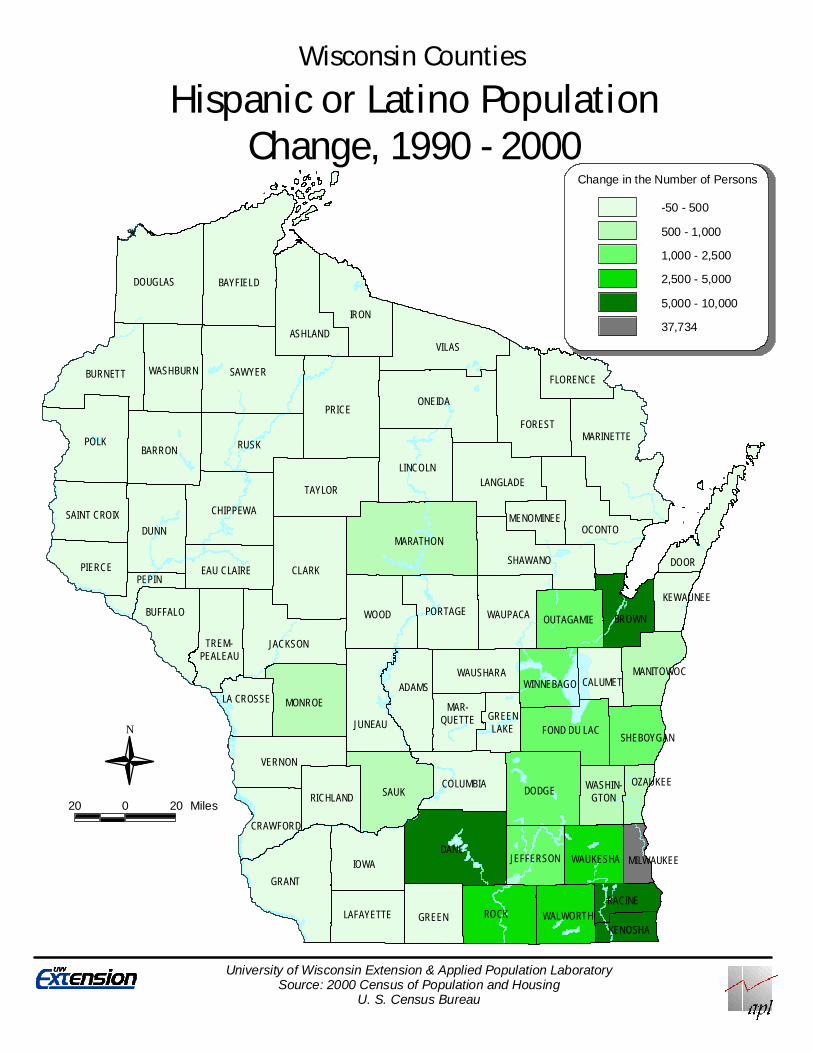
Hispanic or Latino PopulationChange, 1990 - 2000
Wisconsin Counties
20 0 20 Miles
N
University of Wisconsin Extension & Applied Population LaboratorySource: 2000 Census of Population and Housing
U. S. Census Bureau
DANE
PRICE
CLARK
POLK
VILAS
GRANT
RUSK
ONEIDA
IRON
BAYFIELD
SAUK
SAWYER
DUNN
IOWA
MARATHON
DOUGLAS
FOREST
ROCK
MARINETTE
DODGE
TAYLOR
WOOD
OCONTO
JACKSON
LINCOLN
BARRON
ASHLAND
MONROE
JUNEAU
ADAMS
CHIPPEWA
VERNON
BURNETT
SHAWANO
PORTAGE
LANGLADE
GREEN
PIERCE
BUFFALO
DOOR
COLUMBIA
WAUPACA
WASHBURN
BROWN
RICHLAND
SAINT CROIX
FOND DU LAC
LAFAYETTE
WAUSHARA
EAU CLAIRE
OUTAGAMIE
CRAWFORD
WAUKESHA
TREM-PEALEAU
JEFFERSON
WALWORTH
MANITOWOCWINNEBAGO
FLORENCE
RACINE
LA CROSSE
CALUMET
PEPIN
SHEBOYGAN
MAR-QUETTE
WASHIN-GTON
KEWAUNEE
GREENLAKE
MENOMINEE
KENOSHA
OZAUKEE
MILWAUKEE
Change in the Number of Persons
-50 - 500
500 - 1,000
1,000 - 2,500
2,500 - 5,000
5,000 - 10,000
37,734

Rank County 1990 2000% Increase 1990-2000
1 Milwaukee 44,672 82,406 84%2 Racine 9,034 14,990 66%3 Dane 5,744 14,387 150%4 Kenosha 5,580 10,757 93%5 Waukesha 5,448 9,503 74%6 Brown 1,525 8,698 470%7 Walworth 2,017 6,136 204%8 Rock 1,754 5,953 239%9 Sheboygan 1,668 3,789 127%
10 Outagamie 987 3,207 225%11 Winnebago 1,144 3,065 168%12 Jefferson 1,160 3,031 161%13 Dodge 911 2,188 140%14 Fond Du Lac 937 1,987 112%15 Washington 670 1,529 128%16 Manitowoc 582 1,343 131%17 Ozaukee 519 1,073 107%18 La Crosse 640 990 55%19 Marathon 470 979 108%20 Portage 572 967 69%
Rank CountyTotal
Population Number % of Total1 Milwaukee 940,164 82,406 8.8%2 Racine 188,831 14,990 7.9%3 Kenosha 149,577 10,757 7.2%4 Walworth 93,759 6,136 6.5%5 Jefferson 74,021 3,031 4.1%6 Rock 152,307 5,953 3.9%7 Brown 226,778 8,698 3.8%8 Waushara 23,154 848 3.7%9 Dane 426,526 14,387 3.4%
10 Sheboygan 112,646 3,789 3.4%11 Menominee 4,562 122 2.7%12 Marquette 15,832 421 2.7%13 Waukesha 360,767 9,503 2.6%14 Dodge 85,897 2,188 2.5%15 Green Lake 19,105 393 2.1%16 Fond Du Lac 97,296 1,987 2.0%17 Outagamie 160,971 3,207 2.0%18 Winnebago 156,763 3,065 2.0%19 Jackson 19,100 357 1.9%20 Monroe 40,899 740 1.8%
Percent of Total Population Hispanic or Latino, 2000: Top 20 Wisconsin Counties
Hispanic or Latino Population
Sources: 1990 Census of Population and Housing, 2000 Census of Population and Housing; U.S. Census Bureau.
Hispanic or Latino Population, 1990 and 2000: Top 20 Wisconsin Counties*
* Ranking based on 2000 Census figures
Sources: 1990 Census of Population and Housing, 2000 Census of Population and Housing; U.S. Census Bureau
Hispanic or Latino Population

Rank County 1990 2000% Increase
1990-20001 Brown 1,525 8,698 470%2 Iron 8 45 463%3 Sauk 207 938 353%4 Trempealeau 53 240 353%5 Washburn 34 143 321%6 Forest 30 108 260%7 Clark 116 404 248%8 Rock 1,754 5,953 239%9 Outagamie 987 3,207 225%
10 Monroe 234 740 216%11 Shawano 129 407 216%12 Walworth 2,017 6,136 204%13 Taylor 42 127 202%14 Vilas 61 181 197%15 Calumet 149 435 192%16 Kewaunee 54 153 183%17 Richland 59 167 183%18 Marquette 149 421 183%19 Burnett 43 120 179%20 Green 119 327 175%
Increase in Hispanic or Latino Population, 1990-2000: Top 20 Wisconsin Counties
Hispanic or Latino Population
Source: 1990 Census of Population and Housing, 2000 Census of Population and Housing; U.S. Census Bureau.

Percent of County Total Population
0.0% - 1.0%
1.1% - 2.0%
2.1% - 5.0%
5.1% - 10.0%
10.0% - 100.0%
WHITEMaximum: Lafayette (99.0%)
University of Wisconsin Extension & Applied Population LaboratorySource: 2000 Census of Population and Housing
U.S. Census Bureau
Racial & Ethnic Diversity, Census 2000Wisconsin Counties
HISPANICMaximum: Milwaukee (8.8%)
NATIVE AMERICAN OR ALASKA NATIVEMaximum: Menominee (87.3%)
BLACK OR AFRICAN AMERICANMaximum: Milwaukee (24.6%)
Percent of County Total Population
0.0% - 1.0%
1.1% - 2.0%
2.1% - 5.0%
5.1% - 10.0%
10.0% - 100.0%
Maximum: Milwaukee (4.2%)OTHER RACE
Maximum: Milwaukee (2.2%)MULTIRACIAL
Maximum: Marquette (0.1%)
NATIVE HAWAIIAN 0R OTHER PACIFIC ISL.
Wisconsin Counties
Racial & Ethnic Diversity, Census 2000
University of Wisconsin Extension & Applied Population LaboratorySource: 2000 Census of Population and Housing
U.S. Census Bureau
Maximum: Marathon (4.5%)
ASIAN
CountyTotal
Population WhiteBlack or African
American
American Indian and Alaska
Native Asian
Native Hawaiian and Other Pacific
IslanderSome Other
Race MultiracialHispanic
(of all races)
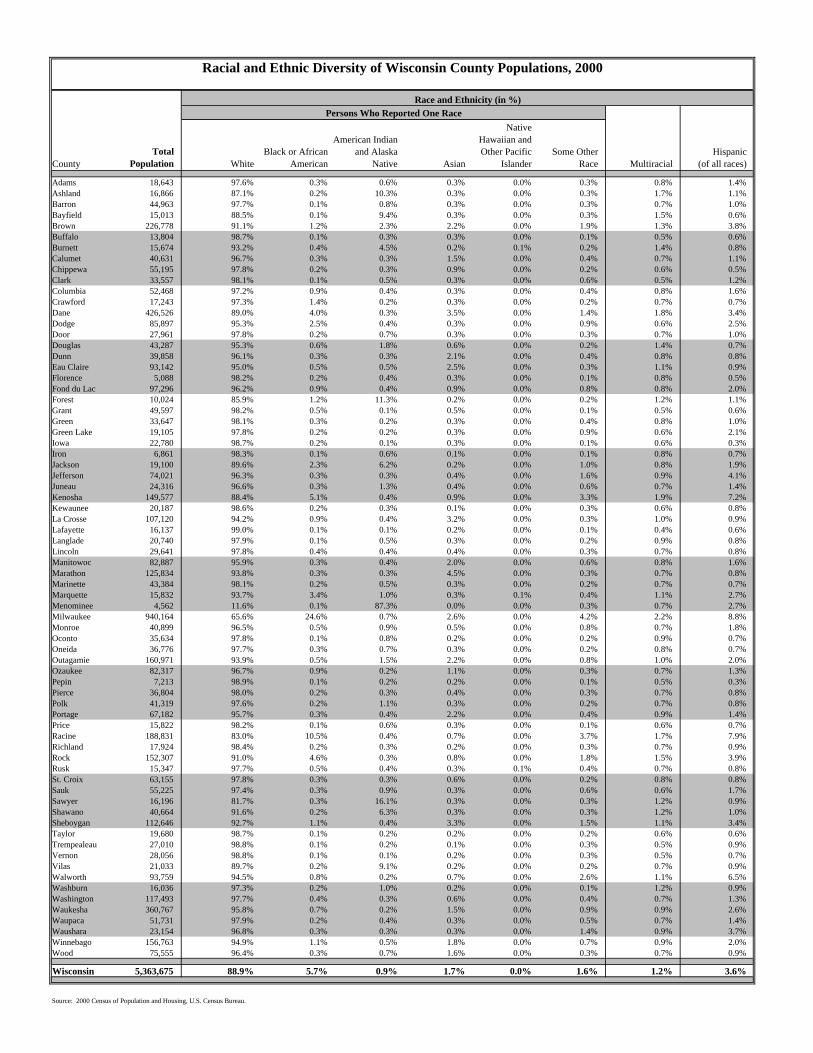
Adams 18,643 97.6% 0.3% 0.6% 0.3% 0.0% 0.3% 0.8% 1.4%Ashland 16,866 87.1% 0.2% 10.3% 0.3% 0.0% 0.3% 1.7% 1.1%Barron 44,963 97.7% 0.1% 0.8% 0.3% 0.0% 0.3% 0.7% 1.0%Bayfield 15,013 88.5% 0.1% 9.4% 0.3% 0.0% 0.3% 1.5% 0.6%Brown 226,778 91.1% 1.2% 2.3% 2.2% 0.0% 1.9% 1.3% 3.8%Buffalo 13,804 98.7% 0.1% 0.3% 0.3% 0.0% 0.1% 0.5% 0.6%Burnett 15,674 93.2% 0.4% 4.5% 0.2% 0.1% 0.2% 1.4% 0.8%Calumet 40,631 96.7% 0.3% 0.3% 1.5% 0.0% 0.4% 0.7% 1.1%Chippewa 55,195 97.8% 0.2% 0.3% 0.9% 0.0% 0.2% 0.6% 0.5%Clark 33,557 98.1% 0.1% 0.5% 0.3% 0.0% 0.6% 0.5% 1.2%Columbia 52,468 97.2% 0.9% 0.4% 0.3% 0.0% 0.4% 0.8% 1.6%Crawford 17,243 97.3% 1.4% 0.2% 0.3% 0.0% 0.2% 0.7% 0.7%Dane 426,526 89.0% 4.0% 0.3% 3.5% 0.0% 1.4% 1.8% 3.4%Dodge 85,897 95.3% 2.5% 0.4% 0.3% 0.0% 0.9% 0.6% 2.5%Door 27,961 97.8% 0.2% 0.7% 0.3% 0.0% 0.3% 0.7% 1.0%Douglas 43,287 95.3% 0.6% 1.8% 0.6% 0.0% 0.2% 1.4% 0.7%Dunn 39,858 96.1% 0.3% 0.3% 2.1% 0.0% 0.4% 0.8% 0.8%Eau Claire 93,142 95.0% 0.5% 0.5% 2.5% 0.0% 0.3% 1.1% 0.9%Florence 5,088 98.2% 0.2% 0.4% 0.3% 0.0% 0.1% 0.8% 0.5%Fond du Lac 97,296 96.2% 0.9% 0.4% 0.9% 0.0% 0.8% 0.8% 2.0%Forest 10,024 85.9% 1.2% 11.3% 0.2% 0.0% 0.2% 1.2% 1.1%Grant 49,597 98.2% 0.5% 0.1% 0.5% 0.0% 0.1% 0.5% 0.6%Green 33,647 98.1% 0.3% 0.2% 0.3% 0.0% 0.4% 0.8% 1.0%Green Lake 19,105 97.8% 0.2% 0.2% 0.3% 0.0% 0.9% 0.6% 2.1%Iowa 22,780 98.7% 0.2% 0.1% 0.3% 0.0% 0.1% 0.6% 0.3%Iron 6,861 98.3% 0.1% 0.6% 0.1% 0.0% 0.1% 0.8% 0.7%Jackson 19,100 89.6% 2.3% 6.2% 0.2% 0.0% 1.0% 0.8% 1.9%Jefferson 74,021 96.3% 0.3% 0.3% 0.4% 0.0% 1.6% 0.9% 4.1%Juneau 24,316 96.6% 0.3% 1.3% 0.4% 0.0% 0.6% 0.7% 1.4%Kenosha 149,577 88.4% 5.1% 0.4% 0.9% 0.0% 3.3% 1.9% 7.2%Kewaunee 20,187 98.6% 0.2% 0.3% 0.1% 0.0% 0.3% 0.6% 0.8%La Crosse 107,120 94.2% 0.9% 0.4% 3.2% 0.0% 0.3% 1.0% 0.9%Lafayette 16,137 99.0% 0.1% 0.1% 0.2% 0.0% 0.1% 0.4% 0.6%Langlade 20,740 97.9% 0.1% 0.5% 0.3% 0.0% 0.2% 0.9% 0.8%Lincoln 29,641 97.8% 0.4% 0.4% 0.4% 0.0% 0.3% 0.7% 0.8%Manitowoc 82,887 95.9% 0.3% 0.4% 2.0% 0.0% 0.6% 0.8% 1.6%Marathon 125,834 93.8% 0.3% 0.3% 4.5% 0.0% 0.3% 0.7% 0.8%Marinette 43,384 98.1% 0.2% 0.5% 0.3% 0.0% 0.2% 0.7% 0.7%Marquette 15,832 93.7% 3.4% 1.0% 0.3% 0.1% 0.4% 1.1% 2.7%Menominee 4,562 11.6% 0.1% 87.3% 0.0% 0.0% 0.3% 0.7% 2.7%Milwaukee 940,164 65.6% 24.6% 0.7% 2.6% 0.0% 4.2% 2.2% 8.8%Monroe 40,899 96.5% 0.5% 0.9% 0.5% 0.0% 0.8% 0.7% 1.8%Oconto 35,634 97.8% 0.1% 0.8% 0.2% 0.0% 0.2% 0.9% 0.7%Oneida 36,776 97.7% 0.3% 0.7% 0.3% 0.0% 0.2% 0.8% 0.7%Outagamie 160,971 93.9% 0.5% 1.5% 2.2% 0.0% 0.8% 1.0% 2.0%Ozaukee 82,317 96.7% 0.9% 0.2% 1.1% 0.0% 0.3% 0.7% 1.3%Pepin 7,213 98.9% 0.1% 0.2% 0.2% 0.0% 0.1% 0.5% 0.3%Pierce 36,804 98.0% 0.2% 0.3% 0.4% 0.0% 0.3% 0.7% 0.8%Polk 41,319 97.6% 0.2% 1.1% 0.3% 0.0% 0.2% 0.7% 0.8%Portage 67,182 95.7% 0.3% 0.4% 2.2% 0.0% 0.4% 0.9% 1.4%Price 15,822 98.2% 0.1% 0.6% 0.3% 0.0% 0.1% 0.6% 0.7%Racine 188,831 83.0% 10.5% 0.4% 0.7% 0.0% 3.7% 1.7% 7.9%Richland 17,924 98.4% 0.2% 0.3% 0.2% 0.0% 0.3% 0.7% 0.9%Rock 152,307 91.0% 4.6% 0.3% 0.8% 0.0% 1.8% 1.5% 3.9%Rusk 15,347 97.7% 0.5% 0.4% 0.3% 0.1% 0.4% 0.7% 0.8%St. Croix 63,155 97.8% 0.3% 0.3% 0.6% 0.0% 0.2% 0.8% 0.8%Sauk 55,225 97.4% 0.3% 0.9% 0.3% 0.0% 0.6% 0.6% 1.7%Sawyer 16,196 81.7% 0.3% 16.1% 0.3% 0.0% 0.3% 1.2% 0.9%Shawano 40,664 91.6% 0.2% 6.3% 0.3% 0.0% 0.3% 1.2% 1.0%Sheboygan 112,646 92.7% 1.1% 0.4% 3.3% 0.0% 1.5% 1.1% 3.4%Taylor 19,680 98.7% 0.1% 0.2% 0.2% 0.0% 0.2% 0.6% 0.6%Trempealeau 27,010 98.8% 0.1% 0.2% 0.1% 0.0% 0.3% 0.5% 0.9%Vernon 28,056 98.8% 0.1% 0.1% 0.2% 0.0% 0.3% 0.5% 0.7%Vilas 21,033 89.7% 0.2% 9.1% 0.2% 0.0% 0.2% 0.7% 0.9%Walworth 93,759 94.5% 0.8% 0.2% 0.7% 0.0% 2.6% 1.1% 6.5%Washburn 16,036 97.3% 0.2% 1.0% 0.2% 0.0% 0.1% 1.2% 0.9%Washington 117,493 97.7% 0.4% 0.3% 0.6% 0.0% 0.4% 0.7% 1.3%Waukesha 360,767 95.8% 0.7% 0.2% 1.5% 0.0% 0.9% 0.9% 2.6%Waupaca 51,731 97.9% 0.2% 0.4% 0.3% 0.0% 0.5% 0.7% 1.4%Waushara 23,154 96.8% 0.3% 0.3% 0.3% 0.0% 1.4% 0.9% 3.7%Winnebago 156,763 94.9% 1.1% 0.5% 1.8% 0.0% 0.7% 0.9% 2.0%Wood 75,555 96.4% 0.3% 0.7% 1.6% 0.0% 0.3% 0.7% 0.9%
Wisconsin 5,363,675 88.9% 5.7% 0.9% 1.7% 0.0% 1.6% 1.2% 3.6%
Source: 2000 Census of Population and Housing, U.S. Census Bureau.
Racial and Ethnic Diversity of Wisconsin County Populations, 2000
Race and Ethnicity (in %)Persons Who Reported One Race

PlaceTotal
Population WhiteBlack or African
American
American Indian and Alaska
Native Asian
Native Hawaiian and Other Pacific
IslanderSome Other
Race Two RacesHispanic
(of all races)
Milwaukee (city) 596,974 50.0% 37.3% 0.9% 2.9% 0.1% 6.1% 2.7% 12.0%Madison (city) 208,054 84.0% 5.8% 0.4% 5.8% 0.0% 1.7% 2.3% 4.1%Green Bay (city) 102,313 85.9% 1.4% 3.3% 3.8% 0.0% 3.7% 2.0% 7.1%Kenosha (city) 90,352 83.6% 7.7% 0.4% 1.0% 0.0% 4.8% 2.4% 10.0%Racine (city) 81,855 68.9% 20.3% 0.4% 0.6% 0.1% 7.1% 2.6% 14.0%Appleton (city) 70,087 91.5% 1.0% 0.6% 4.6% 0.0% 1.0% 1.3% 2.5%Waukesha (city) 64,825 91.2% 1.3% 0.3% 2.2% 0.0% 3.3% 1.7% 8.6%Oshkosh (city) 62,916 92.7% 2.2% 0.5% 3.0% 0.0% 0.5% 1.0% 1.7%Eau Claire (city) 61,704 93.4% 0.7% 0.5% 3.7% 0.0% 0.3% 1.3% 1.0%West Allis (city) 61,254 94.0% 1.3% 0.7% 1.3% 0.0% 1.2% 1.4% 3.5%Janesville (city) 59,498 95.3% 1.3% 0.2% 1.0% 0.0% 1.0% 1.2% 2.6%La Crosse (city) 51,818 91.6% 1.6% 0.5% 4.7% 0.0% 0.4% 1.3% 1.1%Sheboygan (city) 50,792 87.6% 0.9% 0.5% 6.5% 0.0% 2.8% 1.7% 6.0%Wauwatosa (city) 47,271 94.0% 2.0% 0.3% 1.9% 0.1% 0.5% 1.2% 1.7%Fond du Lac (city) 42,203 93.6% 1.9% 0.5% 1.5% 0.0% 1.3% 1.2% 2.9%Brookfield (city) 38,649 94.2% 0.8% 0.1% 3.8% 0.0% 0.2% 0.8% 1.2%Wausau (city) 38,426 85.9% 0.5% 0.6% 11.4% 0.0% 0.3% 1.2% 1.0%New Berlin (city) 38,220 95.8% 0.4% 0.2% 2.3% 0.0% 0.5% 0.7% 1.6%Beloit (city) 35,775 75.6% 15.4% 0.4% 1.2% 0.1% 4.6% 2.8% 9.1%Greenfield (city) 35,476 93.7% 1.0% 0.4% 2.3% 0.0% 1.3% 1.3% 3.9%
Source: 2000 Census of Population and Housing, U.S. Census Bureau.
Racial and Ethnic Diversity of 20 Largest Wisconsin Places, 2000
Race and Ethnicity (in %)Persons Who Reported One Race