with a little help from my (random) friends: success … a little help from my (random) friends:...
TRANSCRIPT
With a Little Help from My (Random) Friends:
Success and Failure in Post-Business School Entrepreneurship*
Josh Lerner
Harvard University and NBER
Ulrike Malmendier
UC Berkeley and NBER
November 17, 2008
An important question in the entrepreneurship literature is whether peers affect the decision to
become an entrepreneur. We exploit the fact that Harvard Business School assigns students into
sections, which have varying representation of former entrepreneurs. We find that the presence
of entrepreneurial peers strongly predicts subsequent entrepreneurship rates of students who did
not have an entrepreneurial background, but in a more complex way than the literature has
previously suggested. A higher share of students with an entrepreneurial background in a given
section leads to their peers to lower rather than higher subsequent rates of entrepreneurship.
However, the decrease in entrepreneurship is entirely driven by a reduction in unsuccessful
entrepreneurial ventures. The relationship between the shares of pre-HBS and successful post-
HBS peer entrepreneurs is insignificantly positive. In addition, sections with few prior
entrepreneurs have similar enrollment rates in elective entrepreneurship classes and a
considerably higher variance in their rates of unsuccessful entrepreneurs. We argue that these
results are consistent with intra-section learning, where the close ties between section-mates
lead to insights about the merits of business plans.
* We would like to thank a number of Harvard Business School officials and faculty who made
this project possible, including Lynda Appelgate, Angela Crispi, Lee Gross, Jim Heskett,
Elizabeth Karpati, Jana Kierstaad, Joe Lassiter, Bill Sahlman, Coral Sullivan, and especially
Mike Roberts, Toni Wegner, and Sarah Woolverton. Daniel Littlejohn-Carrillo, Lori Santikian,
Rui Tang, Astha Tharpa, and especially Geraldine Kim provided excellent research assistance.
Helpful comments were provided by seminar participants at Boston College, Harvard, MIT, the
National Bureau of Economic Research, the University of Southern California, and Yale.
Harvard Business School’s Division of Research and the National Science Foundation provided
financial support. All errors are our own.
I. Introduction
The promotion of entrepreneurship has been a major focus of policymakers in
recent years (see Kanniainen and Keuschnigg [2004]). Thousands of national and local
initiatives have been launched in the belief that entrepreneurial activity is associated with
the creation of wealth, technological innovation, and increased social welfare. Consistent
with this assertion, cross-national studies (e.g., Djankov, et al. [2002]) suggest that
nations with greater barriers to entry of new firms also have poorer-functioning and more
corrupt economies.
At the same time, entrepreneurship can have real costs. Individuals can be
diverted from more productive careers into lucrative entrepreneurial ventures which may
add little to the welfare of society as a whole (Baumol [1990]; Murphy, Shleifer, and
Vishny [1991]). An emerging literature on ―behavioral entrepreneurship‖ suggests that
individuals may pursue new ventures even if the returns are predictably meager (Camerer
and Lovallo [1990]; de Meza and Southey [1996]; Arabsheibani, et al. [2000]). Bernardo
and Welch [2001] highlight the phenomenon of ―entrepreneurial cascades,‖ where the
decision of one individual to become an entrepreneur may encourage others to do
likewise, even though the returns to this activity are poor.
The arguments have received empirical support. Evans and Leighton [1989] show
that individuals with a greater ―locus of control‖—a belief that their performance depends
largely on their actions—are more likely to become entrepreneurs. Landier and Thesmar
[2007] classify French entrepreneurs into optimists and pessimists based on their
financing choices (e.g., the use of long- and short-term debt) and find that firms run by
optimists tend to grow less, die sooner, and be less profitable, despite the fact that these
owners tend to put in more effort. And the high rates of failure of entrepreneurial
ventures have been well-documented (see, for instance, Davis, Haltiwanger, and Schuh
[1998]).
An area of particular recent interest has been the impact of peer effects on
productive and unproductive entrepreneurship. In many areas of economics, researchers
have asked whether interactions among high-skilled individuals with similar interests
lead to large social multipliers. In our context, the dramatic levels of entrepreneurship in

2
regions such as Silicon Valley have led to speculation that powerful peer effects are at
work in the decision to become entrepreneurs. Studies have shown that individuals who
work at recently formed, venture-backed firms are more likely to become entrepreneurs
(Gompers, Lerner and Scharfstein [2005]), as are those who work at companies where
colleagues become entrepreneurs (Nanda and Sorensen [2007]) and in regions where
many others opt for entrepreneurship (Giannetti and Simonov [2007]). These papers
suggest an unequivocally positive effect of ―entrepreneurial environment‖ and
―entrepreneurial peers.‖ While all these studies suggest that peer effects are important
determinants of entrepreneurial activity, their inability to fully control for unobserved
heterogeneity or sorting of individuals into firms and locations means our interpretation
of these results must be cautious.
This paper explores peer effects in entrepreneurship in a particularly promising
setting, the Masters of Business Administration (MBA) program at Harvard Business
School (HBS). Unlike earlier work, we are able to exploit a truly random element when
assessing peer effects: the assignment of MBAs by School administrators into sections,
i.e., groups of typically 80 to 90 students who spend the entirety of their first year in the
program studying and working together. These sections form extremely close ties, and
are a setting where peer effects—if they are to be empirically observable at all—would be
likely to be seen. We exploit the fact that the representation of students with
entrepreneurial backgrounds varies considerably across sections to evaluate the impact of
peers on the decision to become an entrepreneur, as well as on entrepreneurial success.
In addition to the appeal of the random assignment of students, this setting is
attractive for other reasons. Many of the primary data sources most frequently used in
entrepreneurship research, such as data compiled by the Bureau of the Census, the
Internal Revenue Service, and in the Panel Study of Entrepreneurial Dynamics, have
substantial limitations in terms of the types of entrepreneurial activity that can be
observed. As the recent literature review by Parker [2004] highlights, most empirical
studies have focused on the decision to become self-employed (e.g., as a groundskeeper
or consultant) rather than the founding of an entrepreneurial firm. In fact, in many
databases, founders of entrepreneurial companies cannot be distinguished from
employees of established firms. In this setting, we can focus on the founding of
3
entrepreneurial firms, both in the classification of peers with entrepreneurial experience
prior to entering Harvard Business School (pre-HBS entrepreneurs) and in the
classification of graduates (post-HBS entrepreneurs).1
A second challenge facing much of the earlier empirical work is that the
importance of entrepreneurial entities varies tremendously. While the bulk of
entrepreneurial ventures simply replicate other entities and have a very limited growth
potential, a small number of ventures create enormous wealth and have a profound
economic impact. We are able to employ the extensive recordkeeping and research at
Harvard Business School about its entrepreneurial alumni to assess the outcomes of these
ventures. Historically, Harvard Business School students have been instrumental in
founding leading firms in a variety of industries (e.g., the Blackstone Group, Bloomberg,
LLP, and the modern Xerox Corporation; for many more examples, see Cruikshank
[2005]). Even within our relatively recent sample, we encounter early-career HBS
entrepreneurs founding highly successful firms, such as athenahealth (publicly traded,
with a market capitalization of $1.5 billion in November 2007) and SupplierMarket
(acquired by Ariba for $581 million).
We find a striking pattern. When we look at the rate of post-HBS
entrepreneurship across sections for students without an entrepreneurial background, we
find that exposure to a higher share of peers with a pre-HBS entrepreneurial background
leads to lower rates of entrepreneurship post-HBS, very much in contrast to the literature
evaluating peer effects without randomization. In a number of specifications, a one
standard deviation increase in the share of peers with pre-HBS entrepreneurial
background in a section (evaluated at the mean of the various independent variables)
reduces the predicted share of the other students in a section going into an entrepreneurial
role after graduation by about 1%, or over twenty percent.
Our detailed data about the students’ entrepreneurial ventures, however, also
allows us to differentiate between successful and unsuccessful ventures. When we look
1 The imprecision is particularly problematic in studies of professionals who may be
unwilling to admit to being unemployed. In these cases, individuals tend to report
themselves to instead be ―self-employed consultants‖ or similar labels. By focusing on
entrepreneurship by early-career professionals who are also highly sought after by
consulting firms and investment banks, we avoid these issues.

4
one level deeper, we find that the negative peer effect is exclusively driven by a decrease
in unsuccessful entrepreneurship. The share of students who start ventures that do not
achieve critical scale or other measures of success is significantly and negatively related
to the pre-HBS representation of entrepreneurs in a given section. Meanwhile, the
relationship between successful post-HBS entrepreneurs and the share with previous
entrepreneurial background is slightly positive, though typically not significant. The
differences between the impact of prior entrepreneurs on the successful and unsuccessful
post-HBS entrepreneurship rates are statistically significant. Finally, we show that
sections with few prior entrepreneurs have a considerably higher variance in their rates of
unsuccessful entrepreneurs, beyond (mechanistic) increases in variance due to the
increase in the probability of entrepreneurship.
These results are consistent with the presence of intra-section learning. An
extensive literature, beginning with Jovanovic [1982], has highlighted the fact that
entrepreneurs learn about their abilities through running their businesses. The close ties
between students in the same section may lead to an accelerated learning process about
prospective business ideas. Students seeking to start new ventures may be able to benefit
from the counsel of their peers, rather than succeeding or failing themselves. These
benefits may come through different channels. One mechanism might be that peers with
an entrepreneurial background help in identifying which initially promising ideas are
problematic and thus not worth pursuing. This interpretation also explains the
significantly higher variance of entrepreneurship rates and unsuccessful entrepreneurship
rates when only one or two former entrepreneurs are present in the section (beyond the
mechanistic changes in variance due to the difference in the probability to become
entrepreneur). Students’ assessments may be colored by the perspectives and experiences
of the prior entrepreneurs (which may have been favorable or unfavorable); but, with a
large enough number of entrepreneurial peers, at least one of them will have the expertise
to detect the flaw in a given business idea.
A second, related explanation is that the mere presence of entrepreneurial peers
and their reports about their experiences help other students to realize the challenges
involved in starting a company and, even without individual advice, inject realism into
other students and discourage all but the best potential entrepreneurs from pursuing their
5
ventures. A third explanation is that the presence of entrepreneurial peers do not effect
individual decisions directly, but encourage students to take more elective
entrepreneurship classes, which in turn leads to better decisions. When we examine the
enrollment of students without an entrepreneurial background in second-year
entrepreneurship classes, however, we find that students in sections with more
entrepreneurial peers are neither less likely (as the second explanation might suggest) nor
more likely (as the third hypothesis implies) to enroll in elective entrepreneurship classes.
While our ability to distinguish between the alternative explanations of the results is
limited, the patterns seem most consistent with the first interpretation.
In addition to helping understand peer effects in entrepreneurship, our analysis is
relevant to policy-makers, business school faculty, and administrators.2 Business schools
are putting significant energy and resources into the promotion of these activities, often
with public subsidies. For instance, during the 1990s and early 2000s, U.S. business
schools created over 300 endowed chairs in entrepreneurship, typically paying salaries
that were significantly higher than those in other business disciplines (Katz [2004]).
Several hundred business plan contests for business school students were also launched
during these years. The results of this paper suggest a slight redirection in educational
and policy initiatives. Much of the benefit from exposure to entrepreneurship appears to
come not from encouragement of more entrepreneurship but from help in weeding out
ventures that are likely to fail. Rather than focusing on the attraction of more people into
entrepreneurship, schools and policy-makers may want to provide support to would-be
entrepreneurs in critically evaluating and identifying their most promising ideas.
The plan of this paper is as follows. In Section II, we review the relevant literature
on the determinants of entrepreneurship. Section III describes the role of sections at
Harvard Business School. We describe the construction of the sample in Section IV.
Section V presents the analysis. The final section concludes the paper.
2 To our knowledge, the only papers examining entrepreneurial choices among MBAs are
Lazear [2005] and Eesley, Hsu and Roberts [2007], both with quite different focuses.
6
II. Peer Effects and the Determinants of Entrepreneurship
An extensive literature has examined the determinants of entrepreneurship. The
determinant we focus on is the role of peer effects, which have been attracting particular
interest in the entrepreneurship literature. As noted above, previous studies have focused
on the impact of working or living in an entrepreneurial environment.
The earlier papers measure peer effects by using observational data and regressing
entrepreneurship outcomes on entrepreneurship among peers. There are several
difficulties in interpreting coefficients estimated with this approach (Manski [1993],
Sacerdote [2001]). The most important issue is that individuals self-select into firms and
locations. This makes it difficult to separate out the selection from actual peer effects. In
fact, an extensive literature on peer effects in the economics of education shows that peer
effects found in non-randomized settings tend to disappear once the analysis is redone
exploiting true randomization (or vice versa), regardless of how extensively observables
are controlled for in the non-randomized settings. Kremer and Levy [2003], for example,
study the peer effects of college students who frequently consumed alcohol prior to
college on the GPA of their roommates and find systematic differences in the sample of
randomly assigned and the sample of self-selected roommates.
In this paper, we are able to move beyond the limitations of previous literature on
peer effects in entrepreneurship by exploiting truly exogenous variation in the exposure
to entrepreneurial peers. Our identification strategy is discussed in more detail in the next
section.
Another confounding issue in the prior literature on entrepreneurial peer effects is
the distinction between the effect of one peer on others on the one hand and common
shocks affecting the entire peer group on the other hand. In the context of school
outcomes, Sacerdote [2001] finds a significant correlation in the GPAs of randomly
assigned college roommates but little evidence that students are affected by their
roommate’s pre-college academic background (SAT scores and high-school
performance). Hence, as discussed in Kremer and Levy [2003], common shocks due to
dorm room characteristics, infections, or joint class choices might be affecting both
roommates and explain part of the results. Focusing on pre-determined characteristics,

7
such as entrepreneurial activities prior to graduate school in this paper, avoids this
problem.
Much of the literature on entrepreneurship has also been hampered by identifying
a broad range of self-employment without distinction. In this paper we are able to
distinguish between (ex post) good and bad decisions to become entrepreneur, by
obtaining information about the scale and success of the entrepreneurial ventures. Hence,
our paper provides not only a cleaner (and different) answer to the question whether
exposure to entrepreneurial peers increases entrepreneurship, but also whether
entrepreneurial peers help to make the ―right‖ decision.
III. Sections at Harvard Business School
Harvard Business School has long used a section system. Students spend their
first year of the MBA program in a single classroom, taking a fixed slate of classes (e.g.,
accounting, finance, and marketing) with a set group of peers. There is no provision for
switching between sections. While administrators ensure that each section is taught by a
mixture of junior and senior faculty, no effort is made to match faculty and section
characteristics. While in their second year of the program, students take elective courses
with the entire student body, the social ties established in the first year remain extremely
strong. For instance, even at 25th
reunions of HBS alumni, fundraising and many
activities are arranged on a section-by-section basis.
The power of the social experience engendered by HBS sections has been
observed upon in both journalistic accounts and academic studies. For instance, in his
account of Harvard Business School life, Ewing [1990] observes:
If the Harvard Business School has a secret power, it is the section system.
A first-year section has a life of its own, bigger than any student, more
powerful than any instructor… All first-year instructors I know agree
about the awesome power of the section. They may not like the way it
works in all cases—who does—yet it drives B-school students to learn,
influencing them in countless ways.
Similarly, in a field-based analysis of the first-year HBS experience, Orth [1963]
highlights the extent to which students in sections, ―in order to insure feelings of safety
and, if possible competence in a situation that is initially perceived to them to be

8
threatening,‖ adopt ―norms‖ that affect study patterns, social interactions, and even
choices regarding employers with which to interview. He notes that ―some norms
appeared to be common to all first-year sections and others appeared to develop as a
result of a particular section’s pattern of adaptation to the conflicts and pressures of the
first year.‖
Given the persuasive influence of the section experience, it is not surprising that it
affects the decision to become an entrepreneur. Cruickshank [2005] offers a number of
illustrations where section-mates began businesses or refined business ideas together.
One way to see the impact of the section relationships on entrepreneurial choices is to
examine the HBS business plan contest. This competition, begun in 1997, was open in its
initial years only to second-year students (who are not required to undertake any classes
or complete any assignments with first-year section-mates).3 Many of the entries in the
business plan contest were the foundation for post-HBS ventures. Despite their freedom
to choose partners across their entire class, the students disproportionately chose partners
who had been in their first-year sections. In business plan contests between 1998 and
2004, there were 277 student teams consisting of 566 pairs of second-year students. Of
the pairs of the second-year HBS MBAs who entered the contest together, 185 pairs, or
33%, consisted of section-mates. Were the selection of fellow students for these teams
random, the expected share of section-mates would have been 9% for the classes of 1998
through 2003 and 10% for the class of 2004.
Moreover, there is a considerable degree of diversity in terms of the backgrounds
of the students across sections, which allows us to exploit the differences across sections
empirically. Unlike other professional schools, HBS students have considerable
professional experience prior to matriculation: in the classes under study, the median
student had between three and five years of post-college work experience.4
3 The students were allowed in these years to involve students at other schools in their
teams but not first-year students. In the calculations below, we ignore non-HBS students.
A team consisting of three students, hailing from sections A, B, and B, was regarded as
involving three pairs, one pair of which consisted of students in the same section and two
of which did not. 4 http://www.hbs.edu/about/mba.html (accessed November 17, 2007) and unpublished
tabulations.

9
Students are assigned into sections by a computer program developed by School
administrators whose assignment procedure is a mixture randomization and stratification.
From conversations with the responsible administrators and observing the sectioning
process for the class of 2010, we learned that the primary considerations behind the
stratification of students into sections are, in relative order of priority:
1. Gender.
2. Ethnicity.
3. Whether the student went to the remedial analytics course in August prior to
matriculation, and if so, what section the student was assigned to.
4. Whether the student’s admission was conditional on supplemental work on
quantitative skills (this was true of 9% of the class of 2009).
5. Whether the student’s admission was conditional on supplemental work on
verbal skills (this was true of 7% of the class of 2009)
6. Whether the student’s quantitative GMAT score was high, medium, or low.
7. Whether the student’s verbal GMAT score was high, medium, or low.
8. The home region of the student (the system identifies separately seven US
regions, most major European countries, Japan, China, India, and elsewhere
regions).
9. The industry in which the student worked in his/her most recent job (e.g.,
consulting, finance, telecommunications, etc.).
10. The student’s age.
11. Whether the student attended one of the major ―feeder‖ colleges (Harvard,
Yale, West Point, etc.).
12. The function in the student’s last job (sales, finance, etc.). Students who had
been entrepreneurs prior to business school are classified as general
management, but so are many others).
13. The student’s marital status.
14. The student’s college major.
15. Whether the student worked for one of 49 major companies in their last job
prior to graduation. Due to the limitations in the computer program—for
instance, it only recognizes students who record ―McKinsey & Co.‖ or

10
―McKinsey & Company‖ as their previous employer, and not ―McKinsey‖ or
―McKinsey Chicago‖—this element works poorly: for approximately 450
admits in the class of 2010 that we examined, the program only recognized the
firms for about 10%. All the others were bunched together in ―other,‖ along
with former entrepreneurs and others who worked for smaller firms.
In addition, School administrators do some hand sorting afterwards. The main goals in
these hand corrections are two-fold:
16. Identifying students who are born to expatriate parents. Thus, a student born
in the U.S. with French citizenship (which suggests French parents) may be
switched to a section with fewer French people.
17. Identifying students with a military background who did a stint on Wall Street
or consulting before going to business school. Students will be swapped to
ensure the military component in each section is about even.
The information used in the sectioning process is derived largely from forms that
students fill out, which also serve as the basis of the class cards which we analyze.
Because School administrators do not undertake the detailed textual analysis we do (see
below), they do not identify and balance out those students who were entrepreneurs prior
to HBS. We had access to all information used about the students in the sectioning
process with the exception of that on test scores, conditional admissions, and age (items c
through g and j).
Hence, the primary dimensions along which students are sorted are essentially
orthogonal to the ones of interest of our study. Secondary considerations in assigning
students to sections, such as undergraduate institutions—e.g., Ivy League vs. state
university graduates--are not completely orthogonal to the variable of interest. However,
stratification along these dimensions does not bias our identification; it only lowers the
power of our analysis.
IV. The Data
Our analysis draws on four primary sets of data. These data sources characterize
the sections in which the students spend their initial years, their elective course choices,

11
their career choices upon graduation, and the ultimate outcomes of the entrepreneurs’
ventures respectively.
First, we collected data on the characteristics of each HBS section for the classes
between 1997 and 2004. The starting date was dictated by data availability, the end date
by the need to have several years after HBS graduation in order to identify which
entrepreneurs were successful.
The sources of section information are ―class cards‖ for each individual student.
The class cards are initially filled in by School administrators using information students
provide in their applications (and which students may update while enrolled at HBS) and
are used to provide background information for other students and faculty.5 Information
provided includes marital status, education, employment history, home region, and
interests. From these cards, we determined a variety of information for nearly 6,000 HBS
students:
First, we determined gender, nationality (in particular, sole or joint U.S.
citizenship), and family status. For the last item, we used their response to a query
as to whether they had a partner, as well as whether they indicated children
among their interests or other descriptive material.
Second, we identified the industry where each student in the section had worked
between the time of graduation from college and prior to entry into HBS. We
coded the students who worked in multiple industries (e.g., investment banking
and private equity) as having participated in both.6
5 The fact that the information in the class cards is drawn from applications helps address
concerns that students exaggerate their accomplishments on the cards to impress peers.
Lying on one’s application is a very high risk strategy, as it can lead to expulsion from
the School or even the subsequent voiding of a degree. The School taken ethics during
the application process very seriously: for instance, several years ago, some accepted
students who had checked the status of their application on a web site earlier than
allowed had their offers rescinded (Broughton [2008]).
6 We employed a sixty-industry scheme employed by in the hiring and compensation
database of Harvard Business School’s Career Services (see description below). In an
unreported analysis, we explore the robustness of the results to assigning students to a
single field—the one in which he or she spent the most time. (If a student worked an
equal amount of time in two fields, we choose the area in which he or she worked most
12
We characterized the educational background of the students in two ways. First,
we identified primary degrees from Ivy League Schools. Second, we used ―Ivy
Plus‖ schools (an association of administrators of leading schools), which
includes the Ivy League schools as well as the California Institute of Technology,
the University of Chicago, Duke University, the Massachusetts Institute of
Technology, Stanford University, and the Universities of Cambridge and Oxford.
In unreported analyses, we also added to this the top non-U.S. schools (as defined
by the Times Higher Education Supplement) in addition to Cambridge and
Oxford: the Ecole Polytechnique and the London School of Economics. These
changes make little difference to the results.
We also attempted to characterize students’ risk attitudes, given some suggestive
evidence in the entrepreneurship literature on the lower risk-aversion of
entrepreneurs (Parker [2004]). As an imperfect proxy, we characterized the
riskiness of the activities listed by the students based on the injury data from
American Sports Data [2005].7 We employed their compilation of ―Total Injuries
ranked by Exposure Incidence,‖ which gives the number of injuries per 1000
exposures for each sport. The most risky activity (boxing) causes 5.2 injuries per
1000 exposures and got a risk score of 1. Other activities were scaled accordingly.
Lacrosse, for example, causes 2.9 injuries per 1,000 exposures and got a risk
score of 2.9/5.2 = 0.558, etc. We averaged the top risk score for each student in
recently before beginning business school, as they are likely to have had more
responsibility there.) The results are little changed.
7 The data is based on a survey of 25,000 households in 2003, which obtained a 62%
response rate. Several injury measures are provided, e.g., injuries resulting in an
emergency room visit, which tend to be quite correlated with the measure we employ. A
number of the sports listed by the students are not included in the American Sports Data
list. In these cases, we substituted the closest sport (e.g., baseball for cricket, day hiking
for orienteering). For some activities we found no comparable listing by American Sports
Data, some of which appear to be very high risk (e.g., motorcycle racing) and others
more moderate (for instance, fencing). We assigned these the top and median risk
rankings respectively. We excluded activities that did not involve physical exertion (e.g.,
fantasy football and pigeon racing) or entries were too vague to be classified (for
instance, ―athletics‖ or ―all sports‖).

13
the section. In unreported robustness checks, we employed the average across all
activities listed by each student in the section.
Finally, and most critically for our analysis, we identify students who have
worked as a founder or co-founder of an entrepreneurial venture prior to entering
Harvard Business School. These individuals were identified using key terms in
the class cards such as ―co-founded,‖ ―started‖, ―launched,‖ and so forth. Unlike
the calculation of industry experience (which focused only on post-college
graduation employment), we included businesses begun before graduating from
college, on the ground that these experiences could also have led into valuable
insights into the planning and implementation of entrepreneurial ventures.8 We
are also concerned that the impact of successful and unsuccessful entrepreneurs
may be different. We thus characterized the businesses by whether the businesses
launched prior to business school were successful or unsuccessful. (We
determined this information through descriptions in the class-cards, social
networking sites such as Facebook and LinkedIn, and direct contacts with the
students.) Our primary cut-off point was whether the business achieved a million
dollars in annual revenues. In total, 42% of the businesses were classified as
successful, 19% as unsuccessful, and the remainder as unknown.9
We aggregated these measures on a section level: e.g., we computed the share of
the section that had attended an Ivy League college. A major difficulty in the data
collection process was posed by the failure of HBS to archive class cards prior to 2000.
For the period between 1997 and 1999, we obtained the cards from HBS professors who
had saved the class cards of their former students. Some of these instructors had taught
first-year classes, in which case they had information on all the students in a given
8 Starting up and heading a division within a company was not counted as
entrepreneurship. Freelance consulting was not counted as starting a business unless there
are other consultants working for that person. We also did not include a small number of
cases where students operated franchises as entrepreneurs since operating a franchise is
more similar to running a corporate unit.
9 Note we used a lower cut-off than when defining the success of post-business school
entrepreneurship. This reflected our belief that students engaging in pre-business school
entrepreneurship had a lower opportunity cost, so a lower hurdle should be applied.

14
section. Others had taught second-year classes, in which they had cards on an assortment
of students across various sections. As a result, the completeness of our information
about sections in the early years (and the precision with which we can characterize the
features of sections) varies.
We also wished to characterize the opportunity set that students considering
entrepreneurial ventures faced. One approach, which we employ in many regressions, is
to simply use year dummies. In other specifications, we used several measures of the
overall U.S. economic environment for entrepreneurs. The first of these is the total
amount of venture capital financing disbursed by year. Venture capital is an important
mechanism for funding new growth firms. Many of the new ventures begun by Harvard
MBAs have been funded by these intermediates. We compiled the amount provided
annually both in all financing rounds and (in unreported analyses) in initial financings in
the United States.10
We also compiled from Securities Data Company and the web-site of
Jay Ritter the number and dollar volume of initial public offerings in United States, as
well as the amount ―left on the table‖ in these offerings (the difference between the
closing price on the first day and the offer price, multiplied by the number of shares
sold11
). We only used two of these measures in the reported analyses; the results are
robust to the use of alternatives.12
Table I presents the basic characteristics of the MBA classes. Unlike elsewhere in
the paper, here we show aggregate data on the entire student body from the HBS
administration, which includes those students for whom we are missing class-cards.
While the MBA class size remained constant during this period, the composition
10 Venture capitalists typically finance firms in multiple rounds. In certain time periods,
they appear to emphasize more funding new companies, in other times the refinancing of
firms already in their portfolio. The information is taken from National Venture Capital
Association [2005], based on the records of Venture Economics. 11
This is the wealth transfer from the shareholders of the issuing firm to the investors
who were allocated shares at the offer price (Loughran and Ritter [2002]).
12 Even though IPOs are typically confined to firms that have several yeas of operations,
they provide a useful measure of venture capital financing available to new ventures in
the same industry, possibly reflecting attractive investment opportunities in this industry
(Gompers, Kovner, Lerner, and Scharfstein [2007]).

15
changed: female, minority and non-U.S. students were increasingly represented. In
addition, the share of students with technical training increased markedly. The average
section size remained relatively constant from the class of 1998, when an additional
section was added and the average section size shrank in conjunction with an
experimental accelerated MBA program, until the class of 2004, when the number of
sections was reduced from 11 to 10 shortly after the elimination of the program (resulting
in an increase in section size). The lower half of Table I shows the measures of financing
activity. The year-by-year tabulation highlights the acceleration of activity during the
―bubble years‖ of the late 1990s. This pattern is also illustrated in Figure 1.
Table II shows the distribution of student characteristics by section. We present
the results for all 86 sections, and then for the 60 sections where we were able to gather at
least sixty class cards, and thus can characterize the distribution of students with greater
confidence. On average, 5% of each section has worked previously as an entrepreneur,
though the range is between one and ten percent. The heavy representation of students in
investment banking and consulting is also apparent.13
We also report the share of students
working in private equity (which we define here to include both venture capital and
buyout funds), since these students may be particularly well prepared to provide counsel
to would-be entrepreneurs.
Sections differ sharply on a variety of personal characteristics, including the
presence of students with children and graduates of elite schools. The differences across
sections narrow somewhat when we require that we have data on at least 60 students,
which reflects the fact that the characteristics of the section are less noisy when we have a
larger number of class cards.
As noted above, our explanations for the patterns had differing implications for
enrollment in the elective entrepreneurship classes that are offered in the second year.
The second set of data thus revolves around the students’ elective class choices. We
determined all elective classes that the students enrolled in, as well as the fraction that
were listed as being sponsored or co-sponsored by the Entrepreneurial Management
group in the course prospectus distributed to the students each year. For all the students
13 The variation in the share of investment bankers reflects in large part the ebb-and flow
of these admits across classes, rather than inter-section differences.

16
without an entrepreneurial background in a given section, we computed the share of
classes that related to entrepreneurship. On average, the non-entrepreneurs in a given
section devoted 19% of their elective classes to entrepreneurship; the ratio varied from as
low as 9% to as high as 27%.
The third source of information related to the choice of careers post-graduation.
HBS conducts each year an ―exit survey‖ of each graduating class.14
The School has
made the picking of a cap and gown for graduation conditional on completion of the
survey, which ensures a very high participation rate. The survey includes multiple choice
categories (i.e., for industry of employment), as well as for cases where the student is still
looking for employment and where the student has founded or is planning to imminently
found a new venture.15
These responses to this survey are anonymous, in order to ensure
candid responses. We identify all cases where students indicated they had or were
beginning an entrepreneurial venture. Again, we aggregate the responses to the section
level.
Finally, we compute the number of successful firms established by students in
each section while at HBS or within one year of graduation. We determine success as of
October 2007. Though it is hard to find any objective threshold criterion and any
systematic definition of success is sure to have its arbitrary elements, for the bulk of the
paper we define a successful business as one that (a) went public, (b) was acquired for
greater than $5 million, or (c) had in October 2007 or at the time of the sale of the
company at least 50 employees or $5 million in annual revenues. Only 13% of the post-
HBS MBA entrepreneurs were successful using these criteria. In supplemental analyses,
we employ a higher hurdle, defining a successful firms as one that that (a) went public,
14
This survey does not, of course, characterize the career choices those students who
drop out without completing a degree. Only a small fraction of each class (typically
considerably under 1%) does not complete their degree, and these overwhelmingly
represent students who are separated involuntarily due to poor academic performance.
Even at the peak of the Internet boom, only a handful of students permanently left school
before graduation to pursue an entrepreneurial opportunity. 15 It should be noted that the survey only reflects student’s intentions at the time of
graduation: some would-be entrepreneurs may abandon their quests if they get an
attractive offer thereafter.

17
(b) was acquired for greater than $100 million, or (c) had in October 2007 or at the time
of the sale of the company at least $100 million in revenues.16
We determine this information from three sources. First, the HBS External
Relations (Development) Office has undertaken extensive research into its
entrepreneurial alumni. This research process intensified in 2006 and 2007, in
anticipation of a planned 2008 conference in honor of the institution’s 100th
anniversary
that was intended to bring together it’s most successful and/or influential entrepreneurial
alumni.
Second, the School conducted an on-line survey of entrepreneurial HBS alumni
who had been in the 1997 through 2004 classes. This survey, organized by Michael
Roberts, executive director of the Rock Center for Entrepreneurship, sought to capture
information about all those who participated in the School’s business plan contest,17
as
well as others known to have undertaken early-career entrepreneurial ventures. The
survey used a ―viral‖ approach, whereby known entrepreneurs were asked to identify
other entrepreneurs among their classmates, and encourage them to complete the survey.
Finally, we conducted interviews with the faculty in the HBS Entrepreneurial
Management Unit. These faculty members are often intimately involved with alumni
ventures, whether as sponsors of the independent studies where the initial business plans
are drawn up or as directors, advisory board members, or investors in subsequently
established ventures. Even in cases where the faculty members have no formal role going
forward, they often stay in touch with alumni entrepreneurs. As a result, they have
extensive knowledge about the performance of these ventures.18
After compiling this
information on individual ventures, we again aggregated it on the section level.
16 While we would have liked to determine the success as of a set time after graduation
(e.g., three years after degree completion), this information proved impossible to gather. 17 The contest for students in the second (and final) year of the MBA program was first
initiated in 1997. The individuals were initially contacted via e-mail in January 2005.
Non-respondents were contacted three times via e-mail and telephone. Overall, 41% of
all contacted students participated. This rate is consistent with or above the level of
responses typical in social science studies of this cohort (Barch [1999]). 18 In some cases, we were unable to determine from our sources the exact specifics
regarding revenues or acquisition process private firms. In these cases, we consulted a

18
Figure 2 summarizes some key patterns in regard to HBS early-career
entrepreneurship. The top panel presents the extent to which pre-HBS entrepreneurship
rates vary across section, on both a count basis and when adjusted for the average level of
entrepreneurs in each class. In particular, the right graph in the top panel presents the
distribution of the normalized entrepreneurship rate: the share of students with
entrepreneurial experience prior to entering HBS in each of the 86 sections divided by the
average rate in that year. While some sections have no members with previous
entrepreneurial ventures, others have a rate nearly three times the others in that year.
The lower panel highlights the extent to which the rate of post-HBS
entrepreneurship varies over time. We present the share of the class who became
entrepreneurs after graduation, as well as those who became successful entrepreneurs.
These shares are computed for the entire graduating class, as well as only for those who
were not entrepreneurs prior to graduation. (The latter measures more closely reflect the
dependent variable in our regression analyses.) The peak in entrepreneurial entry around
2000, when more than ten percent of the class began entrepreneurial ventures upon
graduating, is very evident. Several observations can be made about pattern of successful
entrepreneurship. First, though we are using the first, less demanding definition of
successful entrepreneurship, only a very small share of the entrepreneurial ventures were
successful. There is a less pronounced temporal pattern here, but the years that saw the
greatest number of successful entrepreneurs were earlier (suggesting that less suited
students may have been drawn into entrepreneurship by their predecessors’ success).
The final element of the data preparation had to do with determining the share of
students who did not have an entrepreneurial background who became entrepreneurs. As
noted above, the placement data is compiled anonymously, with only information on the
student’s gender, section, and so forth, which means we cannot use it directly. To create
the desired ratio, we researched each of the students who had an entrepreneurial
background to determine if they took an entrepreneurial position after HBS, using social
networking sites, Google searches, and direct contacts. (If a student is an entrepreneur
wide variety of business databases, such as CorpTech, EDGAR, Factiva, and Orbis. We
also undertook direct contacts with the entrepreneurs to obtain this information on a
confidential basis.

19
prior to and immediately after HBS, we refer to him or her as a ―pre- and post
entrepreneur.‖) Our primary measure was constructed as follows:
# of Post-HBS Entrepreneurs in Section - # of Pre and Post Entrepreneurs in Section
Section size* (1 – Section’s Pre-HBS Entrepreneurship Rate)
One difficulty was that in some cases we did not have all the class-cards, or could not
determine with certainty whether the student became an entrepreneur. We also repeated
the analysis in a robustness check, assuming that as set percentage of the students who
were entrepreneurs prior to HBS also chose this career upon graduation (30% in the
reported results, a rate based on data from the Rock Center survey, though we also used
other rates and found they had little impact).
V. Empirical Analysis
Our analysis proceeds in several steps. First, we test for determinants of the
overall rate of HBS graduates in each section becoming entrepreneurs. Then we turn to
understanding the determinant of successful and unsuccessful entrepreneurs. We also
examine enrollment in elective entrepreneurship classes. Finally, we explore the variance
of success rates across sections.
A. Test of Randomization
We initially conduct a test of whether the distribution of entrepreneurs across
sections is truly random. If the students are not randomly distributed, as we argued above,
our empirical strategy would pose concerns. We compare the distribution of the students
without an entrepreneurial background prior to HBS in sections with more and fewer pre-
HBS entrepreneurs.
These results are presented in Table III. When we compare sections that have
below and above the median number of entrepreneurs in Panel A, only one set of
differences are significant at the five-percent confidence level: sections with more
entrepreneurs are less likely to have students who attended elite schools. (We will control
for this share in supplemental regressions below.) When we seek to explain the number
of pre-HBS entrepreneurs in Panel B, the explanatory variables (the characteristics of the
students in the section who were not entrepreneurs prior to HBS) are jointly insignificant.
20
These results help assure us that the distribution of pre-HBS entrepreneurs across sections
is random.
B. Univariate Comparisons
We begin by analyzing the basic relationship between the representation of
students with previous entrepreneurial experience in a given section and the rates of total
and successful post-HBS entrepreneurship.
First, we simply review the patterns graphically. Figure 3 looks at the relationship
between the share of pre-HBS entrepreneurs in the section and the share of total and
successful post-HBS entrepreneurs. The top panel suggests that sections with more prior
entrepreneurs have considerable less variation in the share of entrepreneurs after
graduation. The sections with few earlier entrepreneurs have either very high or very low
levels of post-HBS entrepreneurship, and have on average higher rates.
The lower panel looks only at the share of successful post-HBS entrepreneurs.
Here the pattern is much more ambiguous, with the exception of one section with a
number of successful entrepreneurs and a high normalized pre-HBS entrepreneurship
rate. Certainly, no sign of the negative relationship identified in the top panel appears
here.
Table IV examines correlation coefficients between various characteristics of the
sections and the share of students who were not entrepreneurs prior to HBS becoming
entrepreneurs post-HBS. We present the results for all sections and for those where we
have at least 60 class cards. The results restricting the sample to those sections with at
least 60 responses are consistently more significant, reflecting our ability to better
characterize section characteristics. In that analysis, we see that those sections which had
relatively more males, U.S. citizens, and students with children (again, all variables are
computed using just the students who were not pre-HBS entrepreneurs) were more likely
to have higher rates of entrepreneurship. Both venture capital funding and IPO activity in
the year of graduation are highly correlated with post-HBS entrepreneurship. There is a
negative relationship between the share of students who were entrepreneurs prior to
business school and those beginning ventures after HBS: as with the other most of the
patterns, the patterns are highly statistically significant when we use the sections for
which we had at least 60 class cards.

21
The correlations with successful entrepreneurship are much weaker. The only
significant correlates are the measures of entrepreneurial finance activity in the year of
graduation and even these are not consistently significant across the specifications. The
relationship between the normalized share of pre-HBS entrepreneurs and the share of the
non-pre-HBS entrepreneurs in the section becoming successful entrepreneurs is positive
but insignificant.
These patterns are, of course, simply suggestive: we will want to control for a
number of features of the sections simultaneously. Nonetheless, they are indicative of the
patterns we will see throughout the paper.
C. Regression Analyses
We now turn to analyzing the determinant of post-HBS entrepreneurial in a more
systematic manner. We estimate regressions where the unit of observation is each section
in the classes of 1997 through 2004. The share of the section who was not entrepreneurs
prior to HBS becoming entrepreneurs immediately after graduation (either overall, or
divided into the share that was successful and unsuccessful) is the dependent variable.
We control for the characteristics of these same students: that is, the independent
variables in the regressions (with the exception, of course, of the share of prior
entrepreneurs in the section) are similarly calculated using only those students who were
not entrepreneurs prior to HBS.
Table V presents the analysis of the propensity of students who are not
entrepreneurs prior to HBS to become entrepreneurs. We employ a variety of
specifications:
We first run the analysis using our preferred specification: only using those
sections where we have at least sixty class cards, and thus can reasonably
characterize the distribution of students. We then repeat the analysis, restricting
the sample to sections with at least forty class cards and then using all sections
(weighted by the number of observations), even though these sections can be
characterized less precisely.
Because the left-hand side variable is censored at zero, we first estimate a Tobit
specification. Unfortunately, we could not employ year dummy variables in these

22
regressions, as the estimates did not converge when we included them: instead,
we used the volume of venture financing and IPOs as controls.
We also use the two methods of correcting the aggregate entrepreneurship rate
described at the end of section IV: the first four regressions subtract out the
number of pre- and post-HBS entrepreneurs, while the last three employ the
average post-HBS entrepreneurship rate for pre-HBS entrepreneurs.
We find several patterns consistently across the regressions:
The coefficient on the share of the section with an entrepreneurial background is
always negative. In the Tobit specification and in the regressions where we limit
the sample size to those where section characteristics can be better measured (i.e.,
those with 40 or more responses), this coefficient is consistently significant at the
five-percent confidence level.
The coefficient on the share of the section that is male is always positive. In the
regressions using sections with 60 or more class cards, this variable is consistently
statistically significant.
The share of the section that has a partner is always negatively and significantly
associated with the post-HBS entrepreneurship rate. The magnitude and
significance of the coefficient is larger in the regressions where we require a
minimum number of class cards.
More entrepreneurial activity in the economy is associated with periods of more
venture activity. When we employ class dummies, those for 1999 and 2000 have
the greatest magnitude and significance. When we employ the venture and IPO
dummies, the measure of the level of venture activity in the year of graduation is
consistently positive and significant at the one-percent level.
The goodness of fit is markedly greater in the regressions where a minimum
number of class cards is required, reflecting the greater precision with which we
can measure the characteristics of the sections.
The coefficient on the mean risk tolerance of the section is insignificant. This
may, however, simply reflect the poor quality of the proxy we employ.
The share of students with a private equity background only has a positive and
significant impact employing the Tobit specification. The weak result may reflect
23
the fact that this category is dominated by students who have worked for buyout
firms that have little exposure to young firms, rather than for venture capitalists.
The basic pattern is consistent with our hypotheses delineated above.
The results are not only statistically significant, but economically meaningful. In
the first OLS regression, a one standard deviation increase in the pre-HBS
entrepreneurship rate (=-0.363*0.030) translates into a 1.1 percent decrease in the
predicted rate of entrepreneurship after business school (across the six OLS regressions
(across all specifications, the changes ranges from -0.7% to -1.3%). Other regressions are
similar in magnitude. These changes are significant relative to the mean rate of post-HBS
entrepreneurship among those who were not pre-HBS entrepreneurs, which averages a
little under four percent.
We then examine the rates of successful and unsuccessful post-HBS
entrepreneurship. We defined the rate of unsuccessful entrepreneurship in each section as
the difference between the total rate of entrepreneurship and the successful
entrepreneurship rate.19
Table VI presents regressions with the same set of specifications as in the
previous table, with the share of students who were not previously entrepreneurs and who
were successful in ventures started immediately after HBS as the dependent variable in
Panel A, and that of unsuccessful entrepreneurs in Panel B. The representation of
successful entrepreneurs is much more difficult to predict: the goodness of fit is
considerably lower and is not consistently greater in the regressions which require more
class cards and in which the section variables are measured more precisely. The
coefficient on the share of the section that was an entrepreneur prior to HBS is always
positive, but never statistically significant in the first set of regressions. It is significantly
positive in the second set of regressions, which use the alternative way to control for pre-
HBS entrepreneurs. Nor are the other variables that are important in the Table V
regressions significant. The appearance of successful entrepreneurs seems driven by other
19 While we believe that we identified a virtually comprehensive list of successful HBS
entrepreneurs from the classes in our sample, a similar approach would not have worked
for unsuccessful entrepreneurs. Unsuccessful ventures are frequently much less visible,
and participants may not be willing to disclose them (e.g., in response to a survey
request) after the failure.

24
unidentified features, perhaps relating to the entrepreneurial talent of individual section
members. In part, this may reflect the low success rate, which may make it hard to
identify statistically significant effects.
The results of regressions explaining unsuccessful entrepreneurship, by way of
contrast, are very similar to those on Table V. Of particular note, in the regressions which
require a minimum number of class cards (and in which sections’ features can be more
precisely measured), the share of the section with an entrepreneurial background pre-
HBS is significantly negatively associated with unsuccessful entrepreneurship after HBS.
In the final line of the table, we report the results of formal tests of whether the
coefficients on the variable measuring the entrepreneurial background of the section are
the same in the successful and unsuccessful regressions. We do this by estimating a
pooled regression and then performing an F-test of the null hypothesis that the coefficient
on this variable is not different. The null hypothesis of no difference is always rejected at
least at the five-percent confidence level.
Thus, the presence of peers who have had entrepreneurial experience tend to deter
peers without an entrepreneurial background from undertaking unsuccessful ventures, but
does not have this effect on those who will launch successful ventures. Indeed,
entrepreneurial peers may even have a slightly positive effect on would be successful
entrepreneurs.
One possible interpretation of this finding is that pre-HBS entrepreneurs tend to
be ―bad‖ entrepreneurs, whose previous failures dampen the general enthusiasm about
entrepreneurship among their peers. Empirically, however, that does not seem to be the
case. As noted above, many of the pre-HBS entrepreneurs have been extremely
successful, having sold companies for tens of millions of dollars. When we estimate
unreported regressions using as independent variables the shares of the section who were
entrepreneurs prior to HBS that were or were not successful, the differences between the
impact of the two classes of entrepreneurs are insignificant.
D. Robustness Checks
We then undertook a series of robustness checks of the results. This section
describes the reported and unreported analyses we did.

25
One concern was potential limitations of our success measure. For example, our
primary measure of success includes firms such as Guru.com, an online marketplace for
freelance talent that was sold for approximately $5 million to rival Unicru in 2002.
Whether any of the key parties associated with the firm regarded this as a success is
doubtful, given that Guru.com raised over $62 million in venture capital financing in
1999 and 2000.20
In the first two columns of Table VII, we repeat the analyses in second
regressions reported in Panels A and B Table VI, now using the higher, $100 million
cutoff defined above. The results continue to resemble those above, as they did when we
re-estimate a number of the other regressions reported in Table VI. The coefficients on
the share of the section with an entrepreneurial background in the two reported
regressions are significantly different at the one-percent confidence level.
A second concern relates to unobserved differences in the quality of the students
in sections. One possibility is that students with entrepreneurial backgrounds were
admitted more because of their interesting prior experience rather than their academic
abilities, and that sections with many entrepreneurs are somehow less talented as a result.
To address this concern, we sought to use a measure of academic achievement prior to
HBS, rather than one from the time the students were in school. We worried that students
pursuing a new venture at HBS might have neglected their classes, while those pursuing
careers in consulting, for instance, may have found the certification associated with
academic honors more valuable. In the reported results, we use the share of the section
that attended an ―Ivy Plus‖ institution.
In the third and fourth regressions in Table VII, we again re-estimate the second
regression reported in Panels A and B of Table VI with this additional control. The
results are again little changed, and the entrepreneurial background coefficients are
significantly different at the five-percent confidence interval. These results continue to
hold when we use the broader and narrower designations of elite schools defined above.
A final concern related to the HBS class of 2000, which as Figure 2.b revealed,
had an extraordinary high post-HBS entrepreneurship rate. In an unreported analysis, we
20 The information on Guru.com was obtained from http://www.venturexpert.com
(accessed November 17, 2007), Factiva, and other on-line sources.

26
reran the regressions without the observations from the class of 2000. The results were
little changed.
E. Additional Analyses
As noted in the introduction, we can offer a variety of explanations for the results
seen above. In addition to intra-section learning about what constitutes a good business
idea, the presence of more former entrepreneurs in a section may simply discourage
would-be entrepreneurs, or alternatively drive them to take additional entrepreneurship
classes as electives (which may lead them to make better decisions). The second and third
hypotheses suggest there will be a negative or positive relationship between elective
entrepreneurship class enrollment and the presence of prior entrepreneurs in a section.
To examine these suggestions, we repeated the above analyses. We used as the
dependent variable the share of classes that the students without an entrepreneurial
background prior to HBS took in their second year that fell under the sponsorship of the
Entrepreneurial Management unit. (Recall all second-year classes during this period were
electives.) As Table VIII reports, there are no consistently significant results (except for
the time dummies: the classes of 2000 and 2001 had the greatest enrollment in
entrepreneurship classes). The impact of peers with an entrepreneurial background was
positive, but very weak and never significant. This non-result is most consistent with the
hypothesis that the most important learning mechanism is intra-section learning.
The final analysis examines not the mean rate of entrepreneurship, but rather its
variance. As hypothesized above, sections with fewer students with an entrepreneurial
background are likely to display a greater variance in their post-HBS entrepreneurship
rates, particularly in the share of unsuccessful entrepreneurs.
Table IX displays the results of the analysis. We divide the sections by the
unadjusted share of entrepreneurs into the section: we assume that the hypothesized effect
occurs whenever there are few entrepreneurs, regardless of whether the section is
particularly poorly represented in this regard relative to the other sections. The table
reports the variance in the rate of overall, successful, and unsuccessful entrepreneurship
for sections that are above and below the median on this measure. Following our
approach above, we repeat the analysis for all sections and for those with at least 40 and
60 class cards.

27
We find that sections with more entrepreneurs have less variance in the overall
entrepreneurship rate. This pattern is entirely driven by the unsuccessful entrepreneurs:
the variance in the unsuccessful post-HBS entrepreneurship rate is nearly twice as great
in sections with below the median numbers of prior entrepreneurs than those with above
the median.
One reason for the reduction in variance in section with above-median number of
entrepreneurs is a mechanical relationship. A natural statistical model of the number of
students who become entrepreneurs is a binomial distribution. For a distribution with N
independent observations, which may take on values of 1 with probability p and 0
otherwise, the variance is equal to (p – p2)N. In this case, the reduction in variance
associated with the sections with high rates of pre-HBS entrepreneurship will be partially
due to the lower probability of post-HBS entrepreneurship and hence lower variance.
This point can be illustrated by the following simplifying calculation: Moving from the
75th
to the 25th
percentile for a normally distributed variable is associated with a reduction
by 1.35 standard deviations. Evaluated at the mean of the independent variables, this
translates into a reduction in variance by 32%. Thus, a significant part of the observed
44% decline in variance of the total rate of entrepreneurship, going from sections with
below-median to sections with above-median pre-HBS entrepreneurship, may be due to
this mechanical relationship.
At least the remaining variance reduction, however, might be explained as
described above: the feedback from pre-HBS entrepreneurs are likely to be colored by
their personal experience. With a large enough number of entrepreneurs present,
however, one of them will be critical and experienced enough to detect the ―flaw‖ in a
business plan. Somewhat more puzzling is the fact that the variance of the successful
entrepreneurship rate actually increases when there are more entrepreneurs in the section.
We do not have a ready explanation for this pattern. We note, however, that the
magnitude and the significance of the difference declines as we are more restrictive in
terms of the sample size.
28
VI. Conclusions
This paper studies a topic of increasing scholarly and practical interest, the impact
of peer effects on the decision to become an entrepreneur. We examine the decision to
undertake entrepreneurial activities among recent graduates of the HBS MBA Program.
This setting is an attractive one for a study of these issues due to the random assignment
of students to sections, the ability to distinguish the establishment of truly entrepreneurial
firms (as opposed to self-employment), and the potentially high economic impact of these
ventures.
We find that a higher share of students in a given section with an entrepreneurial
background leads to lower rates of entrepreneurship among students who did not have an
entrepreneurial background prior to HBS. This effect is driven by the rate of unsuccessful
entrepreneurs: students in sections with more pre-HBS entrepreneurs are less likely to
start unsuccessful ventures. The relationship between successful post-HBS entrepreneurs
and the share with a previous entrepreneurial background is considerably weaker, but
appears to be slightly positive. The presence of former entrepreneurs does not appear to
affect enrollment in entrepreneurship classes by section-mates in the second year. Finally,
sections with few prior entrepreneurs have a considerably higher variance in their rates of
unsuccessful post-HBS entrepreneurship. We argue that these results are consistent with
intra-section learning, where the close ties between students in a section lead to an
enhanced understanding of the merits of proposed business ideas.
We highlight two avenues for future research. This paper suggests a richer role for
peer effects than what has been described in much of the literature. Most of the empirical
studies of peer effects in entrepreneurship, for instance, have implicitly assumed a
―contagion effect,‖ where the decision of one individual to begin a firm leads others to do
so likewise. This analysis suggests a richer set of dynamics are at work. Understanding
how these effects work in more detail would be very worthwhile.
A second avenue for future research is exploiting the randomness of section
assignments at HBS to look at other phenomena. The differing educational, national,
religious, and experiential mixtures of the various sections should make this a fertile
testing ground for a variety of economic theories about network and peer effects.
29
References
American Sports Data, 2005, A Comprehensive Study of Sports Injuries in the U.S.,
Cortlandt Manor, NY, American Sports Data.
Arabsheibani, Gholamreza, David de Meza, John Maloney, and Bernard Pearson, 2000,
And a vision appeared unto them of a great profit: Evidence of self-deception among the
unemployed, Economic Letters 67, 35-41.
Baruch, Yehuda, 1999, Response Rates in Academic Studies—A Comparative Analysis,
Berlin, Springer Science+Business Media.
Baumol, William J., 1990, Entrepreneurship: Productive, unproductive, and destructive,
Journal of Political Economy 98, 893-921.
Bernardo, Antonio, and Welch Ivo, 2001, On the evolution of overconfidence and
entrepreneurship, Journal of Economics & Management Strategy 10, 301-30.
Broughton, Philip, D., 2008, Ahead of the Curve: Two Years at Harvard Business School,
New York, Penguin.
Camerer, Colin, and Dan Lovallo, 1999, Overconfidence and excess entry: An
experimental approach, American Economic Review 89 306-318.
Cruikshank, Jeffrey L., 2005, Shaping the Waves: A History of Entrepreneurship at
Harvard Business School, Boston, Harvard Business School Publishing.
De Meza, David, and Clive Southey, 1996, The borrower’s curse: Optimism, finance, and
entrepreneurship, Economic Journal 106, 375-386.
Djankov, Simeon, Rafael La Porta, Florencio Lopez-de-Silanes, and Andrei Shleifer,
2002, The regulation of entry, Quarterly Journal of Economics 117, 1-37.
Eesley, Charles, David Hsu, and Edward Roberts, 2007, Entrepreneurs from technology-
based universities: Evidence from MIT, Research Policy, 36, 768-788.
Evans, David S., and Linda S. Leighton, 1989, Some empirical aspects of
entrepreneurship, American Economic Review 79, 519-535.
Ewing, David W., 1990, Inside Harvard Business School: Strategies and Lessons of
America’s Leading School of Business, New York, Times Books.
Giannetti, Mariassunta, and Andrei Simonov, 2007, Social interactions and
entrepreneurial activity, Unpublished working paper, Stockholm School of Economics.

30
Gompers, Paul A., Anna Kovner, Josh Lerner, and David Scharfstein, 2007, Venture
capital investment cycles: The impact of public markets, Journal of Financial
Economics, forthcoming.
Gompers, Paul A., Josh Lerner, and David Scharfstein, 2005, Entrepreneurial spawning:
Public corporations and the genesis of new ventures, 1986 to 1999, Journal of Finance,
60, 577-614.
Holtz-Eakin, Douglas, David Joulfaian, and Harvey S. Rosen, 1994, Sticking it out:
Entrepreneurial survival and liquidity constraints, Journal of Political Economy 102, 53-
75.
Jovanovic, Boyan, 1982, Selection and the evolution of industry, Econometrica 50, 649-
670.
Kanniainen, Vesa, and Christian Keuschnigg, 2004, Venture Capital, Entrepreneurship,
and Public Policy, Cambridge, Massachusetts, MIT Press.
Katz, Jerome A., 2004, Survey of Endowed Positions in Entrepreneurship and Related
Fields in the United States, St Louis, Missouri, J. A. Katz and Associates.
Kremer, Michael and Dan Levy, 2003, Peer effects and alcohol use among college
students, Working paper no. 9876, National Bureau of Economic Research.
Landier, Augustin, and David Thesmar, 2007, Financial contracting with optimistic
entrepreneurs: Theory and evidence, Review of Financial Studies, forthcoming.
Lazear, Edward P., 2005, Entrepreneurship, Journal of Labor Economics 23, 649-680.
Loughran, Tim, and Jay R. Ritter, 2002, Why don't issuers get upset about leaving money
on the table in IPOs?, Review of Financial Studies 15, 413-443.
Manski, Charles F., 1992, Identification of Endogenous Social Effects: The Reflection
Problem, Review of Economic Studies 60, 531–542.
Murphy, Kevin M., Andrei Shleifer, and Robert W. Vishny, 1991, The allocation of
talent: Implications for growth, Quarterly Journal of Economics 106, 503-530.
Nanda, Ramana, and Jesper Sorensen, 2007, Peer effects and entrepreneurship,
Unpublished working paper, Harvard University and Stanford University.
National Venture Capital Association, 2005, 2005 Venture Capital Yearbook, Newark,
New Jersey, Venture Economics.
31
Orth, Charles D., III, 1963, Social Structure and Learning Climate: The First Year at the
Harvard Business School, Boston, Division of Research, Graduate School of Business
Administration, Harvard University.
Parker, Simon C., 2004, The Economics of Self-Employment and Entrepreneurship, New
York, Cambridge University Press.
Sacerdote, Bruce, 2001, Peer effects with random assignment: Results for Dartmouth
roommates, Quarterly Journal of Economics 116, 681-704.
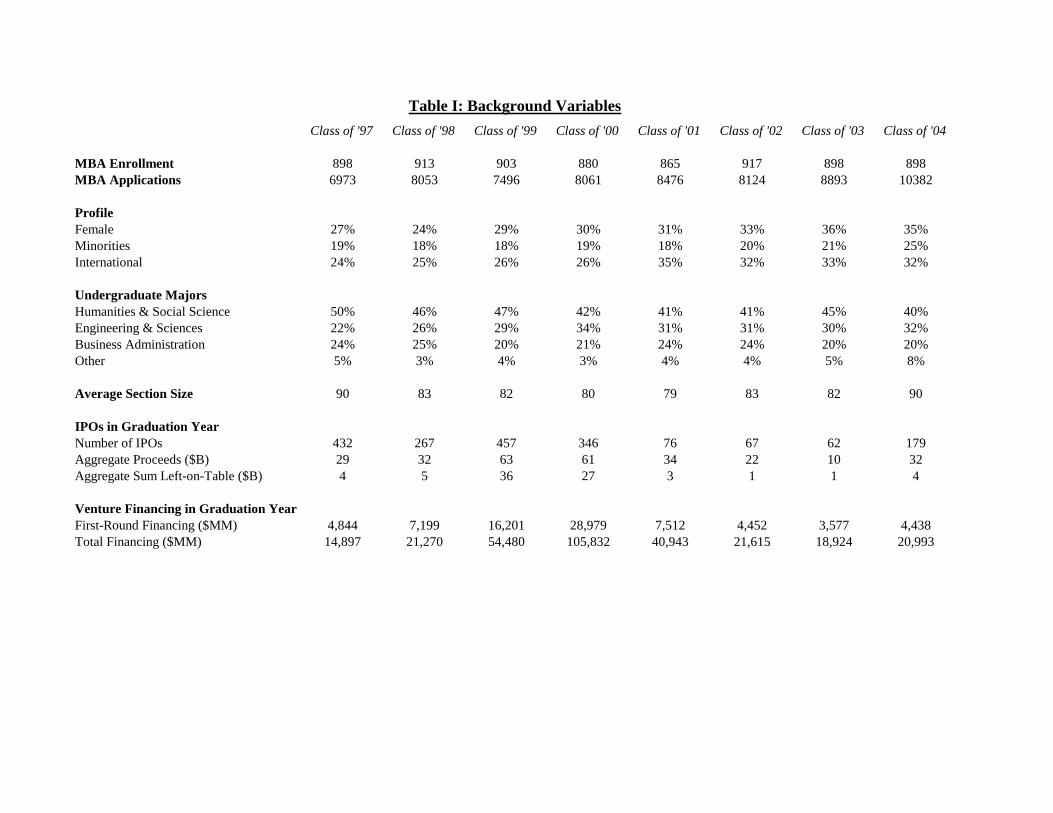
Class of '97 Class of '98 Class of '99 Class of '00 Class of '01 Class of '02 Class of '03 Class of '04
MBA Enrollment 898 913 903 880 865 917 898 898
MBA Applications 6973 8053 7496 8061 8476 8124 8893 10382
Profile
Female 27% 24% 29% 30% 31% 33% 36% 35%
Minorities 19% 18% 18% 19% 18% 20% 21% 25%
International 24% 25% 26% 26% 35% 32% 33% 32%
Undergraduate Majors
Humanities & Social Science 50% 46% 47% 42% 41% 41% 45% 40%
Engineering & Sciences 22% 26% 29% 34% 31% 31% 30% 32%
Business Administration 24% 25% 20% 21% 24% 24% 20% 20%
Other 5% 3% 4% 3% 4% 4% 5% 8%
Average Section Size 90 83 82 80 79 83 82 90
IPOs in Graduation Year
Number of IPOs 432 267 457 346 76 67 62 179
Aggregate Proceeds ($B) 29 32 63 61 34 22 10 32
Aggregate Sum Left-on-Table ($B) 4 5 36 27 3 1 1 4
Venture Financing in Graduation Year
First-Round Financing ($MM) 4,844 7,199 16,201 28,979 7,512 4,452 3,577 4,438
Total Financing ($MM) 14,897 21,270 54,480 105,832 40,943 21,615 18,924 20,993
Table I: Background Variables

Figure 1: Macroeconomic Conditions over Time
0
20,000
40,000
60,000
80,000
100,000
120,000
Class of '97 Class of '98 Class of '99 Class of '00 Class of '01 Class of '02 Class of '03 Class of '04
VC Financing 1997-2004
First-round VC Financing ($MM)
Total VC Financing ($MM)
0
10
20
30
40
50
60
70
Class of '97 Class of '98 Class of '99 Class of '00 Class of '01 Class of '02 Class of '03 Class of '04
IPO Financing 1997-2004
Aggregate IPO Sum Left-on-Table ($B)"
Aggregate IPO Proceeds ($B)
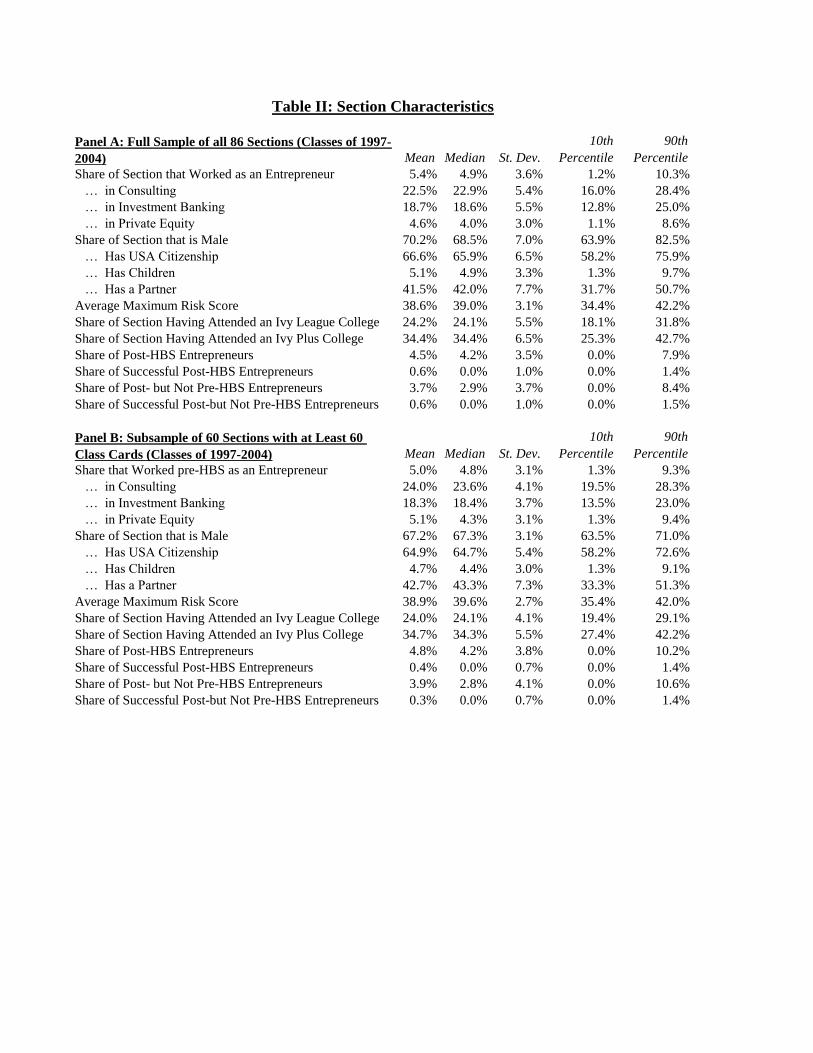
Panel A: Full Sample of all 86 Sections (Classes of 1997-
2004) Mean Median St. Dev.
10th
Percentile
90th
Percentile
Share of Section that Worked as an Entrepreneur 5.4% 4.9% 3.6% 1.2% 10.3%
… in Consulting 22.5% 22.9% 5.4% 16.0% 28.4%
… in Investment Banking 18.7% 18.6% 5.5% 12.8% 25.0%
… in Private Equity 4.6% 4.0% 3.0% 1.1% 8.6%
Share of Section that is Male 70.2% 68.5% 7.0% 63.9% 82.5%
… Has USA Citizenship 66.6% 65.9% 6.5% 58.2% 75.9%
… Has Children 5.1% 4.9% 3.3% 1.3% 9.7%
… Has a Partner 41.5% 42.0% 7.7% 31.7% 50.7%
Average Maximum Risk Score 38.6% 39.0% 3.1% 34.4% 42.2%
Share of Section Having Attended an Ivy League College 24.2% 24.1% 5.5% 18.1% 31.8%
Share of Section Having Attended an Ivy Plus College 34.4% 34.4% 6.5% 25.3% 42.7%
Share of Post-HBS Entrepreneurs 4.5% 4.2% 3.5% 0.0% 7.9%
Share of Successful Post-HBS Entrepreneurs 0.6% 0.0% 1.0% 0.0% 1.4%
Share of Post- but Not Pre-HBS Entrepreneurs 3.7% 2.9% 3.7% 0.0% 8.4%
Share of Successful Post-but Not Pre-HBS Entrepreneurs 0.6% 0.0% 1.0% 0.0% 1.5%
Panel B: Subsample of 60 Sections with at Least 60
Class Cards (Classes of 1997-2004) Mean Median St. Dev.
10th
Percentile
90th
Percentile
Share that Worked pre-HBS as an Entrepreneur 5.0% 4.8% 3.1% 1.3% 9.3%
… in Consulting 24.0% 23.6% 4.1% 19.5% 28.3%
… in Investment Banking 18.3% 18.4% 3.7% 13.5% 23.0%
… in Private Equity 5.1% 4.3% 3.1% 1.3% 9.4%
Share of Section that is Male 67.2% 67.3% 3.1% 63.5% 71.0%
… Has USA Citizenship 64.9% 64.7% 5.4% 58.2% 72.6%
… Has Children 4.7% 4.4% 3.0% 1.3% 9.1%
… Has a Partner 42.7% 43.3% 7.3% 33.3% 51.3%
Average Maximum Risk Score 38.9% 39.6% 2.7% 35.4% 42.0%
Share of Section Having Attended an Ivy League College 24.0% 24.1% 4.1% 19.4% 29.1%
Share of Section Having Attended an Ivy Plus College 34.7% 34.3% 5.5% 27.4% 42.2%
Share of Post-HBS Entrepreneurs 4.8% 4.2% 3.8% 0.0% 10.2%
Share of Successful Post-HBS Entrepreneurs 0.4% 0.0% 0.7% 0.0% 1.4%
Share of Post- but Not Pre-HBS Entrepreneurs 3.9% 2.8% 4.1% 0.0% 10.6%
Share of Successful Post-but Not Pre-HBS Entrepreneurs 0.3% 0.0% 0.7% 0.0% 1.4%
Table II: Section Characteristics
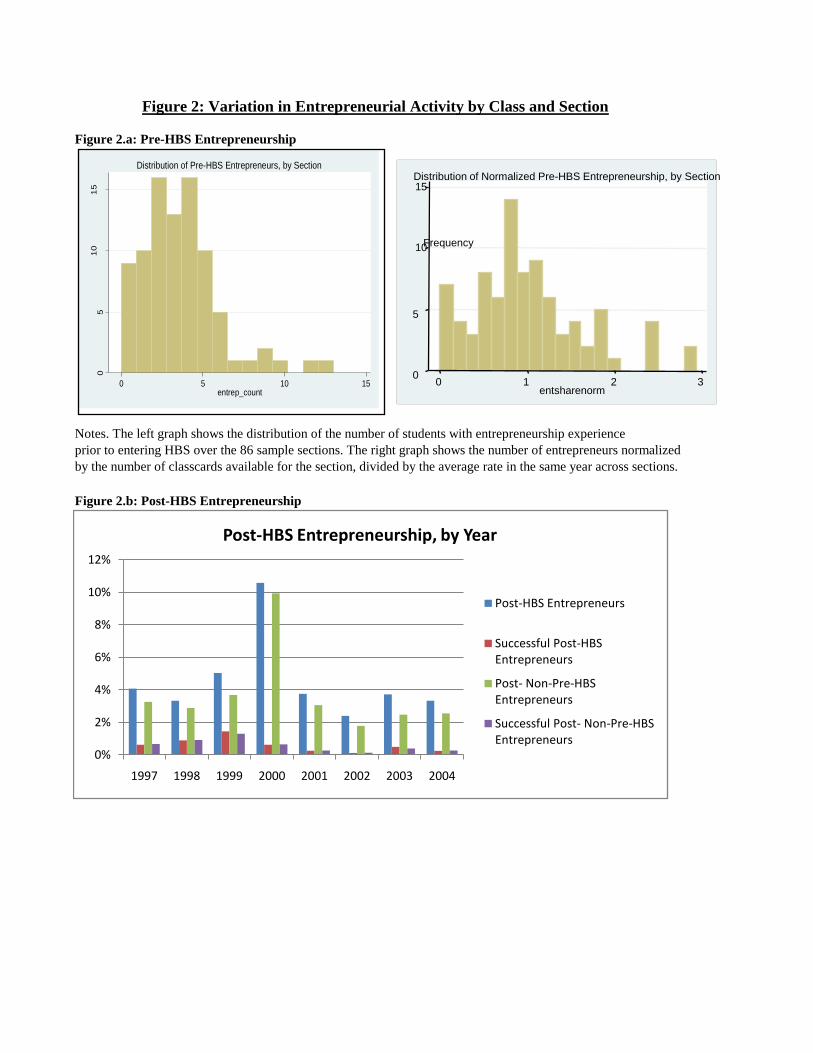
Figure 2: Variation in Entrepreneurial Activity by Class and Section
Figure 2.a: Pre-HBS Entrepreneurship
Figure 2.b: Post-HBS Entrepreneurship
Notes. The left graph shows the distribution of the number of students with entrepreneurship experience
prior to entering HBS over the 86 sample sections. The right graph shows the number of entrepreneurs normalized
by the number of classcards available for the section, divided by the average rate in the same year across sections.
05
10
15
Fre
que
ncy
0 5 10 15entrep_count
Distribution of Pre-HBS Entrepreneurs, by Section
0%
2%
4%
6%
8%
10%
12%
1997 1998 1999 2000 2001 2002 2003 2004
Post-HBS Entrepreneurship, by Year
Post-HBS Entrepreneurs
Successful Post-HBS Entrepreneurs
Post- Non-Pre-HBS Entrepreneurs
Successful Post- Non-Pre-HBS Entrepreneurs
0
5
10
15
Frequency
0 1 2 3entsharenorm
Distribution of Normalized Pre-HBS Entrepreneurship, by Section

Panel A: Full Sample (86 Sections, Classes of 1997-2004)
Below
median
Above
median
p-
values
Share that Worked as an Entrepreneur 5.0% 2.5% 7.8%(3.4%) (1.6%) (2.7%)
… in Consulting 22.9% 22.8% 23.0% 0.81(5.3%) (5.3%) (5.4%)
… in Investment Banking 19.3% 19.0% 19.5% 0.70(5.7%) (4.8%) (6.6%)
… in Private Equity 4.7% 5.0% 4.2% 0.23(3.0%) (3.0%) (3.0%)
Share of Section that is Male 69.4% 69.5% 69.3% 0.92(7.1%) (7.3%) (7.0%)
… Has USA Citizenship 66.9% 67.6% 66.1% 0.28(6.7%) (6.7%) (6.7%)
… Has Children 4.9% 4.9% 4.9% 0.99(3.1%) (3.4%) (3.1%)
… Has a Partner 41.3% 41.9% 40.6% 0.41(7.4%) (6.6%) (8.2%)
Average Maximum Risk Score 38.4% 38.4% 38.4% 0.93(3.2%) (2.7%) (3.7%)
Share of Section Having Attended an Ivy League College 24.0% 25.1% 22.9% 0.05(5.3%) (5.1%) (5.3%)
Share of Section Having Attended an Ivy Plus College 34.3% 35.5% 32.9% 0.05(6.3%) (5.8%) (6.6%)
Share that Worked Pre-HBS in Consulting -0.034
[0.101]
… in Investment Banking 0.037
[0.062]
… in Private Equity -0.089
[0.138]
Share of Section that is Male -0.004
[0.093]
… Has USA Citizenship -0.031
[0.070]
… Has Children -0.086
[0.137]
… Has a Partner 0.094
[0.084]
Average Maximum Risk Score -0.024
[0.154]
Year Fixed Effects yes
F( 8, 70) = 0.33
Prob > F = 0.951
Robust standard errors in brackets. All section-level measures (except for pre-HBS entrepreneurs) do not include
pre-HBS entrepreneurs.
The last column shows heteroskedasticity-robust p-values for the test of no difference in means between the Below-Median and Above-Median subsamples.
All section-level measures (except for pre-HBS entrepreneurs) do not include pre-HBS entrepreneurs.
Panel B: Predicting the Share of Pre-HBS entrepreneurs
Table III. Test of Randomization
Mean (St.Dev.)
# of EntrepreneursFull
Sample

Figure 3: Relationship between Pre- and Post-HBS Entrepreneurship, by Section

Table IV: Correlation Coefficients
Share of Post-HBS
Entrepreneurs
Share of Successful
Post-HBS
Entrepreneurs
Share of Post-HBS
Entrepreneurs
Share of Successful
Post-HBS
Entrepreneurs
Share of Post-HBS Entrepreneurs 1.00 1.00
Share of Successful Post-HBS Entrepreneurs 0.08 1.00 0.19 1.00
(0.449) (0.147)
Share of Section that Worked as an Entrepreneur -0.17 0.12 -0.33 0.12
(0.116) (0.258) (0.011) (0.371)
… in Consulting -0.09 -0.12 -0.13 -0.08
(0.425) (0.278) (0.332) (0.565)
… Investment Banking -0.03 0.00 -0.13 -0.13
(0.774) (0.995) (0.321) (0.315)
… Private Equity -0.04 -0.09 -0.08 0.02
(0.701) (0.409) (0.563) (0.867)
Share of Section that is Male 0.03 0.16 0.33 0.05
(0.766) (0.147) (0.010) (0.731)
… Has USA Citizenship 0.16 0.08 0.24 0.00
(0.132) (0.479) (0.068) (0.983)
… Has Children 0.23 -0.03 0.25 0.11
(0.030) (0.804) (0.057) (0.414)
… Has a Partner -0.11 -0.01 -0.13 0.04
(0.338) (0.919) (0.325) (0.748)
Average Maximum Risk Score of Section -0.04 0.02 -0.04 0.12
(0.721) (0.877) (0.762) (0.354)
IPO Proceeds in Graduation Year ($ trillion) 0.46 0.23 0.57 0.16
(0.000) (0.031) (0.000) (0.219)
Total Venture Funding in Graduation Year ($ trillion) 0.63 0.10 0.70 0.22
(0.000) (0.351) (0.000) (0.095)
All section-level measures (except for pre-HBS entrepreneurs) do not include pre-HBS entrepreneurs.
p-Values in parentheses.
All 86 Sections, Classes of 1997-2004
60 Sections with at Least 60 Responses,
Classes of 1997-2004
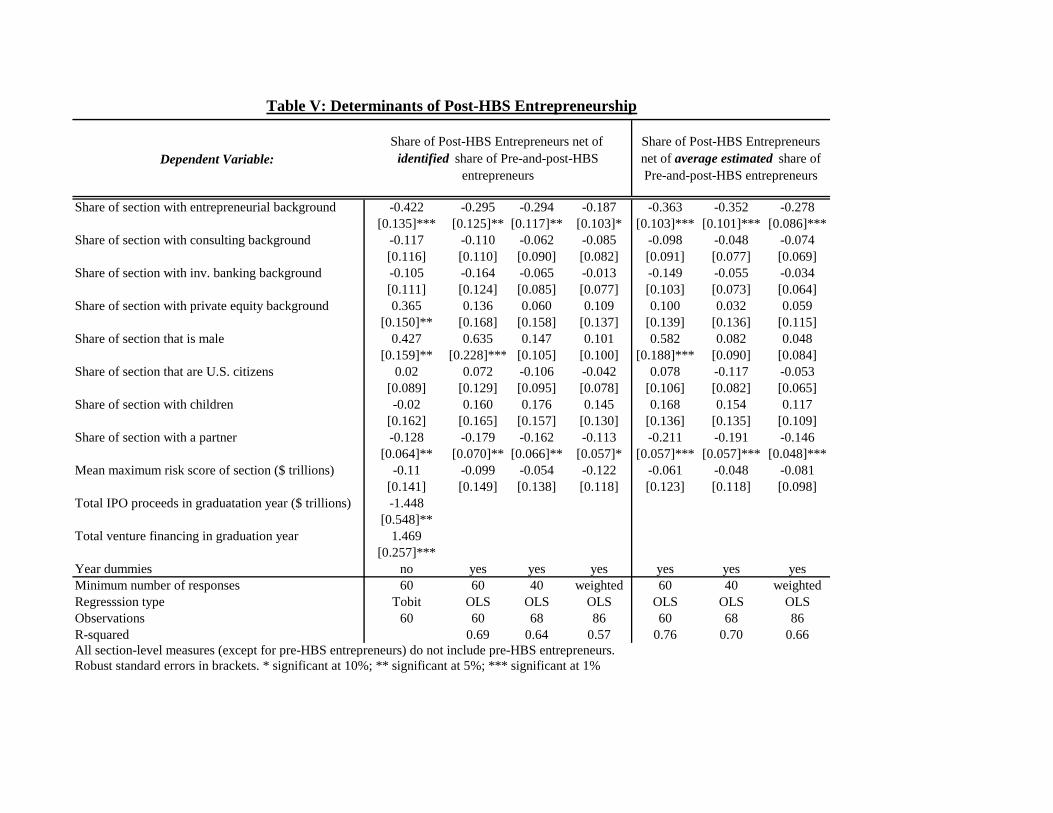
Dependent Variable:
Share of section with entrepreneurial background -0.422 -0.295 -0.294 -0.187 -0.363 -0.352 -0.278
[0.135]*** [0.125]** [0.117]** [0.103]* [0.103]*** [0.101]*** [0.086]***
Share of section with consulting background -0.117 -0.110 -0.062 -0.085 -0.098 -0.048 -0.074
[0.116] [0.110] [0.090] [0.082] [0.091] [0.077] [0.069]
Share of section with inv. banking background -0.105 -0.164 -0.065 -0.013 -0.149 -0.055 -0.034
[0.111] [0.124] [0.085] [0.077] [0.103] [0.073] [0.064]
Share of section with private equity background 0.365 0.136 0.060 0.109 0.100 0.032 0.059
[0.150]** [0.168] [0.158] [0.137] [0.139] [0.136] [0.115]
Share of section that is male 0.427 0.635 0.147 0.101 0.582 0.082 0.048
[0.159]** [0.228]*** [0.105] [0.100] [0.188]*** [0.090] [0.084]
Share of section that are U.S. citizens 0.02 0.072 -0.106 -0.042 0.078 -0.117 -0.053
[0.089] [0.129] [0.095] [0.078] [0.106] [0.082] [0.065]
Share of section with children -0.02 0.160 0.176 0.145 0.168 0.154 0.117
[0.162] [0.165] [0.157] [0.130] [0.136] [0.135] [0.109]
Share of section with a partner -0.128 -0.179 -0.162 -0.113 -0.211 -0.191 -0.146
[0.064]** [0.070]** [0.066]** [0.057]* [0.057]*** [0.057]*** [0.048]***
Mean maximum risk score of section ($ trillions) -0.11 -0.099 -0.054 -0.122 -0.061 -0.048 -0.081
[0.141] [0.149] [0.138] [0.118] [0.123] [0.118] [0.098]
Total IPO proceeds in graduatation year ($ trillions) -1.448
[0.548]**
Total venture financing in graduation year 1.469
[0.257]***
Year dummies no yes yes yes yes yes yes
Minimum number of responses 60 60 40 weighted 60 40 weighted
Regresssion type Tobit OLS OLS OLS OLS OLS OLS
Observations 60 60 68 86 60 68 86
R-squared 0.69 0.64 0.57 0.76 0.70 0.66
All section-level measures (except for pre-HBS entrepreneurs) do not include pre-HBS entrepreneurs.
Robust standard errors in brackets. * significant at 10%; ** significant at 5%; *** significant at 1%
Table V: Determinants of Post-HBS Entrepreneurship
Share of Post-HBS Entrepreneurs
net of average estimated share of
Pre-and-post-HBS entrepreneurs
Share of Post-HBS Entrepreneurs net of
identified share of Pre-and-post-HBS
entrepreneurs

Panel A. Successful Entrepreneurship
Dependent Variable:
Share of section with entrepreneurial background 0.105 0.040 0.067 0.041 0.035 0.057 0.044
[0.117] [0.035] [0.042] [0.033] [0.016]** [0.021]*** [0.016]***
Share of section with consulting background -0.127 -0.030 -0.057 -0.023 0.004 -0.012 0.003
[0.114] [0.031] [0.032]* [0.026] [0.014] [0.016] [0.012]
Share of section with inv. banking background -0.148 -0.027 -0.001 0.009 -0.002 -0.009 0.004
[0.120] [0.035] [0.030] [0.025] [0.016] [0.015] [0.012]
Share of section with private equity background 0.025 0.010 0.009 0.025 -0.007 -0.013 -0.005
[0.148] [0.048] [0.056] [0.044] [0.021] [0.029] [0.021]
Share of section that is male -0.072 0.042 -0.033 0.001 0.018 0.000 0.010
[0.165] [0.065] [0.037] [0.032] [0.029] [0.019] [0.015]
Share of section that are U.S. citizens -0.045 -0.008 -0.050 -0.027 0.005 -0.016 -0.002
[0.093] [0.036] [0.034] [0.025] [0.016] [0.017] [0.012]
Share of section with children -0.092 0.015 -0.019 -0.023 -0.004 -0.034 -0.026
[0.164] [0.047] [0.056] [0.042] [0.021] [0.028] [0.020]
Share of section with a partner -0.011 0.003 0.030 0.023 0.004 0.019 0.015
[0.056] [0.020] [0.023] [0.018] [0.009] [0.012] [0.009]*
Mean maximum risk score of section 0.104 0.044 0.055 0.036 0.004 0.000 0.001
[0.149] [0.042] [0.049] [0.038] [0.019] [0.025] [0.018]
Total IPO proceeds in graduatation year ($ trillions) 0.173
[0.497]
Total venture financing in graduation year ($ trillions) 0.189
[0.237]
Year dummies no yes yes yes yes yes yes
Minimum number of responses 60 60 40 weighted 60 40 weighted
Regresssion type Tobit OLS OLS OLS OLS OLS OLS
Observations 60 60 68 86 60 68 86
R-squared 0.17 0.34 0.20 0.18 0.36 0.26
All section-level measures (except for pre-HBS entrepreneurs) do not include pre-HBS entrepreneurs.
Robust standard errors in brackets. * significant at 10%; ** significant at 5%; *** significant at 1%
Table VI: Determinants of Successful and Unsuccessful Entrepreneurship
Share of Successful Post-HBS
Entrepreneurs net of average
estimated share of Pre-and-post-
HBS entrepreneurs
Share of Successful Post-HBS Entrepreneurs net
of identified share of Pre-and-post-HBS
entrepreneurs

Panel B. Unsuccessful Entrepreneurship Tobit
Dependent Variable:
Share of section with entrepreneurial background -0.449 -0.316 -0.310 -0.197 -0.380 -0.383 -0.302
[0.142]*** [0.126]** [0.115]*** [0.103]* [0.103]*** [0.099]*** [0.086]***
Share of section with consulting background -0.090 -0.082 -0.021 -0.067 -0.096 -0.036 -0.073
[0.124] [0.111] [0.088] [0.082] [0.090] [0.076] [0.068]
Share of section with inv. banking background -0.080 -0.146 -0.095 -0.040 -0.148 -0.052 -0.042
[0.117] [0.125] [0.083] [0.077] [0.102] [0.072] [0.064]
Share of section with private equity background 0.387 0.136 0.050 0.091 0.109 0.043 0.061
[0.159]** [0.170] [0.155] [0.137] [0.139] [0.133] [0.114]
Share of section that is male 0.479 0.598 0.187 0.106 0.576 0.086 0.043
[0.171]*** [0.230]** [0.102]* [0.100] [0.188]*** [0.088] [0.083]
Share of section that are U.S. citizens 0.021 0.081 -0.083 -0.028 0.082 -0.102 -0.050
[0.093] [0.130] [0.093] [0.078] [0.106] [0.081] [0.065]
Share of section with children 0.002 0.154 0.156 0.138 0.171 0.175 0.134
[0.170] [0.167] [0.153] [0.130] [0.136] [0.132] [0.108]
Share of section with a partner -0.138 -0.192 -0.183 -0.133 -0.210 -0.199 -0.153
[0.067]** [0.070]***[0.065]*** [0.057]** [0.057]*** [0.056]*** [0.047]***
Mean maximum risk score of section -0.162 -0.143 -0.119 -0.157 -0.070 -0.055 -0.088
[0.150] [0.150] [0.135] [0.117] [0.123] [0.116] [0.098]
Total IPO proceeds in graduatation year ($ trillions) -1.396
[0.578]**
Total venture financing in graduation year ($ trillions) 1.402
[0.270]***
Year dummies no yes yes yes yes yes yes
Minimum number of responses 60 60 40 weighted 60 40 weighted
Regresssion type Tobit OLS OLS OLS OLS OLS OLS
Observations 60 60 68 86 60 68 86
R-squared 0.67 0.64 0.56 0.76 0.71 0.67
p-Value, test of equality of entrepreneurial background var. 0.008 0.008 0.003 0.030 0.000 0.000 0.000
All section-level measures (except for pre-HBS entrepreneurs) do not include pre-HBS entrepreneurs.
Robust standard errors in brackets. * significant at 10%; ** significant at 5%; *** significant at 1%
Share of Unsuccessful Post-HBS
Entrepreneurs net of average
estimated share of Pre-and-post-
HBS entrepreneurs
Share of Unsuccessful Post-HBS Entrepreneurs
net of identified share of Pre-and-post-HBS
entrepreneurs

Dependent Variable: Share of Non-Pre HBS Entrepreneurs Section Becoming Entrepreneurs Post-HBS Which Are…
"Super" successful Not "super" successful Successful Unsuccessful
Share of section with entrepreneurial background 0.027 -0.305 0.021 -0.271
[0.015]* [0.126]** [0.035] [0.128]**
Share of section with consulting background 0.000 -0.111 -0.037 -0.064
[0.013] [0.110] [0.030] [0.110]
Share of section with inv. banking background -0.005 -0.167 -0.029 -0.142
[0.015] [0.125] [0.034] [0.124]
Share of section with private equity background -0.004 0.148 0.022 0.107
[0.020] [0.170] [0.046] [0.169]
Share of section that is male 0.000 0.640 0.062 0.551
[0.027] [0.230]*** [0.062] [0.230]**
Share of section that are U.S. citizens -0.017 0.090 -0.012 0.091
[0.015] [0.130] [0.035] [0.129]
Share of section with children 0.040 0.127 -0.004 0.199
[0.020]** [0.166] [0.046] [0.168]
Share of section with a partner -0.025 -0.163 0.004 -0.194
[0.008]*** [0.070]** [0.019] [0.069]***
Mean maximum risk score of section 0.002 -0.101 0.057 -0.173
[0.018] [0.150] [0.041] [0.150]
Share of section having attended an "Ivy Plus" college -0.071 0.169
[0.032]** [0.117]
Year dummies yes yes yes yes
Minimum number of responses 60 60 60 60
Regression type OLS OLS OLS OLS60 60
Observations 60 60 60 60
R-squared 0.32 0.68 0.26 0.68
p-Value, test of equality of entrepreneurial background var. 0.007 0.030
All section-level measures (except for pre-HBS entrepreneurs) do not include pre-HBS entrepreneurs.
Robust standard errors in brackets. * significant at 10%; ** significant at 5%; *** significant at 1%
Table VII: Determinants of Successful and Unsuccessful Post-HBS Entrepreneurship: Robustness Checks

Dependent Variable:
Share of section with entrepreneurial background 0.020 0.029 0.026
[0.082] [0.075] [0.061]
Share of section with consulting background 0.058 0.003 -0.006
[0.072] [0.057] [0.048]
Share of section with inv. banking background -0.050 -0.048 -0.061
[0.082] [0.054] [0.045]
Share of section with private equity background 0.010 0.054 0.067
[0.111] [0.101] [0.081]
Share of section that is male -0.282 -0.102 -0.120
[0.150]* [0.067] [0.059]**
Share of section that are U.S. citizens -0.149 -0.105 -0.069
[0.085]* [0.061]* [0.046]
Share of section with children 0.116 0.104 0.102
[0.109] [0.100] [0.077]
Share of section with a partner -0.075 -0.058 -0.059
[0.046] [0.042] [0.034]*
Mean maximum risk score of section 0.094 0.100 0.092
[0.098] [0.088] [0.069]
Year dummies yes yes yes
Minimum number of responses 60 40 weighted
Regression type OLS OLS OLS
Observations 60 68 86
R-squared 0.87 0.89 0.89
All section-level measures (except for pre-HBS entrepreneurs) do not include pre-HBS entrepreneurs.
Robust standard errors in brackets. * significant at 10%; ** significant at 5%; *** significant at 1%
Table VIII: Determinants of Enrollment in Elective Entrepreneurship Classes
Share of Entrepreneurhip Classes
Selected by Students in the
Section who were Not Pre-HBS
Entrepreneurs
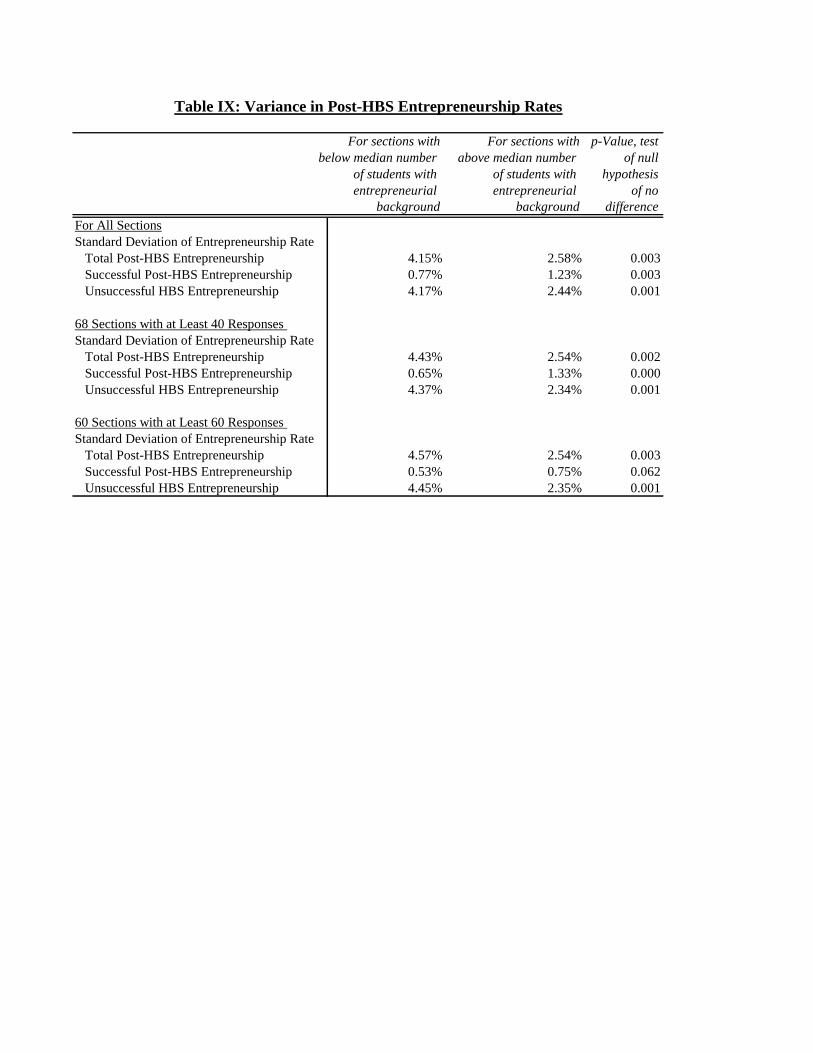
For sections with For sections with p-Value, test
below median number above median number of null
of students with of students with hypothesis
entrepreneurial entrepreneurial of no
background background difference
For All Sections
Standard Deviation of Entrepreneurship Rate
Total Post-HBS Entrepreneurship 4.15% 2.58% 0.003
Successful Post-HBS Entrepreneurship 0.77% 1.23% 0.003
Unsuccessful HBS Entrepreneurship 4.17% 2.44% 0.001
68 Sections with at Least 40 Responses
Standard Deviation of Entrepreneurship Rate
Total Post-HBS Entrepreneurship 4.43% 2.54% 0.002
Successful Post-HBS Entrepreneurship 0.65% 1.33% 0.000
Unsuccessful HBS Entrepreneurship 4.37% 2.34% 0.001
60 Sections with at Least 60 Responses
Standard Deviation of Entrepreneurship Rate
Total Post-HBS Entrepreneurship 4.57% 2.54% 0.003
Successful Post-HBS Entrepreneurship 0.53% 0.75% 0.062
Unsuccessful HBS Entrepreneurship 4.45% 2.35% 0.001
Table IX: Variance in Post-HBS Entrepreneurship Rates