with lean six-sigma” · with lean six-sigma ... kpi generation, implementation, training total...
TRANSCRIPT

1
“Improving Business Efficiency
with Lean Six-Sigma”
Supported By:
2
“Improving Business Efficiency
with Lean Six-Sigma”
Anton Sekula
Lean Six-Sigma Business
Specialist, Vative
Greg Lacey
Quality Manager, Omniblend
Alice Tarquinio
Information &
Communications Technology
Department, La Trobe
University Introduced by:
Tim Barsony
Director, Vative Introduced by:
Parth Bommakanti
Lean Six Sigma Leadership &
Behavioural Specialist, Vative
Results Driven – facilitating Business
Improvement through training and coaching.
Has 40 team members and represented in
all 6 states.
Service a wide range of industries incl
agriculture, manufacturing, logistics,
government, health & others.
Practice what we preach – efficient and
effective delivering best value
Successful - proven Return On Investment
(ROI)
Long term partner – interested in your
business sustainability and longevity
3
About Vative.
“Improving People,
Businesses and
Societies.”
PURPOSE:

4
Agenda for next 45 mins:
Vative Improving Productivity in Australia through Innovation
What is Lean?
How is Lean Implemented?
Case Studies
Funding Support for the Business Owner
5
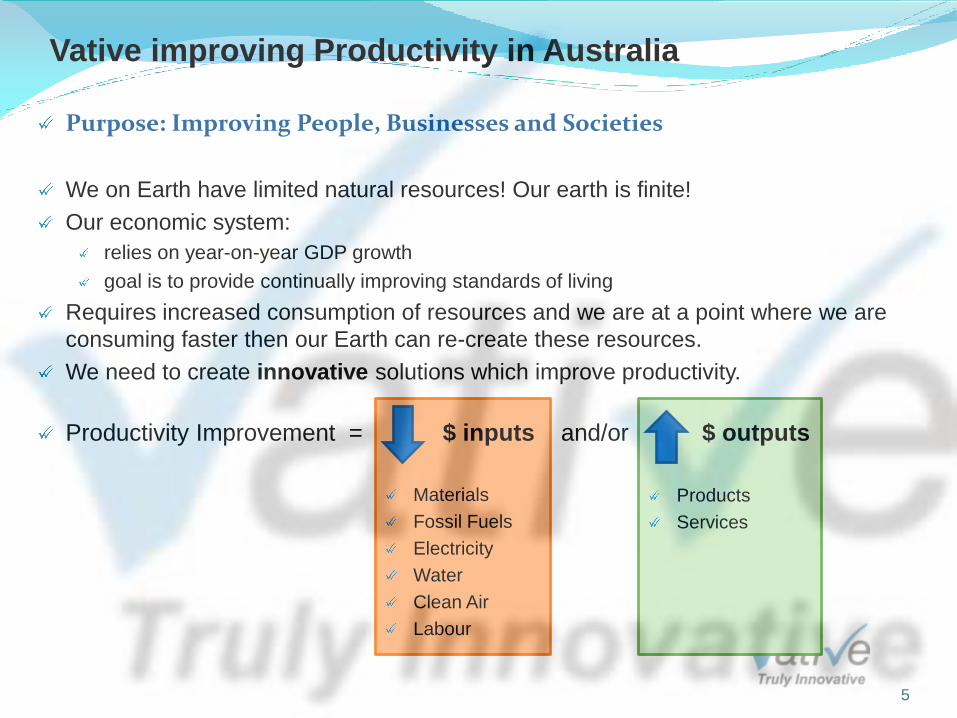
Vative improving Productivity in Australia
Purpose: Improving People, Businesses and Societies
We on Earth have limited natural resources! Our earth is finite!
Our economic system:
relies on year-on-year GDP growth
goal is to provide continually improving standards of living
Requires increased consumption of resources and we are at a point where we are
consuming faster then our Earth can re-create these resources.
We need to create innovative solutions which improve productivity.
Productivity Improvement = $ inputs and/or $ outputs
Materials
Fossil Fuels
Electricity
Water
Clean Air
Labour
Products
Services

6
Vative improving Productivity in Australia
As a resource-hungry economy, Australia has a greater responsibility to innovate to
improve productivity of resources.
What happens if we don’t improve?
What are the short term impacts?
What are the long term impacts?
7
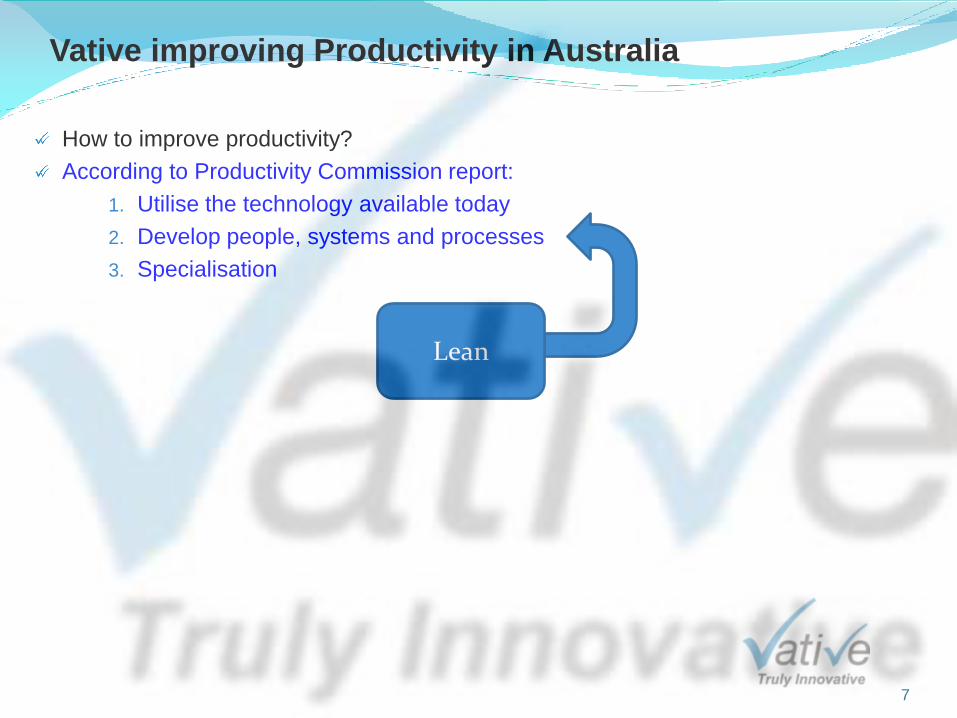
Vative improving Productivity in Australia
How to improve productivity?
According to Productivity Commission report:
1. Utilise the technology available today
2. Develop people, systems and processes
3. Specialisation
Lean
8
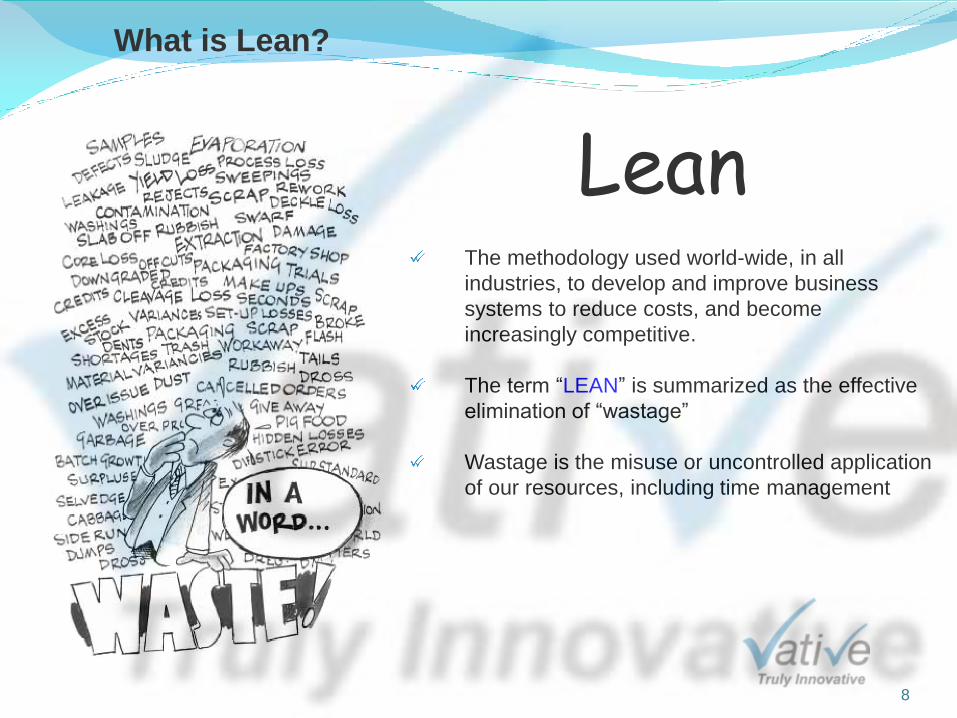
Lean
What is Lean?
The methodology used world-wide, in all
industries, to develop and improve business
systems to reduce costs, and become
increasingly competitive.
The term “LEAN” is summarized as the effective
elimination of “wastage”
Wastage is the misuse or uncontrolled application
of our resources, including time management
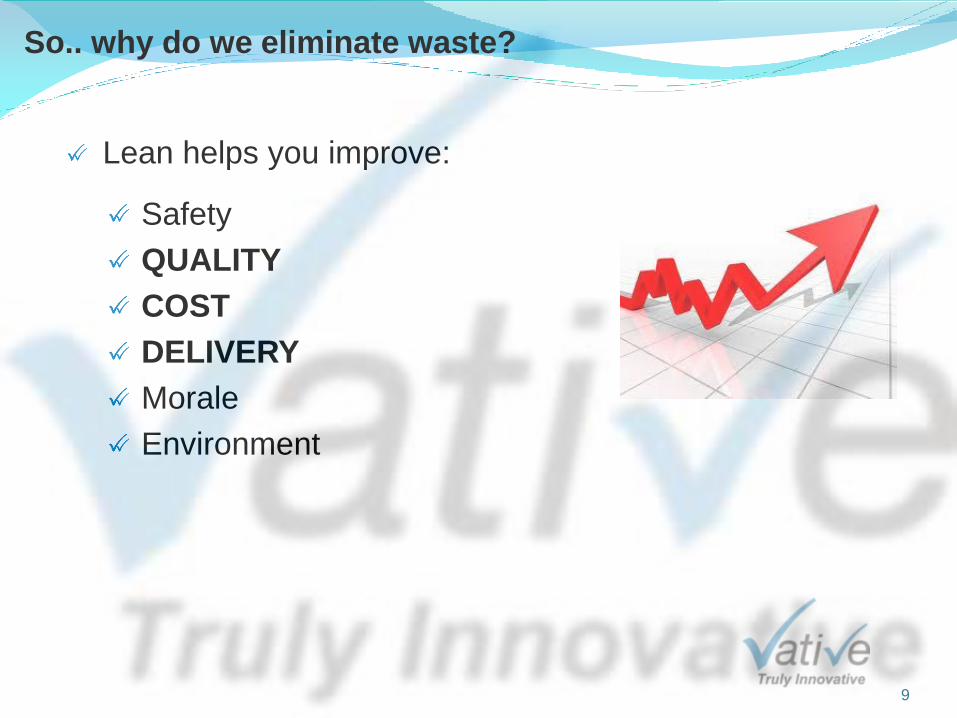
So.. why do we eliminate waste?
Lean helps you improve:
Safety
QUALITY
COST
DELIVERY
Morale
Environment
9

Lean History
Craft
Production
Mass
Production
Lean
Production
1890s,
Europe 1910s,
US
1950s,
Japan
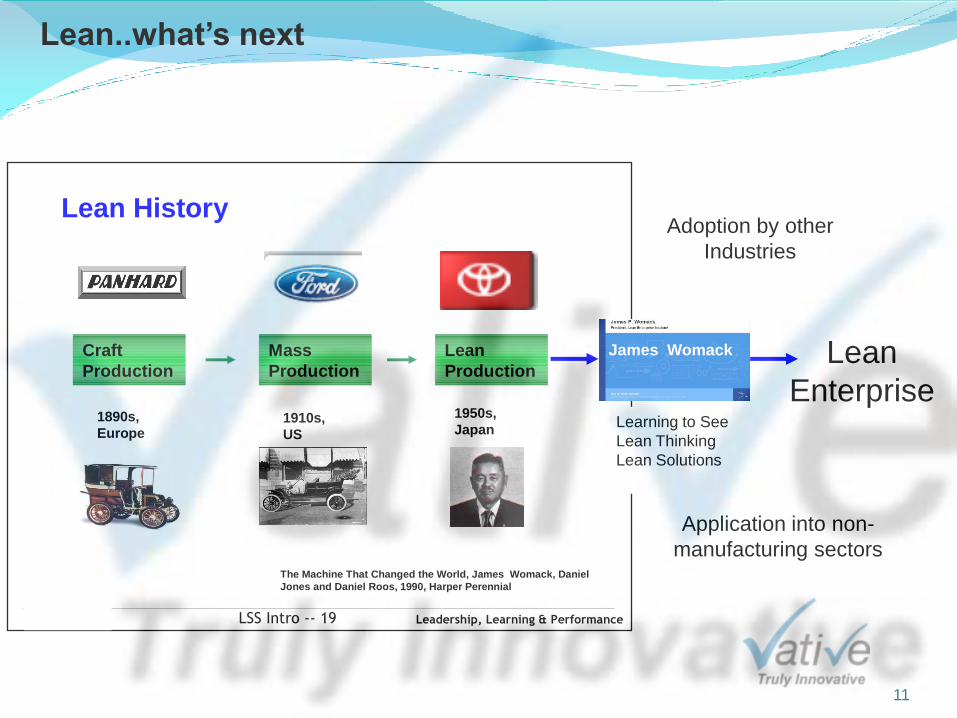
The Machine That Changed the World, James Womack, Daniel
Jones and Daniel Roos, 1990, Harper Perennial
10
Leadership, Learning & PerformanceLSS Intro -- 19
Lean History
Craft
Production
Mass
Production
Lean
Production
1890s,
Europe1910s,
US
1950s,
Japan
The Machine That Changed the World, James Womack, Daniel
Jones and Daniel Roos, 1990, Harper Perennial
Lean..what’s next
Lean
Enterprise
James Womack
Learning to See
Lean Thinking
Lean Solutions
Adoption by other
Industries
Application into non-
manufacturing sectors
11

12
The Toyota Way
The Toyota Way by Jeffery Liker – The Four P’s
Philosophy - Long Term Thinking
Process - Eliminate Waste
People and Partners - Respect, Challenge and Grow them
Problem Solving - Continuous Improvement and Learning
Lean Empowerment
Lean Empowerment:
A management philosophy to develop the full potential of every team member to
contribute toward the shared business goals.
As improvements are made, workplace becomes a positive culture and people
desire to improve more.
Requires ability to trust the workforce and allow people to be experts at their
process. Put boundaries and controls in place so you can move away from the need
for micromanagement.
Does not remove authority from management but encourages two-way respect.
Like all improvement it requires an INVESTMENT of time/resources.
13 Vative - Truly Innovative
14
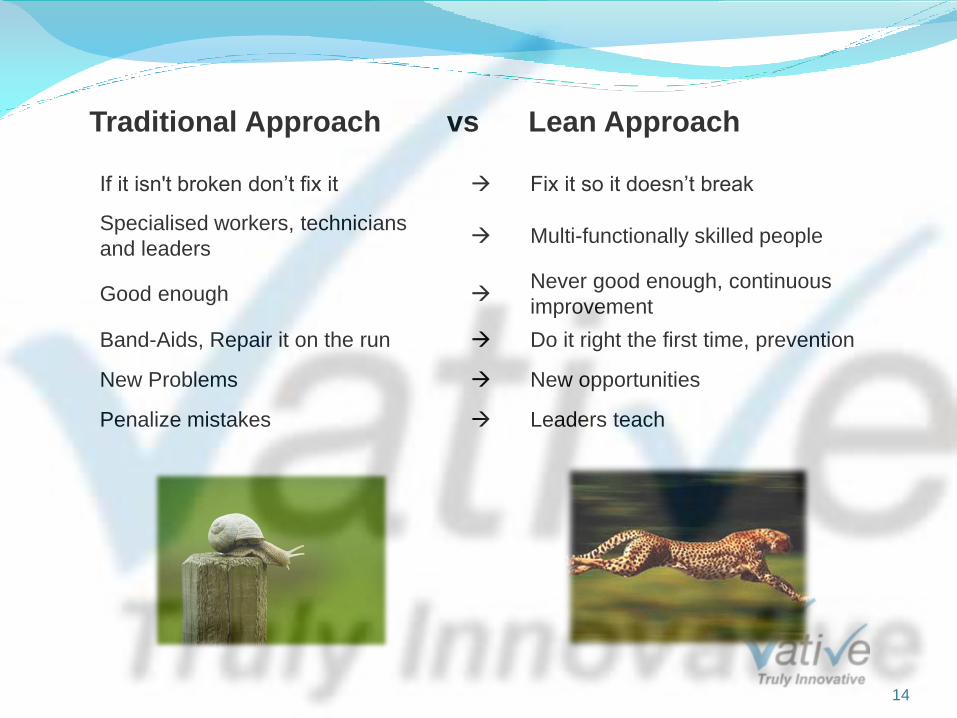
Traditional Approach vs Lean Approach
If it isn't broken don’t fix it Fix it so it doesn’t break
Specialised workers, technicians
and leaders Multi-functionally skilled people
Good enough Never good enough, continuous
improvement
Band-Aids, Repair it on the run Do it right the first time, prevention
New Problems New opportunities
Penalize mistakes Leaders teach
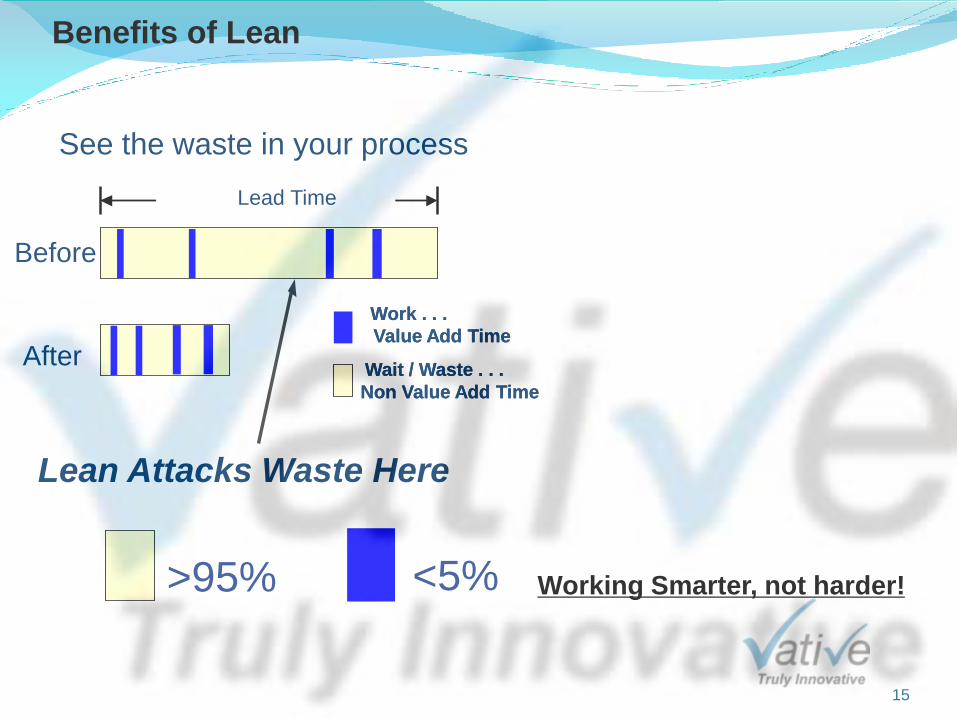
See the waste in your process
After
Before
Wait / Waste . . .
Non Value Add Time
Wait / Waste . . .
Non Value Add Time
Lean Attacks Waste Here
Work . . .
Value Add Time
Work . . .
Value Add Time
Lead Time
Benefits of Lean
Reduced cycles
Better delivery
More capacity
Better quality
Higher productivity
Higher
customer/client
satisfaction <5% >95% Working Smarter, not harder!
15

Exercise
Draw a star on flipchart
16
17
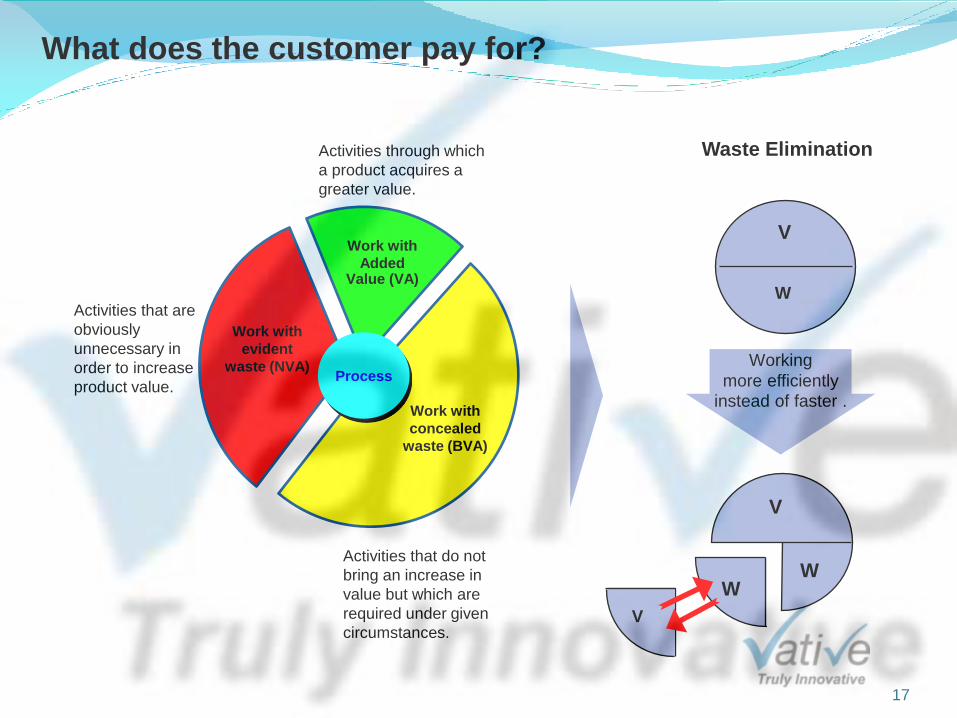
Work with
Added Value (VA)
Work with
evident
waste (NVA)
Work with
concealed
waste (BVA)
Process
Activities through which
a product acquires a
greater value.
Activities that are
obviously
unnecessary in
order to increase
product value.
Activities that do not
bring an increase in
value but which are
required under given
circumstances.
V
W
W
V
W
V
Working
more efficiently
instead of faster .
Waste Elimination
What does the customer pay for?
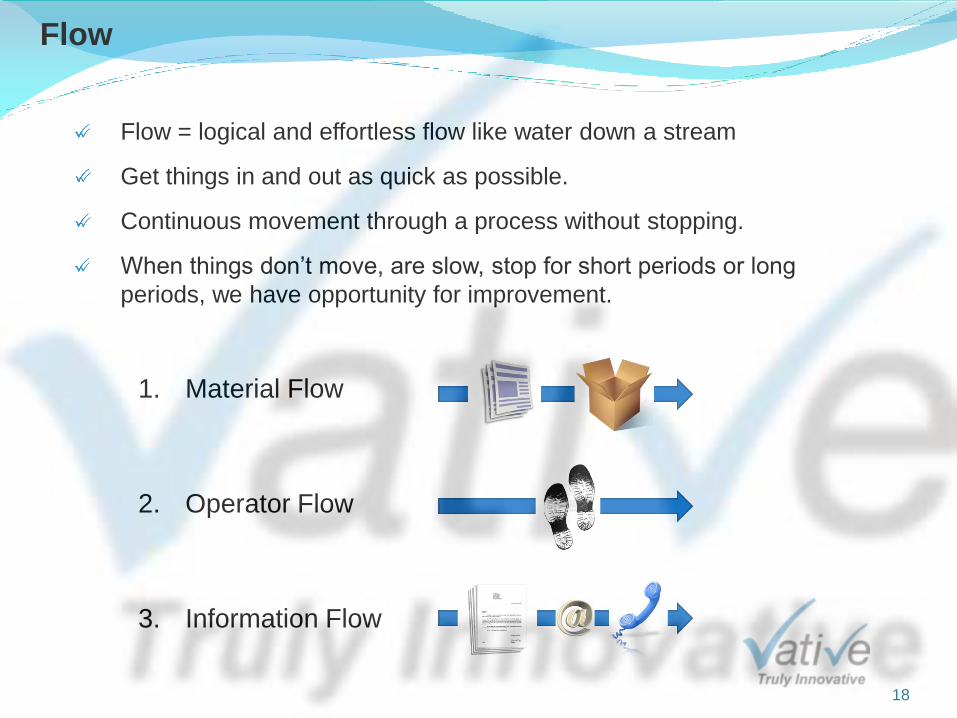
Flow
Flow = logical and effortless flow like water down a stream
Get things in and out as quick as possible.
Continuous movement through a process without stopping.
When things don’t move, are slow, stop for short periods or long
periods, we have opportunity for improvement.
18
1. Material Flow
2. Operator Flow
3. Information Flow
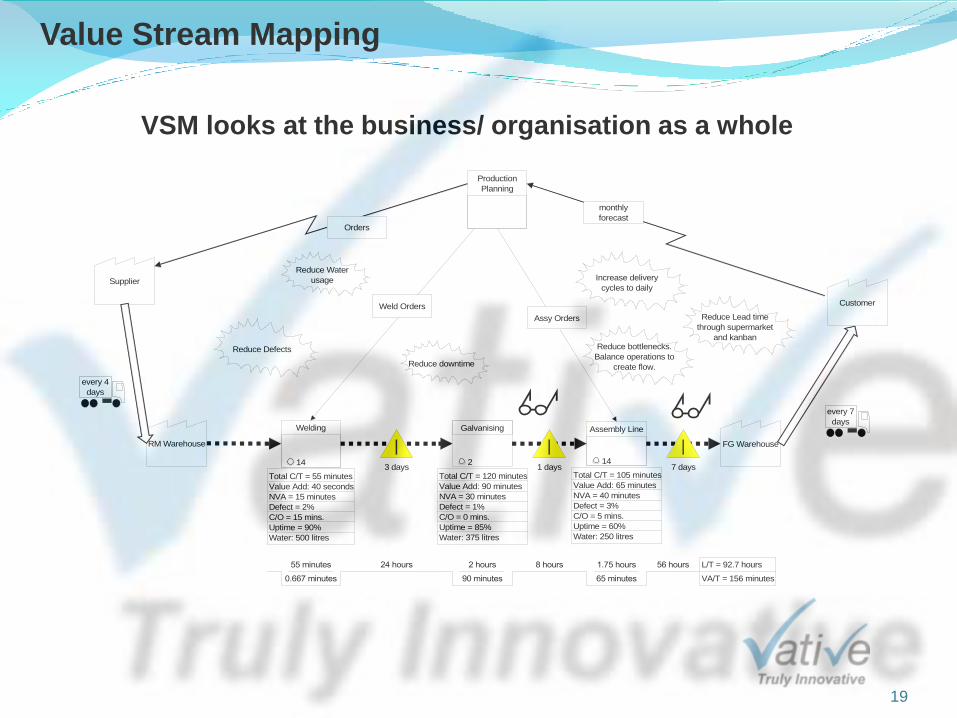
Value Stream Mapping
19
Customer Demand:
15 pieces per Month
(Takt Time 1.4 days)
Welding
Total C/T = 55 minutes
Value Add: 40 seconds
NVA = 15 minutes
Defect = 2%
C/O = 15 mins.
Uptime = 90%
Water: 500 litres
14
Production
Planning
Supplier
Weld Orders
Orders
monthly
forecast
every 7
days
Assembly Line
Total C/T = 105 minutes
Value Add: 65 minutes
NVA = 40 minutes
Defect = 3%
C/O = 5 mins.
Uptime = 60%
Water: 250 litres
147 days3 days
FG Warehouse
Assy Orders
RM Warehouse
Galvanising
Total C/T = 120 minutes
Value Add: 90 minutes
NVA = 30 minutes
Defect = 1%
C/O = 0 mins.
Uptime = 85%
Water: 375 litres
21 days
VSM - Trailer Company
Reduce Lead time
through supermarket
and kanban
Reduce Defects
Reduce Water
usage
Reduce downtime
Increase delivery
cycles to daily
every 4
days
Reduce bottlenecks.
Balance operations to
create flow.
0.667 minutes
55 minutes 24 hours
90 minutes
2 hours 8 hours
65 minutes
1.75 hours 56 hours L/T = 92.7 hours
VA/T = 156 minutes
Customer
VSM looks at the business/ organisation as a whole
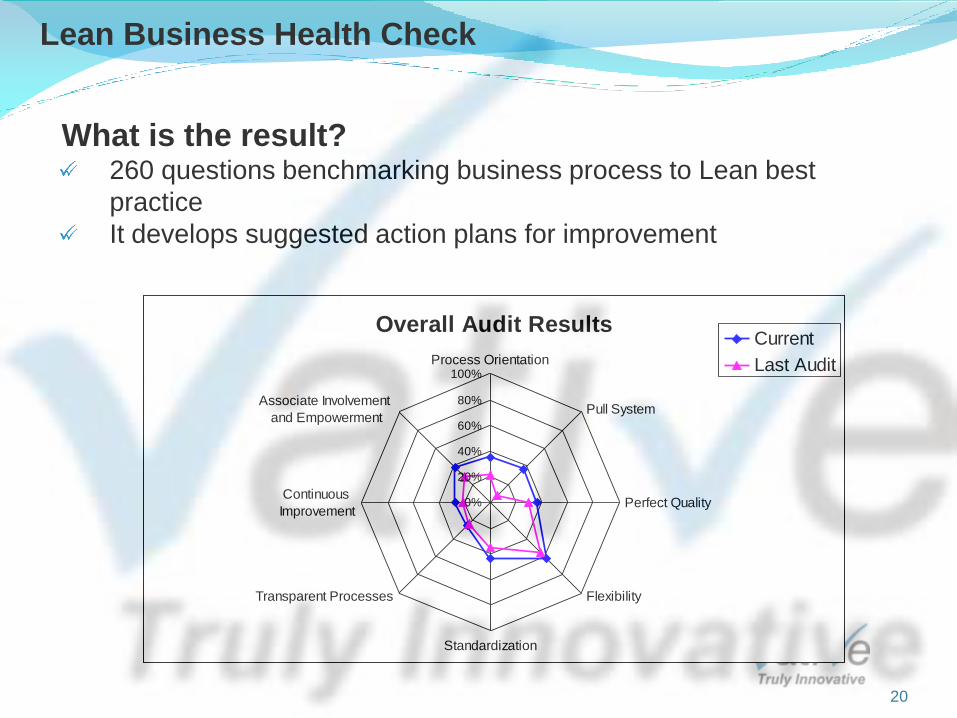
Lean Business Health Check
What is the result? 260 questions benchmarking business process to Lean best
practice
It develops suggested action plans for improvement
Overall Audit Results
0%
20%
40%
60%
80%
100%Process Orientation
Pull System
Perfect Quality
Flexibility
Standardization
Transparent Processes
Continuous
Improvement
Associate Involvement
and Empowerment
Current
Last Audit
20
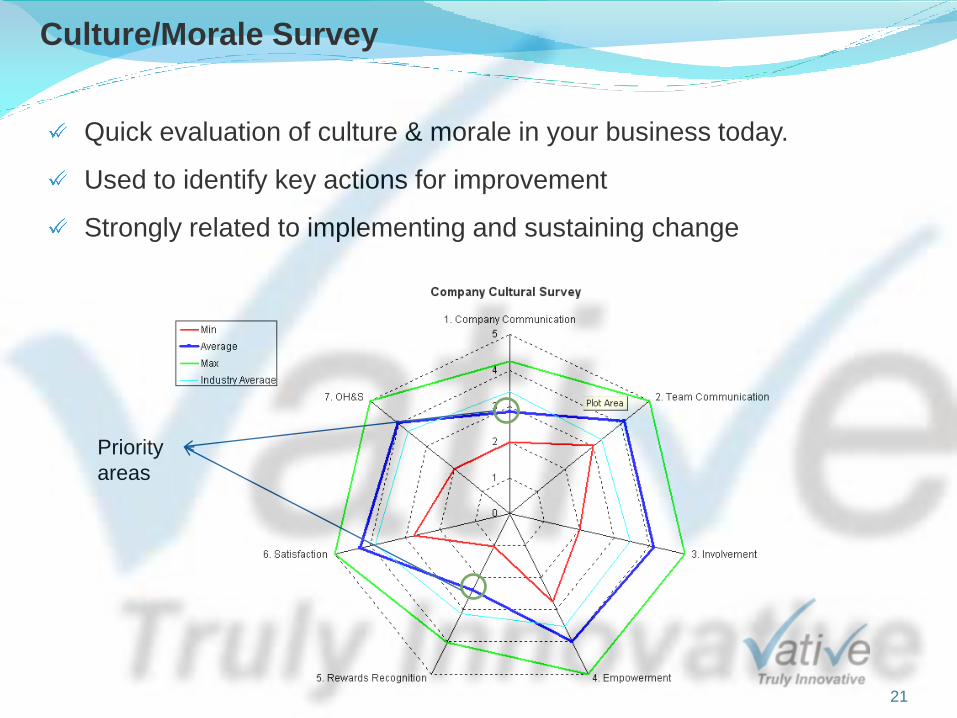
Culture/Morale Survey
Quick evaluation of culture & morale in your business today.
Used to identify key actions for improvement
Strongly related to implementing and sustaining change
21
Priority
areas

Value Stream Mapping
8 AT 6 AT 2 AT 3 AT 4 AT
23 AT
610 s
190 s 200 s 200 s 20 s
1
2
3
...
Current State
2
1
3
...
3 AT 2 AT 1 AT 2 AT 2 AT
20 s 200 s 200 s 190 s
610 s
10 AT
Future State
„Vision“
22
From…
To…

Success Comes with Sustainability
23
I
I
I
I
I I
S
S
S
S
S
S
I I
I I
I
Time
Results
I: Improve S: Standardisation
24
Remember if Lean was easy, everyone would have a Lean
organisation.
It takes persistence, education and discipline.
More people fail, then succeed at Lean.
What are you willing to sacrifice INVEST to improve your
business?
Challenges of Lean
25
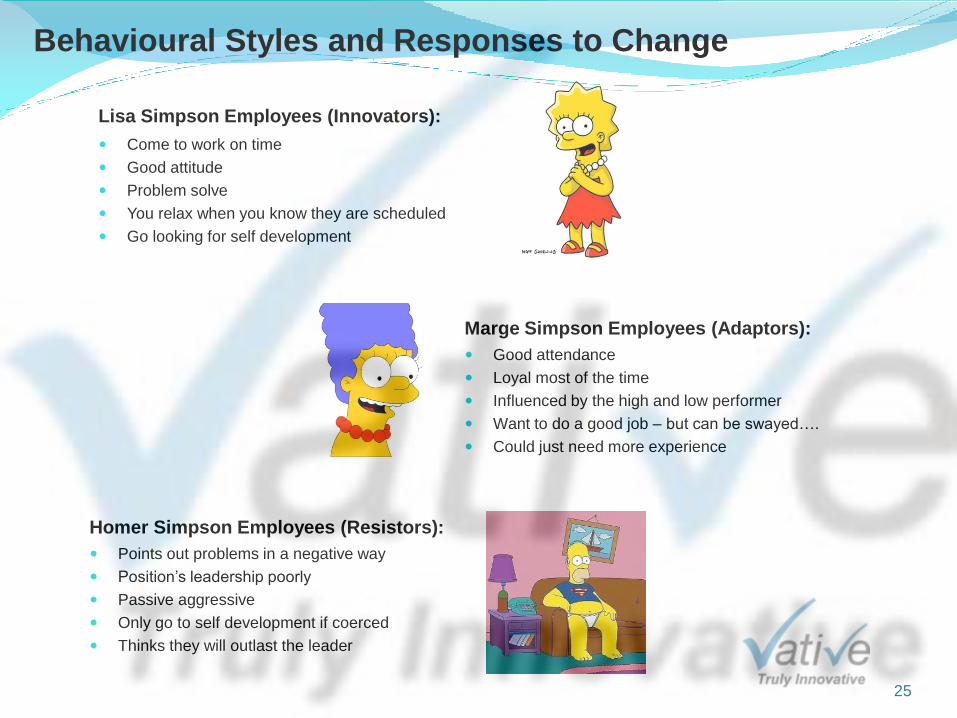
Behavioural Styles and Responses to Change
Lisa Simpson Employees (Innovators):
Come to work on time
Good attitude
Problem solve
You relax when you know they are scheduled
Go looking for self development
Marge Simpson Employees (Adaptors):
Good attendance
Loyal most of the time
Influenced by the high and low performer
Want to do a good job – but can be swayed….
Could just need more experience
Homer Simpson Employees (Resistors):
Points out problems in a negative way
Position’s leadership poorly
Passive aggressive
Only go to self development if coerced
Thinks they will outlast the leader
Vative - Truly Innovative 26
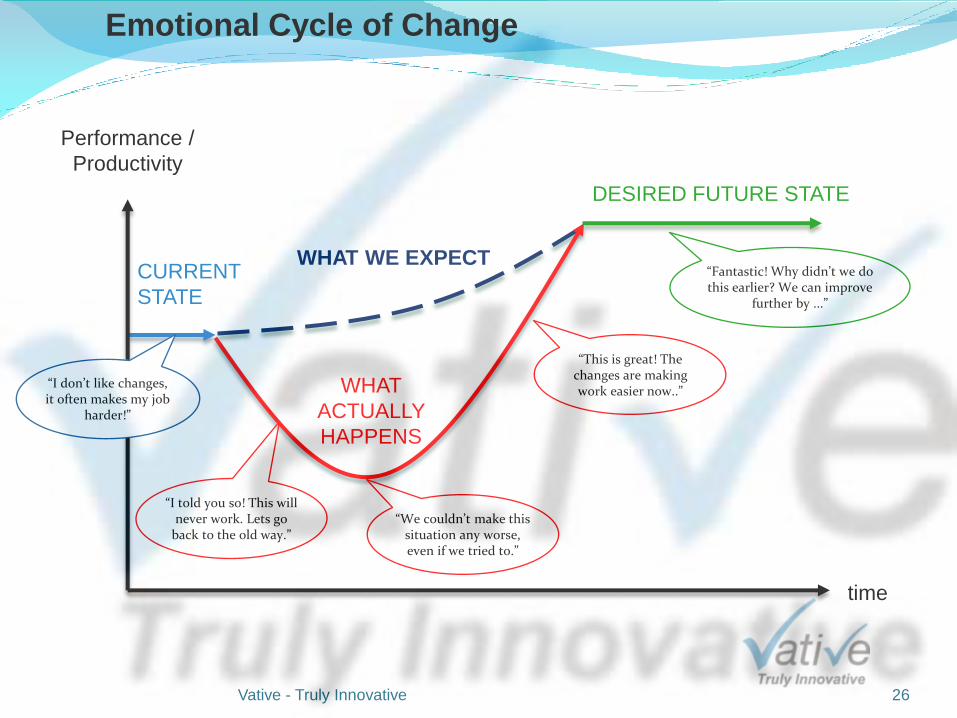
time
Performance /
Productivity
DESIRED FUTURE STATE
WHAT
ACTUALLY
HAPPENS
WHAT WE EXPECT CURRENT
STATE
“I don’t like changes, it often makes my job
harder!”
“I told you so! This will never work. Lets go
back to the old way.” “We couldn’t make this
situation any worse, even if we tried to.”
“This is great! The changes are making work easier now..”
“Fantastic! Why didn’t we do this earlier? We can improve
further by ...”
Emotional Cycle of Change
27
Case Studies
1. Office kanban system
2. Insurance company initial client meeting
3. Plumbing company project
4. Your own business process

28
Case Study – Office Kanban

29
Case Study – Office Kanban

30
Case Study – Office Kanban
Savings:
- Shortage Inconvenience = 1 per fortnight x 5 people x 0.17hrs =
$59/week = $1416 yearly
- Carry too much stock = n/a
- Streamlining and standardising ordering process = 2hrs/fornight =
$1920 yearly
Total yearly Savings = $3336
Costs:
- 5S blitz & Kanban generation labour = 2 days = $800
- Materials = $50
Total project cost = $850
Payback Peroid = 3 months
Return on Investment (ROI) = 292% = $2.92 for every $1 invested

31
Current Process Map for adding new item to Material Control
Case Study – Insurance Company
Manually add item to material
control form
Department Mgr to approve and
sign-off
Scan form
Email form to Head office
Add to Material Control database
Email confirmation
Lead times
Total Processing time = 12 mins
5 mins 1 min 1 min 1 min 2 mins 2 mins
1 day 10 mins 0 mins 2 hrs 0 mins
Total Lead time = 1 day 2 hrs 22mins
Add item directly to material
control database
New Process Map for adding new item to Material Control
Total Processing time = 2 mins
Total Lead time = 2 mins
*for orders up to the value of $200
**for orders over $200 Department Manager approval is required
2 mins
32
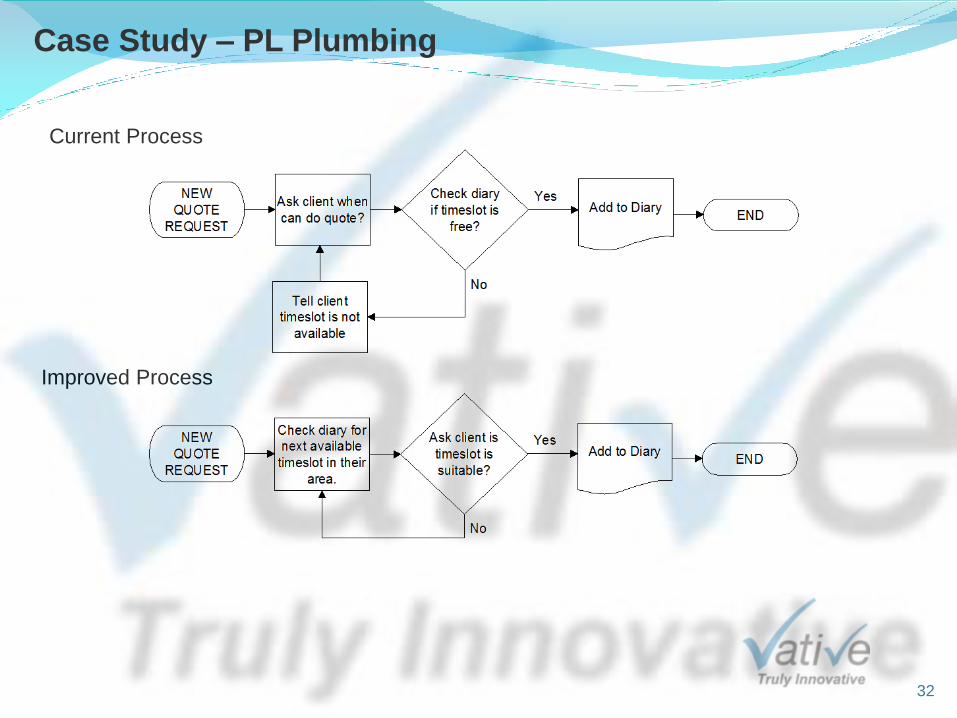
Case Study – PL Plumbing
Current Process
Improved Process
33
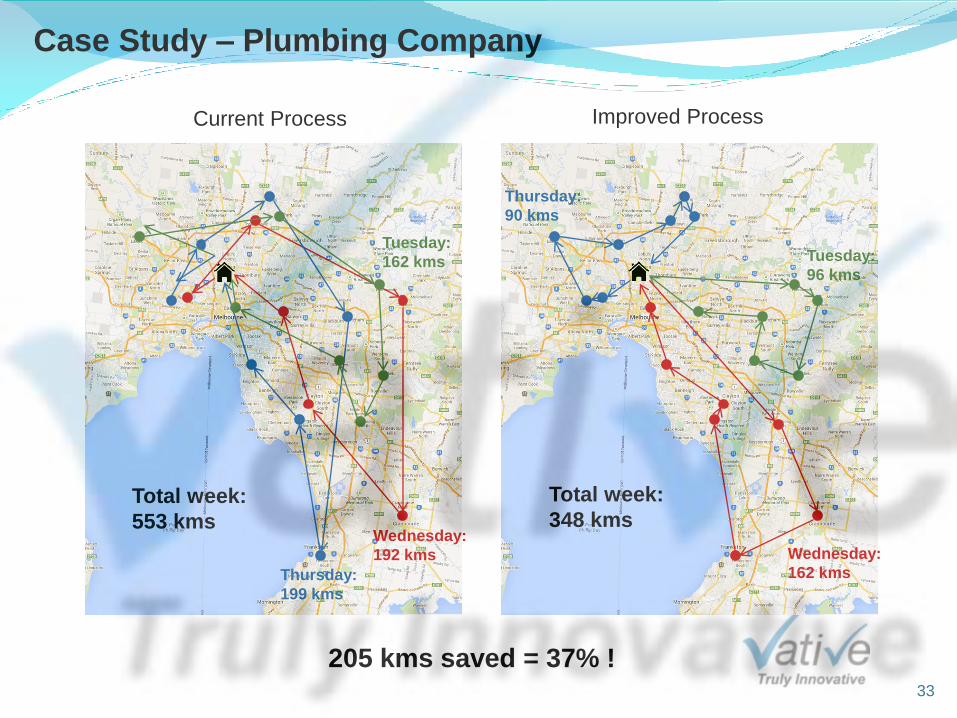
Case Study – Plumbing Company
Current Process Improved Process
Total week:
553 kms
Thursday:
90 kms
Tuesday:
96 kms
Wednesday:
162 kms
Wednesday:
192 kms
Tuesday:
162 kms
Thursday:
199 kms
Total week:
348 kms
205 kms saved = 37% !
34
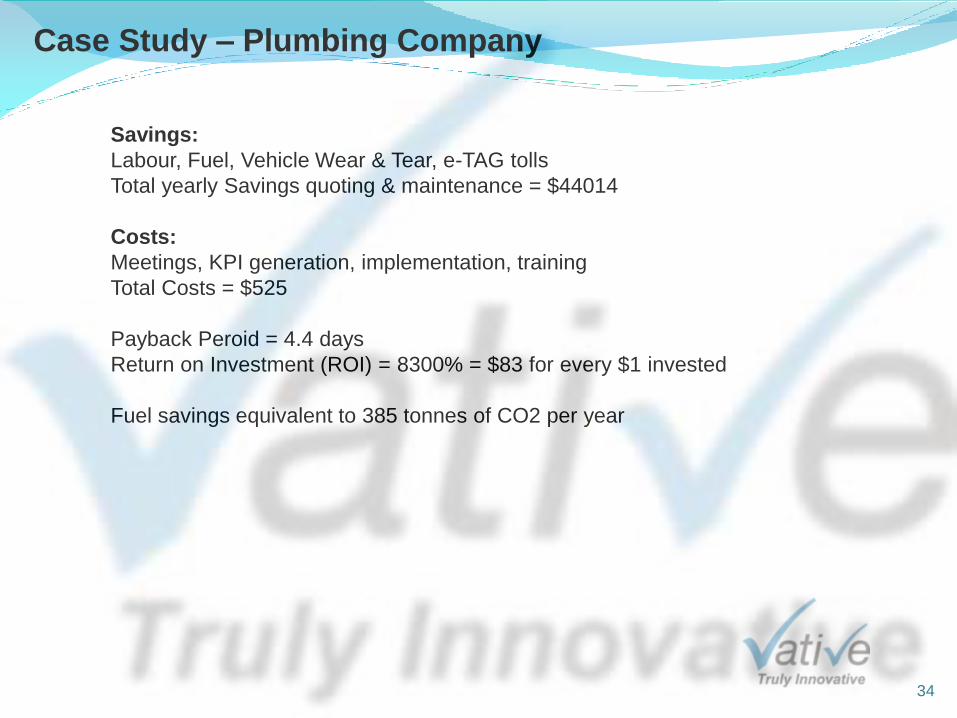
Case Study – Plumbing Company
Savings:
Labour, Fuel, Vehicle Wear & Tear, e-TAG tolls
Total yearly Savings quoting & maintenance = $44014
Costs:
Meetings, KPI generation, implementation, training
Total Costs = $525
Payback Peroid = 4.4 days
Return on Investment (ROI) = 8300% = $83 for every $1 invested
Fuel savings equivalent to 385 tonnes of CO2 per year
35
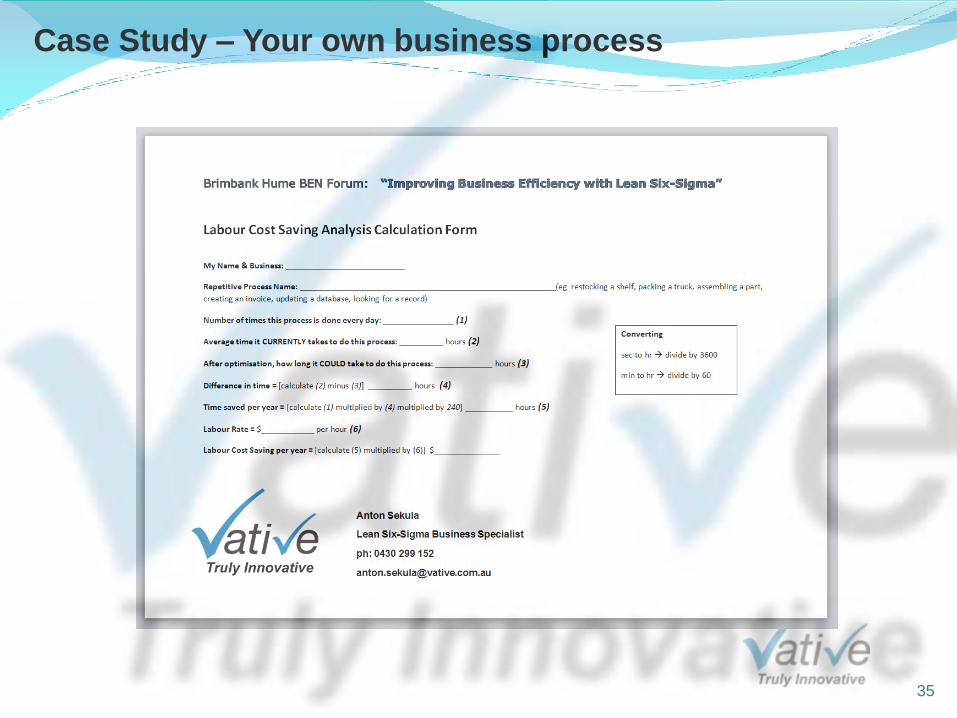
Case Study – Your own business process