without a–to p 3 :ysogr.xjtu.edu.cn/upload/23073/appl+phys+b+123+18628201729-tang+hj.pdf ·...
TRANSCRIPT

1 3
DOI 10.1007/s00340-017-6759-yAppl. Phys. B (2017) 123:186
Correlation and squeezing of hybrid signals with or without Autler–Townes splitting in Pr3+:YSO crystal
Haijun Tang1,2 · Zhaoyang Zhang2 · Noor Ahmed2 · Yang Liu2 · Changbiao Li2 · Enling Li1 · Yanpeng Zhang2
Received: 11 January 2017 / Accepted: 23 May 2017 © Springer-Verlag Berlin Heidelberg 2017
crystals, such as 3-mm rare-earth-doped Y2SiO5 crystals, have unique properties, including long optical coherence time and optical controllability of the ionic states. In addi-tion to light coherent storage [5–7], physical phenomena including all-optical routing [8], optical velocity reduc-tion and reversible storage of double light pulses [9] and all-optically controlled higher-order nonlinear fluores-cence (FL) [10] have been realized with such crystals. The principal motivation of this work was to determine how the lifetime of multi-order FL and spontaneous paramet-ric FWM processes is controlled by the dressing effect in a Pr3+:YSO crystal. Both the generation and storage of quantum information can be achieved in the same system. Photon anti-correlations have also been observed in FWM and resonance FL experiments [6–13]. In recent years, the correlations among multiple fields [14–16] have attracted considerable attention because a real quantum informa-tion network should have many nodes and channels. Such results may have potential applications in all-optical infor-mation processing and quantum communications on a pho-tonic chip. Our present work is a typical study of hybrid correlation, in which classical and non-classical correlation are mixed together such that this hybrid acts as a new type of hybrid qubit, which is an important research issue and is recognized as a useful resource for long-distance com-munications and optical quantum information processing [17–19].
In this paper, we report the correlation phenomenon of FL with and without Autler–Townes (AT) splitting with that of phase-conjugate parametric four-wave mixing (PC-FWM) by comparing the transition from a broad peak to sharp peak or vice versa. Further, we also exhibit the noise correlation and intensity-difference squeezing from two multi-order FL signals (FLs).
Abstract We provide the first report of switching between the intensity noise correlation and anti-correlation using Autler–Townes splitting, through controlling the initial and dressing phases of laser fields to generate multi-order fluorescence. Evolution of increasing classical correla-tion along with the degree of intensity-difference squeez-ing is analyzed against decreasing power. In addition, we also investigate the line shape of correlations on the basis of decay and decoherence rates of the multi-order fluores-cence induced by dressing fields. These findings are appli-cable in classical and non-classical information processing.
1 Introduction
Atomic coherence results from interactions between light and materials. Currently, most experimental research on atomic coherence is reported in hot or cold atomic gases. In contrast with atomic gases, coherence induced in solid materials is very attractive for practical applications. These processes lead to many important physical phenomena, such as electromagnetically induced transparency (EIT) [1], enhanced four-wave mixing (FWM) [2], and group veloc-ity control of traveling light [3, 4]. Rare-earth-ion-doped
* Enling Li [email protected]
Yanpeng Zhang [email protected]
1 Science School, Xi’an University of Technology, 710048 Xi’an, People’s Republic of China
2 Key Laboratory for Physical Electronics and Devices of the Ministry of Education and Shaanxi Key Lab of Information Photonic Technique, Xi’an Jiaotong University, 710049 Xi’an, People’s Republic of China
H. Tang et al.
1 3
186 Page 2 of 13
2 Experimental scheme and theoretical model
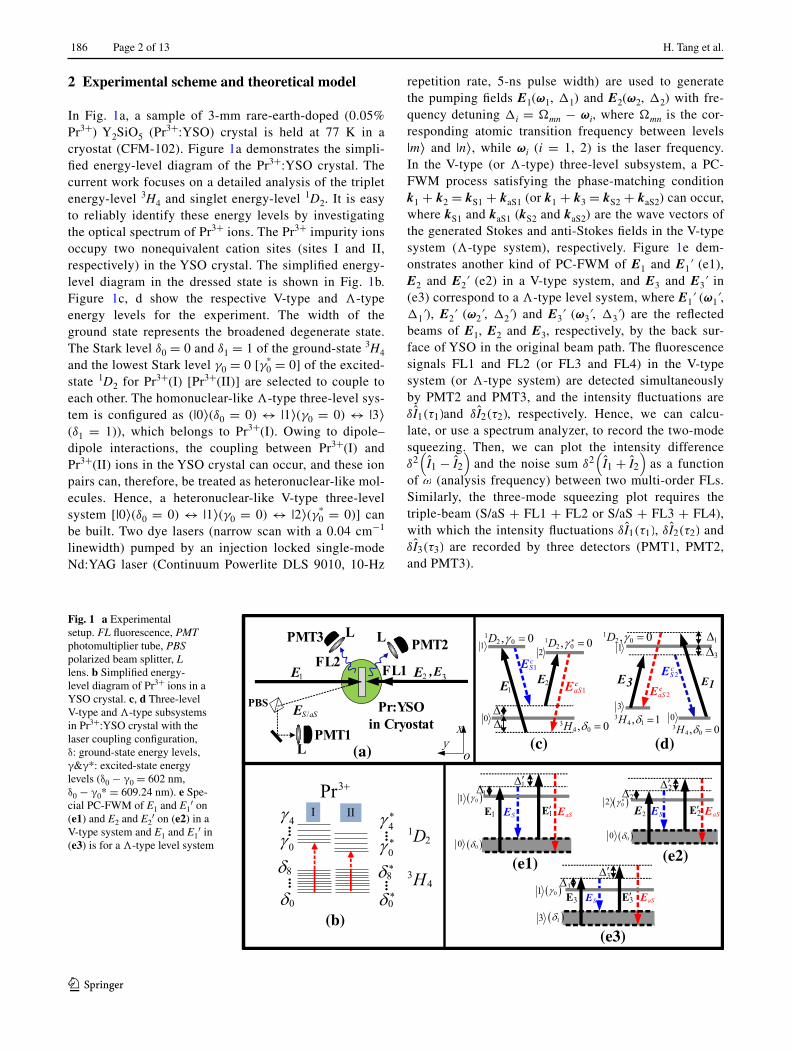
In Fig. 1a, a sample of 3-mm rare-earth-doped (0.05% Pr3+) Y2SiO5 (Pr3+:YSO) crystal is held at 77 K in a cryostat (CFM-102). Figure 1a demonstrates the simpli-fied energy-level diagram of the Pr3+:YSO crystal. The current work focuses on a detailed analysis of the triplet energy-level 3H4 and singlet energy-level 1D2. It is easy to reliably identify these energy levels by investigating the optical spectrum of Pr3+ ions. The Pr3+ impurity ions occupy two nonequivalent cation sites (sites I and II, respectively) in the YSO crystal. The simplified energy-level diagram in the dressed state is shown in Fig. 1b. Figure 1c, d show the respective V-type and Λ-type energy levels for the experiment. The width of the ground state represents the broadened degenerate state. The Stark level δ0 = 0 and δ1 = 1 of the ground-state 3H4 and the lowest Stark level γ0 = 0 [γ0
* = 0] of the excited-state 1D2 for Pr3+(I) [Pr3+(II)] are selected to couple to each other. The homonuclear-like Λ-type three-level sys-tem is configured as (|0⟩(δ0 = 0) ↔ |1⟩(γ0 = 0) ↔ |3⟩(δ1 = 1)), which belongs to Pr3+(I). Owing to dipole–dipole interactions, the coupling between Pr3+(I) and Pr3+(II) ions in the YSO crystal can occur, and these ion pairs can, therefore, be treated as heteronuclear-like mol-ecules. Hence, a heteronuclear-like V-type three-level system [|0⟩(δ0 = 0) ↔ |1⟩(γ0 = 0) ↔ |2⟩(γ0
* = 0)] can be built. Two dye lasers (narrow scan with a 0.04 cm−1 linewidth) pumped by an injection locked single-mode Nd:YAG laser (Continuum Powerlite DLS 9010, 10-Hz
repetition rate, 5-ns pulse width) are used to generate the pumping fields E1(ω1, Δ1) and E2(ω2, Δ2) with fre-quency detuning Δi = Ωmn − ωi, where Ωmn is the cor-responding atomic transition frequency between levels |m⟩ and |n⟩, while ωi (i = 1, 2) is the laser frequency. In the V-type (or Λ-type) three-level subsystem, a PC-FWM process satisfying the phase-matching condition k1 + k2 = kS1 + kaS1 (or k1 + k3 = kS2 + kaS2) can occur, where kS1 and kaS1 (kS2 and kaS2) are the wave vectors of the generated Stokes and anti-Stokes fields in the V-type system (Λ-type system), respectively. Figure 1e dem-onstrates another kind of PC-FWM of E1 and E1ʹ (e1), E2 and E2ʹ (e2) in a V-type system, and E3 and E3ʹ in (e3) correspond to a Λ-type level system, where E1ʹ (ω1ʹ, Δ1ʹ), E2ʹ (ω2ʹ, Δ2ʹ) and E3ʹ (ω3ʹ, Δ3ʹ) are the reflected beams of E1, E2 and E3, respectively, by the back sur-face of YSO in the original beam path. The fluorescence signals FL1 and FL2 (or FL3 and FL4) in the V-type system (or Λ-type system) are detected simultaneously by PMT2 and PMT3, and the intensity fluctuations are δI1(τ1)and δI2(τ2), respectively. Hence, we can calcu-late, or use a spectrum analyzer, to record the two-mode squeezing. Then, we can plot the intensity difference δ2(
I1 − I2
)
and the noise sum δ2(
I1 + I2
)
as a function of ω (analysis frequency) between two multi-order FLs. Similarly, the three-mode squeezing plot requires the triple-beam (S/aS + FL1 + FL2 or S/aS + FL3 + FL4), with which the intensity fluctuations δI1(τ1), δI2(τ2) and δI3(τ3) are recorded by three detectors (PMT1, PMT2, and PMT3).
Fig. 1 a Experimental setup. FL fluorescence, PMT photomultiplier tube, PBS polarized beam splitter, L lens. b Simplified energy-level diagram of Pr3+ ions in a YSO crystal. c, d Three-level V-type and Λ-type subsystems in Pr3+:YSO crystal with the laser coupling configuration, δ: ground-state energy levels, γ&γ*: excited-state energy levels (δ0 − γ0 = 602 nm, δ0 − γ0* = 609.24 nm). e Spe-cial PC-FWM of E1 and E1′ on (e1) and E2 and E2′ on (e2) in a V-type system and E1 and E1′ in (e3) is for a Λ-type level system
(a)
(b)
(c) (d)
(e2)(e1)
(e3)
Correlation and squeezing of hybrid signals with or without Autler–Townes splitting…
1 3
Page 3 of 13 186
2.1 Phase‑conjugate four‑wave mixing in V‑type and Λ‑type systems
The phase-conjugate four-wave mixing is a third-order nonlinear process, in which the intensities of Stokes and anti-Stokes signals are proportional to the third-order nonlinear density matrix elements ρ(3). In the V-level system, by turning on E1 and E2 to satisfy the phase-matching condition (PMC) k1 + k2 = ks + kas, the PC-FWM processes are expressed with the pertur-
bation chains ρ(0)00
E1−→ ρ(1)10
ES−→ ρ(2)00
E2−→ ρ(3)20(aS1) and
ρ(0)00
E2−→ ρ(1)20
EaS−→ ρ(2)00
E1−→ ρ(3)10(S1). Density matrix ele-
ments in perturbation chains denote the initial, intermedi-ate and final states of the transition process of generating PC-FWM. For the V-type three-level system with a strong pumping field E1 and a weak pumping field E2 and con-sidering the self-dressing effect of E1 and the external-dressing effect of E2, the respective third-order nonlinear density matrix elements of the generated Stokes (Ec
S1) and anti-Stokes (Ec
aS1) signals are given by
where d0 = Γ00 + i(2 −1), d′0 = Γ00 + i(1 −2), d1 = Γ10 + i1, and d2 = Γ20 + i2. Γij is the transverse decay rate, and Gi = µiEi/ħ is the Rabi frequency of the field Ei. Similarly, for a Λ-type three-level system, by turning on E1 and E2 with the PMC k1 + k2 = ks + kas, PC-FWM processes are expressed with the pertur-
bation chains ρ(0)33
E1−→ ρ(1)13
EaS2−→ ρ(2)03
E3−→ ρ(3)13(S2) and
ρ(0)00
E1−→ ρ(1)10
ES2−→ ρ(2)30
E3−→ ρ(3)10(aS2). Considering the self-
dressing effect of E1, the respective third-order nonlinear density matrix elements of Ec
S2 and EcaS2 are given by
where d3 = Γ13 + i3, d03 = Γ03 + i(3 −1), d13 =
Γ13 + i1 and d10 = Γ01 − i1, when only opening E1
(1)
ρ(3)10S1 =
−iG2GaS1
d0 + |G2|2/[
Γ20 + i(2 −1)+ |G1|2/(Γ01 − i1)] ,
× G1
d2
(
d1 + |G1|2/Γ11
)
(2)
ρ(3)20aS1 =
−iG2GS1
d′0 + |G2|2/
[
Γ20 + |G1|2/(Γ21 − i1)] ,
× G1
d1
(
d2 + |G1|2/Γ22
)
(3)
ρ(3)13S2 = −iG3GaS2G1
(d3 + |G1|2/d03)(d13 + |G1|2/Γ03)(Γ03 + |G1|2/d13),
(4)ρ(3)10aS2 =
−iG3GS2G1
(d1 + |G1|2/Γ11)d10(Γ30 + |G1|2/d13),
and E1ʹ, where E1ʹ(ω1ʹ, Δ1ʹ) is the reflected beam of E1. With the phase-matching condition (k1 + k1ʹ = ks + kas), the special PC-FWM processes are expressed with the
perturbation chains ρ(0)00
E1−→ ρ(1)10
ES−→ ρ(2)00
E′
1−→ ρ(3)10(aS1′)
and ρ(0)00
E′
1−→ ρ(1)10
EaS−→ ρ(2)00
E1−→ ρ(3)10(S1′), and then another
kind of PC-FWM, EcS1′ and Ec
aS1′, are, respectively, given by
where d′1 = Γ10 − i1. Similarly, PC-FWM EcS2′ (Ec
S3′ ) and Ec
aS2′ (EcaS3′) can be obtained when E1(E3) and
E1ʹ(E3ʹ), respectively, are opened.
2.2 Multi‑order FLs
The fluorescence signals FL1 and FL2 are detected simul-taneously by PMT2 and PMT3, respectively. In the V-type three-level system with two fields, E1 and E2, FL1 (from |2⟩ to |0⟩) and FL2 (from |1⟩ to |0⟩) are simultaneously generated. Theoretically, the intensity of the fluorescence signal is pro-portional to the diagonal density matrix elements. Therefore,
fourth-order FL ρ(4)FL1/FL2 can be generated in a V-level system
via the pathways ρ(0)00
E1−→ ρ(1)10
−E1−→ ρ(2)00
E2−→ ρ(3)20
−E2−→ ρ(4)22
(for FL1) and ρ(0)00
E2−→ ρ(1)20
−E2−→ ρ(2)00
E1−→ ρ(3)10
−E1−→ ρ(4)11 (for
FL2). Considering the coherence nature of such system, the FL1 (ρ(4)
22 ) and FL2 (ρ(4)11 ) processes can be unified by the
fourth-order coherence process as follows:
where d21 = Γ21 + i(2 −1) and d12 = Γ12+ i(1 −2). Similarly, when E1 and E3 are open simultaneously, the fourth-order FL ρ
(4)FL in the
Λ-type system can be generated by the pathway
(5)ρ(3)10aS1′ =
−iG1GS1′G∗1
d1Γ00d′1
,
(6)ρ(3)10S1′ =
−iG1GaS1′G∗1
d′1Γ00d1,
(7)
ρ(4)22(FL1) =
−|G2|2(
d1 + |G1|2/Γ00 + |G2|2/d12)
× 1(
Γ00 + |G1|2/d1 + |G2|2/d2)
× −|G1|2(
d2 + |G1|2/d21 + |G2|2/Γ00)(
Γ22 + |G2|2/d2) ,
(8)
ρ(4)11(FL2) =
−|G1|2(
d2 + |G1|2/d21 + |G2|2/Γ00
)
× 1(
Γ00 + |G1|2/d1 + |G2|2/d2)
× −|G2|2(
d1 + |G1|2/Γ00 + |G2|2/d12)(
Γ11 + |G1|2/d1) ,
H. Tang et al.
1 3
186 Page 4 of 13
ρ(0)33
E3−→ ρ(1)13
−E3−→ ρ(2)11
E1−→ ρ(3)10
−E1−→ ρ(4)11 (for FL3) and
ρ(0)00
E1−→ ρ(1)10
−E1−→ ρ(2)11
E3−→ ρ(3)13
−E3−→ ρ′(4)11 (for FL4). Consid-
ering the coherence property of such a system, the two FL processes can be understood through the fourth-order coher-ence processes as follows:
where d30 = Γ30 + i(1 −3) and d′31
= Γ31+ i(3 −1). Equations (1)–(6) show the density matrix ele-ments for intensities of PC-FWM and FL processes, which are related to the nonlinear coefficient κ and can be modi-fied by the dressing effect induced by E1 and E2 (or E3). The dressing effects can be manipulated by the power of the incident fields. Hence, both correlation and squeezing from intensities of PC-FWM and FL signals can be changed via the power.
2.3 Two‑mode correlation and squeezing
The coupling Hamiltonian for PC-FWM processes is H = (a
†Sa
†aS + aSaaS)g/v, where a†s (aS) and a
†aS(aaS)
are creation and annihilation operators acting on Stokes and anti-Stokes signals, respectively, and ν is the group velocity of the field in the nonlinear medium. The nonlinear gain g =
∣
∣
∣(−iωSi ,aSiχ
(3)Si ,aSi
E1E2)/2c
∣
∣
∣
(i = 1, 2) depends on the nonlinear susceptibil-ity χ
(3)Si ,aSi
and the pumping field amplitude, where
χ(3)Si ,aSi
=(
NµS,aSρ(3)Si ,aSi
)
/(
ε0E1E2ESi ,aSi
)
. The output
photon number at each channel is given by Nj =⟨
a+j aj⟩
,
and the corresponding intensity δIj(tj) = Nje−Γj tj
(j = S1,2, aS1,2, FL1, FL2 or FL3, FL4), where ΓS or ΓaS are decay rates with different values in Λ- and V-type systems. In the Λ-type system, ΓS2 = Γ13 + Γ30 + Γ10 and ΓaS2 = Γ10 + Γ30 + Γ10, and for the V-type system, ΓS1 = Γ20 + Γ00 +Γ20 and ΓaS1 = Γ10 + Γ00 + Γ20, in
(9)
ρ(4)11(FL3) =
−|G1|2(
Γ13 + i3 + |G1|2/d03 + |G3|2/Γ33
)
× −|G3|2(
Γ11 + |G3|2/d′31 + |G1|2/(
d1 + |G3|2/d30))2
,
× 1(
d1 + |G1|2/Γ00 + |G3|2/Γ30
)
(10)
ρ(4)11(FL4) =
−|G1|2(
d1 + |G1|2/Γ00 + |G3|2/d30)
× 1(
d3 + |G1|2/Γ03 + |G3|2/Γ33
) ,
× −|G3|2(
Γ11 + |G3|2/Γ31 + |G1|2/(
d1 + |G3|2/d30))2
which Γ00 = (2πT1)−10 +
(
2πT∗2
)−1
0 is the transverse
dephasing rate of the ground-state |0⟩. The second-order correlation function G(2)(τ ) between the intensity fluctua-tions of two optical beams i, j, i ≠ j as the function of time delay τ is given by [20]
Similarly, the correlation between two multi-order FLs can be written as
where ϕ = ϕS/aS − ϕFL; ϕS/aS is the initial phase of PC-FWM, while ϕFL is the dressed phase of multi-order FLs.
In a two-mode case, the corresponding intensity-differ-ence squeezing is defined as [21]
where ⟨
δ2(
I1 − I2
)⟩
=⟨
(
I1 − I2
)2⟩
−⟨(
I1 − I2
)⟩2
and ⟨
δ2(
I1 + I2
)⟩
=⟨
(
I1 + I2
)2⟩
−⟨
I1 + I2
⟩2 are the
mean square deviation of the intensity difference and inten-sity sum, respectively.
2.4 Sharpening and broadening of correlation peaks
The correlation functions expressed in Eqs. (11) and (12) may have sharp peaks, broad peaks or a combination thereof (two-stage line shapes). The competition between PC-FWM and FL hybrid signals determines the two-stage shape of the correlation function (Figs. 3, 5 for dif-ferent time positions t1–t4) given by Eqs. (15a) and (15b), which are determined by the decay rate Γ of the signals involved. Owing to the interaction of the coupling fields, the homogeneous linewidth broadening of the measured
(11)
G(2)S/aS−FL1/FL2(τ ) =
⟨
δ
∣
∣
∣ρ(3)S/aS
∣
∣
∣
2[
δρ(4)FL1/FL2(t + τ)
]
⟩
√
√
√
√
⟨
δ
∣
∣
∣ρ(3)S/aS
∣
∣
∣
22
⟩
⟨
[
δρ(4)FL1/FL2(t + τ)
]2⟩
=
⟨
δIS/aS(t)δIFL1/FL2(t + τ)
⟩
√
⟨
[
δIS/aS(t)
]2⟩⟨
[
δIFL1/FL2(t + τ)
]2⟩
cos(ϕ),
(12)
G(2)FL1− FL2(τ ) =
⟨
δIFL1(t)δIFL2(t + τ)⟩
√
⟨
[
δIFL1(t)]2⟩⟨
[
δIFL2(t + τ)]2⟩
=
⟨[
δρ(4)FL1(t)
][
δρ(4)FL2(t + τ)
]⟩
√
⟨
[
δρ(4)FL1(t)
]2⟩⟨
[
δρ(4)FL2(t + τ)
]2⟩
cos(ϕFL),
(13)Sq(2) = Log10
⟨
δ2(
I1 − I2
)⟩
⟨
δ2(
I1 + I2
)⟩ ,

Correlation and squeezing of hybrid signals with or without Autler–Townes splitting…
1 3
Page 5 of 13 186
fluorescence signal is given as Γ±=Γpop − Γ(±δ) + Γion-
spin + Γion–ion + Γphonon, where Γpop = (2πT1)−1 is the population decay time that depends on the location of the energy level in phase space, and the term Γ(±δ) rep-resents the location of the energy level, which can be dressed by the coupling field. The last three terms (Γion-
spin + Γion–ion + Γphonon) are components of (
2πT∗2
)−1 (the reversible transverse relaxation time T∗
2). Γion-spin is related to the ion-spin coupling effect of the individ-ual ion. Γion–ion is determined by the interaction among the rare-earth ions and can be controlled by the power of external field or impurity concentrations. Γphonon is related to the sample temperature. To quantify the induced dipole–dipole interaction (Γion–ion), P(t) is intro-duced as P0(t) = exp[−cH
∑
n=6,8,10,12,13,14 (AnH/RnH)]
and P1(t) = exp[−cD∑
n=5,6,7 (AnD/RnD)], where
AnH/AnD is the van der Waals attractive force coefficient, RnH/R
nD is distance of the nucleus, and cH and cD represent
the population densities at the triplet energy-level 3H4 and singlet energy-level 1D2, respectively, which can be con-trolled by the pump power.
∑
(AnH/RnH) and
∑
(AnD/RnD)
represent the induced dipole–dipole interactions of states H–H and D–D, respectively. Considering the influence of Stokes and anti-Stokes fields, a lower decay rate and longer lifetime are due to PC-FWM signals generated by coherent processes whose linewidths are determined by atomic coherence time and are, thus, much narrower. The shape of the correlation peak can be determined by the parameter of correlation function, which can be written as:
Here, A is related to τ only, A1 =√2ωi/(cε0S)V/
(2π)3υi R1 = N(µ10µ20E1)2asL/
2cε03(Γ20 + i1)
, V is the volume of light action, S is the area of light action, and Ωe is the Rabi oscillation. R1 represents a time-independent constant, and Ωe = |Δ1|. The param-eter ζ represents the bandwidth of the source laser and is constant. In the two-mode correlation between the FL and PC-FWM signals, Γ1 = ΓS/aS and Γ2 = ΓFL, and the parameter A is expressed as
For the correlation between the FL1 and FL2 signals, Γ1 = ΓFL1, Γ2 = ΓFL2, and the parameter A is expressed as
(14)A = R1|A1|2
[
e−2(
Γ +1 +Γ +
2 +ζ)
|τ | + e−2(
Γ −1 +Γ −
2 +ζ)
|τ |
−2 cos(Ωe|τ |)e−(
Γ +1 +Γ +
2 +Γ −1 +Γ −
2 +ζ)
|τ |]
.
(15a)
AS/aS−FL = R1|A1|2[(
e−2(Γ +
S/aS+Γ +FL+ζ )|τ | + e
−2(Γ −S/aS+Γ −
FL+ζ )|τ |
−2 cos(Ωe|τ |)(
e−(Γ +
S/aS+Γ +FL+Γ −
S/aS+Γ −FL+ζ )|τ |
)]
.
The line shape is primarily associated with the decay rate Γ in the V-type system, whereas in the Λ-type sys-tem, it is initially associated with source dressing, until the dressing becomes dominant.
2.5 Three‑mode correlation and squeezing
In a three-mode case, the correlation between intensity fluctuations of three optical beams G(3)(τ1, τ2, τ3) as a function of time delay τ is given by [21]
And the corresponding intensity-difference squeezing is defined as
where ⟨
δ2(
I1 − I2 − I3
)⟩
=⟨
(
I1 − I2 − I3
)2⟩
−⟨
I1 − I2 − I3
⟩2
and ⟨
δ2(
I1 + I2 + I3
)⟩
=⟨
(
I1 + I2 + I3
)2⟩
−⟨
I1 + I2 + I3
⟩2
are the mean square
deviation of the intensity difference and intensity sum, respectively.
3 Experimental results and theoretical analysis
The time domain signals describe the second peak delay of FL, which corresponds to the splitting of one peak into two peaks and AT splitting in frequency domain. In addi-tion, the time domain signals enable us to evaluate decay rates. Therefore, in Fig. 2, we show the spectra, in the time or frequency domain, obtained from FL and PC-FWM. The typical decay rate of FL2 (with AT splitting) is approxi-mately 8 × 10³ Hz, see Fig. 2a1, and the typical decay rate of FL1 (with AT splitting) is approximately 15 × 103 Hz, as shown in Fig. 2b1 [27]. In Fig. 2a1, the FL with AT split-ting is demonstrated at different powers P1 (1, 3 and 5 mW) of E1, while E2 is fixed at low power (1 mW) in a V-type level system. By increasing the power of E1, the energy gap (corresponding to two peaks of AT splitting, marked by red and blue curves in Fig. 2a1) further increases, thus
(15b)
AFL1−FL2 = R1|A1|2[(
e−2(Γ +
FL1+Γ +FL2+ζ )|τ | + e
−2(Γ −FL1+Γ −
FL2+ζ )|τ |
−2 cos(Ωe|τ |)(
e−(Γ +
FL1+Γ +FL2+Γ −
FL1+Γ −FL2+ζ )|τ |
)]
.
(16)
G(3)(τ1, τ2, τ3) =
⟨(
δI1(τ1)
)⟩(
δI2(τ2)
)(
δI3(τ3)
)
√
⟨
(
δI1(τ1)
)2⟩⟨
(
δI2(τ2)
)2⟩⟨
(
δI3(τ3)
)2⟩
.
(17)Sq(3) = Log10
⟨
δ2(
I1 − I2 − I3
)⟩
⟨
δ2(
I1 + I2 + I3
)⟩ ,

H. Tang et al.
1 3
186 Page 6 of 13
causing an increase in the time delay [22]. Figure 2a2 demonstrates the same FL in the frequency domain. The detected FL contains a percentage of SP-FMW, which primarily depends on P1, as P2 is fixed in this case. As P1 increases, the FL dip further increases with power P1. If the power continues to increase to a high level, the PC-FWM appears in the dip of the AT splitting FL signal [23]. There-fore, multi-order FLs are also accompanied by an output (Stokes/anti-Stokes signals) of PC-FWM. In PMT3, we
detect a composite hybrid signal (
ρ(4)FL1/FL2 + Ec
S1′/aS1′
)
that includes the PC-FWM produced by E1 and E1ʹ (k1 + k1ʹ = kS1 + kaS1) along with FL2. Similarly, in PMT2,
another hybrid signal (
ρ(4)FL1/FL2 + E
cS2′/aS2′ + E
cS3′/aS3′
)
,
including another type of PC-FWM is produced by E2 and E2ʹ (k2 + k2ʹ = kS2 + kaS2) (or E3 and E3ʹ, k3 + k3ʹ = kS3 + kaS3) along with FL1. First, Fig. 2a1 demonstrates Autler–Townes (AT) splitting in a fourth-order FL hybrid signal (FL + PC-FWM), owing to the self-dressing effect of E1 with increasing splitting dis-tance from the left to right peaks with increased power, as indicated by the oblique dashed line across Fig. 2a1. With such time differences at larger powers, interference effects can be neglected. This phenomenon is consistent with the self-dressing effect of field E1(|G1|
2/d1), as predicted in Eqs. (7) and (8). The power-dependent increase in delay
time between the hybrid signal (FLs + PC-FWM) is due to a self-dressing induced completion effect, as shown in Fig. 2a1. In the left peak of the hybrid signal (along t1 to t2), the intensity term of PC-FWM increases linearly, owing to the gain effect of the generating field E1, as predicted by Eqs. (1) and (2). The same effect is observed in pure PC-FWM, in which the signal intensity is highly enhanced at very high power, as shown in Fig. 2b1. The smooth curve (less noise) in the spectral domain in Fig. 2b2 is consistent with the enhancement of PC-FWM at increased power. However, in the hybrid signal, the term ρ(4)
FL first increases with |G1|
2 and then gradually decreases, owing to the dressing effects of |G1|
2/Γ00 and |G1|2/d1 in Eqs. (7)
and (8), as seen in Fig. 2a1. The right peaks at time posi-tions t3 and t4 correspond to FL signals. These two FL peaks at t3 and t4 correspond to the dressed states |G1+⟩ to |G1−⟩, thus indicating that the FL signal is more sensi-tive for dressing than PC-FWM, as shown in Fig. 2a1. Consequently, at very high power, FL intensity is sup-pressed and PC-FWM intensity is enhanced, as shown in Fig. 2a1. To further investigate this phenomenon, we set |1⟩ as the frequency reference point, and the Hamiltonian
can be written as H = −
[
0 G1
G∗1 (−1)i1
]
. From the equa-
tion H|G1±⟩ = λ±|G1±⟩, we can obtain the eigenvalues
Fig. 2 a1 Time domain inten-sity of FL with AT splitting at different powers P1 (1, 3 and 5 mW from bottom up) of E1 while E2 is fixed at low power in a V-type level system. a2 Demonstrates the same signals as (a1) but in the frequency domain. b1 Demonstrates the time domain intensity of PC-FWM with the same power conditions defined in (a1). b2 Demonstrates the same signals as b1 but in the frequency domain
-100 0-50∆2(GHz)
0
1
2
3
4
Rel
ativ
e In
tens
ity(a
rb.u
.)
0
1
2
3
4
0
1
2
3
0
t4t3t2
Rela
tive I
nten
sity(
arb.
u.)
t1
t(10-4s)6 12
Rela
tive
Inte
nsity
(arb
.u.)
Rel
ativ
e In
tens
ity(a
rb.u
. )
1.4
0.6
1.0
0.2
0 6
t(10-4s)12
-100 -50 0∆2(GHz)
1mW
3mW
5mW
1mW
3mW
5mW
1mW
3mW
5mW
5mW
3mW
1mW
(a1)
(a2) (b2)
(a1) (b1)

Correlation and squeezing of hybrid signals with or without Autler–Townes splitting…
1 3
Page 7 of 13 186
± =[
(−1)i1 ±√
21 + 4|G1|2
]
/2. The splitting dis-
tance Δ± = λ+ − λ− between |G1+⟩ and |G1−⟩ is given
as ±=++−=√
21 + 4|G1|2, where G1 = μ(2P1/
ε0cA)1/2/. Thus, as P1 increases, the splitting distance increases, owing to the term (|G1|
2), as shown in Fig. 2a1. Furthermore, the Autler–Townes splitting of FL is achieved through induced atomic coherence and interaction of PC-FWM +FL under Kerr nonlinearity. Therefore, in Fig. 1a, the FL2 signal is FL with AT splitting, because PMT3 is on the side of E1, and E1 has a strong dressing effect. How-ever, the FL1 signal is FL without AT splitting, because the detector PMT2 is on the side of E2 or E3, and the dressing effect of E2 or E3 can be neglected, owing to low power. Here, the FL signal evolves from Autler–Townes-like split-ting to pure suppression when the power P1- is increased. Figure 2b1, b2 show the time- and frequency domain intensity, respectively, of PC-FWM (Fig. 1c, d) under the same power conditions. As the power of E1 increases, the
intensity of PC-FWM increases, both in the time and fre-quency domain, a result attributable to the high decoher-ence rate of PC-FWM at higher powers.
In Fig. 3, the switching from broad peak to sharp peak correlation is discussed using the decay rates of PC-FWM and FL in a three-level V-type system [24]. In Fig. 3a1–a4, the intensity noise correlations are calculated between the Stokes and anti-Stokes signals of PC-FWM and FL1 (without AT splitting) by decreasing the power P1. At high power, the amplitude of correlation has a sharp peak (Fig. 3a1–a2). As the power further decreases, this sharp peak becomes a broad peak (Fig. 3a3–a4). The decrease in the amplitude of the sharp peak and the increase in the amplitude of the broad peak are shown in Fig. 3e2, e3, respectively. The intensity of the measured fluorescence
signal is IFL1/2(t) = ρ(4)FL1/2 exp(−ΓFL1/2t), where for a
V-type level system: ΓFL1 = Γ20 + Γ00 + Γ10 + Γ11 and
ΓFL2 = Γ10 + Γ00 + Γ20 +Γ22, in which Γ10 = (2πT1)−11
is the transverse dephasing rate of the ground-state
-4 0 4
0.0
0.8 (a1)G
2 S/AS
-FL1
()
-4 0 4
0.0
0.8 (a2)
-4 0 4
0.0
0.8 (a3)
-4 0 4
0.0
0.8 (a4)
-4 0 4
0.0
0.8
G2 S/
AS-F
L2()
(b1)
-4 0 4
0.0
0.8
G2 FL
1-FL
2() (c1)
-4 0 4
0.0
0.8 (b2)
-4 0 4
0.0
0.8 (b3)
-4 0 4
0.0
0.8 (c4)
-4 0 4
0.0
0.8 (b4)
-4 0 4
0.0
0.8 (c2)
-4 0 4
0.0
0.8 (c3)
( s)
5 4 3 2 10.0
0.6
1.2
(e3)
(e2)
(e1)
0 5 1060
80
100(d3)
0 5 1040
60
80
100
Squ
eezin
g (d
B)
(d2)
0 5 1040
60
80
100(d2)
0 5 1040
60
80
100(d4)
( )MHz
5 4 3 2 10.0
0.6
1.2
(g3)
(g2)
(g1)
5 4 3 2 10.0
0.6
1.2
(f3)(f2)
(f1)
5 4 3 2 15
10
15 (h)
P1(mw)
Fig. 3 Two-mode intensity noise correlation and intensity-difference squeezing in a three-level V-type system by decreasing the power of E1 from 5 to 1 mW (left to right) while P2 remains 1 mW. a1–a4 Stokes/anti-Stokes signals of PC-FWM and FL1 (without AT split-ting) detected by PMT1 and PMT2, respectively; b1–b4 Stokes/anti-Stokes signals of PC-FWM and FL2 (with AT splitting) detected by PMT1 and PMT3, respectively; c1–c4 FL1 (without AT splitting) and
FL2 (with AT splitting) detected by PMT2 and PMT3, respectively. d1–d4 Show the corresponding two-mode squeezing in accordance with (c1–c4). e–g Show the trends of the corresponding broad peak (e2, f2, g2), sharp peak (e3, f3, g3) and total (e1, f1, g1) correlation amplitude. h Demonstrates the corresponding magnitude of squeez-ing

H. Tang et al.
1 3
186 Page 8 of 13
|0⟩. Considering the controlling terms, we can write (2πT1)
−11 = 6π(υ +υ)3β2η3/εhc3, (2πT1)
−10 = 0 ,
(2πT∗2 )
−11 = P1(t)+ γ0, and (2πT∗
2 )−10 = P0(t)+ γ0 ,
where γ0 is the total effect of Γphonon and Γion-spin, The term (υ + Δυ) represents the dressed state location of the energy level. Furthermore, for the PC-FWM sig-nals (Ec
S1 and EcaS1), Γ ±
S = Γ ±aS = Γ10 + Γ00 + Γ20 .
Therefore, the total composite signals are Γ ±S/aS + Γ ±
FL1 = 2(Γ20 + Γ10 + Γ00)+ Γ11 (FL1 + PC-FWM) and Γ ±
S/aS + Γ ±FL2 = 2(Γ20 + Γ10 + Γ00)+ Γ22
(FL2 + PC-FWM); PC-FWM decays faster (larger Γ) than the FL signal (smaller Γ), corresponding to a broad to sharp peak transition with decreasing power. In other words, smaller Γ at resonance corresponds to broad peak corre-lation, and longer Γ at off resonance corresponds to sharp peak correlation. The full width at half maximum (FWHM) of correlation peaks, which are sensitive to decoherence time, are significantly broadened because of the increased decay rate and decoherence time [Eq. (14)] with a further decrease in power. The correlation times are determined by decoherence time (or are inversely proportional to decoher-ence rate) of the PC-FWM process, which strongly affects parameter AS/aS−FL from Eq. (15a) [25]. The correlation time Δτ between Stokes/anti-Stokes signals of PC-FWM and FL1 (without AT splitting), shown in Fig. 3a, is 0.29 μs (sharp peak) and 1.43 μs (broad peak), respectively. Simi-larly, the correlation time Δτ between Stokes/anti-Stokes signals of PC-FWM and FL1 (with AT splitting) shown in Fig. 3b is 0.11μ s (sharp peak) and 1.14 μs (broad peak), and the correlation time Δτ is inversely proportional to the decay rate. Moreover, the dressing is less sensitive to the V-type three-level system; the total amplitude of cor-relation in Fig. 3e1 decreases with power P1. The gradual decrease in amplitude of correlation is associated with the decrease in χ(3)
S/aS, which is due to |G1|2/d2 in Eqs. (1) and (2). Hence, the total amplitude of correlation between Stokes/anti-Stokes signals of PC-FWM and FL1 demon-strates inverse linear behavior with E1. In Fig. 3b1–b4, the intensity noise correlations between the Stokes/anti-Stokes signals of PC-FWM and FL2 (with AT splitting) with the same power conditions are, thus, calculated. The phenom-enon of switching from sharp peak to broad peak is clearly shown by the intersection of amplitude in Fig. 3f2, f3. The linewidth of the signal is broadened by phonons (Γphonon) from the lattice heat vibration and the power (Γion–ion) of the pumping field, and these parameters are balanced by the dressing effect, Γ(±δ) [27]. This clear visibility of switching from a sharp to a broad peak can be affected by the dressing effect, Γ(± δ), [see Eq. (15b)] at strong power. Then, FL2 (with AT splitting) is generated, and the linewidth is given as Γ±=Γpop-Γ(±δ) + Γion-spin + Γion–
ion + Γphonon (which results in a sharp peak). However, under a low power regime, the FL1 (without AT splitting)
is generated, and its linewidth is given by Γ±=Γpop + Γion-
spin + Γion–ion + Γphonon (which results in a broad peak) [26].Figure 3c1–c4 demonstrates the intensity noise correla-
tions between FL1 (without AT splitting) and FL2 (with AT splitting). In this correlation, the amplitude of correla-tion first decreases and then increases with the decrease in power, because both FL1 and FL2 are sensitive to dress-ing. At high power, the correlation decreases until the dark state is dominant; later, the correlation increases with the decrease in power. On the basis of the self-diffracted Stokes and anti-Stokes signals of SP-FWM from PMT2 and PMT3, as discussed in Fig. 2, one can predict from the signal intensities recorded at PMT2 and PMT3 that at small P1, the signal intensity of the FLs (FL1 without AT splitting and FL2 with AT splitting) dominates, whereas at large P1, the SP-FWM signal intensity dominates [25]. The correlation of the transition from sharp and broad peaks is consistent with Fig. 3a, and Fig. 3d1–d4 demonstrates the intensity-difference squeezing compared with that in Fig. 3c1–c4. The amplitude of the squeezing depend-ence in Fig. 3h follows the correlation with total ampli-tude dependence in Fig. 3g. Here, we demonstrate switch-ing of correlation and anti-correlation by selecting a time position t1, t2, t3 and t4 of pulse distribution curves via the boxcar gate positions shown in Fig. 2a1. The two-mode intensity noise correlation between Stokes/anti-Stokes sig-nals of PC-FWM and FL1 (without AT splitting) are shown in Fig. 4a1–a4, which are taken with t1 − t4. The correla-tion values decrease as the intensities of the pulse distri-bution, so both PC-FWM and FL1 decrease from t1 − t4. Because FL1 is generated from the weak field E2, there is no AT splitting, and it behaves like SP-FWM. The correla-tion does not switch to anti-correlation, because the initial phase of PC-FWM and FL1 does not change. In Fig. 4b1 and (b2), the intensity noise correlations between the Stokes/anti-Stokes signals of PC-FWM and FL2 (with AT splitting) are calculated at t1 and t2. Because FL2 is gen-erated by strong field E1, it contains AT splitting. Because t1 is a low intensity point of pulse distribution, compared with t2, it is notable that correlation (Fig. 4b1) switches to anti-correlation (Fig. 4b2) as the initial phase of FL2 is changed via the nonlinear phase from the dressing effect of E1. The power of E1 (5 mW) is much stronger than that of E2 (1 mW). The initial phase is mainly induced by dress-ing E1, which leads to AT splitting and cross-phase modu-lation of FL2. This modulation is physically characterized by a refractive index of n0 + n2|E|2, where n0 is the linear
refractive term and n2 = 3χ(3)/2n0 is a nonlinear refrac-tive index term that is proportional to the field strength |E|2. Therefore, the nonlinear phase shift can be characterized as
ϕ = 2(
∣
∣
∣ES/as
∣
∣
∣
2nS/aS2 −
∣
∣E1
∣
∣
2nFL22 )ζe−r2z/n1. Because the
Kerr phase shift on one input is proportional to the photonic

Correlation and squeezing of hybrid signals with or without Autler–Townes splitting…
1 3
Page 9 of 13 186
flux of the other input [23], here nFL22 is more influenced by E1, in contrast to nS/aS2 . However, the parameter ζ is also mainly responsible for phase shift, where ζ =
∣
∣G1
/
GS/aS
∣
∣
2 is the intensity ratio of the strong field, G1, and the obtained weak fields, GS/aS. The correlation values in Fig. 4b3 fur-ther decrease, owing to the lower intensity of pulse distribu-tion at t3. As the pulse intensity at t3 and t4 further decreases, the noise correlation values also decrease. The amplitudes of the electric fields are given as E = (2I/cε0n)
1/2, where I is the laser intensity [I = P/S(W/cm2)], which primarily depends on power. We have Gi ∝ P1/2, namely, |Gi|2 ∝ P . Hence, we deduce that Δϕ is proportional to the intensity (power) of the dressing field. In addition, the transition from a sharp to a broad peak is similar to the power phe-nomenon explained in Fig. 3, owing to different intensi-ties of pulse distribution. This switching between correla-tion and anti-correlation, and the transition of a sharp to a broad peak can be observed in the correlation of FL1 and FL2 at the same times, wherein we obtain switching of cor-relation to anti-correlation because of the dressing phase (ϕT = ϕFL = 2(nFL12 − nFL22 )|E1|2ζe−r2z/n1) of FL2 induced by E1, here nFL11 is more influenced by E1, than is nFL12 . At this point, ϕT is also negative. Moreover, the transition from a sharp to a broad peak in V-type systems persists at different times pulse distribution, as compared with the phenomenon illustrated in Fig. 4.
In Fig. 5, we investigate the Λ-type system by changing the power of E1 from high (left) to low (right) (5–1 mW), while keeping P3 constant, at a low power. Figure 5a1–a4 shows the correlation between Stokes/anti-Stokes signals of PC-FWM and FL1 (without AT splitting). The decay rates are calculated from ΓS/aS and ΓFL1 in the time domain. The deduced decoherence rate ГFL is caused by the combination of the dressing effect and induced dipole–dipole interaction (in turn, H–H* states and D–D states, respectively). There-fore, the decoherence rate increases with power P1 until the dressing effect is not dominant; after the dressing effect becomes dominant, the decoherence rate starts to decrease. Hence, at high power, the dressing effect is dominant, thus explaining why FL and PC-FWM have low decoherence rates and result in broad correlation peaks, which can also be attributed to
in the Λ-type system. Here, ζ =∣
∣G1
/
GS/aS/FL
∣
∣
2 is the intensity ratio of strong field G1 and obtained weak fields GS/aS/FL. Unlike the V-type level system, in which the line shape is influenced by decay rate, the correlation func-tion in the Λ-type system depends on the source dressing, because the Λ-type system is more sensitive to dressing
AS/aS−FL = R1|A1|2[(e−2(Γ −S/aS+Γ −
FL+ζ )|τ | − 2 cos(Ωe|τ |)
× e−(Γ +
S/aS+Γ +FL+Γ −
S/aS+Γ −FL+ζ )|τ | + e
−2(Γ +S/aS+Γ +
FL+ζ )|τ |]
( s)
`-4 0 4
0.0
0.8
G2 S/
AS-F
L2()
(b1)
-4 0 4-0.8
0.0
(b2)
-4 0 4-0.8
0.0
(b3)
-4 0 4-0.8
0.0
(b4)
-4 0 4-0.8
0.0
0.8
G2 FL
1-FL
2()
(c1)
-4 0 4-0.8
0.0
(c2)
-4 0 4-0.8
0.0
(c3)
-4 0 4-0.8
0.0
(c4)
-4 0 4
0.0
0.8 (a1)G
2 S/AS
-FL1
()
-4 0 4
0.0
0.8 (a2)
-4 0 4
0.0
0.8 (a3)
-4 0 4
0.0
0.8 (a4)
0 1 2 3 40.0
0.6
1.2
(d3)
(d2)
(d1)
0 1 2 3 4-0.6
0.0
0.6
1.2
(e3)
(e2)
(e1)
0 1 2 3 4-1.2-0.60.00.61.2
(f3)
(f2)(f1)
1 2 3 4.. .. ..t t t t
Fig. 4 By selecting t1, t2, t3 and t4 in decay curves, as shown in Fig. 2a1, the two-mode intensity noise correlation in a three-level V-type system is obtained by fixing the power of E1 at P1 = 5 mW and E2 at P2 = 1 mW. a1–a4 Noise correlation between Stokes/anti-Stokes signals of PC-FWM and FL1 (without AT splitting); b1–b4
Stokes/anti-Stokes signals of PC-FWM and FL2 (with AT splitting); c1–c4 Noise correlation between FL1 (without AT splitting) and FL2 (with AT splitting); and d–f show the trend of the corresponding broad peak (d2, e2, f2), sharp peak (d3, e3, f3) and total (d1, e1, f1) correlation amplitude

H. Tang et al.
1 3
186 Page 10 of 13
with AS/aS−FL associated with a source via ζ consideration. Hence, at high power, the dressing is dominant and causes an increase. We also deduce that the decoherence rate decreases [24], thereby resulting in broad peak correlation. Alternatively, because the PC-FWM signals are caused by coherent processes, the correlation times are determined by the decoherence time (or inversely proportional to decoher-ence rate [26]) of the PC-FWM process, which has a low effect on perimeter AS/aS−FL, as dressing is dominant ζ, thus resulting in a broad peak of correlation.
As the power further decreases, ζ decreases, and increas-ing decoherence causes a decreased correlation time and an increased decay rate (which results in a sharp peak). Moreover, the amplitude dependence of a sharp and broad peak intersect at low power, in contrast to the behavior in the V-type system. The total amplitude of correlation from Fig. 5a1–a4, overall, decreases with power P1. The same phenomenon is observed between Stokes/anti-Stokes sig-nals of PC-FWM with FL2 (with AT splitting) in Fig. 5b1–b4. Again, because of the competition between FL and self-diffracted induced SP-FWM, the intensity of the SP-FWM signal dominates at high power, whereas the FL signal dominates at low power. Therefore, the correlation increases
with decreasing power, as shown in Fig. 5c. A comparison of Fig. 5e, f, g indicates that the transition from a broad peak to a sharp peak in Fig. 5f2, g2 is more gradual than that in Fig. 5e2. Figure 5d1–d4 demonstrates the intensity-difference squeezing between FL1 and FL2, which precisely follows the correlation curves of Fig. 5c that depict the squeezing dependence from Fig. 5g. Alternatively, with a broad peak of correlation, there is a high amount of squeez-ing, whereas with a sharp peak of correlation, there is little squeezing. The larger the broad peak, the higher the amount of squeezing. This phenomenon is very dramatic in both types of three-level systems. Comparing Fig. 3 of the V-type three-level system and Fig. 5 of the Λ-type three-level sys-tem, we obtain inverse transitions from sharp to broad peaks and broad to sharp peaks. This result can be attributed to the sensitivity of dressing, because the Λ-type system is more sensitive than the V-type system.
Here, we also demonstrate the switching between corre-lation and anti-correlation by selecting t1, t2, t3 and t4 time positions of pulse distribution curves (shown in Fig. 2a1) in the Λ-type three-level system. The two-mode intensity noise correlation between the Stokes/anti-Stokes signals of PC-FWM and FL3 (without AT splitting) is shown in
-4 0 4
0.0
0.8 (a1)G
2 S/AS
-FL1
()
-4 0 4
0.0
0.8 (a2)
-4 0 4
0.0
0.8
G2 S/
AS-F
L2()
(b1)
-4 0 4
0.0
0.8
G2 FL
1-FL
2()
(c1)
-4 0 4
0.0
0.8 (b2)
-4 0 4
0.0
0.8 (c4)
-4 0 4
0.0
0.8 (c2)
-4 0 4
0.0
0.8 (c3)
( s)
0 5 1040
60
80(d1)
Squ
eezi
ng (d
B)
( )MHz
`
-4 0 4
0.0
0.8 (c3)
-4 0 4
0.0
0.8 (c4)
-4 0 4
0.0
0.8 (b3)
-4 0 4
0.0
0.8 (b4)
0 5 1040
60
80(d2)
0 5 1040
60
80(d3)
0 5 1040
60
80(d4)
5 4 3 2 10.0
0.6
1.2
(g3)(g2)
(g1)
5 4 3 2 10.0
0.6
1.2
(e3)
(e2)
(e1)
5 4 3 2 10.0
0.6
1.2
(f3)(f2)
(f1)
5 4 3 2 15
10
15 (h)
P1(mw)
Fig. 5 As in Fig. 3, but in an Λ-type system, by changing power of E1 from high (left) to low (right) from 5 to 1 mW while E3 remains constant at low power

Correlation and squeezing of hybrid signals with or without Autler–Townes splitting…
1 3
Page 11 of 13 186
Fig. 6a1–a4, which are taken according to t1 − t4. The cor-relation values decrease as the intensities of the pulse dis-tribution of both PC-FWM and FL3 decrease from t1 − t4. Because FL3 is generated from weak field E3, there is no phenomenon of AT splitting or the dressing phase induced by E3, and the correlation does not switch to anti-correla-tion. Moreover, the intensity of Stokes/anti-Stokes signals is even weaker at these timing positions. In Fig. 6b1, the inten-sity noise correlations are calculated between the Stokes/anti-Stokes PC-FWM and FL4 (AT splitting) at time posi-tions t1 of pulse distribution using the boxcar gate position. Anti-correlation is an initial phase of FL4 that is changed because of a self-dressing effect of E1 (see Fig. 4b2), which increases because of a higher intensity of the pulse distri-bution at t2, as the pulse intensity at t2 decreases the noise correlation values. Meanwhile, the transition from a sharp to a broad peak is similar to the evolution in Fig. 4. These switching phenomena can be observed with FL3 and FL4 at the same time positions, in which we obtain the anti-correlation change in the initial phase of FL4 induced by E1, which is much stronger than E3. The initial phase is primarily induced by dressing E1, which leads to AT split-ting and phase modulation of FL4. Comparing Figs. 4 and 6, we obtain anti-correlation at t1 − t2 in the Λ-type system, whereas anti-correlation is present at t1 − t2 in the V-type system. This difference is because the Λ-type system is more sensitive to dressing than the V-type system.
Figure 7 demonstrates three-mode hybrid intensity noise correlation and intensity-difference squeezing. Fig-ure 7a1–a5 demonstrates the three-mode hybrid intensity noise correlation of PC-FWM and two multi-orders FLs.
The three-mode correlation and three-mode squeezing are calculated with Eqs. (16) and (17), respectively. The three-mode correlation decreases with power P1 because of the decrease in the total intensity of the PC-FWM and two multi-order FL signals. When P1 decreases, the internal dressing terms in Eqs. (3) and (4) suppress the PC-FWM signal, a result consistent with our observa-tions in in Fig. 2(b). At a high power, the gain effect of E1 dominates the dressing effect determined by Eqs. (3) and (4), respectively. Simultaneously, multi-order FLs with and without AT splitting have high gain effect as a result of E1. Because the overall intensity decreases with P1, the correlation peaks also decrease from left to right, as shown in Fig. 7a1–a5. Figure 7b1–b5 show the corre-sponding intensity-difference squeezing values of correla-tions in Fig. 7a1–a5. When power decreases, the value of measured intensity-difference squeezing also decreases. The corresponding trends of three-mode correlation and intensity-difference squeezing are shown in (a6) and (b6), respectively. Both trends are in agreement.
4 Conclusion
In summary, first, the transition from a sharp peak (high power) to a broad peak (low power) is attributed to decay rates of PC-FWM and multi-order FLs in a V-type system. In contrast, the transition from a broad peak (high power) to a sharp peak (low power) is attributed to the source dress-ing in a Λ-type system. Moreover, the noise correlation and intensity-difference squeezing show an inverse relationship
-4 0 4
0.0
0.8 (a1)G
2 S/AS
-FL1
()
-4 0 4
0.0
0.8 (a2)
( s)
`
-4 0 4
0.0
0.8 (c3)
-4 0 4
0.0
0.8 (a4)
-4 0 4
0.0
G2 S/
AS-F
L2()
(b1)
-4 0 4-0.8
0.0
(b2)
-4 0 4-0.8
0.0
(b3)
-4 0 4-0.8
0.0
(b4)
-4 0 4-0.8
0.0
G2 FL
1-FL
2() (c1)
-4 0 4-0.8
0.0
(c2)
-4 0 4-0.8
0.0
(c3)
-4 0 4-0.8
0.0
(c4)1 2 3 4
-0.6
0.0
(e3)
(e2)(e1)
1 2 3 4-1.2
-0.6
0.0
(f3)
(f2)
(f1)
1 2 3 40.0
0.6
(d3)
(d2)
(d1)
1 2 3 4.. .. ..t t t t
Fig. 6 Experimental results as in Fig. 4, except in a three-level Λ-type system

H. Tang et al.
1 3
186 Page 12 of 13
with power in both three-level systems, owing to the pres-ence of self-diffracted SP-FWM in the multi-order FL chan-nel. Furthermore, a broad peak of correlation is related to a high amount of squeezing and a sharp peak of correlation is related to a low amount of squeezing. Second, the switching of noise correlation to anti-correlation between PC-FWM & AT splitting FL and AT splitting FL & without AT splitting FL are attributed to a dressing phase caused by the dressing field E1. Third, three-mode intensity noise correlation and intensity-difference squeezing between Stokes/anti-Stokes signals of PC-FWM and two multi-order FLs show a linear relationship with power P1.
Acknowledgements This work was supported by the 973 Program (2012CB921804), KSTIT of Shaanxi Province (2014KCT-10), and NSFC (11474228).
References
1. M. Xiao, Y.Q. Li, S.Z. Jin, J. Gea-Banacloche, Measurement of dispersive properties of electromagnetically induced transpar-ency in rubidium atoms. Phys. Rev. Lett. 74, 666–669 (1995)
2. C.B. Li, H.B. Zheng, Y.P. Zhang, Z.Q. Nie, J.P. Song, M. Xiao, Observation of enhancement and suppression in four-wave mixing processes. Appl. Phys. Lett. 95, 041103 (2009)
3. L.V. Hau, S.E. Harris, Z. Dutton, C.H. Behroozi, Light speed reduction to 17 meters per second in an ultracold atomic gas. Nature 397, 594–598 (1999)
4. C. Liu, Z. Dutton, C.H. Behroozi, L.V. Hau, Observation of coherent optical information storage in an atomic medium using halted light pulses. Nature 409, 6819 (2001)
5. A. Turukhin, V. Sudarshanam, M. Shahriar, J. Musser, B. Ham, P. Hemmer, Observation of ultraslow and stored light pulses in a solid. Phys. Rev. Lett. 88, 023602 (2001)
6. J.J. Longdell, E. Fraval, M.J. Sellars, N.B. Manson, Stopped light with storage times greater than one second using electro-magnetically induced transparency in a solid. Phys. Rev. Lett. 95, 063601 (2005)
7. F. Beil, J. Klein, G. Nikoghosyan, T. Halfmann, Electromag-netically induced transparency and retrieval of light pulses in a Λ-type and a V-type level scheme in Pr3+:Y2SiO5. J. Phys. B. 41(7), 074001 (2008)
8. H. Wang, D. Du, Y. Fan, A. Li, L. Wang, X. Wei, Z. Kang, Y. Jiang, J. Wu, J. Gao, Enhaned four-wave mixing by atomic coherence in Pr3+: Y2SiO5 crystal. Appl. Phys. Lett. 93(23), 231107 (2008)
9. M. Sabooni, Q. Li, L. Rippe, R.K. Mohan, S. Kröll, Spectral engineering of slow light, cavity line narrowing, and pulse com-pression. Phys. Rev. Lett. 111(18), 183602 (2013)
3D Correlation 3D Squeezing
5 4 3 2 10.00.20.40.60.8
G(3) (
12)
0 2 4 6 8 10607590
105
Squeezing(dB
)
0 2 4 6 8 10708090100
Sque
ezing(dB
)
0 2 4 6 8 1090
100
110
120Sq
ueezing(dB
)
(MHz)
(MHz)
(MHz)5 4 3 2 1
0510152025
(a1) (a2)
(a3) (a4)
(a5) (a6)
(b1) (b2)
(b3) (b4)
(b5) (b6)
1(mW)P1(mW)P
Fig. 7 a1–a5 Three-mode hybrid intensity noise correlation and intensity-difference squeezing of Stokes/anti-Stokes signals of PC-FWM and two-fourth-order FL3 and FL4 by changing the power of E1 from high (left) to low (right) from 5 to 1 mW, while P3 remains
constant in the Λ-type three-level system. b1–b5 Show the corre-sponding three-mode squeezing. a6, b6 Show the trend of three-mode correlation amplitude and corresponding magnitude of three-mode squeezing at different power P1
Correlation and squeezing of hybrid signals with or without Autler–Townes splitting…
1 3
Page 13 of 13 186
10. C. Li, L. Wang, H. Zheng, H. Lan, C. Lei, D. Zhang, M. Xiao, Y. Zhang, All-optically controlled fourth- and sixth-order fluores-cence processes of Pr3+: YSO. Appl. Phys. Lett. 104(5), 051912 (2014)
11. V.A. Sautenkov, Y.V. Rostovtsev, M.O. Scully, Switching between photon-photon correlations and Raman anti-correlations in a coherently prepared Rb vapor. Phys. Rev. A 72(6), 065801 (2005)
12. X.H. Yang, J.T. Sheng, U. Khadka, M. Xiao, Generation of cor-related and anti-correlated multiple fields via atomic spin coher-ence. Phys. Rev. A 85, 013824 (2012)
13. H.J. Kimble, M. Dagenais, L. Mandel, Photon anti-bunching in resonance fluorescence. Phys. Rev. Lett. 39, 691–695 (1977)
14. Z. Qin, L. Cao, H. Wang, A.M. Marino, W. Zhang, J. Jing, Experimental generation of multiple quantum correlated beams from hot rubidium vapor. Phys. Rev. Lett. 113(2), 023602 (2014)
15. X. Jia, Z. Yan, Z. Duan, X. Su, H. Wang, C. Xie, K. Peng, Exper-imental realization of three-color entanglement at optical fiber communication and atomic storage wavelengths. Phys. Rev. Lett. 109(25), 253604 (2012)
16. H. Zheng, U. Khadka, J. Song, Y. Zhang, M. Xiao, Three-field noise correlation via third-order nonlinear optical processes. Opt. Lett. 36, 13 (2011)
17. N. Gisin, G. Ribordy, W. Tittel, H. Zbinden, Quantum cryptogra-phy. Rev. Mod. Phys. 74, 145–195 (2003)
18. Y. Yamamoto, H.A. Haus, Preparation, measurement and infor-mation capacity of optical quantum states. Rev. Mod. Phys. 58(4), 1001–1020 (1986)
19. R. Horodecki, P. Horodecki, M. Horodecki, K. Horodecki, Quan-tum entanglement. Rev. Mod. Phys. 81, 865–942 (2009)
20. H. Wu, M. Xiao, Bright correlated twin beams from an atomic ensemble in the optical cavity Phys. Rev. A 80(6), 063415 (2009)
21. H.X. Chen, M.Z. Qin, Y.Q. Zhang, X. Zhang, F. Wen, J.M. Wen, Y.P. Zhang, Laser Phys. Lett. 11, 045201 (2014)
22. C. Li, L. Wang, C. Yang, T. Jiang, M. Imran, I. Ahmed et al., Multi-dressing time delayed fourth- and sixth-order fluorescence processes in Pr3+: YSO. RSC Adv. 5(49), 39449–39454 (2015)
23. J.H. Shapiro, M. Razavi, Continuous-time cross-phase modula-tion and quantum computation. New J. Phys. 9(1), 16 (2007)
24. I. Ahmed, Z. Liu, Y. Pan, C. Li, I. Metlo, H. Chen et al., Dressed intensity noise correlation and intensity-difference squeez-ing of spontaneous parametric four-wave mixing process in a Pr3+:YSO crystal. Opt. Express 23(14), 17828–17837 (2015)
25. H. Lan, C. Li, C. Lei, H. Zheng, R. Wang, M. Xiao, Y. Zhang, Competition between spontaneous parametric four-wave mixing and fluorescence in Pr3+:YSO. Laser Phys. Lett. 12(1), 015404 (2015)
26. L. Changbiao et al., Controlled correlation and squeezing in Pr3+:Y2SiO5 to yield correlated light beams. Phys. Rev. A 7, 014023 (2017)
27. H.B. Zheng, C.B. Li, H.Y. Lan, C.J. Lei, D. Zhang, Y.P. Zhang, M. Xiao, Seeded spontaneous parametric four-wave mixing and fluorescence of Pr3+: YSO. Laser Phys. Lett. 11, 116102 (2014)