wizards den - acesso o site antigo
TRANSCRIPT

20 Golden Rulesfor Traders
Trading Masters NEW TO TRADING & TECHNICAL ANALYSIS?Click Here
WIZARDSHomeDaily
CoursesTactics
Resources
YOUR DAILY
MARKETGUIDE
Featuring
InteractiveTradingPicks
PICKS, CHARTS, SCANS, IDEAS &
PROFITSCheck outMORNING TRADER
NOW!
andEVERY MARKET
DAY!
SEARCH
HIT AND RUNJeff CooperMomentum & the SwingJeff Cooper has been a professional trader since 1982 and is the author of three best selling books: Hit and Run I, Hit and Run II, and The 5 Day Momentum Method. Cooper's financial markets experience started in 1981 at Drexel Burnham, working for his father, a private hedge fund manager. Cooper has been a trader and author ever since, working out of his home in Malibu, California. The Fantasy Island ReversalThe reversal of a strongly trending stock can leave investors stranded and money managers shipwrecked.Identifying An Explosive Bias Before The FactVolatility studies can offer clues as to the likelihood of an imminent explosion in price.Pattern Recognition Follow an actual trade setup through Jeff's skilled eyes. Complete with chart observations and natural reward:risk levels.
THE TECHTRADERHarry BoxerReading The SignalsHarry Boxer has more than 30 yrs investment and technical analysis experience. He is a consultant to many Wall Street hedge funds and large institutional traders. Harry currently authors daily reports at his financial website The Technical Trader. Countertrend Day TradingUsing the right tools will improve your returns in a tough market.Identifying Market ExtremesLearn how to interpret volatility indicators so they pinpoint intermediate reversals and snapback rallies. Base PatternsCharts with long and stable bases will yield the best trades over time.
REALITY TRADERAllen ZuckermanSeeing The Futures
POWERFULONLINE
TRADINGCOURSE
FromHARD RIGHT EDGE
YourOriginal Guide
toSuccessful
Short-Term Trading
Highly EffectiveMarket Strategies
and3-D Charting Techniques
GetMore Info
McGRAW-HILL PUBLISHERS
presents
Powerful Tools for Traders
Complete 7-Bells Scansand More
Info
Finding The Best Fish In The Stock OceanLearn the art of stock-picking with a true master of the art.
TRADING MARKETSMark BoucherMaster of the GameMark Boucher has been the manager of the Midas Trust Fund, Cayman Islands, since 1992. The fund was recently ranked number one in the world by Nelson's World's Best Money Managers for its 5-year compounded rate of return of 26.6%. Boucher began trading at age 16. He also founded Investment Research Associates to finance research on stock, bond, and currency trading systems. Reviewing The Art Of Short SellingLearn the criteria that lead to successful short sales.Trailing Stop TechniquesMost investors and traders spend far too much time focusing on how to enter a stock and far too little time focusing on how to best exit a profitable position.
David LandryThe Winning Hedge
Allen Zuckerman has traded stocks, options and commodities since 1990. He is now a full-time trader sharing his methods and money management skills with the members of RealityTrader.com Index Trading Chat Room. Allen currently applies various chart patterns and market probabilities to the art of trading the ETF's and futures markets. 30-Minute BreakoutWhat do you do when the QQQ breaks its morning range? Do you play for continuation of the breakout, or fade the reversal after the break?E-Mini Exit StrategiesAnyone can show you how to get into a trade. But the trick to turning profits is how you get out.
Vadym GraiferMaster of the Tape
Trading Skillsfor a New Generation
Hard Right Edge Founder
Alan S. Farley
ORDER NOW!
HRE SPOTLIGHT
TechnicalAnalysisMasters
Jeff Cooper

A Commodity Trading Advisor (CTA), Mr. Landry is principal of Sentive Trading, a money management firm, and a principal of Harvest Capital Management, a hedge fund. Mr. Landry has authored a number of trading systems, including the 2/20 EMA Breakout System and the Volatility Explosion Method. His research has been referenced in several books such as Connors On Advanced Trading Strategies and Beginners Guide to Computerized Trading. Introduction to VolatilityLearn about how to recognize and measure changing market conditions with this informative report.Moving Averages I: The Ins and Outs OfLook at the calculation and comparison of simple, exponential and weighted moving averages.Moving Averages II: Characteristics and General UsesDifferent types of moving averages can lead to very different outcomes.Moving Averages III: Trading PatternsLearn practical applications and setups for different moving average scenarios.
Vadym Graifer is a full-time professional stock trader, teacher and author. His online book, "Job-Daytrader", is based upon his personal trading and teaching experiences. Vadym is co-founder of Reality Trader, an outstanding educational service dedicated to his unique trading methods and practices. Tape ReadingLike no other method, tape reading deals with reality itself, allowing traders to see market moving forces in action.Mental StateIf you want to be a trader, you must trade, you must change yourself from fearing to take a trade to cold-blooded readiness to react on a valid signal.Personal AccountabilityThe ego is a big part of a trader's demise in the long run. When ego leads decision making, over time there is no possibility for consistency.
Chris SchumacherEntering Reality

MASTER OF TRENDSChris TerryStocks, Day Trading and Technical AnalysisChristopher is a full-time stock and index futures trader. In addition to his trading, Chris and his partner, New Market Wizard Linda Bradford Raschke, provide an online trading service that provides entry and exit signals for professional traders. His Web site is LBRGroup. Short-Term DivergenceThe key to trading on a short-term time frame is always keeping the larger time frame trend in mind.Three Index AnalysisKey turning points in the stock market trigger when prices don't confirm each others trends.
PART TIME MASTERRick LaPointCommon Sense TradingRick LaPoint is founder of PartTimeTrader.Com, a popular speaker, and creator of the unique FibCalc Fibonacci Calculator. His methods and market observations are topics of discussion in bulletin boards and chat rooms all over the world.
Chris began market analysis and global research in 1994 as a Partner in the 3122 Investment Co. He is the founder and chief executive officer of Reality Trader, an educational trading service for active traders. Changing Your BeliefsYour belief about the market hurting you, forget it. When you do, you regain control. When you regain control, what is there to fear? If there is nothing to fear, how can you fail?R.H.Y.T.H.M. TradingDon't think, respond. Developing and retaining self-control through proper mastering of emotions will allow you clarity in watching market action as well as individual trade action.
MASTER OF LEVELSJoe DiNapoliFutures, Stocks and FibonacciJoe's exhaustive investigations into Displaced Moving Averages, his creation of the proprietary "Oscillator Predictor", and in particular, his practical and unique method of applying Fibonacci ratios to the price axis, makes him one of today's most sought after experts.

Day Trading The Morning GapLearn a relatively simple method to determine the day's top or bottom, based on the "50% Phenomenon", which occurs very often on the intraday charts.Dangers of Default Chart SettingsSee how the Crash of 2000 had a more devastating affect, dollar wise, than did the Crash of 1987, even though the percentage of the plunge was roughly the same.
MASTER OF THE SWINGBrandon FredericksonThe New GenerationBrandon Fredrickson is a trader with 6 years of professional experiance in the Agricultural and Equities markets. He is the co-founder and President of Swingtrader.Net, an educational site and chat room. He is a technical trader, primarily using a trend-following method and tight loss control. Money ManagementSome might have you going long with Jimmy Rogers, while others will have you doing it with Bernard Baruch, but when it gets right down to it the most critical part of making money is not losing it.
OTHER VOICES
Interview with Joe DiNapoliThe master talks about price objectives, Fibonacci retracement and when to buy and sell.Tutorial: Leading and Lagging Indicators - Achieving a BalanceHere's a trading methodology that gives you predefined entry levels, reasonably tight stops, and precalculated profit objectives.Trading With DiNapoli LevelsIntroducing the most comprehensive book ever published on the practical application of Fibonacci Analysis to the Price AxisDiNapoli Home Trading Courses - Fibonacci, Money Management and Trend AnalysisAll of Joe DiNapoli's Best Trading Patterns and Rules Revealed In Detail!
MASTER OF FUTURESTeresa LoThe Intelligent SpeculatorTeresa worked in the stock brokerage business for more than a decade prior to retirement from the industry in 1998 to become a private investor. She is a technical trader and uses Edwards & Magee patterns and Japanese candlestick techniques to analyze the market.

Steve SandoRules of The Inner GameSteve is a highly successful graduate of HRE's Mastering The Trade course. He develops software applications and trades daily from his home in central California. Sando's market analogies help all traders understand the conflicting forces at work each market day. Predator or Prey?What kind of fish are you in the market sea? If you're not sure, get ready to be eaten.5 Phases of a TradeBreak your trading into five important steps and get on the road to success.
A Trader for All SeasonsI discovered quickly that the brokers and firm's traders had no particular brand of magic and proceeded in the quest for market knowledge alone.The Holy GrailAs the community of traders has evolved, the "Grail buy" has been nicknamed "the dip", implying a place where a buy may be set up. The "Grail sale" has been nicknamed "the ding", implying a place where a short sale may be set up.Japanese CandlesticksWe use Japanese candlesticks in conjunction with classic Western technical analysis. With moving averages in trending markets, such as Raschke's Holy Grail set-up, in areas of support and resistance and on tests of tops and bottoms, such as the Trader Vic 1-2-3 set-ups.Dojis and Shooting StarsA doji represents indecision and forms part of several important formations: Doji Star, Morning Doji Star, Evening Doji Star, Abandoned Baby and Tri Star.
Hard Right Edge Recommends:Low Commissions/Excellent Service:We Strongly Recommend CyberTrader as your professional trading solution.


20 Golden Rulesfor Traders
Trading Masters NEW TO TRADING & TECHNICAL ANALYSIS?Click Here
WIZARDSTUTORIAL
HomeDaily
CoursesTactics
Resources
YOUR DAILY
MARKETGUIDE
Featuring
InteractiveTradingPicks
PICKS, CHARTS, SCANS, IDEAS &
PROFITSCheck outMORNING TRADER
NOW!
andEVERY MARKET
DAY!
THE FANTASY ISLAND REVERSALBy Jeff Cooper
The island reversal is a powerful technical tool. However, the classic island reversal, where a stock gaps up to a new relative high but the subsequent session gaps down leaving a high below the prior days low, occurs infrequently. Even given decimalization, the pattern is likely to remain somewhat rare.
Hence, I created the Gilligan's Island in order to capture reversals in the spirit of the one-day island exhaustion pattern. The Gilligan's Island is explained in my first book, Hit and Run Trading. Essentially, it occurs when a stock gaps up to a 60 day high but closes poorly (in the bottom 25% of the range). Gilligan buy signals are a mirror image.
Now let me introduce you to Gilligan's cousin, Fantasy Island. A Fantasy Island sell signal occurs when a stock laps or jumps up above the prior days close but below the prior days high, scores a new 60 day high on the day, but sells off, closing down on the day in the bottom 25% of the range. (For buys, simply reverse the rules). Due to decimalization, the lap required to generate Fantasy Island should be meaningful, not pennies. I typically want to see at least a 50-cent lap.
There are reversals and then there are reversals. Many tops (and bottoms) are Gilligans or Fantasy Islands, but not all Gilligans or Fantasy Islands are tops (or bottoms). I am going to show you how I determine which signals are meaningful. Sometimes very meaningful. The important thing to remember is that stocks turn on a dime; most trades cannot. The sudden reversal of strongly trending stocks often leaves investors stranded and money managers shipwrecked. Hence, then name Gilligan's Island. Its sometimes less conspicuous relative, the Fantasy Island, can leave market participants equally marooned.
On December 6th, 2001, Imclone Systems (IMCL), one of the leading biotech stocks, lapped open and ran up to score a new 60-day high only to reverse by the end of the day. A look at the daily chart shows that IMCL closed at the low of the day and substantially below the prior days close after lapping up and hitting a new 60-day high, setting up the Fantasy Island sell. Of course, as always, follow-through is required to confirm a signal. Bearishly, the reversal was also a Lightning RodTM (LROD) as well as a Soup NaziTM. The Soup Nazi, as in "No soup for you!" (from the character on the Seinfeld show) occurs when a stock makes a new 14-day high, pulls back and fails on a test of that high. Keep in mind that the previous 14 day high to a test failure must have occurred at least 4 sessions earlier in order to avoid
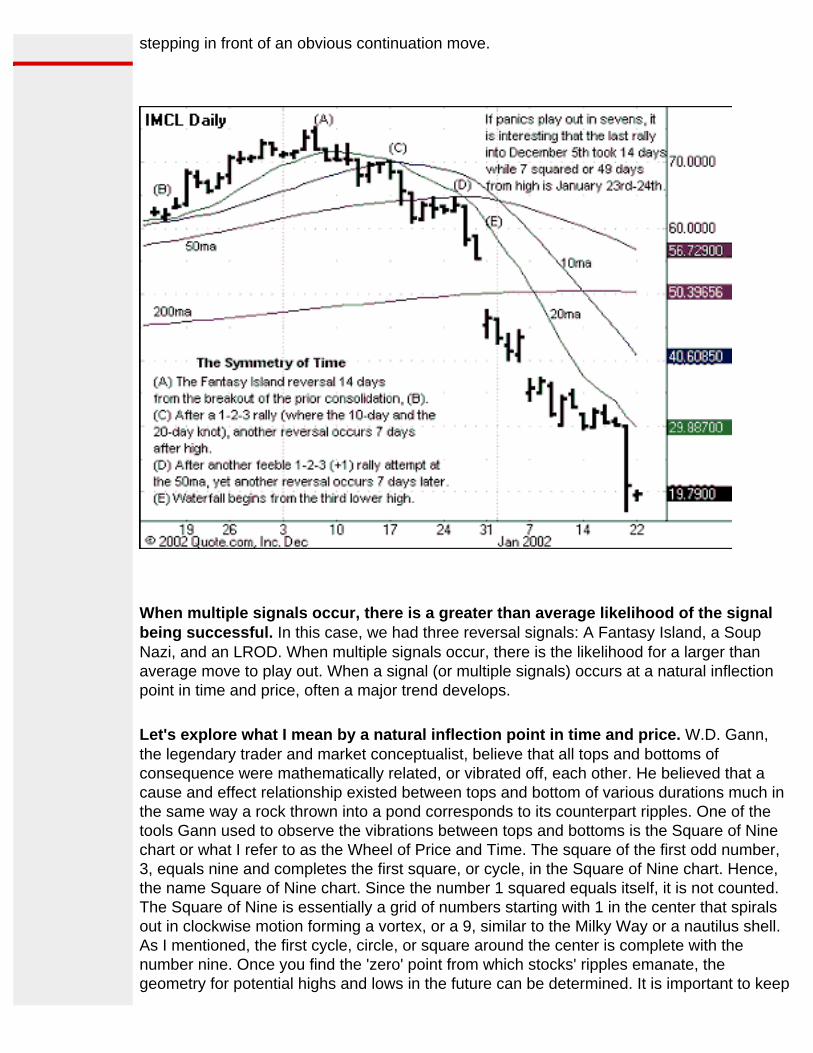
stepping in front of an obvious continuation move.
When multiple signals occur, there is a greater than average likelihood of the signal being successful. In this case, we had three reversal signals: A Fantasy Island, a Soup Nazi, and an LROD. When multiple signals occur, there is the likelihood for a larger than average move to play out. When a signal (or multiple signals) occurs at a natural inflection point in time and price, often a major trend develops.
Let's explore what I mean by a natural inflection point in time and price. W.D. Gann, the legendary trader and market conceptualist, believe that all tops and bottoms of consequence were mathematically related, or vibrated off, each other. He believed that a cause and effect relationship existed between tops and bottom of various durations much in the same way a rock thrown into a pond corresponds to its counterpart ripples. One of the tools Gann used to observe the vibrations between tops and bottoms is the Square of Nine chart or what I refer to as the Wheel of Price and Time. The square of the first odd number, 3, equals nine and completes the first square, or cycle, in the Square of Nine chart. Hence, the name Square of Nine chart. Since the number 1 squared equals itself, it is not counted. The Square of Nine is essentially a grid of numbers starting with 1 in the center that spirals out in clockwise motion forming a vortex, or a 9, similar to the Milky Way or a nautilus shell. As I mentioned, the first cycle, circle, or square around the center is complete with the number nine. Once you find the 'zero' point from which stocks' ripples emanate, the geometry for potential highs and lows in the future can be determined. It is important to keep

in mind, however, that one must not only use the all-time highs and lows on the yearly chart, but also the closing highs and lows on the daily, weekly, and monthly chart when projecting price cycles.
A look at the weekly chart of IMCL shows an important low in March of 2001 at 23.87. 23 is on the important cardinal cross of the Square of Nine chart (the north to south and east to west vectors). The weekly chart shows that one cycle up, or 360 degrees plus 90 degrees (for a total of 450 degrees) equals 53 on the same vector as March 21st and marked the closing weekly high in June of 2001. June is 3 months or 90 degrees of the year from March. Ninety-degree movements in time and price are a natural area to look for support, resistance, or in some cases, possible acceleration. It is the behavior after 90 degrees of growth that must be observed. As you can see, opposition the June time frame or 180 degrees in time from June, in December 2001 marked the termination of the advance from the March 2001 low. A period that consumed nine months (270 degrees of the year - 2 plus 7 equals 9).
Notice that, bullishly, IMCL initially rallied past 46, which represented the first cycle of 360 degrees from low. That suggested that after a pullback, a further advance might be expected. The initial 46 resistance pretty much contained the nine-week pullback. Interestingly, for that nine-week period, IMCL never closed below 46 on the weekly closing chart by more than a point and change. On those occasions, the closes were as follows: 45.99 on the week ending June 22, 2001. 45.50 on the week ending July 13, 2001. 45.81 on

the week ending August 3, 2001. 44.88 on the week ending August 10, 2001. 45.50 on the week ending August 17, 2001. Not too shabby. Such is the power of the squares.
To recap, off the March low, IMCL found high 450 degrees up in price and 90 degrees out in time. Then the stock pulled back for 7 to 10 weeks and 90 degrees in price before commencing on a new leg. Just happenstance?
On the next leg up, note the consolidation at 61, which was 540 degrees up from the low price. Note also that IMCL first hits 61 on September 20th, precisely 180 degrees in time from the March low. Ultimately IMCL reached 75.44, making a grasp for 77, which represents two full cycles of 360 degrees from low. 77 is 720 degrees up from 23 and also is on the vector crossing between June and December. This is how the June and December highs are related and square out in time and price.
As shown on the monthly chart, the all-time monthly closing high for IMCL was 77.21 on the month ending February 2000. From the all-time monthly closing high, IMCL shows a rally peak 36 weeks, or six squared weeks later, to the week ending November 3rd 2000 leading to a major reversal. From the week ending March 23rd, 2001, counting out 36 weeks gives the week ending November 30th, 2001, the high weekly close prior to its recent collapse from 75 to 17 in seven weeks. Gann used to say that panics play out in sevens. It will be interesting to see what happens with IMCL in the coming weeks. The yearly chart has now turned down and from the weekly closing high in December of 72, 720 degrees down is

20.50. Friday's close, 21.14, which is close enough for government work.
In summary, putting the pieces together, the reversal signals of the daily chart combined with the Iguana sell signal on the weekly chart at the December high (a new 10-week high that leaves a tail) proved the math that connected the dots on the Wheel of Time and Price. I think you will agree that, indeed, symmetry exists in the markets.
Jeff Cooper is a full-time professional equities trader. A graduate of New York University, he is also the author of Hit & Run Trading, Hit & Run Trading II, Hit & Run Lessons, and the comprehensive video course, Jeff Cooper on Dominating the Day Trading Market. For information about how to subscribe to Jeff Cooper's nightly newsletter services, go to The Trading Reports.
All original materials: © 2003 Brooke Publishers, Inc.
Comments: [email protected]

20 Golden Rulesfor Traders
Trading Masters NEW TO TRADING & TECHNICAL ANALYSIS?Click Here
WIZARDSTUTORIAL
HomeDaily
CoursesTactics
Resources
YOUR DAILY
MARKETGUIDE
Featuring
InteractiveTradingPicks
PICKS, CHARTS, SCANS, IDEAS &
PROFITSCheck outMORNING TRADER
NOW!
andEVERY MARKET
DAY!
IDENTIFYING AN EXPLOSIVE BIAS BEFORE THE FACTBy Jeff Cooper
Many readers are familiar with my Hit and Run books, which explain my short-term trading methodology. Most traders are surprised to find that despite my focus on the short-term (a few hours to a few days) time frame, I spend a substantial amount of time analyzing the big picture. In my experience, explosive stock moves usually don't occur out of the blue; often (not always) there are clues out there that will tip us off to stalk a situation. Some of these clues can be found in the study of price patterns, time patterns, or cyclical analysis, volume studies, identification of price octaves on the Gann Square of Nine chart, identification of time/price 'square outs' on the Gann Square of Nine chart as well as Trend Line theory.
Volatility studies can also offer clues as to the likelihood of an imminent explosion in price. Sometimes, of course, without some knowledge of the above correct underlying structure of a stock price movement, the best volatility studies won't give you a clue to the directional bias of a volatility setup. And of course, as our mama's told us, "…it's important to try to get on the train before it leaves the station." As one of my heroes, legendary trader Bernard Baruch said, "Successful speculation is about anticipating the anticipators."
As W.D. Gann used to say, "Use all tools, all the time." Of course, if you don't know how to put the technical pieces together and 'dovetail a joint,' the more tools you use will simply overwhelm you. For the purpose of identifying the explosive setup below on DOX and how it tipped its hand, we are going to focus on how drilling down from the big picture to the short term picture and how using a few simple tools led to a solid one day profit of 10%. If you do that enough times the magic of compounding will make you richer than you ever dreamed possible.
As I alluded to above, one of the keys to identifying larger than average moves is not just correct interpretation of short-term price behavior, but also the message of the big picture. In other words, the short term doesn't exist in a vacuum; it emanates from the vibrations created and set in place and determined by big picture forces. Imagine yourself sitting on the edge of a perfectly placid lake with your feet in the water. A small plane flies overhead, from which a boulder is thrown into the middle of the lake. Ten minutes later, ripples hit your ankles. The initial force was set in motion and the outcome was clear. But it took time to occur.
Unfortunately in the markets, there are always two vibrations or two trends at work simultaneously, the major and the minor trend. Much like a major and minor chord in music, the tug of war between these two trends determines what kind of slope will dominate as the stock marches across the chart. As in music, in the markets you must grasp a sense of the whole piece before any one note rings true. Only a sense of the whole piece will reveal the underlying tone and rhythm of a movement whether on Wall Street or Lincoln Center. As traders, we play note by note but only in the context of a larger framework can satisfaction be maintained.
The encouraging part is that, as in music, there are refrains and patterns that repeat. There is often - not always - symmetry in the markets and the expectations that this repetition of behavior set up. Let's take a look at an example of drilling down from the big picture to the short-term picture.

On June 14th (a), DOX gapped to the downside confirming a test failure at a top and in the process leaving a breakaway gap from a triangle. The breakdown gives us a point as which to draw a downside channel.
In my experience, many times the first violent reaction is the midpoint of a move. If you take the high price in June of 66.50 and the low price of 24 on October 3rd, you are given a range of 42.50 points. One-half of that range is 21.25 points. Subtracted from the high of 66.50, you have a midpoint of 45.25. A look at the chart at 45.25 shows the expansion in volatility that marks the midpoint of the ultimate decline (d). Of course, there is no way at that point to ascertain what the low in fact will be. However, assuming that 45 may be a midpoint, one can arrive at a projected low point. As Gann said many times, "…as above, so below." Just as there was a test of the high in June that led to a break of a triangle; likewise, subsequent to the October 3rd low at 24, there was a successful test on October 31st ((a) chart below).
It is important to note two elements at this point in the chart; 1) from the high on June 5th to the low on October 3rd was almost 120 calendar days, one-third of the year and an important inflection point in Gann analysis to look for a potential turning point. It is this price projection and the time count that put DOX on the radar. 2) Importantly, the test on October 31st occurs after DOX breaks above the down trending parallel channel On October 11th (see Figure 1).

On November 15th, DOX generates multiple buy signals. Not only does the stock break above the triangle, but it also leaves an Expansion Pivot buy signal (b) as it closes over the 50ma for the first time since the breakaway gap to the downside in June. As you know, multiple signals tend to generate better risk to reward setups and many times generate explosive moves.
Despite the fact that the overall indices, led by the December S&P futures made a first hour high on Friday November 16th and trended mostly lower for the balance of the morning session, DOX continued to advance. After a first pullback in sympathy with the futures into 11:30a ((a) chart below) DOX exhibited strong intraday relative strength, or right translation, when the stock followed through, shrugging off the market, to make a new intraday high. This set up a solid trend day as DOX continued to stair-step up into the bell leading to solid profits.

In conclusion, as you can see, the explosive move in DOX didn't come out of the blue. Putting the pieces together -- stalking the prey and leaping as the daily charts triggered, then pressing as the observation of intraday relative strength suggested a trend day -- made for a successful trade. But if the stock isn't on the radar to focus on, how can you expect to observe its superior behavior on the key day, Friday, November 16th? I have found that the creation of a weekly Hit List as well as a Stalking List of big picture setups is the only way to focus and drill down.
In trading, focus is paramount. The more you try to see, often the less you see. The nightly research we do of quickly scanning manually through hundreds of charts allows me to create both lists. This is where the candidates for both the Cooper Swing Report and the Cooper Hit and Run Day Trading Report are generated. There are things that can be seen in scrolling through many charts every day manually that cannot show up on routine computer pattern scans. As I like to say, speculation is observation.
Jeff Cooper is a full-time professional equities trader. A graduate of New York University, he is also the author of Hit & Run Trading, Hit & Run Trading II, Hit & Run Lessons, and the comprehensive video course, Jeff Cooper on Dominating the Day Trading Market. For information about how to subscribe to Jeff Cooper's nightly newsletter services, go to The Trading Reports.
All original materials: © 2003 Brooke Publishers, Inc.
Comments: [email protected]

20 Golden Rulesfor Traders
Trading Masters NEW TO TRADING & TECHNICAL ANALYSIS?Click Here
WIZARDSTUTORIAL
HomeDaily
CoursesTactics
Resources
YOUR DAILY
MARKETGUIDE
Featuring
InteractiveTradingPicks
PICKS, CHARTS, SCANS, IDEAS &
PROFITSCheck outMORNING TRADER
NOW!
andEVERY MARKET
DAY!
PATTERN RECOGNITIONBy Jeff Cooper
If you are familiar with anything I've written, you're aware that I key off patterns. Price action is the market putting its money where its mouth is. In this Trading Lesson, I'm going to walk through a recent setup, Citrix Systems (CTXS), that I focused on in my morning commentary for TradingMarkets.com on Jan. 13 and Jan. 18. In fleshing out how I picked the setup and, just as importantly, how to surf the resulting move, I hope to let you get into my head.
I'm not really a position player. Long term for me is three days -- maybe three hours. I seek to capitalize on stock movement as I see momentum ebb and flow. I may be in and out of a stock a few times the same day. That doesn't mean that's the correct way for you to trade, that's just my style. It probably comes from being indoctrinated to the market at a time when the market believed redwoods didn't grow up to the sky -- a time before anything more than three-month bear markets were outlawed.
I'm going to approach this article in a kind of rapid-fire, stream-of-consciousness way, much as I would when scrolling quickly through daily charts after the close, looking for the next day's setups. I'm going to walk through the CTXS example showing the way I make trading decisions when looking at intraday patterns. Short-term traders don't have the luxury of examining a lot of criteria. There is no air-tight analysis. They must shoot from the hip, react quickly to what they see, and pull the trigger or be stampeded by a new breed of point-and-click gunslingers. There's plenty of time to think about the trade later. That's where the learning becomes indelible. I urge you to review intraday charts and print out solid learning examples for posterity.
Let's take a look at CTXS.
POWERFULONLINE
TRADINGCOURSE
FromHARD RIGHT EDGE
YourOriginal Guide
toSuccessful
Short-Term Trading
Highly EffectiveMarket Strategies
and3-D Charting Techniques
GetMore Info

In my commentary on Jan. 13, I mentioned that CTXS, a leading stock in a complex pullback, looked like an interesting buy candidate. Following is the weight of evidence leading to the decision and how I read the tale of the tape.
Observation 1: Jan 7. Strong reversal after gap down open tests important 50-day moving average. (1).
Observation 2: Strong close, nearly at the top tick, leaves what I call a "stickman" double bottom with the tail day of Dec. 15 (2). Nice way to close out the week. Looks like a potential offset to a climax as the large range up looks to counterbalance the large range down day of Jan. 6. Stock is poised for continuation on Monday.
Observation 3: CTXS gaps up nearly 5 points to 118, leaving no early entry. That really ticked me off. The follow through was impressive as the stock closed over 124. Something good may be brewing. (3).
Observation 4: I'm going to zero in on the behavior of the first multiday pullback after this momentum. This will help me judge whether the stock looks like a mere two- to three-day snap back or whether smart buyers are accumulating. Are they going to boom this leader to new highs into expiration. No doubt the January 120 calls were cheap as CTXS tagged par! I'm stalking for signs that the "rally" is impulsive, i.e., meaning a new leg is coming and the reaction is over. What I want to see is more rally than decline in both time and price.
Observation 5: CTXS has a two-period pullback which accomplishes the bullish
7-BELLS SCANSCD-ROM
&BOOKLET

objectives. The stock tags the high at the low bar day while at the same time falling a gap.(5).
Observation 6: This leaves the stock in a "first" 180 position since low as CTXS closed above its 10-day MA. (P.S. I don't ascribe an meaning to the idea that gaps need to be filled, but since many traders and technicians do, I do watch for behavior at gaps. On Wall Street, perception is everything. Reality gets second shrift.
Observation 7: Now CTXS is in the do-or-die position. When CTXS gaps open over 3 points on Jan. 13 (to 124), it looks like all engines are go. It appears poised to challenge prior highs up at 130. However, CTXS fails to maintain traction and closes below the open. This washes out many momentum players including myself. I never take them home if they're against me. Yet, I realize the jury is still out as CTXS may have closed poorly but it was still up on the day. The nature of trends is for stocks to thrust, pause, and pivot back in the direction of the emerging and mature trends. However, it is also the prerogative of stocks to be fickle; it is the nature of the markets not to accommodate -- at least not with immediate gratification. This is the short-term trader's conundrum!
Stocks often stutter, stop and head fake before continuation prevails. Hey, Magic Johnson could fake one way and head the other in a fast break. As you've heard me say before. the second push often offers the better move.
Observation 8: On Friday Jan. 14, the die appears to be cast. CTXS fails to follow through to the downside after Thursday's poor close. Still, I'm wary of another false pop up on the open that could quickly fade. But when CTXS gets through the first hour unscathed and forms a tight band of consolidation, I'm

thinking false moves lead to fast moves (the false move being Jan. 13) ("A" on intraday chart). I am starting to think trend day. I see that if CTXS can break out over what appears to be a double head-and-shoulder it could easily be a big trend day. If CTXS can close at a new high, it may indicate a multiday expansion in range. This is what I call a Magee Squeeze (after technicians Edwards & Magee who came up with the head-and-shoulder pattern). Right shoulders that are broken cook those who short against them. Fast movers come from false patterns. It's what some technicians refer to as "The Hound of the Baskervilles." In the novel, Sherlock Holmes solves a murder when he realized it was an insider job as the hounds didn't bark when the crime was committed. CTXS was beginning to look like an inside job -- a flush out to par pulls the rubber band back significantly to catapult the stock to new highs into options expiration.
Observation 9: As CTXS flatlines, hugging old highs from 10:30 to 12:30 on the morning of Jan. 14, it suggested compression was mounting for an attack to new highs if they come back from lunch in New York and take out the triple intraday tops the stock should explode. Bingo. A run to 136 before profit-taking sets in. Notice that although CTXS does close at a new high, a second late-day violent selloff ("B" on intraday chart) leaves the stock in a 1-2-3-4 pullback on the 10 minute chart but bullishly keeps some sold-out bulls at bay. This is not unusual going into a weekend, especially a long weekend. But the stock is now in a strong position and set up for all those traders and fund managers scouring their charts over the weekend. The rubber band is pulled back short term (intraday) as the stock closes with an expansion breakout buy signal. A great weekly close that will show up on the new high list.
Observation 10: This is why I showed CTXS again on my Monday morning commentary (Jan. 18). The Futures open soft. Thank God. CTXS won't gap open 5 points. The stock opens flat and is very resistant to the market pullback giving up only a few points and showing superior intraday relative strength. As you can see from the intraday chart, the breakout resumes quickly. ("C" on the intraday chart.) Such is the power of first intraday pullbacks on the heels of explosions over high level consolidations.
The explosion occurs in three wide-range 10-minute bars. Once it's over, it's all over but the screaming and shouting. The whole day basically occurs in the first half-hour. This is why it is crucial to be prepared and do your homework. The market won't take any excuses that one of these Hounds of the Baskervilles ate your homework!
Note that when a late-day breakout on Jan 18 ("D" on the intraday chart) failed, CTXS nose-dived when it took out the morning high to the downside (intraday Turtle Soup!). After a first retracement ("E"), CTXS waterfalls when it violates the pullback low ("F").
Conclusion: Markets turn on a dime. Most traders cannot. Therein lies your profit. As I remember reading somewhere once, "Any fool can believe the obvious; it takes a genius to believe a palpable lie."

Jeff Cooper is a full-time professional equities trader. A graduate of New York University, he is also the author of Hit & Run Trading, Hit & Run Trading II, Hit & Run Lessons, and the comprehensive video course, Jeff Cooper on Dominating the Day Trading Market. For information about how to subscribe to Jeff Cooper's nightly newsletter services, go to The Trading Reports.
All original materials: © 2003 Brooke Publishers, Inc.
Comments: [email protected]

20 Golden Rulesfor Traders
Trading Masters NEW TO TRADING & TECHNICAL ANALYSIS?Click Here
WIZARDSTUTORIAL
HomeDaily
CoursesTactics
Resources
YOUR DAILY
MARKETGUIDE
Featuring
InteractiveTradingPicks
PICKS, CHARTS, SCANS, IDEAS &
PROFITSCheck outMORNING TRADER
NOW!
andEVERY MARKET
DAY!
FINDING THE BEST FISH IN THE STOCK OCEANBy Jeff Cooper
Choosing which stocks to trade is as critical to profitable trading as the methodology or strategy you apply or understanding market dynamics.
In my experience, what happens before a trade contributes to success as much as what happens during a trade. Trading success depends as much, if not more, on which stocks you're in as it does on being able to call short-term market direction. Simply, as a short-term trader, I need to be in stocks that are moving. A major reason my Hit-and-Run strategies work is that I use them on the correct stocks.
Below, I'll describe some of the characteristics I look for in stocks. This is how I focus on a relatively small number of names among the thousands of possible stocks to trade.
ABCs Of Stock Selection
I've created an easy-to-remember acronym that will allow you to establish a process for focusing on high-potential stocks.
OCEAN
Each letter stands for a criterion I use in stock selection.
"O" stands for observation. Speculation is largely observation--pure and simple. First, I've observed that higher-priced stocks make larger moves on a daily basis than lower-priced stocks. As a short-term trader, I'm not interested in percentage moves but in point moves. A 5% move in a $100 stock is much bigger than a 10% move in a $22 stock.
POWERFULONLINE
TRADINGCOURSE
FromHARD RIGHT EDGE
YourOriginal Guide
toSuccessful
Short-Term Trading
Highly EffectiveMarket Strategies
and3-D Charting Techniques
GetMore Info

Second, look for situations in which you can put pieces together, whether multiple signals or recognizing how a long-term pattern has combined with a short-term pattern to create a higher-than-average likelihood for trend continuation.
One of the most important criteria in assembling a hit list is to observe which stocks outperform the rest --which stocks have high relative strength over the intermediate term.
Two shorter-term relative strength methods I developed for identifying the right stocks to trade are intra-day relative strength and day-over-day relative strength. For example, stocks in an uptrend that stay strong as the market falls in the morning are excellent long-side candidates when the market stops going down. If market dynamics reverse, the stock may explode. Also, stocks that remain resilient despite a strong overall market decline are interesting long candidates the following day.
Another observation to make is whether a stocks shows persistence or not. A stock closing near the top of its range benefits the short-term trader, as stocks in fast moves tend to close at or near the high (or low, for downtrending stocks) of the day. Also, the propensity of a stock to have periods of great velocity--that is, to move a large distance over a short period of time--is vital. Short-term traders need to be in stocks that have shown they can move--and move big. Ninety percent of the time, I trade in the direction of the trend because surprises happen in the direction of strong underlying trends.
Finally, if a stock consistently trades above its rising 50-day moving average, this is often a good tip-off to a developing strong uptrend.
"C" stands for capitalization. As I mentioned before, I create two hit lists. One is for smaller capitalization stocks that typically have an average daily volume of under 300,000 to 400,000 shares.
Note! When I wrote Hit and Run Trading, I found that stocks that traded with an average daily volume of under 200,000 shares best fit the bill for small-cap stocks; however, as the market has grown and the number of players has expanded, I have noticed that stocks that trade up to 400,000 shares behave similarly to those that trade lighter volume.
These small-cap, less-liquid stocks often make explosive moves, as once an institution makes a commitment to accumulate a position (or exit a position), their presence becomes quite evident on the tape. Once an institution decides to get involved, it's not worth their while unless they accumulate a meaningful position. This means
7-BELLS SCANSCD-ROM
&BOOKLET

size to buy (size bids) on the tape. Stalking small-cap stocks for size bids (and offers) is one of my bread and butter strategies. Size to buy in trending small caps is one of the best trading edges available, but you have to be watching a manageable list of strongly trending names to see what's going on.
"E" stands for expansion of range. Often large moves and new legs begin with an expansion in a stock's daily range, where buyers overwhelm sellers (or vice versa). Further, since the nature of trends is to thrust, pause, and thrust back in the direction of the underlying trend, I'm looking for expansions out of pullbacks or consolidations.
"A" stands for ADX. The Average Directional Movement Index (ADX) is an indicator that measures trend strength (but not direction). Not all trends are created equal. Since the nature of strong trends is to persist, high ADX readings are a valuable tool to help identify which trends may turn into runaways. Pullbacks in runaways usually last no more than a few days. Although those momentum stocks may be very volatile intra-day, for the agile, disciplined trader, this volatility offers opportunity. Since momentum begets momentum, I stalk the highest-momentum names for signs of continuation.
"N"Stands for new highs/new lows. Although many investors are cautious about buying new highs (or shorting new lows), believing the name of the game is to buy low and sell high, momentum players must be willing to buy high and sell higher. A stock must make a new high before a series of new highs is scored. Scanning new multi-month highs and lows will provide many good candidates.
The Process
To find stocks that meet these requirements, I begin by filtering those stocks that have made new 52-week highs (and lows) through my data service, and then I filter those stocks with high ADX readings, and then look for the types of price patterns I've described here (and the others I discuss in my daily "Momentum Stocks Insight" commentary).
Starting out with a sound foundation of stocks to trade is essential to any trading approach. Selecting stocks that meet the criteria outlined above allows you to focus on a small number of high-potential stocks out of the universe of tradable stocks.

Jeff Cooper is a full-time professional equities trader. A graduate of New York University, he is also the author of Hit & Run Trading, Hit & Run Trading II, Hit & Run Lessons, and the comprehensive video course, Jeff Cooper on Dominating the Day Trading Market. For information about how to subscribe to Jeff Cooper's nightly newsletter services, go to The Trading Reports.
All original materials: © 2003 Brooke Publishers, Inc.
Comments: [email protected]

20 Golden Rulesfor Traders
Trading Masters NEW TO TRADING & TECHNICAL ANALYSIS?Click Here
WIZARDSTUTORIAL
HomeDaily
CoursesTactics
Resources
YOUR DAILY
MARKETGUIDE
Featuring
InteractiveTradingPicks
PICKS, CHARTS, SCANS, IDEAS &
PROFITSCheck outMORNING TRADER
NOW!
andEVERY MARKET
DAY!
FEEDING THE DUCKS: COUNTERTREND DAY TRADING When people ask how my day-trading portfolio has had 4-figure percentage returns this year, I tell them about the ducks. You know: When the ducks are quacking, feed the ducks. Likewise, when everyone's buying, sell to them, and when they're selling, buy!
Which is what I did much of July 2002, buying particularly on steep intraday declines, understanding the odds in a market stretched to the downside.
Similarly, as of this writing in late October, with the market short-term overbought -- the Nasdaq 100 up more than 26% off its October 8 low of 795 in less than three weeks -- my tendency has been to short, particularly after opening gap-ups or intraday rallies.
I like the high-volume, high-beta stocks, many of them Nasdaq 100 technology companies like QLogic (QLGC), Brocade (BRCD), and Broadcom (BRCM), stocks that tend to swing more dramatically than the market and thus, when you're calling the intraday tops and bottoms right, give you your highest margin of profit.
Indicators I find useful include the index oscillators, stochastics and intensity-based, momentum indicators like Balance of Power and Money Stream that measure buying and selling pressure. They give me a strong sense of the degree in which individual stocks and the market in general are overbought or oversold. TCNet by Worden Brothers has excellent proprietary momentum indicators I use along with their real-time charts. As I look to play (and counter-play) the trends, I look, of course, for stocks whose chart patterns (1 & 5 minutes) make them most likely to break in the direction I'm anticipating the market going.
See how the red (bearish) bars on the underlying technicals (Balance of Power and Money Stream) signaled Brocade's sell-off on 10/28 on the 5-minute chart below. In addition, the crossover of the 50-day (longer-term) moving average in red up through the 21-day average was a bearish sign.
POWERFULONLINE
TRADINGCOURSE
FromHARD RIGHT EDGE
YourOriginal Guide
toSuccessful
Short-Term Trading
Highly EffectiveMarket Strategies
and3-D Charting Techniques
GetMore Info

I also look at volume levels, as they can indicate the degree to which a market move has broad-based support. The fact that the Nasdaq had lost some volume on some of its upside moves recently indicated to me the rally was losing steam. That and the fact that the 21-day moving average appears poised to cross under the 50-day average on the daily charts, indicative of a trend change.
There are many other tools in my trading kit. I encourage you to watch me trade - live, in real time - on my web site The Technical Trader.
All original materials: © 2003 Brooke Publishers, Inc. and Associated Authors
Comments: [email protected]

20 Golden Rulesfor Traders
Trading Masters NEW TO TRADING & TECHNICAL ANALYSIS?Click Here
WIZARDSTUTORIAL
HomeDaily
CoursesTactics
Resources
YOUR DAILY
MARKETGUIDE
Featuring
InteractiveTradingPicks
PICKS, CHARTS, SCANS, IDEAS &
PROFITSCheck outMORNING TRADER
NOW!
andEVERY MARKET
DAY!
IDENTIFYING MARKET EXTREMES In the first snapback rally at the beginning of August, the S&P 500 and Nasdaq 100 gained more than 25% in a period of just three weeks. That led me to indicate were now in an overbought environment, at least short-term (1 week to 1 month), as the McClellan Oscillator had reached its highest, most overbought reading since October 1998. When the Oscillator reaches extreme readings, it can reflect an overbought (extreme positive reading) or oversold (extreme negative reading) condition, the latter generally in the area of -100 and below. Sure enough we peaked in late August and pulled back. High oscillator readings again in late November preceded the recent sell-off.
The extremeness of that October-November rally was illustrated by the fact that the Nasdaq 100 advanced from under 800 in the beginning of October to the 1155 area at the end of November, a 360-point gain in less than two months, or about 40%. If you draw lines across the lows starting in mid-October and then across the same tops you get a near parallel channel. Channel breaks can also help predict market tops and bottoms. After moving 360 points, the Nasdaq 100 gapped up to the top of that channel and then the next hour came down sharply. In other words, it reached resistance at the top of the channel by gapping up into it, or what we call an exhausting gap, and then the next hour came down sharply, which triggered a sell-off that was followed by 10 days of selling as of the close on Friday, December 13.
Not surprisingly, we had a snapback rally that saw the S&P 500 and Nasdaq 100 gain more than 25% in a period of just three weeks. That led me to indicate were now in an overbought environment, at least short-term (1 week to 1 month), as the McClellan Oscillator reached its highest, most overbought reading since October 1998. When the Oscillator reaches extreme readings, it can reflect an overbought (extreme positive reading) or oversold (extreme negative reading) condition, the latter generally in the area of -100 and below. (View table of McClellan Oscillator data.) Sure enough we peaked in late August and pulled back.
On the rally after the pullback I was looking for the market to at most double-top on the S&P 500 and on the Nasdaq 100, and perhaps not even do that. One of the patterns I noticed in early September was a head-and- shoulder top forming on these indices’ hourly charts. This meant we could top out at the shoulder and not double-top at the head, which is exactly what we did.
POWERFULONLINE
TRADINGCOURSE
FromHARD RIGHT EDGE
YourOriginal Guide
toSuccessful
Short-Term Trading
Highly EffectiveMarket Strategies
and3-D Charting Techniques
GetMore Info

The Nasdaq 100 broke the bottom of that channel and then on three different occasions over the next two days got right up to that line. It also got up to the declining 40-day moving average and to the mid-channel resistance, all three basically converging at one point, and then failed on Thursday December 12. On Friday it gapped down and followed through to the downside to make a new low for the move, and also broke short-term support in the 1020-25. That led me to believe we might go down to test the double-bottom we had at the end of October and mid-November at around 970-75 in the ensuing few days.
These are some of the ways I gauge market extremes. This assists me in timing investments, particularly in my Intermediate-term Model Portfolio, which is up more than 50% since July. Certainly, good stock picking is key, but gauging turns in intermediate-term market trends can minimize draw-downs and accelerate returns.
All original materials: © 2003 Brooke Publishers, Inc. and Associated Authors
Comments: [email protected]

20 Golden Rulesfor Traders
Trading Masters NEW TO TRADING & TECHNICAL ANALYSIS?Click Here
WIZARDSTUTORIAL
HomeDaily
CoursesTactics
Resources
YOUR DAILY
MARKETGUIDE
Featuring
InteractiveTradingPicks
PICKS, CHARTS, SCANS, IDEAS &
PROFITSCheck outMORNING TRADER
NOW!
andEVERY MARKET
DAY!
BASING PATTERNS In today's volatile bear-market environment everybody wants to know if the market will continue lower, or if it will base, or if it will snapback, and, if it does snapback, how far? My answer to these questions: I don't know. Moreover, I care only to a limited degree.
As a technician I certainly try to analyze and anticipate the market moves, but I am most concerned, when it comes to intermediate-term holdings, with individual chart patterns. Especially at a time when the market is as volatile as it is and being whipsawed by news headlines, I look for individual stocks that have promising patterns, stocks that have the best chance of weathering a market sell-off and having strong up-moves when the market does turn.
How do I find them? I look for charts first and foremost with long base patterns (using daily and weekly time intervals), stocks that have dropped significantly but that have had six months to as much as two years to level off. It's the old adage: You can't catch a falling knife. Once a stock has bottomed and is basing for a time, however, then it has the potential to come back up.
But not always, of course. Typically, during the basing period a stock will try to break out and fail several times. The failure points become resistance levels. I look for stocks that have broken out above these resistance points and done so on high volume.
Let me use the example of Neoware (NWRE) to illustrate this basing and breakout phenomenon. After declining about 90% from its bull-market high around 10 to about 1, Neoware based out for a couple years
POWERFULONLINE
TRADINGCOURSE
FromHARD RIGHT EDGE
YourOriginal Guide
toSuccessful
Short-Term Trading
Highly EffectiveMarket Strategies
and3-D Charting Techniques
GetMore Info

and broke out in December 2001 on big volume. Once previous resistance around 2.25-.50 was broken on volume, the stock was off to the races on a bullish trend.
We named Neoware one of our top Charts of the Week back in February at around $7 even though it had gained so much so fast because the up-channel after the long period of basing appeared strongly intact. Also, as you can't see from the chart, the stock had previous highs of around 10 established in 1996, 1997, and again 2000 that it looked destined to approach. It bounced around and slightly above 10 several times in the March-April period and once more in May and after breaking through it again in June it hasn't looked back.
All of this in a market that has been abysmal, which helps explain why I care more about, and can better forecast, individual chart patterns than I can the market.
All original materials: © 2003 Brooke Publishers, Inc. and Associated Authors
Comments: [email protected]

20 Golden Rulesfor Traders
Trading Masters NEW TO TRADING & TECHNICAL ANALYSIS?Click Here
WIZARDSTUTORIAL
HomeDaily
CoursesTactics
Resources
YOUR DAILY
MARKETGUIDE
Featuring
InteractiveTradingPicks
PICKS, CHARTS, SCANS, IDEAS &
PROFITSCheck outMORNING TRADER
NOW!
andEVERY MARKET
DAY!
REVIEWING THE ART OF SHORT SELLING
By Mark Boucher
I know from experience and from reviewing many of the questions I get from TradingMarkets.com subscribers that many of you following my commentary and techniques have not been using our short-sale criteria diligently or properly. Investors should realize that so far this year our short-hedges have contributed half of our total profit -- and if we get new lows in the Nasdaq, Dow and S&P, I would expect shorts to make up the vast majority of our profits this year. For this reason, I want to review the criteria listed in my book with regards to short sales. I also want to cover how we adjust this strategy if a real bear market appears so that TradingMarkets.com subscribers are ready and able to pounce on the fast profits that shorts in a bear market can create.
Each week I comment on all stocks that meet our upfuel criteria and have broken out of valid 4+ week flags or cup-and-handles, as well as all stock that meet our downfuel criteria and have broken down out of valid 4+ week down-flags and down cup-and-handles. Let's review those criteria, which we use in all market environments. If you also need to review how we use breakouts to determine exact entry and exit, please review my 10-week trading course, free and available to all TradingMarkets.com subscribers. You may also want to review my book or Science of Trading courses, available via M. Gordon Publishing through TradingMarkets.com, to become more expert at implementing this strategy.
Criteria for finding short-sales with minimum downfuel:
POWERFULONLINE
TRADINGCOURSE
FromHARD RIGHT EDGE
YourOriginal Guide
toSuccessful
Short-Term Trading
Highly EffectiveMarket Strategies
and3-D Charting Techniques
GetMore Info

Powerful Tools
for Traders
Complete 7-Bells Scansand More
Info
1. Earnings:
Either: (a) a decline in annual earnings and an estimate of either an annual loss or another decline in annual earnings, plus two down quarterly earnings or two negative quarterly earnings;or
(b) two quarterly earnings down 40% or more, or two negative quarterly earnings with acceleration in the decline; finally if either criteria "a" or "b" are met, the stock remains a short-sale candidate from an earnings criteria standpoint as long as quarterly earnings continue to be lower than year earlier quarters or continue negative. (For maximum fuel, either the above are met or a stock has two quarters in a row of declining earnings and declining sales, and a price/sales ratio (P/S) >10 and PE>S&P's PE.)
2. Runaway technical market characteristics down are displayed on the daily or weekly chart.
3. EPS and RS rank both < 50.
4. Yield 5% or <. (For maximum fuel must = 0.)
5. Debt -- must have some, the more the better, over 100% ideal.(Max. Fuel >99.)
6. Funds -- must have some institutional ownership, >30% is optimum. (Max. Fuel >20.)
7. The worst or second-to-worst rating by Value Line, Zachs, or Lowry's rating services.
8. (Max. fuel only -- must be a clear bear market in stocks if stock is related to market -- according to Chartist, BCA, bond/bill/index rules, or PSL systems.)
9.(Max. fuel only -- forming or formed weekly or monthly pattern of Double Top, failed rally, or Head-and-Shoulders Top and P/S > 10.)
This allows us considerably more flexibility to adjust our portfolio to the U.S. market. We can create a fully hedged fund -- or adjust our short positions to offset as much of our long U.S. exposure as the market environment dictates. As Julian Robertson said, "Our goal is to own the best companies and be short the worst companies."
Over the last decade, our short criteria have helped us to:
HRE SPOTLIGHT
TechnicalAnalysisMasters
Jeff Cooper
1) determine when the U.S. market is starting to weaken as these stocks usually begin to accelerate down just before a broad market;
2) effectively hedge a broad decline as these stocks tend to under-perform our longs and the market during corrections in particular;
3) profit from a bear market, rather than be chewed up by it;
4) clean-up from a two-way market environment where some stocks are still moving up or down and others are moving consistently in the opposite direction, as usually develops during transition periods when the major trend is changing; and
5) get advance notice of when serious changes in the market are occurring (as we were able to take 1/3 profits on everything in early March of this year) because we're watching the action of both the weakest and strongest stocks in terms of their respective trends.
Thus, while we do not recommend a fully hedged portfolio at all times, we do recommend covering part or all of your long exposure via shorts during times when the interest-rate environment is neutral - negative, when the U.S. technicals are poor, or when overvaluation is extreme enough that systemic market risk is unusually high, but an all-out bearish signal has not yet been given. Only when the U.S. and most global markets have generated universal bearish signals, would we become net short as part of our allocation strategy.
Like our longs, investors should use flag-down breakdowns of 4 weeks or more and valid cup-and-handle down breakdowns of 4 weeks or more as signals of when and where to short stocks meeting the above criteria. As you get more proficient at locating stocks that meet this criteria and then looking only for trades in stocks meeting these criteria and also breakdown out of valid patterns, you can refer to my weekly commentary to confirm that we're finding exactly the same stocks and that you're following the technique properly. In fact, that's what my weekly commentary is for -- it's designed to help those trying to utilize this specific technique to trade the markets. Many investors at first had questions as to why a stock they thought met the criteria wasn't included -- but as I've answered these questions over time most investors following this technique for many months studiously now understand that I am commenting on absolutely every stock that meets these rigid criteria and that an investor working hard on following this technique can have very nearly identical results as the ones reported in my weekly column.Over the first year-and-a-quarter or so, most criticism and commentary have come from traders who have not thoroughly studied my courses and

this technique. So far, at least, I have not yet heard from or met a trader who has tried diligently to follow this methodology religiously who has not been very happy with his/her trading results.
We basically exit short stocks on:
1) Positive turnaround in earnings;
2) whenever their PE gets below their expected growth rate;
3) whenever they violate their 200 MA by 10% or more;
4) take half profits on 40% decline from entry and then begin using any high with six lower highs surrounding it as trailing stop;
5) on every new low use ops above correction high as trailing stop;
6) exit if Relative Strength rank or EPS rank ever move above 50 from below it;
7) on any weekly chart double bottom or head-and-shoulders bottom;
8) whenever the stock reacts positively to what should clearly be negative news, or on positive reaction to restructuring or new management.
Although the odds are now tilting toward the current (5/00) environment being a bear market, I am not solidly convinced that we are there yet. It would take new closing lows in the Nasdaq, S&P and Dow below their respective February-March lows before I will be fully convinced that we are in another leg down of an ongoing bear market. I would also like to see at least a week of consistent 20+ number of stocks on our Bottom RS/EPS New Lows list, and a much higher concentration of valid breakdowns in stocks on these new lows list. Similarly, I would like to see a large concentration of specific industries dominate the new lows lists. If we get all these factors coming together, than for the first time since 1994, investors will need to look for and allocate more capital to short selling.
The above "downfuel" criteria for finding short-hedges is valid in a bear market, as in a bull or sideways one. However, to maximize profit in a bear market (assuming all of the bear market factors mentioned above come to pass), traders should also look for major topping patterns in former leaders running out of gas, for about half of their short-sale exposure. As we get more of these patterns and more of our typical short-hedge exposure, investors should add about 7% of capital per new short trade and stop at about 24 positions. You

basically let the market determine the number of shorts and longs by how many valid breakouts or breakdowns you get. Hold back on adding more than two new positions short or two new positions long in any one week. Theoretically, you could get to be 200% long or 200% short in an extremely strong or weak market. To find former leaders running out of bas, get our your Daily Graphs booklets or look at a huge number of stocks on a weekly-chart basis. Screen for stocks that are forming six month+ topping patterns such as Double Tops, Triple Tops, and Head-and-Shoulders Tops over a very long period of time. From this list of potential topping pattern stocks, look for over-valued equities with a P/S > 3 (ideally >10) and with a P/E much greater than the last year's earnings growth and much greater than the next year's projected earnings growth. Next, from this smaller list of potential shorts, look for stocks where earnings growth rates are slowing down. The big money is made shorting major chart breakdowns in stocks where expectations have been out of line with reality, that are starting to disappoint investors that held those out-of-line expectations. Only look for these stocks when you are very sure that we're in a bear market. We'll try to point out some such issues as examples, should we become convinced that a real bear market is in progress, in our weekly commentary in the weeks and months ahead.
Most traders have only looked at our long-side upfuel criteria and buy rules. Now is the time to review our short-hedge strategies and our aggressive short rules for bear markets. By using these strategies along with our long-side rules, investors can achieve smoother long-term returns, higher long-term gains, and more consistent profits in their stock trading accounts.
More Insightful articles at:
All original materials: © 2003 Brooke Publishers, Inc.
Comments: [email protected]

20 Golden Rulesfor Traders
Trading Masters NEW TO TRADING & TECHNICAL ANALYSIS?Click Here
WIZARDSTUTORIAL
HomeDaily
CoursesTactics
Resources
YOUR DAILY
MARKETGUIDE
Featuring
InteractiveTradingPicks
PICKS, CHARTS, SCANS, IDEAS &
PROFITSCheck outMORNING TRADER
NOW!
andEVERY MARKET
DAY!
Powerful Tools
for Traders
Complete 7-Bells Scansand More
Info
TRAILING STOP TECHNIQUES
By Mark Boucher
Most investors and traders spend far too much time focusing on how to enter a stock and far too little time focusing on how to best exit a profitable position. What is particularly interesting regarding this neglect is that most traders make the vast majority of their profits in a year from just one to five trades that move substantially in their favor. Thus most traders would actually do better to focus in on how to better exit heavily profitable trades than they would to further refine their entry techniques. I would like to briefly go over some of our best "trailing stop" techniques to help traders learn how to exit profitable trades much more profitably. We use a number of trailing stop techniques, but the simple rules of thumb we present here should greatly enhance the trading of most investors.
PATIENT INITIALLY, CAUTIOUS WHEN PRICEY
The method we're going to briefly cover is used before a stock becomes overvalued:
-- waiting for the breakout of a three- to four-week or longer consolidation
-- putting stops below the low of that consolidation after you've just entered a stock (as long as it is not becoming overpriced on a price/earnings basis)
This requires patience for the first quarter of a move after you've entered a stock (first 50 or so bars after a trade on any timeframe). However, when a stock starts to get a PE ratio that is both higher than its historical high PE and above its forward one-to-three year growth rate projected by Wall Street analysts, then it is potentially becoming overvalued, and investors should tighten up trailing stops much more aggressively.
Once a stock becomes overvalued, it is generally in a blow-off. A blow-off can last from weeks to months, and occasionally years - so the trick is to stick with a stock for as long as it is likely to continue running up, no matter how high the price and PE. This is the essence of attempting to let profits run. Thus,when a stock rises to a PE ratio that is both higher than its historical high PE and above its projected (by consensus analysts) growth rate for the next one to three years, we use a different technique than the one we used before the stock becomes overvalued. When a stock becomes overvalued, we watch for any decline in the close for two days in a row. Once we have a two-day in a row decline in the close, we consider that stock to be in a "reaction". Once a stock is in a reaction, we wait for it to recover to new highs. On any new high following a reaction, we will then move our trailing stop to the low of that reaction -- and we'll keep moving it up in this manner on every reaction and subsequent new high. In this way we are still waiting for a fairly significant support point to be broken on the downside before exiting a stock, but we are moving our stops up much more aggressively than is the case prior to the stock becoming overvalued.
Real World Examples
POWERFULONLINE
TRADINGCOURSE
FromHARD RIGHT EDGE
YourOriginal Guide
toSuccessful
Short-Term Trading
Highly EffectiveMarket Strategies
and3-D Charting Techniques
GetMore Info
HRE SPOTLIGHT
TechnicalAnalysisMasters
Jeff Cooper
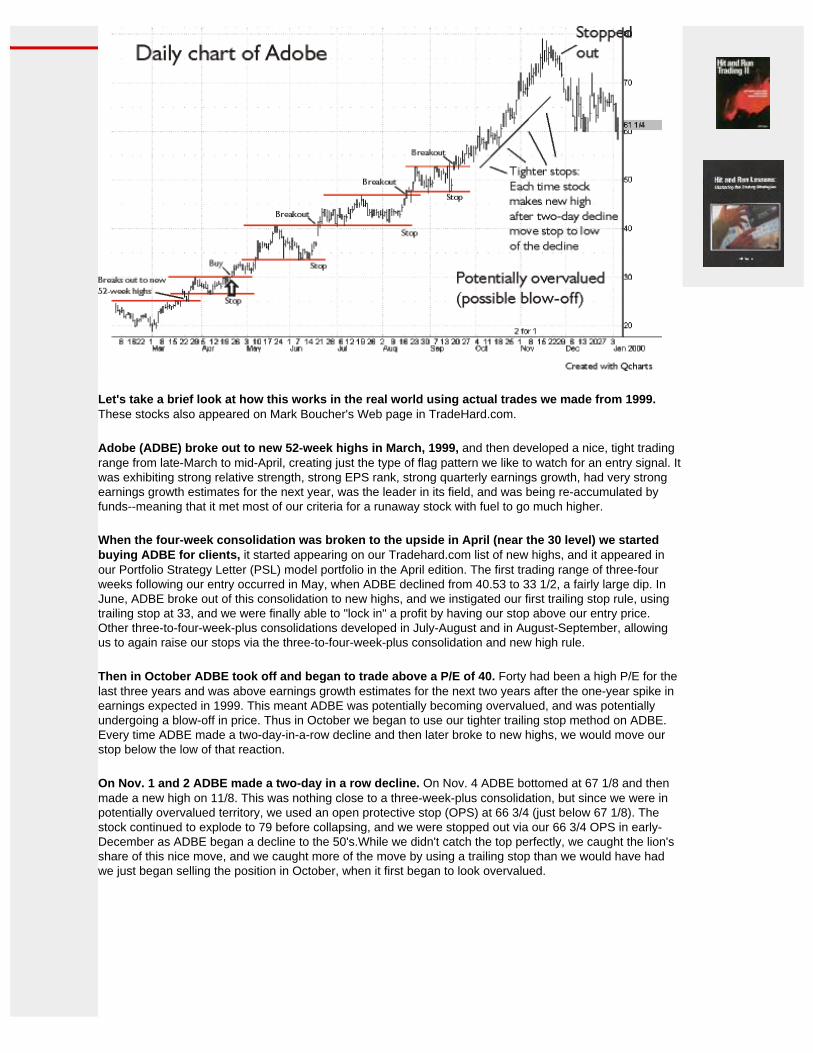
Let's take a brief look at how this works in the real world using actual trades we made from 1999. These stocks also appeared on Mark Boucher's Web page in TradeHard.com.
Adobe (ADBE) broke out to new 52-week highs in March, 1999, and then developed a nice, tight trading range from late-March to mid-April, creating just the type of flag pattern we like to watch for an entry signal. It was exhibiting strong relative strength, strong EPS rank, strong quarterly earnings growth, had very strong earnings growth estimates for the next year, was the leader in its field, and was being re-accumulated by funds--meaning that it met most of our criteria for a runaway stock with fuel to go much higher.
When the four-week consolidation was broken to the upside in April (near the 30 level) we started buying ADBE for clients, it started appearing on our Tradehard.com list of new highs, and it appeared in our Portfolio Strategy Letter (PSL) model portfolio in the April edition. The first trading range of three-four weeks following our entry occurred in May, when ADBE declined from 40.53 to 33 1/2, a fairly large dip. In June, ADBE broke out of this consolidation to new highs, and we instigated our first trailing stop rule, using trailing stop at 33, and we were finally able to "lock in" a profit by having our stop above our entry price. Other three-to-four-week-plus consolidations developed in July-August and in August-September, allowing us to again raise our stops via the three-to-four-week-plus consolidation and new high rule.
Then in October ADBE took off and began to trade above a P/E of 40. Forty had been a high P/E for the last three years and was above earnings growth estimates for the next two years after the one-year spike in earnings expected in 1999. This meant ADBE was potentially becoming overvalued, and was potentially undergoing a blow-off in price. Thus in October we began to use our tighter trailing stop method on ADBE. Every time ADBE made a two-day-in-a-row decline and then later broke to new highs, we would move our stop below the low of that reaction.
On Nov. 1 and 2 ADBE made a two-day in a row decline. On Nov. 4 ADBE bottomed at 67 1/8 and then made a new high on 11/8. This was nothing close to a three-week-plus consolidation, but since we were in potentially overvalued territory, we used an open protective stop (OPS) at 66 3/4 (just below 67 1/8). The stock continued to explode to 79 before collapsing, and we were stopped out via our 66 3/4 OPS in early-December as ADBE began a decline to the 50's.While we didn't catch the top perfectly, we caught the lion's share of this nice move, and we caught more of the move by using a trailing stop than we would have had we just began selling the position in October, when it first began to look overvalued.

Our final example is a foreign stock traded on the NASDAQ, Business Objects (BOBJ). In mid-June, BOBJ broke out of a two-month consolidation on the upside on a high-volume thrust and lap. It showed strong RS, exploding earnings growth, increasing-but-low ownership by funds, and other elements of our runaway criteria. We began buying BOBJ near the 30 level, and put it into our PSL model portfolio in June. BOBJ made a new high in July, corrected to the 37 level, and then consolidated for two months before making a new 52-week high again - which allowed us to move our trailing stops to just below 37 where we locked in a profit via our trailing stops.
BOBJ took off on a runaway up-move, and in November it moved above a P/E of 90 (its projected earnings growth for the next year and a historic PE high). Thus in November we switched to our tighter trailing stop technique. On 1/6/00 BOBJ hit our stop at 115, below the Dec. 14, 1999 lows, and we took some very healthy profits.
In Conclusion
Remember no trailing stop technique is perfect. Trailing stops will often take you out of a stock that ends up moving further in the desired direction. But even more often, the trailing stop will prevent you from letting your open profits erode substantially in a stock that has peaked for a considerable period of time. You can always re-enter a stock if it meets your criteria on a new breakout. Trailing stops therefore not only help you to let your profits run and prevent you from giving back huge portions of open profit, but they also help you to focus your trading capital on vehicles that are moving up strongly, right now, and exit those that are in prolonged corrections.
More Insightful articles at:
All original materials: © 2003 Brooke Publishers, Inc.
Comments: [email protected]

20 Golden Rulesfor Traders
Trading Masters NEW TO TRADING & TECHNICAL ANALYSIS?Click Here
WIZARDSTUTORIAL
HomeDaily
CoursesTactics
Resources
YOUR DAILY
MARKETGUIDE
Featuring
InteractiveTradingPicks
PICKS, CHARTS, SCANS, IDEAS &
PROFITSCheck outMORNING TRADER
NOW!
andEVERY MARKET
DAY!
30-MINUTE BREAKOUT When trading the same vehicle day in and day out it is good to keep your setups consistent. For trading the QQQ I have only about 4 valid setups that I look for on an intraday basis. The 30-minute breakout trade is my bread and butter and generally the first trade of the day for me. Below is an explanation of this trade and how I use this range to generate a trade signal.
This setup relies on the high and low of the first 30 minutes of trading. This is a very high volume time of the day and the highs and lows made during this period have significance, in that a breakout occurs, once these levels are violated for the first time no matter what time of day it occurs.
This early 30 minute range is something we watch for the duration of the day and a trade is triggered on the first break of the high and/or low. The question that follows the break of this range is, do you play for continuation of the break or a reversal following the break? This means, once the break of this range occurs will you look to enter in the direction of the break, or wait for a chance to play the reversal of the break.
This is determined prior to the break occurring so you know what to look for once the break triggers. It is important to identify several things prior to the breakout to alert to whether you should play for continuation or reversal. There are several steps to identifying and playing this setup and I will list and discuss them.
Identifying the breakout- Things to look for prior to the break of the range:
● Prior days action, last 90 minutes of the day - If you notice a lot of consolidation in the final 60-90 minutes of the prior day be more apt to look for a continuation upon range break.
● Width of 30 minute range - If you see a wide range bar as the first 30-minute bar, which is larger than the average of prior 5-10 days then be on alert for possible reversal play and a narrow range bar will suggest likelihood of a continuation.
● Location of moving averages - Look for location of the 20 period ma's on 15,30 and 60 minute charts, if they are above the high or below the low be on alert for possible reversals if high is broken under major ma for example.
What you really want to see is a group of clear signals when taking this trade. A narrow early range, consolidation from prior days 14:30-16:00 period, and no moving averages in the way of a continuation move. If you get 2 out of 3 that is usually fine and when no clear signal is present a reversal of the break is more likely.
Now that we have discussed what to look for we can move on to how to play the trade.
Continuation - How to play for continuation on break of 30-minute range:
● Entry is taken above the high for longs and below the low for short entries. The stop should be at the other end of the range meaning to stop out a break of the other end of the range must occur. If this is too wide for your taste, you may move down 1 timeframe and make your stop at the low of the prior bar on the 15-minute chart for longs and above the prior 15-minute bar for shorts. If this were still too wide for you I would advise passing on the trade, altering the stops arbitrarily would affect the outcome.
● Once you have entered on the break, the target for the trade is approximately the same distance as the stop, to as much as 1.5 X the stop. If the range of the 30-minute bar was .20, then your target should be .20-.30 from entry. You can also use a trailing stop by moving your stop with the 15 minute bars and using a pivot to exit, I would only do this once the trade has gone at least .10 in your favor.
POWERFULONLINE
TRADINGCOURSE
FromHARD RIGHT EDGE
YourOriginal Guide
toSuccessful
Short-Term Trading
Highly EffectiveMarket Strategies
and3-D Charting Techniques
GetMore Info

Only move the stop to breakeven once the trade has gone in your favor at least 75% of the established target. If looking for .20 target, then move stop to B/E once it has traveled .15 for example. ( targets and stops based on 2002 average moves )
How to play the reversal - When to enter and exit on playing the reversal of the 30-minute breakout:
As discussed above, you would like to see clear signals when taking the trade in the direction of the breakout, but when little or no clear signals are present I look to play for a reversal of the breakout. Whether the early range is too wide, a strong move occurred into the close the prior day, or there are moving averages in the way, a reversal will not give you as much profit as a continuation most times, but is a very easy trade to enter and the stop will be very clear as well as profit target achievable. Below is a list of how to play the reversal.
● Wait for the 30-minute range to be established - Make sure the signal is as unclear as possible for chance of continuation ( signals discussed above )of the break because you are basically betting the continuation will fail.
● The 30-minute range needs to break by at least .05 for the reversal to become viable. If the range is 24.25 - 24.55 then you want the price to print above 24.59 to begin looking for a reversal.
● The entry is taken on the first 5-minute pivot following the break of the range. For a short, I am looking for a break of the low of the prior bar on the 5-minute chart ( a pivot ) to enter short, and will place a stop over the high of the day, vice versa for a long.
● The target is generally 1/2 of the move prior to the reversal, meaning look at the move that has occurred prior to the reversal setting up. You can look for a larger move by trailing the stop with the 15-minute chart using a pivot ( break of prior bar ) for exit.
This is generally my first trade the day and should be held for either stop or target and a typical holding period may last from 10 minutes to 2 hours.
Often time's news may affect this play, as it will cause the break of the range to occur. In this case, either pass on the trade or extend the range period to 35 minutes and make the break occur of the range created for at least 5 minutes after the news occurred. Best bet is pass on the trade.
A wide range bar in the first 30 minutes may also be the result of a possible trend day to come. Before playing for the reversal when this is your main factor please look at the daily chart and see if a trend day is likely. For example, the day after a NR7, or inside day. Also, look for a possible daily breakout from the day before that may encourage a trend day. Just something extra to be on alert for.
One final note on this play. Some days there will be two breaks of this range, meaning that early in the morning the high of the range may be violated while late in the day a move to the lows may cause a break of the low of this range to occur. In this case you would play the break of the low the same way you played the break of the high. If it was played as a reversal then play the low the same way. When the break occurs does not matter as far as time of the day. I would avoid breaks that occur after 15:30, as it does not allow enough time for the trade to play out.
Below is a picture of a reversal entry.

Below is a picture of a continuation entry.
You will notice the above charts are of the NQ or Nasdaq 100 e-mini futures. These setups are mirrored for that vehicle as it tracks the NDX 100 the same way as the QQQ.
If you use this instrument instead of the QQQ you can substitute .05 for 2 NQ points in the above setups.

This means where a .20 target is used you may substitute an 8 point NQ target. The charts are also in 5-minute intervals instead of 30 minute to illustrate the activity at time of setup.
All original materials: © 2003 Brooke Publishers, Inc. and Associated Authors
Comments: [email protected]

20 Golden Rulesfor Traders
Trading Masters NEW TO TRADING & TECHNICAL ANALYSIS?Click Here
WIZARDSTUTORIAL
HomeDaily
CoursesTactics
Resources
YOUR DAILY
MARKETGUIDE
Featuring
InteractiveTradingPicks
PICKS, CHARTS, SCANS, IDEAS &
PROFITSCheck outMORNING TRADER
NOW!
andEVERY MARKET
DAY!
EXIT STRATEGIES Many people speak and teach how and when to enter a trade, but few explain the art of the exit. This is an area that I set out to focus on for some time, and in doing so, was able to come up with several strategies to exit a trade that also fit my risk/reward profile as well as, were able to take advantage of intra-day trend moves.
To perform consistently when trading intra-day I formulated several exit strategies to fit my overall style of trading. Below I will detail a couple of them in order to convey the importance of having an exit strategy that fits your overall style of trading.
Target As A Function Of Risk
One of the most common exit strategies I employ allows me to look for a target based on the risk taken at time of entry. This strategy allows me to have a target in mind upon entry and takes much of the guesswork out of looking for that all-important exit.
This insures that my risk/reward profile is in place. I will pass on an entry when the expected target looks unattainable. It is my contention that the market sends signals, and when it displays a trade that has unfavorable odds of achieving a target, I will most often skip that trade and move on because the market is telling me "wait for a better trade ".
This also allows me to look ahead and see where the trade will need to travel to obtain my expectation. Will it need to break another support/resistance level? Where should I expect some "wiggle"? Are moving averages going to affect this target being reached? These are just a few of the questions I look to answer prior to entry to make sure I am taking only the best trades possible.
Pivoting Out
This exit strategy is one that I employ when looking to ride a move as far as possible. Best used at points of reversal or strong breakout levels, this exit allows me to stay in a trade as long as it is moving positively within my desired timeframe.
A pivot is a short term directional change denoted by the breaking of a prior bars low in an uptrend, or a prior bars high in a downtrend. Using this exit strategy will allow you to ride a specific move as far as momentum allows and is generally better on timeframes of 15 or 30 minutes intra-day.
Pivoting out also takes the guesswork out of exiting, as you are simply looking for the short-term directional change to occur to promote the exiting of a position. For example if short off of a major resistance level I will often wait for the 15-minute chart to show a pivot prior to exiting the position. This allows for me to ride the gain to maximum level for my trading style. Generally the rule to use is to look one timeframe lower than entry. If I took a trade off of a 30-minute chart I will then use a pivot on the 15-minute for exit. Many traders don't switch timeframes while in a trade but I find that it offers a much clearer picture for intra-day trading.
Below is an example of pivoting out. First the entry, taken below Inside Range Bar.
POWERFULONLINE
TRADINGCOURSE
FromHARD RIGHT EDGE
YourOriginal Guide
toSuccessful
Short-Term Trading
Highly EffectiveMarket Strategies
and3-D Charting Techniques
GetMore Info

Now below is the exit using the "pivot out" approach on the 30-minute chart based on entry taken from the above 60-minute chart.
In the above examples you can see from first chart, entry is taken when the inside range bar is broken to the downside. Then, using the pivot out approach, one would exit when the first pivot occurs on the 30-minute chart.

Exiting Into Expansion
Exiting into expansion is a way to exit when things are going in your favor in a dramatic fashion. This is the method of choice generally late in a short-term trend when things are likely to "blow off ". This exit works best in late trend breakouts from contraction. In other words, when price contracts and then breaks out of the contracted range, slow movement occurs at first, this often turns into a euphoric move that is best exited into, as opposed to being held for further development.
When exiting a trade into an expansion move there are a few things to look for. First, look for an expansion bar that will generally be more than twice as wide as any of the preceding bars in the most recent sequence. Second, look for a sudden increase in volume. Third, begin to look ahead for possible support/resistance level that the bar may expand into. Having a target in mind will often aid in your decision on where to exit.
Exit can be taken in two places using this method. First target for exit is the targeted support/resistance zone that is to be looked for once the range begins to expand. The second area for exit is upon completion of the bar. For example a 30-minute expansion bar closes on the ½ hour. Using one of these two areas for exit using the expansion approach will often allow you to exit a trade at an extreme top or bottom.
Below is an example of an expansion bar exit. Entry is taken once range is cleared, then exit is taken into wide range bar.
The three exit strategies outlined above are the three ways I will generally look exit a position. These are all meant for intra-day trading but also offer some techniques that can be used on much wider timeframes.
All original materials: © 2003 Brooke Publishers, Inc. and Associated Authors
Comments: [email protected]

20 Golden Rulesfor Traders
Trading Masters NEW TO TRADING & TECHNICAL ANALYSIS?Click Here
WIZARDSTUTORIAL
HomeDaily
CoursesTactics
Resources
YOUR DAILY
MARKETGUIDE
Featuring
InteractiveTradingPicks
PICKS, CHARTS, SCANS, IDEAS &
PROFITSCheck outMORNING TRADER
NOW!
andEVERY MARKET
DAY!
Powerful Tools
for Traders
INTRODUCTION TO VOLATILITY
By David Landry
Traders are never far from the concept of volatility--either in the markets or on the news. We hear about it all the time: Day traders are advised that volatility is their best friend when it comes to intraday trading opportunities, while long-term investors are forever warned to hold tight and weather the most recent period of volatility until things settle down again. It's no wonder many traders have trouble understanding what volatility really means and how it affects their trading.
To better understand this crucial aspect of trading, first we will look at what volatility represents, its inherent features and a simple way of measuring it. We'll also look at general ways of applying these concepts to the markets. In future articles, we’ll look at more complex volatility measurements and more specific trading techniques.
A Simple Concept
From a mathematical standpoint, volatility is one of the more complex market concepts--but that doesn’t mean it has to be difficult to understand in practical trading terms. Volatility is simply how much prices change over a given period of time. For instance, if the Dow Jones Industrial Average goes up 10 points one day and down 10 points the next you would probably say volatility is low. However, if it goes up 200 points one day and down 200 points the next, then you'd probably say the market is volatile.
In the most basic sense, that's really all there is to it. The more complex stuff has to do with measuring volatility consistently, tracking its behavior, and taking advantage of its characteristics.
Volatility Characteristics
Volatility has certain inherent features: cyclicity, persistency and mean reversion. Although they might initially sound intimidating, again, the concepts are actually quite simple.
Volatility is cyclical: Volatility tends to run in cycles, increasing and peaking out, then
POWERFULONLINE
TRADINGCOURSE
FromHARD RIGHT EDGE
YourOriginal Guide
toSuccessful
Short-Term Trading
Highly EffectiveMarket Strategies
and3-D Charting Techniques
GetMore Info

Complete 7-Bells Scansand More
Info
decreasing until it bottoms out and begins the process all over again. Many traders believe volatility is more predictable than price (because of this cyclical characteristic) and have developed models to capitalize on this phenomena.
Volatility is persistent: Persistency is simply the ability of volatility to follow through from one day to the next, suggesting the volatility that exists today will likely to exist tomorrow. That is, if the market is highly volatile today, it will most likely be volatile tomorrow; conversely, if the market not volatile today it will likely not be volatile tomorrow. By the same token, if volatility is increasing today, it will likely continue to increase tomorrow, and if volatility is decreasing today, it will likely continue to decrease tomorrow.
Volatility tends to revert to the mean: Someone once asked me to describe reversion to the mean (average) in as simple terms as possible. My reply was if you know someone who’s normally “mean” and then their nice to you for a few days, chances are they’ll revert back to being mean.
Seriously, this concept simply means that volatility has a tendency to revert back to more average or normal levels when it reaches a high or low extreme. Once a market hits an extreme high in volatility, it will likely revert back to the mean--that is, volatility will fall back to more normal or average levels. Conversely, once volatility hits an extremely low level, it will likely rise to more normal (or average) levels. It’s like a rubber band: when stretched so far, it tends to snap back.
Figure 1. Volatility characteristics
The above concepts are illustrated in Figure 1. Notice the cyclical characteristic of volatility. It tends to oscillate back and forth between periods of low volatility and periods of high volatility. It tends to persist (follow through). Days of increasing volatility (a) tend to be followed by days of increasing volatility (b). Conversely, days of decreasing volatility (c) tend to be followed by days of decreasing volatility (d). Finally, it tends to revert back to its mean--that is, periods of extremely high volatility (e) tend to be
HRE SPOTLIGHT
TechnicalAnalysisMasters
Jeff Cooper

followed by moves to more normal or average levels (f). Conversely, periods of extremely low volatility (g) tend to be followed by periods of more normal or average volatility (h).
Measuring Volatility
Because this is a an introductory article on volatility, we’ll show a simple way to measure it. One of the easiest ways is to take the average range (high – low) over a given period. The number of days (or hours, or weeks, etc.) you use in your calculation will give you a picture of the volatility over that time period. A five-day average range calculation will give you an idea of how volatile the market has been the past week, but it won't tell you anything about the past six months. A 100-day average range calculation would reflect volatility over a much longer period.
Figure 2. True range.
Because more volatile markets often gap higher or lower overnight, the true range, developed by Welles Wilder, provides a more accurate measurement of volatility because it accounts for overnight gaps in its calculation. This concept is illustrated in Figure 2. Because the range for only one day doesn’t provide much information, the true range can be averaged over a period of time (say two weeks). This average true range gives you a better feel for volatility over time.
True range is the largest value (in absolute terms) of:
1. today’s high and today’s low 2. today’s high and yesterday’s close 3. today’s low and yesterday’s close
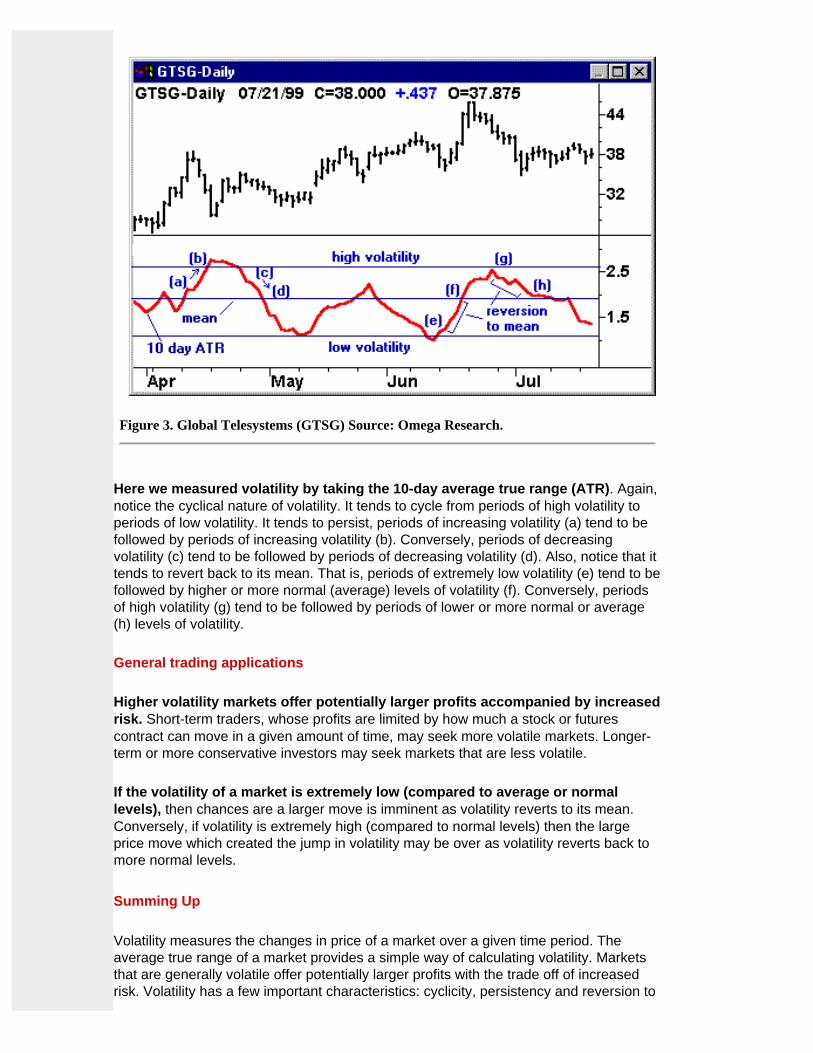
Figure 3. Global Telesystems (GTSG) Source: Omega Research.
Here we measured volatility by taking the 10-day average true range (ATR). Again, notice the cyclical nature of volatility. It tends to cycle from periods of high volatility to periods of low volatility. It tends to persist, periods of increasing volatility (a) tend to be followed by periods of increasing volatility (b). Conversely, periods of decreasing volatility (c) tend to be followed by periods of decreasing volatility (d). Also, notice that it tends to revert back to its mean. That is, periods of extremely low volatility (e) tend to be followed by higher or more normal (average) levels of volatility (f). Conversely, periods of high volatility (g) tend to be followed by periods of lower or more normal or average (h) levels of volatility.
General trading applications
Higher volatility markets offer potentially larger profits accompanied by increased risk. Short-term traders, whose profits are limited by how much a stock or futures contract can move in a given amount of time, may seek more volatile markets. Longer-term or more conservative investors may seek markets that are less volatile.
If the volatility of a market is extremely low (compared to average or normal levels), then chances are a larger move is imminent as volatility reverts to its mean. Conversely, if volatility is extremely high (compared to normal levels) then the large price move which created the jump in volatility may be over as volatility reverts back to more normal levels.
Summing Up
Volatility measures the changes in price of a market over a given time period. The average true range of a market provides a simple way of calculating volatility. Markets that are generally volatile offer potentially larger profits with the trade off of increased risk. Volatility has a few important characteristics: cyclicity, persistency and reversion to

the mean. These concepts can be used to help determine which markets offer the highest potential for profits, when a large move is likely to occur and when the move may be over.
In parts two and three of this series, we’ll expand upon these concepts using historical volatility, a more mathematically complex but useful way of measuring volatility. We’ll show how it can be used to find (or avoid) highly volatile markets, determine realistic points to set initial protective stops and to find markets that are likely to explode or enter a low-volatility congestion period.
More Insightful articles at:
All original materials: © 2003 Brooke Publishers, Inc.
Comments: [email protected]

20 Golden Rulesfor Traders
Trading Masters NEW TO TRADING & TECHNICAL ANALYSIS?Click Here
WIZARDSTUTORIAL
HomeDaily
CoursesTactics
Resources
YOUR DAILY
MARKETGUIDE
Featuring
InteractiveTradingPicks
PICKS, CHARTS, SCANS, IDEAS &
PROFITSCheck outMORNING TRADER
NOW!
andEVERY MARKET
DAY!
Powerful Tools
for Traders
MOVING AVERAGES: THE INS AND OUTS OF
By David Landry
The moving average is probably one of the most used and possibly overused indicators in the financial markets. In the first of this three-part series we will look at the calculation and comparison of simple, exponential and weighted moving averages.
Simple Moving Average
An average is simply the sum of a data set divided by the number of data points. Let's look at a set of grades. Suppose Johnny earns the following grades:
67 77 80 82 85
His average would be the sum of the grades divided by the number of tests:
(67 + 77 + 80 + 82 + 85)/5 = 391/5 = 78.20
Now suppose on his next test he scores a 90. If we took a 5-day "moving" average of his grades we would drop off his oldest grade (67) and add in his newest grade (90) and then divide by 5. This is illustrated in Figure 1. Notice how the average "moves" from the oldest 5 data points to the newest 5 data points, hence the name "moving average."
POWERFULONLINE
TRADINGCOURSE
FromHARD RIGHT EDGE
YourOriginal Guide
toSuccessful
Short-Term Trading
Highly EffectiveMarket Strategies
and3-D Charting Techniques
GetMore Info
HRE SPOTLIGHT
TechnicalAnalysisMasters
Jeff Cooper
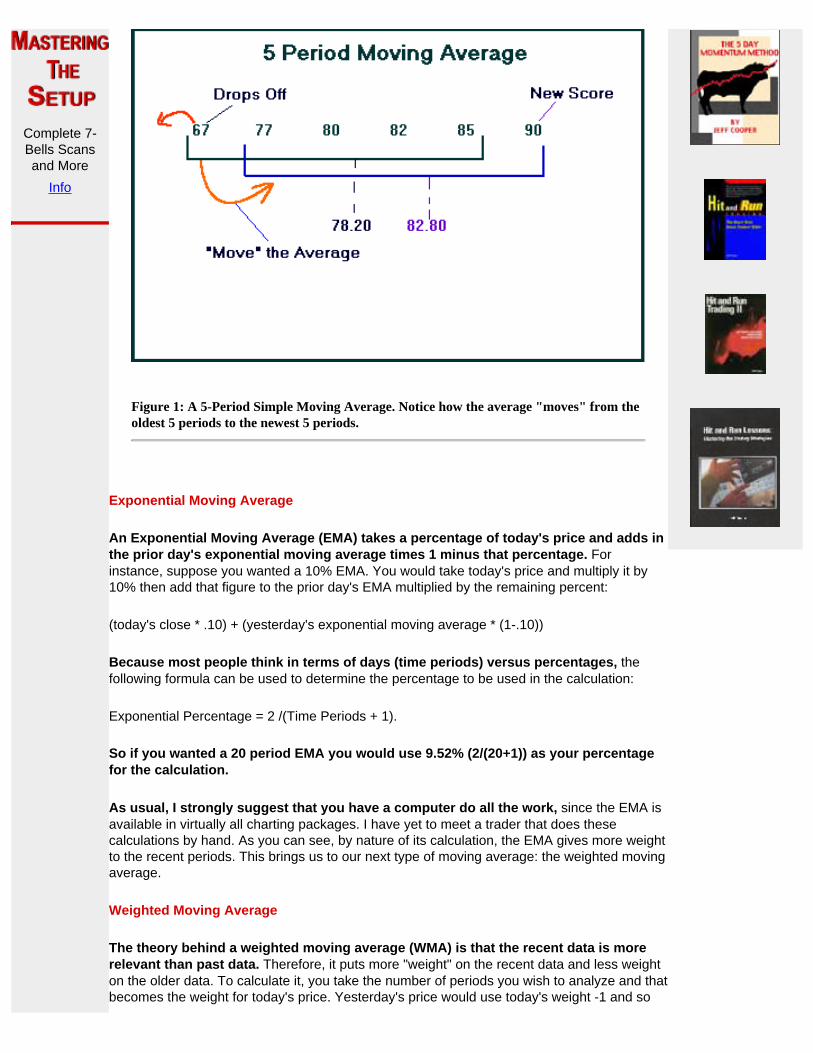
Complete 7-Bells Scansand More
Info
Figure 1: A 5-Period Simple Moving Average. Notice how the average "moves" from the oldest 5 periods to the newest 5 periods.
Exponential Moving Average
An Exponential Moving Average (EMA) takes a percentage of today's price and adds in the prior day's exponential moving average times 1 minus that percentage. For instance, suppose you wanted a 10% EMA. You would take today's price and multiply it by 10% then add that figure to the prior day's EMA multiplied by the remaining percent:
(today's close * .10) + (yesterday's exponential moving average * (1-.10))
Because most people think in terms of days (time periods) versus percentages, the following formula can be used to determine the percentage to be used in the calculation:
Exponential Percentage = 2 /(Time Periods + 1).
So if you wanted a 20 period EMA you would use 9.52% (2/(20+1)) as your percentage for the calculation.
As usual, I strongly suggest that you have a computer do all the work, since the EMA is available in virtually all charting packages. I have yet to meet a trader that does these calculations by hand. As you can see, by nature of its calculation, the EMA gives more weight to the recent periods. This brings us to our next type of moving average: the weighted moving average.
Weighted Moving Average
The theory behind a weighted moving average (WMA) is that the recent data is more relevant than past data. Therefore, it puts more "weight" on the recent data and less weight on the older data. To calculate it, you take the number of periods you wish to analyze and that becomes the weight for today's price. Yesterday's price would use today's weight -1 and so

on and so forth for the number of periods. You then divide the sum of the weighted prices by the sum of the weights.
For example, suppose we took the last five "grades" we used in our first example and calculated a 5-period WMA. The calculation would be as follows:
Figure 2: Calculation of a Weighted Moving Average. The number of periods (in this case 5) becomes the "weight" for today. The weight for the remaining days is reduced by 1 until the last day is found. Therefore, the most recent period gets the highest weight and the oldest period gets the smallest. The summed weighted prices are then divided by the sum of the weights
Again, I strongly suggest that you have your computer do all the work.
Comparing the EMA,WMA and Simple Moving Averages
The simple moving average gives equal weight to all data points. By nature, it is the "true" average. The exponential and weighted moving averages give the most recent data points the highest rankings or "weightings". Therefore, the simple moving average tends to lag (by representing all data points equally) the exponential and weighted moving averages during large price changes. However, during "normal" or "flat" markets the differences become negligible. This is illustrated in figure 3.

Figure 3: March 2000 Bonds with 50-day Simple, Exponential and Weighted Moving Averages. Notice during "normal" or "flat" markets the averages tend to run together (a). However, once the market begins to make sharp moves (b) and (c) the EMA and WMA tends to catch up to price faster while the Simple Moving Average tends to lag.
So Which One Should You Use?
Deciding between the types of moving averages really becomes a matter of personal preference. Normally when you hear talk of moving averages, in the media it normally refers to simple moving averages. Therefore, due to widespread focus on these numbers, it's important to give them consideration. The 50- and 200-day (simple) moving averages are most commonly used here. As a trader, especially during large price moves, you might consider experimenting with exponential or weighted moving averages.
Looking Ahead
Now that we've defined the different types of moving averages we can focus on characteristics of the indicator and strategies. In part two we'll look at these characteristics and general uses of moving averages. We'll touch upon the fact that "conventional wisdom" regarding moving averages is often wrong. Finally, in part three we'll look at specific strategies and set-ups involving moving averages.
More Insightful articles at:


20 Golden Rulesfor Traders
Trading Masters NEW TO TRADING & TECHNICAL ANALYSIS?Click Here
WIZARDSTUTORIAL
HomeDaily
CoursesTactics
Resources
YOUR DAILY
MARKETGUIDE
Featuring
InteractiveTradingPicks
PICKS, CHARTS, SCANS, IDEAS &
PROFITSCheck outMORNING TRADER
NOW!
andEVERY MARKET
DAY!
Powerful Tools
for Traders
MOVING AVERAGES: CHARACTERISTICS AND GENERAL USES
By David Landry
In the first part of this series we looked at the calculation and differences between exponential, weighted and simple moving averages. In this second installment, we’ll look at the characteristics of moving averages and general uses.
Drop-Off Effect
In the first installment of this series, we discussed a set of hypothetical grades that a student earned. They were 67, 77, 80, 82, and 85. The average of these (67+77+80+82+85)/5 equated to 78.20. We then added in a new score of 90 and "dropped off" the old score of 67, thereby creating a five-day "moving" average. This is illustrated in Figure 1. Notice that the student’s performance jumped from 78.20 to 82.80. This, of course, was due in part because we added in a higher grade but is also attributed to the fact that we dropped off the oldest grade. This grade also happened to be the worst. Therefore, by dropping off the oldest data point, moves in the moving average can often be exaggerated. This is known as the "drop-off effect".
POWERFULONLINE
TRADINGCOURSE
FromHARD RIGHT EDGE
YourOriginal Guide
toSuccessful
Short-Term Trading
Highly EffectiveMarket Strategies
and3-D Charting Techniques
GetMore Info

Complete 7-Bells Scansand More
Info
Figure 1. Simple Moving Average. The increase in the average from 78.20 to 82.80 was due, in part, to the older data being "dropped off".
The drop-off concept is better illustrated in a "real world" example. Referring to Ask Jeeves ASKJ in Chart 2, notice that the moving average increased by 2.21 (a) while the stock price actually decreased by 4 3/4 points (b). The fact that the moving average increased even though the stock price decreased was due, in part, to the fact that the older lower-level data was dropped off (c).
HRE SPOTLIGHT
TechnicalAnalysisMasters
Jeff Cooper

Chart 1 Ask Jeeves. The moving average continues to increase (a) even though the stock dropped in price (b). This is due to higher level prices being added to the average and lower level prices (c) being dropped off.
The drop-off characteristic is actually quite useful when trailing stops as the moving average catches up to the price. However, when used as a gauge for performance, this characteristic should be considered.
Reversion to the Mean
As I've joked in prior articles, if you know someone who's mean but then nice for a few days, chances are they'll revert back to being mean. That's the whole concept behind reversion to the mean (average). Therefore, reversion to the mean is simply a market's tendency to revert back to average levels once stretched to an extreme. Referring to Chart 2, December Bonds, notice that at points (a) through (g) the market reverts back to the average after being stretched. The problem is, you never know exactly how far "stretched" can be. Notice that at points (f) and (g) the market moved to more extreme levels before correcting. Nonetheless, the reversion to the mean characteristic is useful for determining if a market is due for a correction.
Chart 2 December 1999 Bond Futures. Prices have a tendency to revert back to the mean (average). Notice that once stretched, points (a) through (g), the price tends to revert back to the average.
General Uses of Moving Averages
Now that we've defined the characteristics of moving averages, let’s look at general ways to use them. Conventional wisdom states that you should buy a market when the fast (short-term) moving average crosses above the slow (longer-term) moving average and sell that market when the fast moving average crosses below the slow moving average. Unless you're fortunate to catch a market right before a large trend (and subsequently quit following this "system"), you will more than likely lose money with

this approach *. This is illustrated in chart 3, the cash S&P index. Notice that following this method would occasionally catch a big trend (points (b) and (c)) but more often than not you would lose money during the market’s whipsaw (points (a) and (d)). I’m not saying that crossovers are completely worthless. My point is that they should be used as a reference only and not as a purely mechanical system in and of itself.
Chart 3, Cash S&P Index-Using Moving Average Crossovers as Trading Signals. Large trends such as points (b) and (c) are occasionally captured by using this system. However, for the most part, the system will lose money due to the market’s whipsaw (points (a) and (d)).
Slope of moving average
One of the least complex and possibly most useful ways to use a moving average is to simply look at its slope. If the slope is rising then the market is in an uptrend. On the other hand, if the slope is falling then the market is in a downtrend. This is illustrated in Chart 4, March 2000 Coffee. Keep in mind that you can’t really base a system purely on this approach but trading with the trend based on the slope of the moving average may help keep you out of trouble.

Chart 4, March 2000 Coffee-Using the Slope of the Moving Average to Gauge Performance. Although you probably can’t base a system solely on the moving average slope, a positive slope suggests an uptrend while a negative slope suggests a downtrend.
Using the Moving Average for Support/Resistance & Reference Points
Markets will often find support and resistance at the moving averages. For instance, if a market is in an uptrend and begins to correct, it should not trade below its immediate term moving average. For example, in stocks, the 50 day moving average usually provides a good point of reference as it is watched by large traders and institutions. Stocks should stay above the average and find support there during corrections. This is illustrated in Chart 5, Cisco Systems. On the other hand, in downtrends they should find resistance at the moving average during relief rallies.
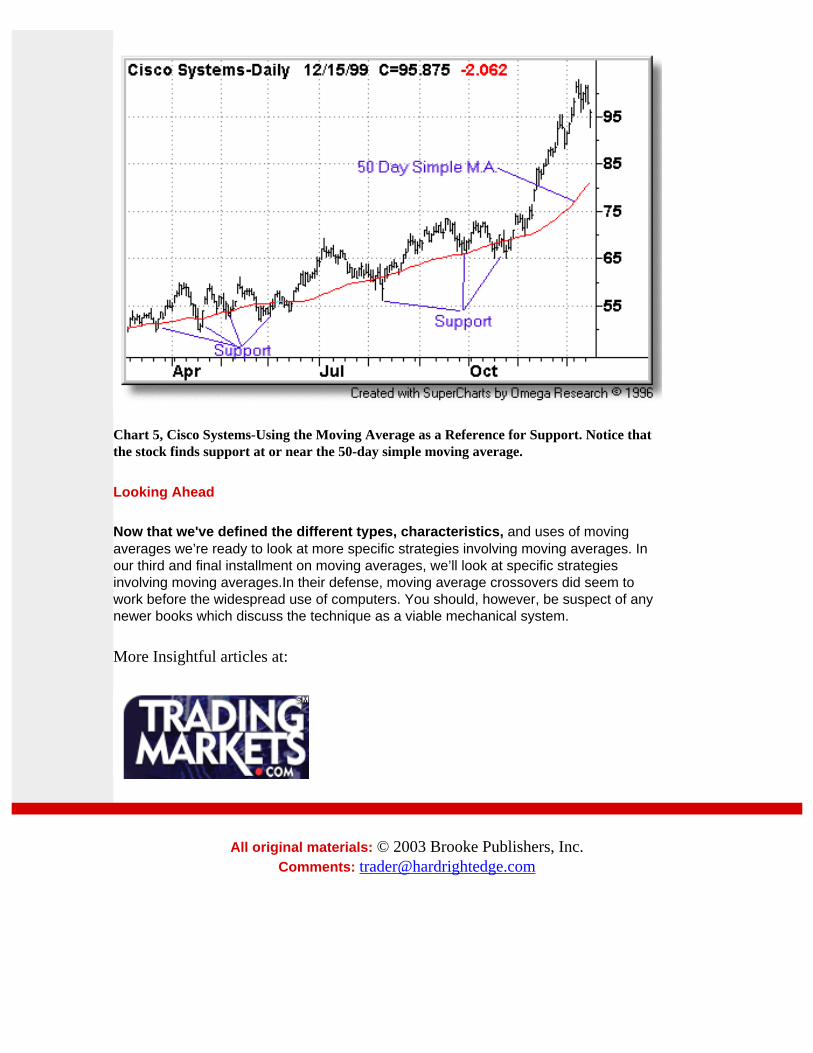
Chart 5, Cisco Systems-Using the Moving Average as a Reference for Support. Notice that the stock finds support at or near the 50-day simple moving average.
Looking Ahead
Now that we've defined the different types, characteristics, and uses of moving averages we’re ready to look at more specific strategies involving moving averages. In our third and final installment on moving averages, we’ll look at specific strategies involving moving averages.In their defense, moving average crossovers did seem to work before the widespread use of computers. You should, however, be suspect of any newer books which discuss the technique as a viable mechanical system.
More Insightful articles at:
All original materials: © 2003 Brooke Publishers, Inc.
Comments: [email protected]

20 Golden Rulesfor Traders
Trading Masters NEW TO TRADING & TECHNICAL ANALYSIS?Click Here
WIZARDSTUTORIAL
HomeDaily
CoursesTactics
Resources
YOUR DAILY
MARKETGUIDE
Featuring
InteractiveTradingPicks
PICKS, CHARTS, SCANS, IDEAS &
PROFITSCheck outMORNING TRADER
NOW!
andEVERY MARKET
DAY!
Powerful Tools
for Traders
MOVING AVERAGES: TRADING PATTERNS
By David Landry
In this third and final installment on moving averages, we will look at more specific trading methods that seek to capitalize on their inherent features.
Running Cup and Handle
The cup-and-handle (1) is typically a major reversal pattern that often precedes large rallies. It is formed when a stock sells off, bottoms, and then begins to rally, creating a "cup." After the rally, the stock drifts lower, forming the "handle" of the pattern. According to William O'Neil, who popularized the pattern, the best cup-and-handle candidates are stocks that already have staged a strong rally.
One way to measure the “strong rally” would be to use the 50-day moving average. As long as a stock remains above the 50-day moving average, it can be considered to be in an intermediate-term uptrend. Therefore, cup-and-handles that formed at or above the 50-day moving average are dubbed “running” as the market continues to “run” while the pattern is formed. The theory is that it combines a bottoming/correction formation with trend -- the best of both worlds.
POWERFULONLINE
TRADINGCOURSE
FromHARD RIGHT EDGE
YourOriginal Guide
toSuccessful
Short-Term Trading
Highly EffectiveMarket Strategies
and3-D Charting Techniques
GetMore Info
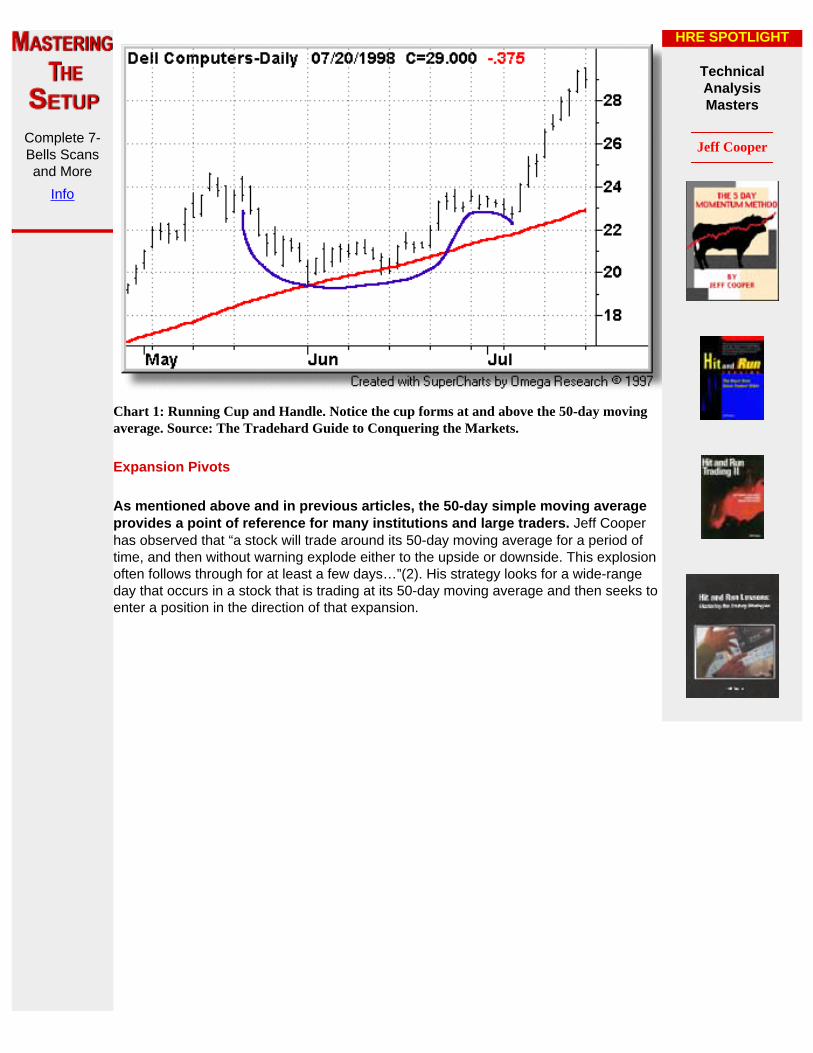
Complete 7-Bells Scansand More
Info
Chart 1: Running Cup and Handle. Notice the cup forms at and above the 50-day moving average. Source: The Tradehard Guide to Conquering the Markets.
Expansion Pivots
As mentioned above and in previous articles, the 50-day simple moving average provides a point of reference for many institutions and large traders. Jeff Cooper has observed that “a stock will trade around its 50-day moving average for a period of time, and then without warning explode either to the upside or downside. This explosion often follows through for at least a few days…”(2). His strategy looks for a wide-range day that occurs in a stock that is trading at its 50-day moving average and then seeks to enter a position in the direction of that expansion.
HRE SPOTLIGHT
TechnicalAnalysisMasters
Jeff Cooper

Chart 2: Expansion Pivots. This set-up looks to enter on follow-through after wide-range movements at the 50-day moving average.
Holy Grail
In Street Smarts, Connors and Raschke showed that strongly-trending markets often retrace to the moving average before re-asserting themselves. If you think about it, this makes sense as markets often thrust/correct and then thrust again -- similar to the pullback pattern. Essentially the set-up looks for a strongly-trending market as measured by high ADX followed by a retracement to the 20-period exponential moving average. They jokingly dubbed this pattern the “Holy Grail”.
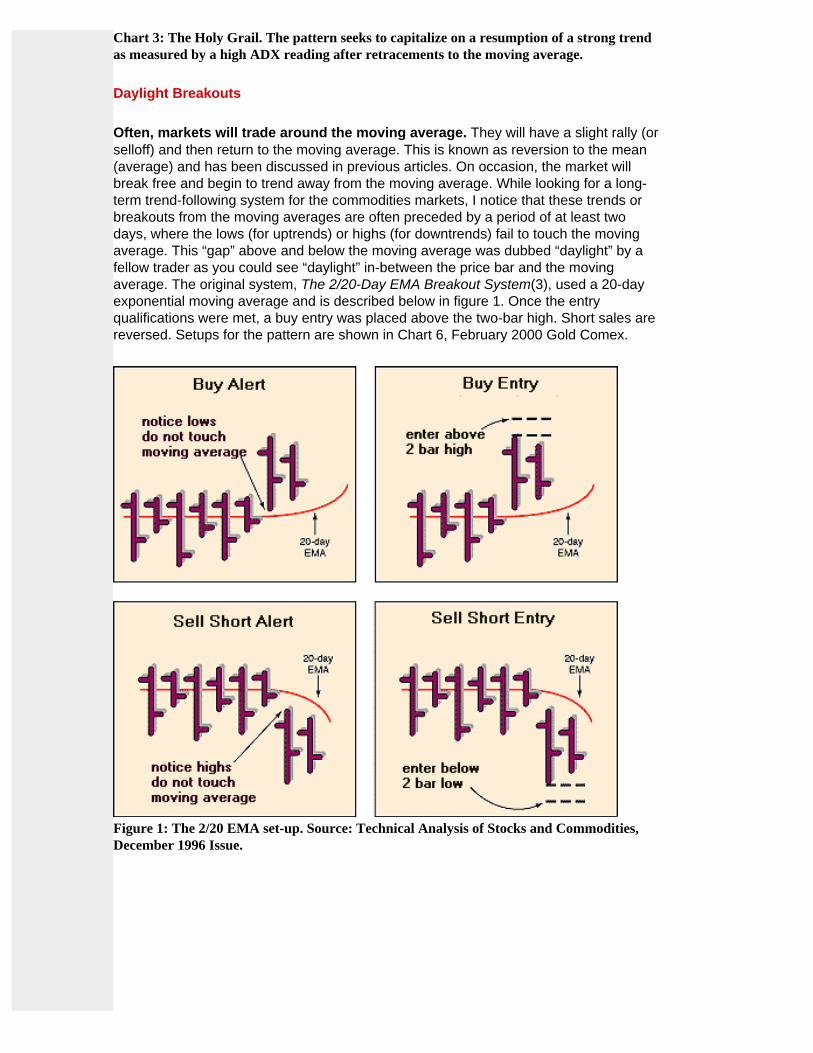
Chart 3: The Holy Grail. The pattern seeks to capitalize on a resumption of a strong trend as measured by a high ADX reading after retracements to the moving average.
Daylight Breakouts
Often, markets will trade around the moving average. They will have a slight rally (or selloff) and then return to the moving average. This is known as reversion to the mean (average) and has been discussed in previous articles. On occasion, the market will break free and begin to trend away from the moving average. While looking for a long-term trend-following system for the commodities markets, I notice that these trends or breakouts from the moving averages are often preceded by a period of at least two days, where the lows (for uptrends) or highs (for downtrends) fail to touch the moving average. This “gap” above and below the moving average was dubbed “daylight” by a fellow trader as you could see “daylight” in-between the price bar and the moving average. The original system, The 2/20-Day EMA Breakout System(3), used a 20-day exponential moving average and is described below in figure 1. Once the entry qualifications were met, a buy entry was placed above the two-bar high. Short sales are reversed. Setups for the pattern are shown in Chart 6, February 2000 Gold Comex.
Figure 1: The 2/20 EMA set-up. Source: Technical Analysis of Stocks and Commodities, December 1996 Issue.

Chart 4: February Comex Gold. Notice the 2/20 EMA Breakouts (or “Daylight” Breakouts) requires the market to trade above the two-bar high of the set-up for longs and below the two-bar low for shorts. If the market fails to pass these points then there is no trade.
Like most trend-following systems, Daylight Breakouts are prone to large drawdowns (losses to equity) when traded on a purely mechanical basis as markets only trend about 30% of the time. However, when used on a discretionary basis, combined with money management and/or additional technical indicators (i.e. a strong underlying trend) it can be a useful tool. Also, you might consider varying the lengths (and types) of moving averages used depending on your trading style. For instance, short-term traders may consider using a 10-period moving average whereas longer term traders may consider a 50-period moving average or longer.
Conclusion and Series Summary
In the first part of the series we defined the different types of moving averages. These included the simple, weighted and exponential moving averages. These different types of averages essentially behaved the same except in strong trends and breakouts when the weighted and exponential moving averages tended to “catch up” faster to current prices. In Part II, we looked at the characteristics of moving averages such as reversion-to-the-mean and the drop-off effect. We also looked at general uses which included support/resistance or reference points and using the slope of the moving average to measure trend. Finally, we showed more specific set-ups which seek to capitalize on these features.
So which moving average or set-up is best? It all boils down to personal preference and trading style. I encourage you to study the different types of moving averages and the above set-ups. Modify them to your liking or create your own methods.
More Insightful articles at:


20 Golden Rulesfor Traders
Trading Masters NEW TO TRADING & TECHNICAL ANALYSIS?Click Here
WIZARDSTUTORIAL
HomeDaily
CoursesTactics
Resources
YOUR DAILY
MARKETGUIDE
Featuring
InteractiveTradingPicks
PICKS, CHARTS, SCANS, IDEAS &
PROFITSCheck outMORNING TRADER
NOW!
andEVERY MARKET
DAY!
TAPE READING There are plenty of technical indicators used by traders in different combinations. Many of them are very sophisticated and computers make it easy to watch them in real time. However, Tape Reading is a truly universal method that can be combined with any technical study, and we suggest it as a base for any other method traders like. Sophisticated indicators based on complicated calculations tend to somewhat mask the reality of a scenario happening. Tape Reading goes right to the roots of the stock’s action. This is necessary for newer traders.
Like no other method, Tape Reading deals with reality itself allowing traders to see market moving forces in action and to judge which one prevails at that moment. It provides us with a look into what other players try to hide and then allows us to separate reality from our perception. The best example of this is as old as the Wall Street situation of “selling on news”. There are numerous examples of “XYZ is selling on such a great news.” Tape Reading shows why and how it happens. This tells you when you should expect non-conventional action on the stock and how to exploit it.
Tape Reading deals with two major categories of market players. They are the Smart Money and the Public. You can replace these old terms with any pair you like (big guys and small time traders, insiders and online traders, institutions and retail traders, etc). However, the core of market events is the same. Tape Reading is a method of analyzing which side is doing what at that moment. Analysis is done by observing the only, and ultimately, truthful indicators of Price and Volume Action.
Tape Reading does not always answer all our questions. In the stock market, nothing does. The stock market has no single ultimate answer. Otherwise this answer would already have been discovered and the market would have ceased to exist. There is no way price would ever change if traders knew the exact situation. Furthermore,
POWERFULONLINE
TRADINGCOURSE
FromHARD RIGHT EDGE
YourOriginal Guide
toSuccessful
Short-Term Trading
Highly EffectiveMarket Strategies
and3-D Charting Techniques
GetMore Info

any absolute method, once discovered by someone, could not be kept a secret for others.
What Tape Reading does:
It puts probability on your side as it allows you to read the truth to the extent it can be read, putting as few "interpreters" between you and reality as possible.
It allows you to develop a detached state of mind that a side observer possesses. The state of mind that traders want to experience is when they look at market action with no emotions, seeing clearly what happens. This is in direct conflict with cloudy judgment of emotionally involved traders with formed opinions that could be right or wrong, but in any case has nothing to do with reality.
All original materials: © 2003 Brooke Publishers, Inc. and Associated Authors
Comments: [email protected]
20 Golden Rulesfor Traders
Trading Masters NEW TO TRADING & TECHNICAL ANALYSIS?Click Here
WIZARDSTUTORIAL
HomeDaily
CoursesTactics
Resources
YOUR DAILY
MARKETGUIDE
Featuring
InteractiveTradingPicks
PICKS, CHARTS, SCANS, IDEAS &
PROFITSCheck outMORNING TRADER
NOW!
andEVERY MARKET
DAY!
MENTAL STATE Only a detached and unemotional state of mind allows us to make our decisions objectively. Many beginning and losing traders believe that good proven system is all that is needed for success. It is not so. The hardest part of trading is the part that YOU must do to win. The link from your mechanical approach to the enhancement of your mental approach will develop your winning and confident attitude each trading day. What is a mental state that will let you trade effectively? When you are happy, rested, alert and ready for any challenges that come your way. You feel in control.
Keeping your emotions in control, you are choosing to change your mental state to optimal for trading and winning. Your heart is not racing, pulse is not pounding, fear is not interfering with your ability to make effective decisions, thinking is clear on any stage of any trade you take. A trader that experiences strong emotions loses the ability to see the reality of the trade. Beginners often feel euphoria when they papertrade with, lets say, 80% accuracy. Unfortunately, when money is on the line, they are under so much pressure, they couldn’t tell the time of day. The money is too important to them. Yes, we live in real World and have to pay bills, but this must be psychologically separated from the trading and actions we take. Trading is far more profitable and fun when you are not focusing on money. And trading is far more than just making money. You define a winning trade and when you see the pattern or setup, you take the trade - easily, without hesitation, feeling good about it. You work the trade right and the money comes as reward for the job well done.
What makes the difference between a winning trader and a losing trader? More knowledge, bigger account, better computer, faster connection? All above are very important but not crucial. The ability to take action is. But here we have another conflict. In daytrading the price patterns form very quickly and require a disciplined, automatic response on trading signals. A disadvantage of a real-time data feed is the compulsion to overtrade. The constant price changes and the
POWERFULONLINE
TRADINGCOURSE
FromHARD RIGHT EDGE
YourOriginal Guide
toSuccessful
Short-Term Trading
Highly EffectiveMarket Strategies
and3-D Charting Techniques
GetMore Info

Powerful Tools
for Traders
Complete 7-Bells Scansand More
Info
dancing indicators strike for action. The flashing neon of Las Vegas exists for a purpose. Quickly responding to signals and a deep need for action when you really should not take a trade must be dealt with by every daytrader. Another problem is not taking action at all , even when valid signals tell you probabilities are on your side. Not taking action simply means you are not in the game. For some reason you believe that not taking a trade will be less painful than taking it. The truth is : if you want to be a trader, you must trade, you must change yourself from fearing to take a trade to cold-blooded readiness to react on valid signal. Working toward your goals and dreams, not sitting and doing nothing.
A trader that cannot execute a trade is not likely to be successful at trading. Whether you can execute is related to the amount of fear your brain generates and amount of confidence you have. Fear is the result of your beliefs about the nature of the market. What you actually fear is not the market, but your inability to act without hesitation when you need to. You have to learn what to fear and realize that you are free to act or not. Is market really threatening you? The market can’t do anything to you that you don't allow. What produces the fear we experience? Biggest fear producer is Loss. You enter a trade, you find yourself to be on the wrong side. Majority of losing traders will wish, hope and pray that the trade will turn around, waiting one more tick, one more second. The loss meanwhile continues to grow. In fact you are doing nothing. Effective way to get rid of fear is to change your perception.
Ability to act is based on your mental state at exact moment you have to take a trade. This state is controlled by your values and beliefs. When you are in power, you easily take action. When you are in a state of powerlessness, you wait, trying to avoid the situation, and avoid the pain you do not want to experience. Part of you wants one thing, but another stronger part wants something entirely different. F.e. You may tell yourself you want to be a trader, but at the same time you unconsciously value your sense of security too much to take any kind of risk with your income. Learn to act fast to get out of a losing position, executing it to the best of your ability. Act immediately, once your criteria for a losing trade has been met. Next trade awaits right around the corner. Each trade is a new trade. Forget about how you did on the previous one, profit or loss. Start clean.
Your success as a trader will be achieved when the probability of successful trades outweighs the probability of losing. This will not work if a trader only executes 1 of 10 trades. You desperately trying to pick the best trade rejecting trades that meet your criteria one by one. When you finally do take one and experience a loss on that cherry picking trade, it becomes more painful, reaching a point where it is impossible to take any trades at all.

Success is unlikely to come without consistency. Believing that you can actually master the Game is crucial. Everyone is capable of being a successful trader. Good attitude, passion and undivided responsibility when mastering the Game of Trading are the must and can make a good trader even from self-doubter.
Traders that manage to Master the game and maintain right state of mind will tell you about interesting thing. One day when some critical mass of experience is reached, amazing transition will happen. Wonderful state comes, which marks the highest possible stage of trader's development:
● Intuitive perception of market actions. When trader acts instantly, flawlessly, with incredible confidence.
● When trading becomes natural part of life, the source of joy. ● Market becomes your friend which you respect and
understand but never fear of.
All original materials: © 2003 Brooke Publishers, Inc. and Associated Authors
Comments: [email protected]
20 Golden Rulesfor Traders
Trading Masters NEW TO TRADING & TECHNICAL ANALYSIS?Click Here
WIZARDSTUTORIAL
HomeDaily
CoursesTactics
Resources
YOUR DAILY
MARKETGUIDE
Featuring
InteractiveTradingPicks
PICKS, CHARTS, SCANS, IDEAS &
PROFITSCheck outMORNING TRADER
NOW!
andEVERY MARKET
DAY!
PERSONAL ACCOUNTABILITY The ego is a big part of a trader’s demise in the long run. When ego leads decision making, over time there is no possibility for consistency.
Another condition that newer traders exhibit is the uncanny ability to try to make sense out a market that acts in an illogical manner. I’m talking about why markets move down in the face of positive economic events or why stocks move up on negative news. Logic says that the market correlation should be evident. All bad news creates a downward move and all good news creates an upward move. This obviously isn’t always the case. Market Makers, institutions, analysts and retail traders all have their own intentions and opinions about where valuations in stocks and the market “should” be. It is very difficult however to determine what these large capital base firms are doing as they do it. For most, it is downright impossible. This is what leads to traders wanting the easy explanation for what happened. Sadly, they accept any reasonable explanation offered to them. Then when the same event happens the next time, they expect the same result. When it doesn’t happen, they complain to the one that offered the prior explanation. That person simply offers another reasonable explanation that is accepted and the cycle continues. Until that trader begins to understand for himself how this event works, they will never be able to progress as a trader understanding what is behind the curtain. They blame the wrong information presented and lack the determination to find out the truth of what happened so that they do not repeat the same negative action.
When a trader goes further, it is almost enlightenment when a trader finally realizes that what did happen doesn’t really matter. What mattered was simply that the stock moved in a certain direction and the trader was able to profit from it or not. This clarity in trading allows a trader to improve herself and her accountability. The stock moved, they don’t know why, but they traded based on what they saw
POWERFULONLINE
TRADINGCOURSE
FromHARD RIGHT EDGE
YourOriginal Guide
toSuccessful
Short-Term Trading
Highly EffectiveMarket Strategies
and3-D Charting Techniques
GetMore Info

in the stock. They either profited or lost based on what they saw in the trade. It was that person’s trade and his alone. The market didn’t hurt the trade and Market Makers didn’t intentionally make the stock move one way or the other to make you exit. The market, market makers and you all work in this stock move in a certain way that has nothing to do with each other, only their own intentions. If that intention happens to make you exit with a profit or loss, then that was your decision, not theirs. Your trading resides in you. If you succeed, you have no one to thank but yourself. You are the one pressing the buttons. When you fail, you have no one to blame but yourself. You are the one pressing the buttons. Learn to trust yourself and your abilities. If you can do this, you are becoming personally accountable for your trade. This is a step in the profitable direction.
Each trading system has many points of opportunity. By understanding and developing the confidence in yourself, there is a connection made from a trader’s understanding of mechanical trading to their artistic side of trading. Traders need to rely on themselves, their thoughts, ideas, feelings and actions. By trusting in themselves, they enhance this part of their trading. Without this, a trader continues to see the events that happen to him as external, something to blame. There will always be that outside force that is taking profits from them and ruining their lives, stealing their money. There will never be any type of control over the trade because they let the outside forces keep it. To become profitable, a trader needs to retain that control.
In order to profit over the long term, a trader has to understand that the response came from within themselves. The trader acted on his own belief and based on what they saw. It takes a lot of time of interaction with the markets, mechanical understanding, being around other traders, feeling the markets and participating actively to get this feel. If this is cluttered with external negative information such as Market Maker conspiracy theories and market degradation, a trader does not stand a chance from learning the true and underlying reasons for what has just happened to him. They will just continue to accept things at face value. Their losses will far outweigh their profits and they cease to trade any longer. A person can’t move along life blaming everyone else and everything else for what didn’t go right for them. I can’t see why they think trading would be any different. Accountability resides within each of us. Accept it and move forward to develop both an unemotional approach to trading as well as developing your inner self that will guide your decisions and hopefully, ultimately lead to a consistent successful trading career.
All original materials: © 2003 Brooke Publishers, Inc. and Associated Authors
Comments: [email protected]


20 Golden Rulesfor Traders
Trading Masters NEW TO TRADING & TECHNICAL ANALYSIS?Click Here
WIZARDSTUTORIAL
HomeDaily
CoursesTactics
Resources
YOUR DAILY
MARKETGUIDE
Featuring
InteractiveTradingPicks
PICKS, CHARTS, SCANS, IDEAS &
PROFITSCheck outMORNING TRADER
NOW!
andEVERY MARKET
DAY!
USING SHORT TERM DIVERGENCE FOR BIGGER PICTURE ENTRY

Powerful Tools
for Traders
Complete 7-Bells Scansand More
Info
The key to trading on a short term time frame is always keeping the larger time frame trend in mind. Looking above at the larger time frame, the 90 minute charts for the DIA, QQQ & SPY we notice that all 3 had traded down into a support zone.
From the pivot highs of all 3 indexes, the SPY & QQQ retraced back down to just above

the GAP zone & into their 20 period exponential moving averages and the DIA traded into its 20 period exponential moving average & also a lower trendline of its bull flag for the 90 minute chart.
Looking at the short term time frame, the 5 minute charts for the same 3 stocks, QQQ DIA & SPY where in a downtrend for most of the day, allowing short term scalping opportunities to the downside on every retracement to the 20 period exponential moving average.
The 20 period exponential moving average is used as a short term support and resistance in a trending market., Notice how on both the larger time frame charts above used the 20 ema as support where as the 5 min charts below used it as resistance.
Understanding the use of multiple time frames allows a trader to see both the both the short term & long term term trends & how support & resistance become factors for key turning points.
Price support/resistance are the result of pivot highs & lows, GAP open & Gap close are also considered price support & as stated above, the 20 ema is considered moving average support/resistance.
When watching the 3 indexes ( DIA, QQQ & SPY), one key to finding turning points is to watch for divergence's, this allows for entries on a short term time frame & leads to powerful moves using larger time frame supports. Risk is kept to a minimum because the entries are based on a short term time frame.
Below you could see the same 3 indexes (DIA QQQ & SPY), BUT notice how the DIA & SPY tested to NEW lows & the QQQ put in a higher low on the final push down into support on the 90 min. charts giving a buy divergence on the 5 minute chart.


As you could see above, all 3 indexes had been in a downtrend on the 5 minute charts & confirmation of the buy divergence came at a break above the blue trendline.
When watching for turning points in the markets, timing is critical, watching the higher time frame supports & resistance levels is key on higher time frames as your entry is on the short term time frame, price divergence on the indexes is one key factor to determining entry signals.
This is one way to time the markets with a low risk entry is by using a protective stop loss at the last recent pivot low of the short term time frame.
Profit exits are determined by the goal of the trader & the time frame used, a 5 minute chart would give exits at resistance's above from the intraday pivot highs from the downtrend for scalping opportunities where as a 90 minute chart would give exits at its pivot highs on that time frame or in the case of these charts, a retest of the last swing high of the 90 minute charts above. Criteria for short entries is the reverse of the above information.
All original materials: © 2003 Brooke Publishers, Inc.
Comments: [email protected]

20 Golden Rulesfor Traders
Trading Masters NEW TO TRADING & TECHNICAL ANALYSIS?Click Here
WIZARDSTUTORIAL
HomeDaily
CoursesTactics
Resources
YOUR DAILY
MARKETGUIDE
Featuring
InteractiveTradingPicks
PICKS, CHARTS, SCANS, IDEAS &
PROFITSCheck outMORNING TRADER
NOW!
andEVERY MARKET
DAY!
PRICE DIVERGENCE USING THREE INDICES Key turning points in the stock market are result of prices not confirming each others trends, watching the 3 indexes are represented by their Holders Stock, the SPY-SP500, DIA-DOW & QQQ-NASDAQ.
Watching price action is the purest indicator you could ask for, as traders, we get caught up in using the variety of indicators in our charting software like MACD, STOCHASTIC, RSI and the list goes on, if a trader where to eliminate these indicators & watch pure price only & look for confirmation & non confirmation of the 3 indexes, that trader would have an entire new world opened to them, seeing these patterns setup & unfold is like watching a rerun of a sports event, the thrill is there, the excitement is there, & to see when 2 indexes are rallying up & taking out new intraday highs as though there is going to be an explosion of buying and the trader is sitting patiently, not excited and is shorting the 3rd index because that trader notices something is not right, the 3rd index is not confirming the rally attempt to new highs.
Confirmation & Non Confirmation are extremely key to trading, on a trending environment UP, it seems as though the entire market is trading in sync, everybody is buying at one time & all day from the opening bell to the close. These types of days are simple confirmation days, all 3 indexes trending as one, get in at any point of the day & close out trade into last 5 minutes & you are for the most part going to make a profit.
Non Confirmation Days are typically non trending environments, The DIA & SPY will trend to new highs in the examples are shown below & give false hope to many buyers, where as the 3rd index, the QQQ has no intention to trade any higher than giving a half hearted attempt to correct back up from its last swing down.
This type of price action is considered non confirmation, & also considered a price divergence, a price divergence is when 2 or more indexes do not confirm the direction of each others trend.
The DIA (DOW)- As shown in the example below had a beautiful rally from 12:00 PM time frame & around the 2pm time frame took our its intraday highs & was breaking out of its range.
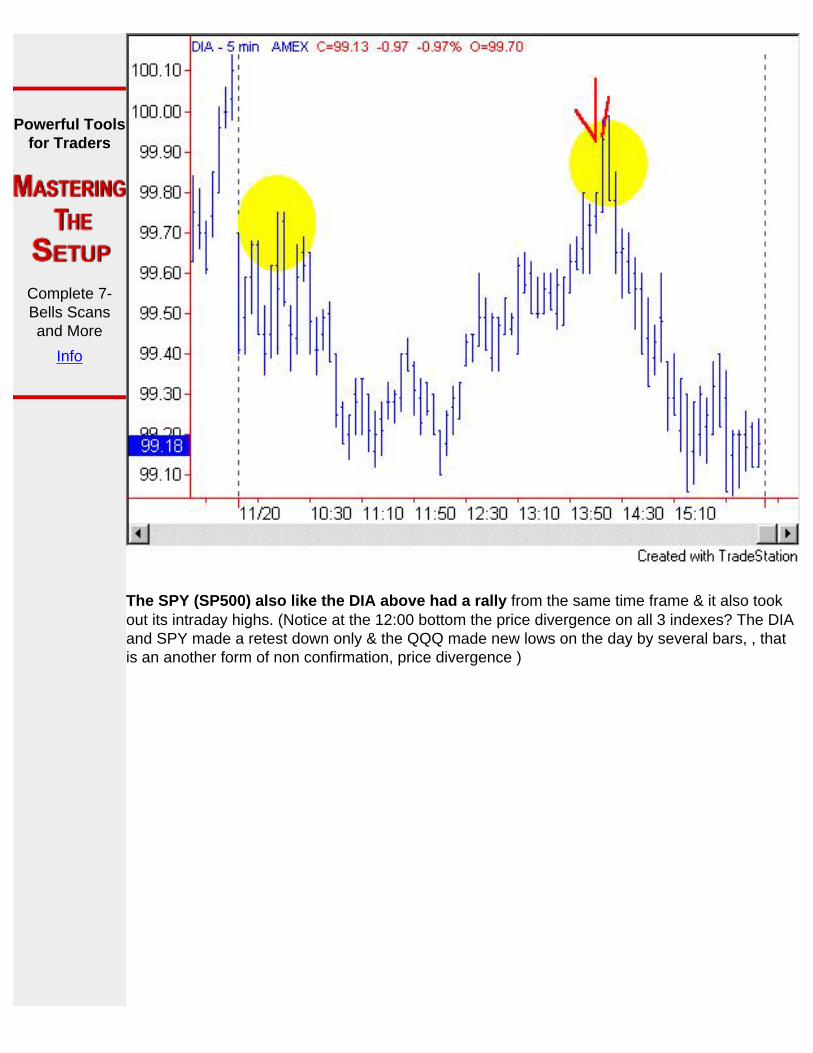
Powerful Tools
for Traders
Complete 7-Bells Scansand More
Info
The SPY (SP500) also like the DIA above had a rally from the same time frame & it also took out its intraday highs. (Notice at the 12:00 bottom the price divergence on all 3 indexes? The DIA and SPY made a retest down only & the QQQ made new lows on the day by several bars, , that is an another form of non confirmation, price divergence )

The 3rd index QQQ (NASDAQ) gave a very weak attempt at a rally when the 2 other indexes where making new highs, this was a short signal, many times a trader will notice that the weaker index will have a bear flag pattern, or a rising channel. This divergence also comes at the upper part of a range on a much larger time frame daily chart that has been consolidating & when the markets are in a consolidation, non confirmation setups are more expressed & very clear at times as we have in the examples.

CIEN is just one stock of many that where emulating the NASDAQ Index-QQQ & where tradable just as the indexes or QQQ are tradable, notice the powerful move down as a result of the index (QQQ) & stocks such as CIEN did not confirm, soon as the DIA & SPY went &made new intraday highs, this was a spot to short the markets. As the person watching the rerun of the game & knowing the score before it happens, the trader that understands this pattern also understands the score at the end of the trading day.

Criteria for buys is the reverse of the examples above.
All original materials: © 2003 Brooke Publishers, Inc.
Comments: [email protected]

20 Golden Rulesfor Traders
Trading Masters NEW TO TRADING & TECHNICAL ANALYSIS?Click Here
WIZARDSTUTORIAL
HomeDaily
CoursesTactics
Resources
YOUR DAILY
MARKETGUIDE
Featuring
InteractiveTradingPicks
PICKS, CHARTS, SCANS, IDEAS &
PROFITSCheck outMORNING TRADER
NOW!
andEVERY MARKET
DAY!
CHANGING YOUR BELIEFS What is a Belief? First, let me define a belief from my perspective. A belief is a feeling or concept, within any individual, about some future outcome, based on past experiences or memories. We all have past experiences from early childhood, all the way up to 5 minutes ago, that shape our beliefs about the future. From a personal point of view, we have beliefs about things external to trading such as, sanctity of marriage, killing is wrong, stealing is wrong, sharing is good, etc.
Now, I chose these 4 for a reason: each individual's belief about the above 4 could be very different. Those areas of the world where one is allowed to be married to more than one individual may see this as separate from the view of monogamy. Killing, those that serve as military forces may see a conflict in this statement. Stealing, what about the man who has no other way to provide for his family at a specific point in time? Sharing? How many of us would share our profits in each trade with our neighbors? Point being, within each belief, we create conflict when different situations or other ways to look at things arise. We are so adamant about "killing is wrong", but then the draft comes along in the US and we are forced to fight a war. Let's bring this back to trading.
Trading Beliefs
POWERFULONLINE
TRADINGCOURSE
FromHARD RIGHT EDGE
YourOriginal Guide
toSuccessful
Short-Term Trading
Highly EffectiveMarket Strategies
and3-D Charting Techniques
GetMore Info

Powerful Tools
for Traders
Complete 7-Bells Scansand More
Info
We learned certain beliefs about the way of living. The harder we work, the more effort we put in, the more money and reward we will make. The less we work, the less money we will make. The guy that works three jobs, will make more than the bum on the couch. In trading, this is not so. It takes virtually no effort to trade stocks. Anyone can buy and sell stocks, having winners and losers, with no effort at all. If you don't believe this, tell your 5 year old to press your buttons for you. They may ask when or how, but once learned, with no effort, they would buy and sell stocks with no reason or thought. Some of those trades would make money, some would not. You can see that in this example, on a winning trade, was it because the 5 year old thought through the TA lines and pivot points? No.
When a new trader comes to the market place, ready to trade stocks, this is the mindset that most of them have. And it's a good reason that many do not stick around for too long. They trade, making trades, winning and losing, with no effort at all. If they are winning more in the beginning, they believe trading is easy, a piece of cake. How could anything be so hard? You just buy here, and sell there It's not until a string of losses, or one great loss, begins to redefine their thought process. If the trader loses and loses, their belief is that trading is impossible, no one can do it. Once they begin a string of winners, or a big win, then their belief begins to change, thinking that maybe it is possible. Notice how we had an initial belief, based on some criteria, or string of memories, that created it. Once a different criteria was placed in the experience pool, the belief was somehow distorted or changed. From my personal example.
Changing My Belief I started actively trading in 1997. It was a fairly strong bull market. It was easy to blow stops and still have most of them come back to make me whole. The tech sector was on fire. I could put on trades one day, take my daughter’s to the pool, come back and see where I was. I had no bad experiences. Nothing of a stock that was down, was down for too long, and eventually came back to make me profitable. I was creating a belief that all I had to do was, buy and hold. This is just so easy. Then in 1998, I was awaken to a margin call. This negative experience distorted my view that "trading was just so easy". With the same momentum of my portfolio to the upside, it crashed to the downside. It was at this moment, that I had to create a different belief and it was one I "chose" to change. I had to learn about deeper issues of market functions and eventually about trading psychology. Evidently, the game wasn't just buy, hold and hope. The market would find a way to take the money from those that traded in this fashion. And it cleared many out unfortunately last year that thought just like this. So what does my belief about trading entail now? Trading is a game that includes a funny circle.
● I started, making money with no effort. ● I continued, lost money with no effort (it doesn't take any effort
to not press sell button) ● I continued, learning all I could about the market and myself
(considerable effort) ● I am here now, trading again with basically minimal "effort".
The difference? I traded with no effort from the beginning with the lack of fear because I had nothing to tell me there is something to fear. A margin call instills fear. I learned risk and management principles, as well as develop my inner self to trading. Now I have nothing to fear again. I don't feel the market can ever take more from me than I'm willing to allow it. It’s interesting how a beginner and an experienced trader, can have the same belief, with a separate understanding of the same market.
Are you Willing to Take Responsibility? The major point about this: the beginner's beliefs about trading are based on "the market making and taking his money". The experienced trader knows that it's "himself" that is accountable for his trading and the money he risks and makes on each individual trade. The beginner will never be able to progress to a professional unless he changes this belief, that trading is about you and your accountability, and has nothing to do with what the market "does to you". There are two more beliefs that I feel are major and then one or two minor ones that I want to discuss.
The System is Successful or You Are? The next major belief is "trading systems". We have seen so many out there, numerous texts on the subjects and I'm sure many more to come. "If I can just find the right system, trading will be piece of cake". We know this to be false, as everyone's system doesn't yield consistent winners from individual to individual. One trader makes more money than the other or doesn't make money at all. The system is the same, why are the profits different? Trading again is about you and the market is just a reflection of who you are at any given moment.
Let's go a bit deeper. The market moves up and down, as aggregate shifts of demand and supply lean to one side or the other. This happens at all kinds of price levels. This basis for movement is what we as traders try to define and profit from. Some see it on a tape

reading platform, some TA, and some don't on anything (they make it up as they go). When I first brought up a chart of a stock, I saw a hill. I didn't see support/resistance. I didn't see capitulation events. I didn't see euphoric events. I didn't see accumulations. I saw a hill. Why? Becasue there was nothing from previous experience to tell me what that hill meant, what moves within that hill were made up of. I even went so far as to send my father a chart, detailing points of highs and lows saying,
"I'll buy here, and sell there, when I sell there, you short and cover at the low. Then I'll buy again, we'll make a killing."
As funny as this is, this was actually a great first step in my progression. As I was trading, not seeing trading as this easy, not being able to "buy the absolute bottoms, sell tops" 100% of the time, I realized that there was much more to it. So I began to change my beliefs on what "system" I wanted to use. Mind you, I still didn't totally realize that trading was about me at this point. I still was working on market functionality at this point. I used Ken's over at MT for a while, before learning more about what Vadym taught me. While I was using Ken's methods, I began to try things on a mechanical basis. The gainers/dumpers methodology. Again, I was running into the same problem when I first began that I did when I was circling all highs and lows on the historical chart and saying, "you do this here, I'll do that there." Things were easy to see, but doing it still wasn't bringing consistent profits when I first began it.
The Problem Was Me I saw many others making money on their posts, so figured it had to be working, and "I" was just not figuring it out yet. My belief was the trading system was infallible, but I was not making it work right. Thankfully, at this point in my trading, Vadym began to buzz in my ear a bit more about personal accountability, seeing things at deeper levels, trading based on what is seen, not thought, etc. My beliefs began to change, not so much about the system, but about my place in it. I went from thinking "the system works, I suck" to "the system is just a system, I need to find out what in me won't allow it to work" You have to realize that anyone's trading system, no matter what "potential" it offers on any given day, week, month, is normally not realized by individual traders. You see trade performance for a week at +20 points. This assumes you trade every single trade, stop out at best price all the time, get in at best price all the time and sell at best prices all the time. Impossible.
What is needed is a change in a belief that: the system produces "x" potential and I can't do it so I stink at trading to "I know that no

system by itself is the key to profitability, it is how I choose to develop my inner self" to fully take part in opportunities provided by the system. This takes us to our next major belief.
You Make Profit and Loss Those who think that the market provides profit and loss are in my mind, mistaken. You, yourself, your choices decide this. To let the market dictate your profit and loss to any degree outside your parameters, you lose control of your trading. The market is neutral. It will go up and down regardless of your position. It doesn't know who you are, nor does it care. It goes up, making emotional longs happy and emotional shorts unhappy. Vice versa with shorts. I added "emotional" because I will discuss emotion a touch later. The idea here is that you, at this very moment, have some feeling within you about yourself, your trading. Either you made money this morning and are anxious to trade again, as you are confident or you didn't make money and are frustrated, ready to give up today. Or, you might be profitable and willing to rest this afternoon, or you lost money and are ready for revenge this afternoon. "I'll show this stupid market for taking my money".
I make my choices and after I make my choice, the market does whatever it wants, like it always does.
Many might think, "but if the market does what it does, and hits my stop or profit target, then how do I still have control?" The market moved to make me money or lose my money. You still have to hit the exit button right? How many times early on did we have a great profit, only to turn it to a loss? How many times did we have a small loss turned into a larger one? Even now, I still struggle with what I envision to happen, versus what I just did.
SYBS for example... 18 3/4 entry, 18 1/2 stop 18 1/2 entry, 18 3/4 exit, envisioning that it would go back over 19 if that was indeed the bottom. Where did the conflict come in? Maybe I just wanted to make money from this stock that took some of my money away before. Maybe I need a confidence builder. Maybe I just didn't want to be in it. Who knows. The point being., the market just moved how it wanted. It was my choice to exit where I did. And therefore, the control stays with me.
The Market Doesn’t Care About You

Your belief about the market hurting you, forget it. When you do, you regain control. When you regain control, what is there to fear? If there is nothing to fear, how can you fail? Even if you don't profit, if you trade "unemotional", where each uptick/downtick is not euphoria or pain, then you trade successfully. This brings me to a few more beliefs.
Don’t Let Anyone Dictate Your Decisions, Trust Yourself If the market can not hurt us, why is it that we feel other's opinions of stock movement can? How many times early in our trading do we enter a stock, someone says, market is moving in opposite direction, so we exit immediately? IF you have resolved to make a choice in entering that trade, knowing that market can not hurt you outside of your predefined risks, then how is it that one statement from someone you know can make you change your belief so fast? How many times are Vadym and I wrong? How many times does "x" person read the market wrong How many times do analysts downgrade the lows and upgrade the highs. You have to change your belief that other's opinions dictate stock movement to any great degree. Other's opinions are to define areas of interest. Reversal points, breakout points, breakdown points, range points, etc. Where I trade for 3/8 point, Vadym may hold for 1 point. The pivot was the same, the entry maybe different. But in the point I exit at 3/8, Vadym thinks I 'Know' something that he does not? When you do this, you lost control.
I'm long 'x' stock, and someone says, this stock looks weak, I'm shorting it. So I exit my long because I think he knows something that I don't? Nonsense, he just has a different perception. This guy just went short because why? Because something in the tape, something on the chart, something within him says, time to go short. This folks, is what makes the market work. Different beliefs about price action. If you begin to believe everyone else's, not trusting in your own, you will never progress into a successful trader. If you feel that "one guy's" contrary position creates a negativity in your position, unless this guy has millions, it's an argument that needs rectified.
The belief of one comment or one action by another individual dictates your view of the trade, needs to change to: "I believe in my perception of the trade, either the market does what it does allowing me profit, which I'll take, or it will create a small loss, which I'll take".
Market Outcomes are Uncertain. Creating Certainties is Not the Key To Success.
Last belief that I think is most important: Creating certainties will

lead to my success. How many traders pour through endless charts/books/seminars/trade shows/etc., only to not trade 6 months later? The more I learn, the better I will do? The more I know, the greater my pool of resources will become.
Let me ask you this:
Trader A...#1 ranked Market Analyst in the world. Fears losing money. Never traded his own account.
Trader B...High school diploma, trusts himself to do the right thing, accountable for his actions. Willing to learn what he needs to succeed, but isn't quite there yet.
You have 10K to give Trader A or B. I'd give mine to B, who would you choose?
Trader A, knows all there is to know, but can't make a dime. Trader B, willing to learn and is accountable for his trading. To me, B has a much greater chance to profit my 10K on active trading. The major point is this. The more you know, yes, this is much better than being ignorant about the markets. Creating certainties, in the sense that, "this outcome has to happen", is not what we are after. We are about putting the odds in our favor, having an unemotional approach to taking the opportunities before us. If we want certainty, we won't find it in the market. We've already defined the market as uncertain, moving how it does based on factors of aggregate supply and demand. There is no way we could know from moment to moment, knowing when these shifts outweigh each other, offering us more or less profit on each tick.
You must shift your belief that if "I know everything there is to know about the market, I will succeed" to, "I will learn all I can about the market, but still realize that I have to know and trust myself, when signals present themselves."
I can't have fear of loss, I can't let opinions of others dictate my trade, I can't second guess myself. I can't be emotional. I will see what I see, make my choice for entry, make my choice for exit. The market will decide which, but I will stay in control of my trade to execute at levels that I deem necessary for my survival as a trader. Douglas and McCall have done an excellent job going much deeper into this. I have only touched the surface of their much deeper insights.

All original materials: © 2003 Brooke Publishers, Inc. and Associated AuthorsComments: [email protected]

20 Golden Rulesfor Traders
Trading Masters NEW TO TRADING & TECHNICAL ANALYSIS?Click Here
WIZARDSTUTORIAL
HomeDaily
CoursesTactics
Resources
YOUR DAILY
MARKETGUIDE
Featuring
InteractiveTradingPicks
PICKS, CHARTS, SCANS, IDEAS &
PROFITSCheck outMORNING TRADER
NOW!
andEVERY MARKET
DAY!
R.H.Y.T.H.M. TRADING Vadym and I searched for the right word to encompass our trading style and philosophy and the word we derived was Rhythm. Months ago when we were discussing our ideas and thoughts about how the market works and we interact with it, we tried to describe this with one word. Momentum wasn't necessarily fitting as it doesn't dive too deep into the mental process. Responsive trading we tried but it didn't seem to work much with the mechanical side of trading which is necessary in order to develop the eventual intuitive state that many traders find. We basically wanted a word that would allow us to realize the correlation between the mechanics of the market (rules the market follows) and our part in choosing to become a part of the greater entity.
We finally after many scans of the dictionaries and thesaurus came up with Rhythm to describe it fully. In terms of any sport or talent that requires precision, i.e. playing the guitar, throwing a football to your wide receiver and picking entries and exits to stock action, the individual realizes that there are mechanics to the craft and a sense of feeling in touch with movement and result that needs to occur. The musician has to understand how to play the guitar but also must listen to the music so that he/she is not off key. Eventually the musician comes to feel the music and is able to create music by him/herself.
Developing Your R.H.Y.T.H.M.
POWERFULONLINE
TRADINGCOURSE
FromHARD RIGHT EDGE
YourOriginal Guide
toSuccessful
Short-Term Trading
Highly EffectiveMarket Strategies
and3-D Charting Techniques
GetMore Info

Powerful Tools
for Traders
Complete 7-Bells Scansand More
Info
The football quarterback has to know how to hold the football and learn to throw it correctly. Eventually he/she needs to learn to feel where his receivers are moving and how much to lead the receiver. They become a part of a rhythm with those things around them, whether its other instruments, other players and for us, with what the tape tells us. Having a rhythm with a trade or a market closes your circle from understanding the rules of the trade to having the sense of when to enter and when to exit.
I was asked one day about why I thought EGRP would be a slow trending stock. The easy answer was given but the deeper sense of the trade is something that can't be explained. It was a simple feeling based on past experience both in watching this stock as well as plenty of experience in watching other stocks with the same "type" of action. Eventually, you develop the same rhythm that other talents do. In cases where we aren't in this rhythm, our rules of money management and stop loss allow us continue to learn. Otherwise, we fall into the trap of one trade wiping out a large portion of our portfolio. This does not allow the trader to continue the learning process.
I much rather see traders lose over time, gaining market experience along the way so that when they reach the plateau where the losing begins to turn to the uptrend, they know why they are succeeding. One or two losses and you are out doesn't allow you to learn the trade and you move out of this business in frustration and anger. So we came up with Rhythm and turned into the following Acronym to describe our trading.
R - Read and RespondH - Hold true to your convictions and decisions.Y - You are responsible for your trading and acceptance of profits and loss. T - Trust yourself, your skills, your actions.H - Harness the power of your strengths and learn and correct your weaknessesM - Master your emotions to develop Self-Control

Applying Each Letter and Definition
R - Read and Respond
This puts us in our first part of the learning process. Vadym and I teach Tape Reading Principles with our members everyday that are described in the workbook and in this Learning Center. These tape principles are not proprietary, not developed, not altered to fit a system. It is a system in itself that has been around for nearly 400 years. There is no sense of "our method of tape reading" and anyone that tries to change the true meaning simply detracts from its power. It is not just watching time/sales, it is not just looking at the prints. The workbook and this Learning Center show you much more than what this wrong and simple explanation of it is. The learning phase of the workbook and Learning Center is something that Vadym and I will continually discuss with you through any confusion. The concepts may be foreign to you, but they are explainable and understandable with a little effort on your part. After this effort to understand the concepts of the tape reading is completed, the next step for the trader is to respond to its signals. We call these pivot points.
Pivot points are areas where action demands response to enter or sit tight. Not all setups are taken and not all action is tradeable. Two examples: BMCS setup at 21 as a breakout. No action was taken but offered great potential. CCUR setup as a breakout over 6. No action was taken and it’s failing. INKT offered 3 trades. They were all profits on each setup taken. The response is demanded by you, not by the setup itself. Eventually, that rhythm, that feel, will come into you to know which setups cause the response and which don't. If you are at this point, we will continue to develop your feel with you. If you are still at the learning phase of the concepts, do not push yourself and let us work with you to get to the point eventually. Learning to trade is a process, not an event.
H - Hold true to your convictions and decisions.
Traders begin to respond to signals through what the tape tells them, whether it's from a chart or not. When the signal is given and the response is for entry, hold the conviction that your trade will produce a profit. Imagine the success of that trade as the entry is given. Do not let the imagination however cover reality. When the stock begins to speak to you to exit, that enough profit is there for building the confidence...take it. We can work on the holding of trades for longer periods throughout this process of holding true to your convictions. If you immediately doubt your entry, there is no process to develop your conviction. There is no way to progress. The assumption of loss is taken already by way of stop loss, if you enter the trade, trust your decision and give it time to breath.

Y - You are responsible for your trading and acceptance of profits and loss.
The market is our teacher. We are its students. The market will punish us only if we let it. We have powerful tools to regain control of ourselves both tangible and mentally. Stop loss, money management, proper mental understanding , etc. As strong as the market is, it's not anymore powerful than you let it be. Talks of conspiracies, manipulations and fraudulent actions are not things you can control. They happen. Maybe more often than we know about. The point being is that "your" trade, win or lose, is not to be blamed or applauded from such information. Theories of worthlessness such as these do not allow your trading to progress because accountability is no longer yours. It's that big "THEY" entity that rules your trading. You think "THEY" will allow you to win over time? No, so you must regain control of your trading and not develop false ideas about why your trading is the way it is. Do not blame and do not complain. You are responsible for entering and exiting each trade and each market. Your decision, to which you hold true, demands accountability for the rest of the time that that position is open. Once that position is closed, you assess the trade from personal thoughts, why you entered, why you exited. Nothing else matters.
T - Trust yourself
Trader's need to trust themselves and their decisions. If you can't trust yourself, how can you possibly progress? If you are constantly doubting yourself and your decisions, how can you trust yourself to know to take the trade? If trading resides in you, AND IT DOES, then the personal trust that you must offer yourself is an absolute necessity. If you can't trust yourself to respond to the signals and the setups, you will not be able to trade successfully, consistently. If you are in constant anger about yourself or disappointment in why you took a trade, it reflects upon you and your inner self, your self-control. If this is not in an optimal state of mental control, then you are fighting a battle not only within you, but also within the trade itself. If your thoughts are clouded with anger, the clarity of stock action is clouded to. This will not allow progressions. Trust yourself both in decision and your skills to execute the trade.
H - Harness your strengths and understand your weaknesses.
What is it about you that makes you a trader? Why did you choose this business? What strengths about you provide you with the right temperment to trade successfully? You like risk taking, able to make quick decisions, unemotional, etc.? Here are my thoughts taken from a list that Vadym offered me:

● The market exists to give me profits ● Trading is fun, not a frustrating experience ● If the market doesn’t do what I expect then I must reconsider ● Money is not the subject of my focus; stock movement is ● Losing is part of the process of making money. Any particular
loss doesn't make me a loser. ● Trading is a game, I know I can win ● Every losing trade is an opportunity to learn. I am learning
constantly ● I don't have to be in market all the time. I can wait for an
opportunity to come. ● I don't trade for recognition, I don't have to prove anything,
others opinion is not of interest for me ● These are my strengths that allow me to focus on the trade,
which is the only thing that matters once I take it.
What are my weaknesses?
Plenty, but two major ones: Ego and it constantly nags at me. When I am in a great day, such as 3 straight wins on INKT, I feel less vulnerable. I feel like nothing can touch me. If I was not aware of this feeling, I would certainly have some negative event tell me that I am not this good, usually leading to a large loss. I am aware of this feeling and I control it to some degree, not taking atypical chances. But there are times when my ego inflates my expectations and it's something that needs constant control and awareness.
Another one is the ability to expand my intuitive perception of stock action. I can make 1/4 and 1/2 all day long. But for me, my personal goal and a my ending "nirvana" is to continue the process by which I can take more out of each trade when the risk evaluation is safe and the stock continues to "behave" so to speak. I want to enhance my "rhythm" with stocks that have more potential and it is a very big uphill battle still to do so. It's a weakness, but one that I am aware of and one I continue to develop.
Lastly:
M - Master your emotions
Emotional control is a very tough subject. It comes to me with understanding my traits as a trader. The early emotions of a trader are fear of loss and expectations of great gains. There is no way a trader with these two emotions can progress. The fear of loss does not allow a trader proper risk control having larger stop losses. Greed of great gains in each trade does not allow one to read the stock as it moves. The trader will catch a few nice ones, but the losses tallied in expectations of these gains everytime will outweigh the overall gains.

Fear on the other end is a lack of response. The signal says enter, the mind says don't. This is where trusting yourself is big.
Don't think, respond. You think, you hesitate. You ask "really" when "rate cut" is announced and you miss the entries. See the signal, respond. Developing and retaining self-control through proper mastering of emotions will allow you clarity in watching market action as well as individual trade action. Let the R.H.Y.T.H.M become a part of your trading to successfully progress as a trader.
All original materials: © 2003 Brooke Publishers, Inc. and Associated Authors
Comments: [email protected]

20 Golden Rulesfor Traders
Trading Masters NEW TO TRADING & TECHNICAL ANALYSIS?Click Here
WIZARDSTUTORIAL
HomeDaily
CoursesTactics
Resources
YOUR DAILY
MARKETGUIDE
Featuring
InteractiveTradingPicks
PICKS, CHARTS, SCANS, IDEAS &
PROFITSCheck outMORNING TRADER
NOW!
andEVERY MARKET
DAY!
DAY TRADING THE MORNING GAP One of the most frustrating aspects of day trading can be that gap up or down. For one thing, much of the day's move is often spent within the gap itself, leaving little for the remainder of the day. But here is a relatively simple method for determining the day's top or bottom, based on what I call the "50% Phenomenon", which occurs very often in the intraday charts.
The rules are easy to remember.
1. The gap must come after a ReversalA stock that has been moving up, will peak and turn back down, or maybe consolidate sideways a little first. Then the next morning it gaps down. It is at this high point that we begin our calculations.
2. Measure the white space of the gap, and not necessarily the open and closing points.Since most day trading charting software has Fibonacci lines built in, use this tool to drag your 50% line exactly halfway between the low of the upper gap and the high of the lower gap. This usually happens in the last half hour of the previous day, and the first half hour of the new day. In the chart below, notice how the last half hour saw the low, and then ticked up a couple bars before the close. The next day saw a high after a few bars. We are not measuring the gap between the open and close; instead we are interested in the white space of the gap itself.
Now note how the bottom of the day was very near our 0% line before it turned back up. The 50% Phenomenon gave us our low of the day target within the first half hour of trading.

Powerful Tools for Traders
Complete 7-Bells Scansand More
Info
3. The 50% line could be at the beginning of the gap, the center of the gap, or the end of the gap.If you're thinking that the above chart was a bit too easy, you're right. Here we see a gap with upward momentum. Notice that the 50% line was placed at the beginning of the gap, rather than the middle. Placing the 50% line in the center of the gap would have given us an incorrect target for the day's high.

In this example we see that the correct placement of the 50% line was actually the end of the gap. This chart is moving downward, so don't confuse it with the chart above. Also note that I averaged the high of the first half hour, choosing the highs of the first two bars -- which were in agreement -- and ignoring the third bar high. After all, chart reading is a combination of art and science, with a little bit of voodoo for good measure!
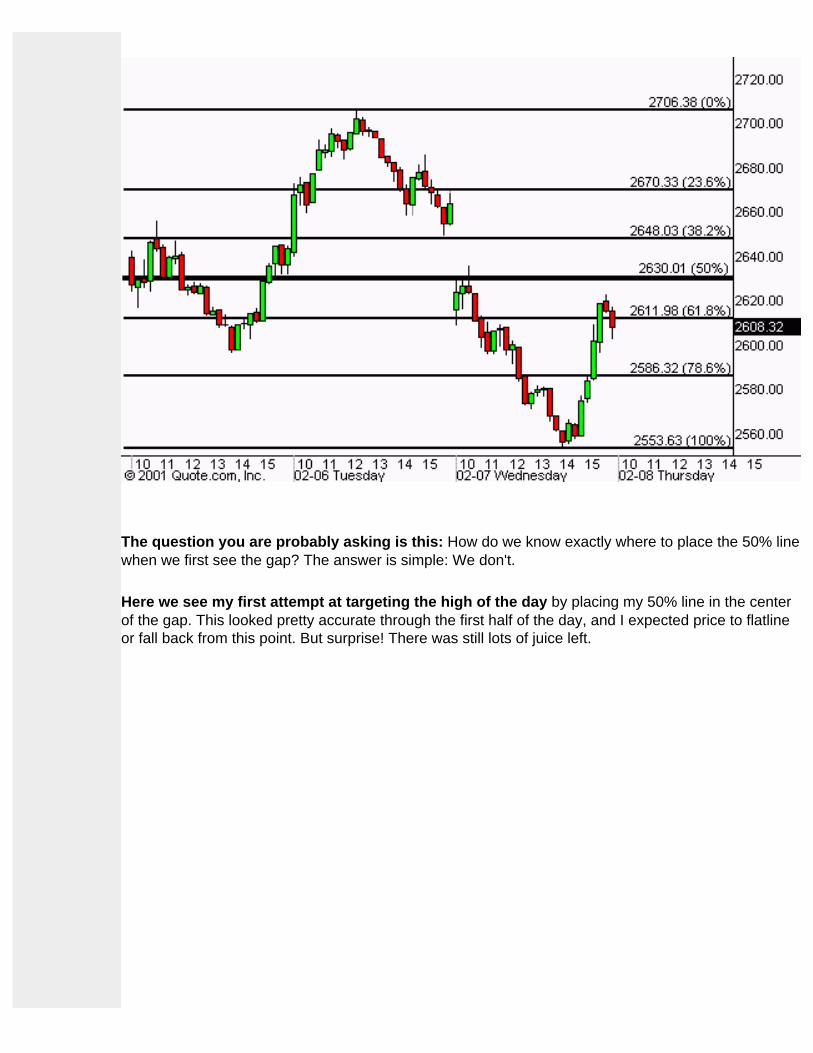
The question you are probably asking is this: How do we know exactly where to place the 50% line when we first see the gap? The answer is simple: We don't.
Here we see my first attempt at targeting the high of the day by placing my 50% line in the center of the gap. This looked pretty accurate through the first half of the day, and I expected price to flatline or fall back from this point. But surprise! There was still lots of juice left.

Once I saw that price would continue its ascent, I moved my 50% line up to the end of the gap. This time the target for the day's high was accurate. My standard practice is to assume the center method is the correct one, until proven otherwise, simply because that scenario is a little more common. But I am always on the lookout for signs that this is not the correct choice, and I never hesitate to adjust my lines accordingly.

Now here is something interesting. We have two gaps in succession. When I saw this one morning I remembered that the 50% Phenomenon worked from the base point of a reversal, so I didn't think it would work for that second gap. But you can see by the naked eye that it would have anyway. By using the high of that middle day (the 9th) as our foundation point, and placing our 50% line in the center of that last gap, it would have correctly targeted the low of the day the 12th).
But that is not what is so fascinating about this chart. Notice that the center of the middle day, is the correct 50% Phenomenon point for the 3-Day move.

Taking the 50% Phenomenon a step further, we see that it can also work within periods of consolidation. Note the gap. The standard center method worked very well in targeting the bottom of the next day (black line set). On the third day I noticed that much of the day was a "flatline," so I placed my 50% line right through the center of it, which accurately targeted the bottom of the fourth day (blue line set).

As with any chart pattern, the 50% Phenomenon doesn't work every time, so it's essential to have a stop-loss strategy. But once you begin to look for it, I think you will be amazed at how often it appears, and how reliable it can be.
About Part Time Trader:Rick LaPoint is founder of PartTimeTrader.Com, a popular speaker, and creator of the unique FibCalc Fibonacci Calculator. His methods and market observations are topics of discussion in bulletin boards and chat rooms all over the world. Under no circumstances does the information in this column represent a recommendation to buy or sell stocks.
The opinions expressed are based on how Rick interprets Events, the Market, and the Charts -- unless otherwise noted -- and are not recommendations to buy or sell securities. Trading stocks involves risk. Never put your money on the line without a thorough understanding of what you are doing, and why you are doing it, based on your own personal experience. No Chart Pattern works out the way we think it should every time, so it is vitally important to have a protective Stop-Loss and/or Exit point planned before entering into a trade. Do your own research and testing before attempting any of the techniques.
All original materials: © 2003 Brooke Publishers, Inc. and Associated Authors
Comments: [email protected]


20 Golden Rulesfor Traders
Trading Masters NEW TO TRADING & TECHNICAL ANALYSIS?Click Here
WIZARDSTUTORIAL
HomeDaily
CoursesTactics
Resources
YOUR DAILY
MARKETGUIDE
Featuring
InteractiveTradingPicks
PICKS, CHARTS, SCANS, IDEAS &
PROFITSCheck outMORNING TRADER
NOW!
andEVERY MARKET
DAY!
Powerful Tools
for Traders
DANGERS OF DEFAULT CHART SETTINGS The very first aspect of charts we need to clarify is something that new chart readers miss. Indeed, it often takes considerable time before realizing that something isn't quite right. Most software applications for chart reading have two methods for scaling. Scaling is the way we see the prices on the side, and the dates at the bottom of a chart.
The settings can have several variations of names, depending on the software. They are arithmetic (also known as Linear, Logarithmic, and possibly others), and logarithmic (which has also been called log, automatic, and semi-Log). Yes, it gets confusing right from the start, especially considering both chart styles have been called logarithmic. Most software defaults to logarithmic / semi-Log. What this means is that, as the price of a stock rises, the scale is averaged out to give more weight to the lower prices. This is useful for comparing the percentage of change between a low priced stock and a high priced stock, or the percentage of change within the same stock over a period of time.
Be sure to find out exactly how your charting software determines scaling. Go to the help and look up each of the words above. Read their definitions so you are sure how they are determining scale.
When looking at the chart, a small dip a year ago would look the same size as a larger dip today, even though the stock has risen substantially within that year. But the percentage of the change would be the same.
Why would you want to do this? Because if a $50 dollar stock is gaining 2% day, and a $150 stock is gaining 2% day, it may not be as apparent by looking at the charts. The Logarithmic scale would allow you to see the two stocks side by side as a pattern, exclusive of price.
But if you are drawing trendlines, you could end up with a distorted picture. Lets look at the Nasdaq. This chart is in Logarithmic scaling from 1975 through 2000. See the nice clean uptrend? Also notice that the Crash of 1987 and the Crash of April 2000 are about the same size. And note that from the bottom of the chart scale up to 1000 is almost 2/3 of the chart. From 1000 to 5000 takes up the remainder of the chart. This is obviously giving you a distorted picture of the actual price action.
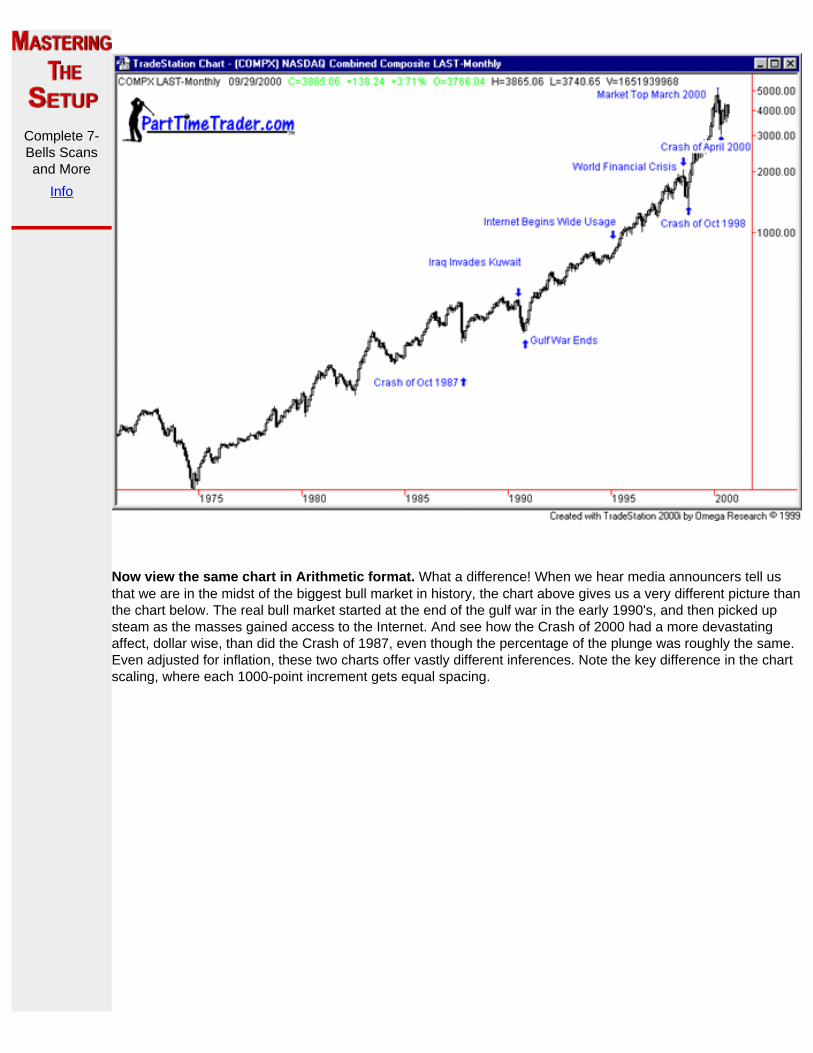
Complete 7-Bells Scansand More
Info
Now view the same chart in Arithmetic format. What a difference! When we hear media announcers tell us that we are in the midst of the biggest bull market in history, the chart above gives us a very different picture than the chart below. The real bull market started at the end of the gulf war in the early 1990's, and then picked up steam as the masses gained access to the Internet. And see how the Crash of 2000 had a more devastating affect, dollar wise, than did the Crash of 1987, even though the percentage of the plunge was roughly the same. Even adjusted for inflation, these two charts offer vastly different inferences. Note the key difference in the chart scaling, where each 1000-point increment gets equal spacing.

In my opinion, the arithmetic chart offers a much more accurate view of what is happening. As we shall see, this precision is very important in the anticipation of future price.
Let's look now at a weekly chart of the Nasdaq, to determine when price falls to the trendline. The chart here is in Logarithmic mode. Here we see that the trendline from the 1998 low moves up to the April 2000 low and the is confirmed by the low in September -- a very predictable stopping place that shows the trend doing just fine, thank you. Chances are, there is nowhere to go now, but up.

But wait. Not so fast. Now look at the arithmetic chart. Oops! We haven't even reached the trendline yet. Instead of bouncing, we may have more downside -- maybe all the way to about the 3500 level before things get any better. Optimism suddenly turns to caution. Keep in mind that we are only looking at the trendline here -- there may be other factors, like Support, for example, that could influence where the actual Bottom will be.
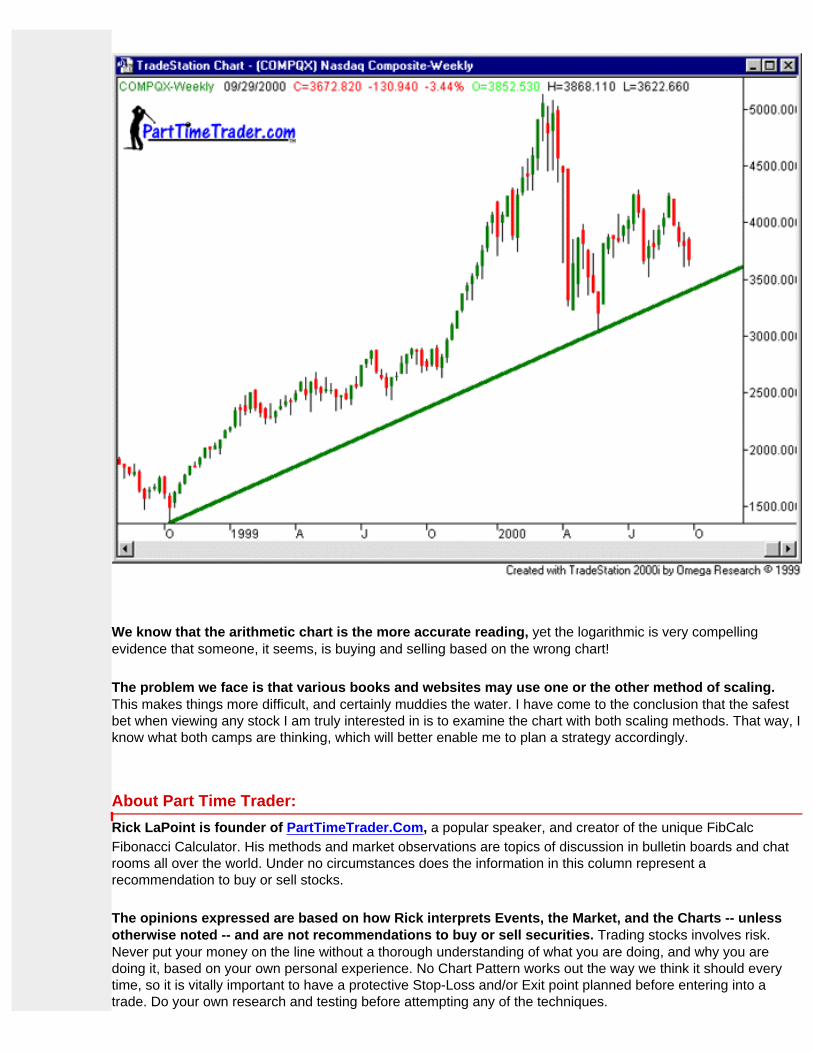
We know that the arithmetic chart is the more accurate reading, yet the logarithmic is very compelling evidence that someone, it seems, is buying and selling based on the wrong chart!
The problem we face is that various books and websites may use one or the other method of scaling. This makes things more difficult, and certainly muddies the water. I have come to the conclusion that the safest bet when viewing any stock I am truly interested in is to examine the chart with both scaling methods. That way, I know what both camps are thinking, which will better enable me to plan a strategy accordingly.
About Part Time Trader:Rick LaPoint is founder of PartTimeTrader.Com, a popular speaker, and creator of the unique FibCalc Fibonacci Calculator. His methods and market observations are topics of discussion in bulletin boards and chat rooms all over the world. Under no circumstances does the information in this column represent a recommendation to buy or sell stocks.
The opinions expressed are based on how Rick interprets Events, the Market, and the Charts -- unless otherwise noted -- and are not recommendations to buy or sell securities. Trading stocks involves risk. Never put your money on the line without a thorough understanding of what you are doing, and why you are doing it, based on your own personal experience. No Chart Pattern works out the way we think it should every time, so it is vitally important to have a protective Stop-Loss and/or Exit point planned before entering into a trade. Do your own research and testing before attempting any of the techniques.

All original materials: © 2003 Brooke Publishers, Inc. and Associated Authors
Comments: [email protected]

20 Golden Rulesfor Traders
Trading Masters NEW TO TRADING & TECHNICAL ANALYSIS?Click Here
WIZARDSINTERVIEW
HomeDaily
CoursesTactics
Resources
YOUR DAILY
MARKETGUIDE
Featuring
InteractiveTradingPicks
PICKS, CHARTS, SCANS, IDEAS &
PROFITSCheck outMORNING TRADER
NOW!
andEVERY MARKET
DAY!
INTERVIEW:Joe DiNapoli © 1998 Joe DiNapoli and Coast Investment Software, Inc.6907 Midnight Pass, Sarasota, FL 34242941-346-3801 Fax 941-346-3901
TradeNet Staff -Neal.: . . . . Sat, Feb 15, 9:57AM PST ( -0900 GMT)Please post an introductory paragraph explaining what you
do, how long you have been involved in the markets etc. to give readers some background information.
Joe DiNapoli: . . . . Sat, Feb 15, 9:57AM PST ( -0900 GMT)It seems that in one way or another, I've been involved
with trading all my life. In 1967 I finished engineering college and began seriously trading. Back in those days, I was dealing with low capitalized, small, over-the-counter issues, where you'd lose 15-25 percent just in the bid/asked spread. We used to margin those "equities", that's using the term loosely, at the company's credit union where I was working. It was definitely spooky. In those days, I was also involved in trading options on stocks. That's before they were listed on exchanges, like they are today. You talk about volatility, when you wanted to sell, the broker would say 'to who?'. It was strictly a bid by appointment situation. We'd generally ended up paying for an exercise to exit a position. I got involved in trading commodities , about 1980. I like the commodity markets. If you can develop strategies to effectively deal with the risk, the advantages far outweigh those of other markets. Since I've learned how to do that, I have substantially decreased the amount of stock and options trading that I do, but I'm still involved. About 1986 I began speaking, initially with Jake Bernstein, at the Futures Symposium International. That's when I started letting myself out to the public. It really mushroomed from there. I've spoken all over the world, in major centers in Asia, Europe, and the Middle East. In 1996 alone I've spoken in 22 different countries. That was a bit much, but I couldn't give up the opportunity to speak in places like Tallin, Estonia, St. Petersburg, Russia, and
POWERFULONLINE
TRADINGCOURSE
FromHARD RIGHT EDGE
YourOriginal Guide
toSuccessful
Short-Term Trading
Highly EffectiveMarket Strategies
and3-D Charting Techniques
GetMore Info
Powerful Tools
for Traders
Complete 7-Bells Scansand More
Info
Bombay. I've met fantastic people all over the globe. The industry has been nothing but good to me.
TradeNet Staff -Neal.: . . . . Sat, Feb 15, 9:57AM PST ( -0900 GMT)Tell us a bit about your trading/investing style, how do you
go about it?
Joe DiNapoli: . . . . Sat, Feb 15, 9:57AM PST ( -0900 GMT)The trading techniques I use are substantially different
than those used by other people. I mix leading and lagging indicators and interact with prices based on that approach. I use certain lagging indicators like Displaced Moving Averages and the MACD/Stochastic combination, to determine the trend. Once I'm in a trend, I use Fibonacci analysis, as a leading indicator, to position myself within that trend. The last step is to take Logical Profit Objectives. Those profit objectives are calculated by certain Fibonacci techniques. The approach is mine, since I've spent an awful lot of time developing it. I use Displaced Moving Averages, for example, in very specific and unique ways. I think I've really done my homework on that one, about 3 years worth of research in the early '80s. During the mid-80's, I spent another three years or so determining the most effective method to utilize Fibonacci techniques. I think I've done a good job of separating the best, from the good, or the average. Sometimes it's not a matter of developing a brand new indicator. It's a matter of utilizing an existing indicator in a more effective manner.
TradeNet Staff -Neal.: . . . . Sat, Feb 15, 9:57AM PST ( -0900 GMT)Can you give an example of what you mean by using an
existing indicator in a more effective way?
Joe DiNapoli: . . . . Sat, Feb 15, 9:57AM PST ( -0900 GMT)OK, lets take moving averages. Instead of using standard
moving averages, I use Displaced Moving Averages. In fact, back in the mid '80s, when I started speaking about this, there weren't any computer programs out there that I was aware of, except our own, that would displace a moving average. Prior to that, some people used the opens, instead of the close, to determine the moving average, so that they would know what the moving average value was, before the end of the day. When you displace a moving average say five days, you know what the moving average is going to be up to five days out. There was no longer any reason to use the open. Unfortunately, many of the graphics software programs that displace moving averages today, don't show them past the last days price action. It's an example of programmers creating trading software, rather than traders.
HRE SPOTLIGHT
TechnicalAnalysisMasters
John Murphy

TradeNet Staff -Neal.: . . . . Sat, Feb 15, 9:57AM PST ( -0900 GMT)What are your profit objectives, and do you have a long-
term or short term outlook?
Joe DiNapoli: . . . . Sat, Feb 15, 9:57AM PST ( -0900 GMT)My profit objectives are a function of the time frame I am
trading in. Weekly objectives are much larger than objectives calculated on a five minute chart. The methods of calculation however is exactly the same. If there is one single thing a trader can do to vastly improve his win/loss ratio, it's to use logical profit objectives consistently in his trading plan.
TradeNet Staff -Neal.: . . . . Sat, Feb 15, 9:57AM PST ( -0900 GMT)How about the downside, what risk tolerance do you
have?
Joe DiNapoli: . . . . Sat, Feb 15, 9:57AM PST ( -0900 GMT)I have a very low risk tolerance . I once heard futures
trading described as learning how to juggle dynamite. That's not a bad definition .These days it's the same situation for stocks even though we're in this incredible bull move, just look at the volatility. What you have to get used to is controlling greed so you can realize consistent profit! For a variety of reasons most people can't do that.
TradeNet Staff -Neal.: . . . . Sat, Feb 15, 9:57AM PST ( -0900 GMT)What steps do you take to control the downside?
Joe DiNapoli: . . . . Sat, Feb 15, 9:57AM PST ( -0900 GMT)Fibonacci analysis , along with my trend indicators tell me
clearly if I'm wrong or if I should get out of a trade. When that happens, I exit at market or look for a way out.
TradeNet Staff -Neal.: . . . . Sat, Feb 15, 9:57AM PST ( -0900 GMT)Please describe the best and worst investments/trades
you have made.
Joe DiNapoli: . . . . Sat, Feb 15, 9:57AM PST ( -0900 GMT)'Hot' uninformed tips are always the worst. Often they
come from an entity that is trying to gain commissions or has a

position in the instrument they are tipping. Sometimes big bull moves bail everyone out... that's where the old adage about not confusing a bull market and brains comes from. Informed trading situations that fit my investment criteria are the best and most rewarding trades.
TradeNet Staff -Neal.: . . . . Sat, Feb 15, 9:57AM PST ( -0900 GMT)Trading/investing is a highly competitive endeavor, what
gives you an edge in the market?
Joe DiNapoli: . . . . Sat, Feb 15, 9:57AM PST ( -0900 GMT)Experience, control, and an excellent approach- as in a
method -to trading
TradeNet Staff -Neal.: . . . . Sat, Feb 15, 9:57AM PST ( -0900 GMT)Everyone is familiar with the old maxim "cut your losses,
and let your profits run". Many traders have difficulty deciding when to capture their profits, sometimes letting a profit turn into a loss. What do you use to make a sell decisions to close a trade?
Joe DiNapoli: . . . . Sat, Feb 15, 9:57AM PST ( -0900 GMT)I don't do either. My profits are let to run only to the extent
of a pre calculated objective. This doesn't mean I never have distant objectives, it all depends on my time frame for the trade. Also, I might get back in to the same instrument but it will be only at 'safe ' pre calculated levels. I don't cut my loses, The market does , by violating a pre calculated level or indicator. I just exit the same way I'd get off a street if a truck was bearing down on me. The trick is in having the criteria to see the truck, then the experience and discipline to act on it.
TradeNet Staff -Neal.: . . . . Sat, Feb 15, 9:57AM PST ( -0900 GMT)What advice can you give to someone who is just entering
this field? What would you do to shorten the time and reduce the losses that are usually involved in the learning cycle?
Joe DiNapoli: . . . . Sat, Feb 15, 9:57AM PST ( -0900 GMT)People trying to gain profit out of this game have a lot of
challenges. I'd recommend they seek out traders who know what they are doing AND have the ability to explain what they are doing to others. There's a real educational issue here. If they are working the short time frames ,like 5 minute charts, there's understanding floor mechanics as well. Once they have all that down, then they have to master control... anyone getting week knees out there?

TradeNet Staff -Neal.: . . . . Sat, Feb 15, 9:57AM PST ( -0900 GMT)If you were to find a perfect trade, what would it be?
Please describe what it takes for a trade to be lined up with "all its ducks in a row".
Joe DiNapoli: . . . . Sat, Feb 15, 9:57AM PST ( -0900 GMT)I'll have to answer this in a general way since most of you
are unfamiliar with the specific aspects and details of my trading approach. Trades need to conform to the following criteria. I've used this approach continuously for years. I buy dips in an uptrend and sell rallies in a downtrend. The lagging indicators allow me to determine trend. The leading indicators, primarily Fibonacci analysis, allows me to "safely" place myself within that trend. I use Logical Profit Objectives continually and I have oscillators, that are used as filters, to keep me from entering in the direction of a trend which is too dangerous to bother with. I also have about 8 trading patterns or conditions which act to give me the direction of a market. If they are in conflict with the trend analysis, I always go with what the patterns are telling me. Within that criteria there are obviously standout situations but you wouldn't understand the terms I would have to use to describe them.
TradeNet Staff -Neal.: . . . . Sat, Feb 15, 9:57AM PST ( -0900 GMT)What markets do you trade?
Joe DiNapoli: . . . . Sat, Feb 15, 9:57AM PST ( -0900 GMT)Markets that move and conform to proven money making
situations. In 95 one of my biggest trades was in the soy bean meal market. I hadn't traded meal for over ten years. The setup was perfect and I moved on it.
TradeNet Staff -Neal.: . . . . Sat, Feb 15, 9:57AM PST ( -0900 GMT)Would this be appropriate for mutual funds?
Joe DiNapoli: . . . . Sat, Feb 15, 9:57AM PST ( -0900 GMT)The unqualified answer is yes, but there can be some
difficulties. Let's say you're trading a foreign bond fund. The managers of the fund may involve themselves with certain hedging or option writing activities which could affect price in such a way that the Fib analysis would not be as accurate as it would be if you had a pure cash market trade. All in all however the Fib analysis works very well in mutual funds.

TradeNet Staff -Neal.: . . . . Sat, Feb 15, 9:57AM PST ( -0900 GMT)Is your system mechanical?
Joe DiNapoli: . . . . Sat, Feb 15, 9:57AM PST ( -0900 GMT)No, but the secret to making a judgmental system good is
to make as much of it as possible non-judgmental.
TradeNet Staff -Neal.: . . . . Sat, Feb 15, 9:57AM PST ( -0900 GMT)How do you calculate the trade profit objective?
Joe DiNapoli: . . . . Sat, Feb 15, 9:57AM PST ( -0900 GMT)I use one or both of two methods. The first is Fibonacci
analysis, see the Fibnodes Web pages. I also use the Oscillator Predictor.
TradeNet Staff -Neal.: . . . . Sat, Feb 15, 9:57AM PST ( -0900 GMT)What % gain and % loss is typical for your trades?
Joe DiNapoli: . . . . Sat, Feb 15, 9:57AM PST ( -0900 GMT)It depends on the volatility and time frame of the
instrument.
TradeNet Staff -Neal.: . . . . Sat, Feb 15, 9:57AM PST ( -0900 GMT)What displaced moving averages do you use? For which
markets?
Joe DiNapoli: . . . . Sat, Feb 15, 9:57AM PST ( -0900 GMT)I use the same DMAs for all markets. One the ways you
can tell if you're on to something good is if it works across different markets. Otherwise you get into this curve fitting morass that buries so many new technical traders. I use the 3x3, 7x5, 25x5. They are all simple moving averages of the close. The second number is the displacement amount.
TradeNet Staff -Neal.: . . . . Sat, Feb 15, 9:57AM PST ( -0900 GMT)Are those moving averages appropriate for longer-term
traders (daily charts)?

Joe DiNapoli: . . . . Sat, Feb 15, 9:57AM PST ( -0900 GMT)Yes, in fact I use DMAs for daily, weekly, and monthly
charts. I use the MACD Stochastic combination for intra-day as well as daily, weekly, and monthly charts.
TradeNet Staff -Neal.: . . . . Sat, Feb 15, 9:57AM PST ( -0900 GMT)Do you trade other people's money?
Joe DiNapoli: . . . . Sat, Feb 15, 9:57AM PST ( -0900 GMT)No, not interested.
What is the worst monthly draw-down you experienced in the past year?
Joe DiNapoli: . . . . Sat, Feb 15, 9:57AM PST ( -0900 GMT)That is proprietary information, but it was nothing serious.
TradeNet Staff -Neal.: . . . . Sat, Feb 15, 9:57AM PST ( -0900 GMT)Can you give us an idea of your win/loss ratio?
Joe DiNapoli: . . . . Sat, Feb 15, 9:57AM PST ( -0900 GMT)For legal reasons I'm reticent to quote numbers, but I will
say that employment of these methodologies thoughtfully and correctly can lead to 70 to 90% winners. Some of the reasons you can get such good ratios has to do with the exit criteria as well as the profit objectives. Let's say a mental stop is violated. Rather than exiting at the market or getting hit, you can develop a Fibonacci retracement series and exit at a much more favorable point. This can turn small losers into small winners or break even situations.
TradeNet Staff -Neal.: . . . . Sat, Feb 15, 9:57AM PST ( -0900 GMT)Are your techniques published? Can I read about them
somewhere?
Joe DiNapoli: . . . . Sat, Feb 15, 9:57AM PST ( -0900 GMT)I have Trading Courses available. With them you get me at
no additional charge, within reason of course. Hopefully we'll have a book out later this year, but there continues to be technical difficulties in getting it done the way I want it done.

We now continue with the spontaneous questions which arose during the actual conference. Some of the questions and replies have been edited for clarity.
Techharry: . . . . Mon, Feb 17, 8:53AM PST ( -0900 GMT)I'd appreciate if you can comment on the soybean market, where is it going short term, and in the coming months? looking forward for Wednesday's conference.
TradeNet Staff -Neal.: . . . . Mon, Feb 17, 10:40AM PST ( -0900 GMT)Hi TechHarry.. Thanks for posting a question.. Joe
DiNapoli will answer questions posted here during the conference on Wednesday.. The purpose of the conference is to discuss Joe's successful methods rather than making market calls. If the soybean market is making moves appropriate to Joe's methods, he would comment on it on Wednesday evening.
CACTUS: . . . . Mon, Feb 17, 2:49PM PST ( -0900 GMT)Hi. It would be very interesting if Joe DiNapoli can explain some about the Fibonacci Arcs, in specific terms, which arc of the three is the most important to put as objective for support or resistance. And what factors in your judgment do I have to focus for make the best performance of my Fibonacci analysis?
shawn: . . . . Mon, Feb 17, 7:58PM PST ( -0900 GMT)Can you explain the basic principle of the Fibonacci Arcs, Thanks
Hugh (San Diego): . . . . Mon, Feb 17, 8:58PM PST ( -0900 GMT)Joe- I've never used Fibonacci numbers in trading. What are the basic principles I need to know to get started crunching the numbers, and what are some possible buy and sell rules?
CLARENCE: . . . . Tue, Feb 18, 11:53AM PST ( -0900 GMT)Neal, where do I find Joe DiNapoli's web page?
TradeNet Staff -Neal.: . . . . Tue, Feb 18, 8:32PM PST ( -0900 GMT)Clarence, good question! Check Joe's web pages.. you
can also email joe at [email protected] -Neal.
tcs: . . . . Tue, Feb 18, 6:55PM PST ( -0900 GMT)Joe ... would you discuss displaced moving averages?

Joe DiNapoli: . . . . Sat, Feb 18, 6:56AM PST ( -0900 GMT)Hello tcs, DMA'S will be a part of the forum. They are a big
part of the way I trade
lane: . . . . Tue, Feb 18, 6:56PM PST ( -0900 GMT)Joe is a great guy and trader. I have known him for several years now and truly respect him. He certainly knows Fibonacci techniques! Lane Mendelsohn
Joe DiNapoli: . . . . Wed, Feb 19, 10:11AM PST ( -0900 GMT)Lane thanks,--your check is in the mail
Joe DiNapoli: . . . . Wed, Feb 19, 10:07AM PST ( -0900 GMT)To all, I can see from the questions that you'll likely find
some of my responses...surprising. This conference should be interesting for everyone, especially me since this is a new medium for me. It will be a lot less structured than those I hold in a normal workshop setting. One thing I'll try to refrain from is the dispensing of "hot tips" or imminent market direction. Why? First of all, I'm a CTA and there are legal issues involved. Secondly, it would be a disservice to you unless you're familiar with the methodology I use. Let's say there's a double repo sell signal on the S&P cash. You might not know what that means but you can tell I'm very excited about it. You hold off a bit, I'm go short. The market climbs to the failure point. I reverse and go long. You go short at what you see is a more favorable price. I buy your sell. You get killed because you followed "my recommendation" not my methodology. Finally "hot tips" or blind recommendations are typically one of the biggest causes of losses... It's like a something for nothing deal. Investing and speculation is hard, risky work. There are few short cuts. Unless of course you have a market gaining 1000 points every few months or...your name is Hillary!
CACTUS: . . . . Wed, Feb 19, 5:27PM PST ( -0900 GMT)Anybody knows at what time starts the conference? Maybe my PC is going very slowly. Here in Mexico it´s 19:30PM.
TradeNet Staff -Neal.: . . . . Wed, Feb 19, 5:37PM PST ( -0900 GMT)Hi Cactus, the conference will start in about 20 minutes at
6:00 PST.
Ayrton: . . . . Wed, Feb 19, 5:56PM PST ( -0900 GMT)Hi, does anyone here trade commodities? I think this should be a good session tonight..

Cash: . . . . Wed, Feb 19, 5:59PM PST ( -0900 GMT)Everything seems to be going really well in the market these days. Are we in for a serious correction Joe ?
Joe DiNapoli: . . . . Wed, Feb 19, 6:06PM PST ( -0900 GMT)Hi I'm here. We might as well get started with Cash's
question and break the rules right away by coming up with a projection. We've got pretty substantial Fibonacci resistance at 844.10 on the S&P cash. The equivalent Dow number is 7340. I wouldn't suggest going short there unless we get a sell signal, but taking profits wouldn't be a bad idea. Later on I'll tell you what's really worrying me about this market and what we have to watch out for.
I_Do_Windows: . . . . Wed, Feb 19, 6:06PM PST ( -0900 GMT)Joe - Please discuss the difference as to when to use Bonsai, Minesweeper, Double Minesweeper, and the Wash and Rinse. Which can be used for entry and exit techniques? Also, please discuss where to place stops when each of the techniques are used for entry. Is this information discussed in detail in your book? -Regards, SR
Joe DiNapoli: . . . . Wed, Feb 19, 6:06PM PST ( -0900 GMT)I'd like to tackle a pretty advanced questions posed by
I_do_windows. For those of you who haven't studied my work, you may find this to be a bit heavy in jargon but I'll try to keep it simple. Bonsai, Minesweeper A and Minesweeper B, are all entry techniques with predefined stop levels. Bonsai is typically for the trader with excellent floor connections, meaning low commissions and good fills. Bonsai players typically are willing to have a lower percentage of winning trades in order to be in the market more often. A lot of floor traders I've trained like this particular entry technique. It's more what they're used to. The Minesweeper techniques afford insurance at a reasonable cost. Stops using these techniques are typically hard for the locals to get. Wash and Rinse is a different animal. It falls more into the directional techniques(patterns) I use. For those of you who are unfamiliar with Wash and Rinse it refers to the market meaning the locals or the specialists washing out stops before the big move occurs.
CACTUS: . . . . Wed, Feb 19, 6:09PM PST ( -0900 GMT) Joe, have you ever traded on the Mexican Stock Exchange? If yes, can you talk about how it looks? Do you have any recommendation of how to use your techniques for trade in that market?.
bbb: . . . . Wed, Feb 19, 4:52PM PST ( -0900 GMT) Any opinion about the Buenos Aires stock exchange? I'm an ewaver and the Elliot count fits very well in the merval index

TradeNet Staff -Neal.: . . . . Wed, Feb 19, 6:10PM PST ( -0900 GMT) Hi Gildone, Cash, Cactus, everyone... Joe is frantically typing responses, so please be patient while he
provides the unprepared responses
Joe DiNapoli: . . . . Wed, Feb 19, 6:39PM PST ( -0900 GMT) BBB and Cactus, I never traded the Mexican stock exchange or the Buenos Aires stock exchange, but I've
had clients who have traded both. Reports of results using my techniques, particularly in Mexico were very positive. I was involved with a large money management firm there in the late 80s. With regard to EWT, I don't practice it. I find it too confusing to make any money with. If you like it however, by all means use it. I think you will find a lot of value in combining the Fibonacci techniques I use with the Elliot Wave techniques you use.
gildone: . . . . Wed, Feb 19, 6:39PM PST ( -0900 GMT)Joe, In your opinion, how well do your methods apply to trading from the daily bars. Also, do your techniques work better on certain markets.
fox: . . . . Wed, Feb 19, 6:09PM PST ( -0900 GMT)Hello Joe, New commodity trader here, I'm familiar with Fibonacci. Let's see if the old dog can learn a new trick.
Joe DiNapoli: . . . . Wed, Feb 19, 6:09PM PST ( -0900 GMT)To Cactus and Shawn, regarding your preconference
question, I researched Fibonacci arcs back in 1989. They simply were not useful enough for me to include them in my trading methodology. I can direct you to someone who has. Cactus if you want to make money using Fibonacci, I would suggest you forget about using Fibonacci arcs and look at using retracements of multiple reaction highs or lows, which is what I do.
KB: . . . . Wed, Feb 19, 6:10PM PST ( -0900 GMT)Have you done daytrading? Is it hard? What would be your advice to smb that's just starting out?
Joe DiNapoli: . . . . Wed, Feb 19, 6:17PM PST ( -0900 GMT) K.B. I've done a ton of day trading. I was there when the
S&P started and I was trading the value line before that. It's worse than tough. It takes diligence, education, discipline, and will turn out to be the toughest shrink you'll ever find. It's also likely to be the most expensive.

rinebob: . . . . Wed, Feb 19, 6:10PM PST ( -0900 GMT)Hi Joe, Can you discuss how sensitive fibonacci is for accurately picking tops/bottoms? Also, can you use it for options trading or is that too volatile?
Joe DiNapoli: . . . . Wed, Feb 19, 6:11PM PST ( -0900 GMT) Fibonacci analysis is the most accurate means of
forecasting support and resistance that exists. You must use fibonacci analysis however in the correct context. In my opinion it is essential for options trading, since you have to deal with premium expansion and contraction. The bottom line is if you don't know where support and resistance will manifest ahead of time you're dead attempting to trade options.
CACTUS: . . . . Wed, Feb 19, 6:14PM PST ( -0900 GMT)Joe: And how can I use that, do you have any special parameters or with the proportions of the Fibonacci Theory. How do you work with that, may you show an example? Thanks
Joe DiNapoli: . . . . Wed, Feb 19, 6:23PM PST ( -0900 GMT) Cactus, we have no means of showing you a chart on this
page. However, if you visit my software page, you can see two examples.
Joe DiNapoli: . . . . Wed, Feb 19, 6:14PM PST ( -0900 GMT)Hugh, To answer your question posted prior to the
beginning of the conference regarding the use of Fibonacci numbers, I don't use Fibonacci numbers . I use certain ratios derived from them i.e. .382, and .618 for retracements, .618, 1, and 1.618 for expansion ratios. The basic principles will be elaborated on as we go along.
KB: . . . . Wed, Feb 19, 6:18PM PST ( -0900 GMT) Hey, Joe I am from Tallinn!!! VIVA! What do you think about investments in the Baltic region?
Joe DiNapoli: . . . . Wed, Feb 19, 6:33PM PST ( -0900 GMT)K.B. I spent a wonderful week in Tallinn last year courtesy
Dow Jones Telerate and Tim Slater and met an enthusiastic group of traders at my workshop. I was very impressed with Estonia in particular and the Baltic's in general. I really liked it there.
Hugh (San Diego): . . . . Wed, Feb 19, 6:19PM PST ( -0900 GMT)Joe, I'm a little new to technical analysis in general, if there is time in this conference can you explain what a Displaced Moving Average is?

Joe DiNapoli: . . . . Wed, Feb 19, 6:25PM PST ( -0900 GMT)Hugh, a displaced moving average is a moving average
moved forward (or backward) in time. Imagine you have a 7-day simple moving average, now slide it to the right by 5 days.. The result is a 7X5 displaced moving average.. The displaced moving average value for today is equal to the UNDISPLACED moving average of 5 days ago.
ollie: . . . . Wed, Feb 19, 6:26PM PST ( -0900 GMT)You mentioned a while ago that you don't use Fibonacci retracements but instead current ratios. Please explain further. Thanks
fox: . . . . Wed, Feb 19, 6:36PM PST ( -0900 GMT) Hi Joe, I'm with Ollie.. please discuss your use of "current ratios"
Ollie: . . . . Wed, Feb 19, 6:38PM PST ( -0900 GMT) Joe, is it still advisable to use Fibonacci retracements as exit points? What do you recommend?
Joe DiNapoli: . . . . Wed, Feb 19, 6:38PM PST ( -0900 GMT)Using retracements as exit points is an advanced
procedure. You're better off using expansion ratios as shown on the Fibnode software Web pages in both the meal trade and the S&P trade.
Joe DiNapoli: . . . . Wed, Feb 19, 6:44PM PST ( -0900 GMT) Fox, did I say "current ratios" somewhere? Ollie, using
Fibonacci retracements as exit points is an advanced technique. To start out with use expansion ratios as profit objectives. What I mean is, you expand an ABC wave to an objective point as is shown on my software page.
Joe DiNapoli: . . . . Wed, Feb 19, 6:29PM PST ( -0900 GMT)Hugh, did that explain displaced averages well enough? It
is my experience that displaced moving averages contain trend better than regular moving averages, so they create less whipsaw...
Hugh (San Diego): . . . . Wed, Feb 19, 6:31PM PST ( -0900 GMT) Yes, that explained it well. (Why didn't I think of that myself?!)
PHF: . . . . Wed, Feb 19, 6:29PM PST ( -0900 GMT)Hi Joe-I have some of your publications and I own FIBNODES SOFTWARE. I've always had difficulty figuring out whether the
market's going into congestion and how to play trading range vs. trending markets.
Joe DiNapoli: . . . . Wed, Feb 19, 6:31PM PST ( -0900 GMT)Good question. There are a variety of ways to distinguish
trending markets from markets that are in congestion. But the topic is fairly comprehensive and difficult to answer in this forum. Consider that congestion in one time frame can be a strongly trending market in a different time frame, i.e. going from daily to five minute. Also, put the 3x3 DMA on any time frame chart, and see if action stays primarily above or below it. If it does, you've got a trending market. You can also use the detrended oscillator as an indicator of trend of lack of it. Sources for this information would be my Trading Course or the book I'm currently writing. You could also consider Wells Wilder's ADX, for determining trend or congestion. Volumes have been written on the study..
speculator: . . . . Wed, Feb 19, 6:33PM PST ( -0900 GMT)Hi Joe; Please tell us your call on the direction of gold!
Joe DiNapoli: . . . . Wed, Feb 19, 6:35PM PST ( -0900 GMT)Speculator, I appreciate your question but I'm going to try
to refrain from making calls tonight. See an earlier response entitled to all.
CACTUS: . . . . Wed, Feb 19, 6:35PM PST ( -0900 GMT)Joe: I didn't get the displaced averages. How you move the average?
Joe DiNapoli: . . . . Wed, Feb 19, 6:38PM PST ( -0900 GMT)Cactus, that would depend on your charting software. If
you are calculating it by hand, merely calculate the moving average from the prior day (or 5 days ago in the above example), So today's moving average is the moving average for the future, i.e. 5 days into the future in the above example....
Ollie: . . . . Wed, Feb 19, 6:37PM PST ( -0900 GMT) Cactus, if you're interested at DMAs, check out the recent issues of Technical Analysis for Stocks and Commodities Magazine.
TradeNet Staff -Neal.: . . . . Wed, Feb 19, 6:43PM PST ( -0900 GMT) The value of this conference depends on your

involvement, so do ask questions. Joe specifically requests that we do not ask him for market opinions or hot tips, please try to focus on Joe's techniques and experience.
CACTUS: . . . . Wed, Feb 19, 6:44PM PST ( -0900 GMT) Ollie: Thank you very much. Do you have any home page address or e-mail to subscribe because I cant find the magazine in Mexico.
TradeNet Staff -Neal.: . . . . Wed, Feb 19, 6:46PM PST ( -0900 GMT)Cactus, the web page for that magazine is
www.traders.com/
Gadola: . . . . Wed, Feb 19, 6:45PM PST ( -0900 GMT)Joe, any ideas on how to get into a market that is in a strong trend with no corrections to Fibnodes on, such as the current Swiss Franc.
Joe DiNapoli: . . . . Wed, Feb 19, 6:52PM PST ( -0900 GMT)Gadola, One of the biggest advantages of the techniques I
use, is their ability to get you into a raging move with relative safety. You accomplish this by dropping your time frame, creating a Fibonacci support series and buying above confluence. Your stop is predefined below a lower Fibnode. The example of the S&P trade on my software page should illustrate this fairly well. In this case of course it's a down move so we're creating a resistance series.
gildone: . . . . Wed, Feb 19, 6:47PM PST ( -0900 GMT)Joe, your analysis seems to focus on price alone. Do you use Fibonacci on the time axis as well? Do you use other analysis to complement your Fibonacci expansion/retracement analysis?
Joe DiNapoli: . . . . Wed, Feb 19, 6:48PM PST ( -0900 GMT)I don't use Fibonacci work on the time axis, though I've
done a lot of study on the subject. Yes, there's an entire setting or context in which Fibonacci analysis should be applied. Without this context you are treading on thin ice.
stocksrme: . . . . Wed, Feb 19, 6:49PM PST ( -0900 GMT) Joe the e-wavers I talk to are very bullish on stocks at this time. What is your view. Also would you buy gold stocks at this point?
Joe DiNapoli: . . . . Wed, Feb 19, 6:48PM PST ( -0900 GMT)Stocksrme, No I'm not bullish, I'm worried, valuations are
absurd but that doesn't mean they won't get more absurd. Just look at the Nikkei hitting 38,000, $50 silver, or tulip bulbs going for the

equivalent of thousands of dollars. It's the bigger fool theory, but it's a fun game if you don't get caught.
Joe: . . . . Wed, Feb 19, 6:51PM PST ( -0900 GMT)Do you have any methods in which you attempt to predict the following days price activity from today's price action?
Joe DiNapoli: . . . . Wed, Feb 19, 6:55PM PST ( -0900 GMT) Joe, Not simply from today's price activity. I believe the
study of higher time frame charts is necessary for maximum safety, so I usually use more than one day's price activity to determine objectives. Around 1982 I came up with a interesting indicator called the Oscillator Predictor This study looks back 6 months using a detrended oscillator to forecast overbought and oversold levels for tomorrow's action.
Double R: . . . . Wed, Feb 19, 6:51PM PST ( -0900 GMT)I trade stocks using a hybrid can slim method. My goal is to generate monthly income. Do you have a stead fast profit and stop loss rule, so I can play the average % gains ? Do you always use technical analysis to set profit & loss stops, or take minor gains and play the overall average ?
fox: . . . . Wed, Feb 19, 6:52PM PST ( -0900 GMT)I'm a little confused , do you use fib ratios to determine Probable entry & exit points?
Joe DiNapoli: . . . . Wed, Feb 19, 6:57PM PST ( -0900 GMT)Fox, that is correct, I apply Fib ratios to the price scale to
determine optimum entry and exit points.. This is combined with other indicators too, of course.
Hugh (San Diego): . . . . Wed, Feb 19, 6:57PM PST ( -0900 GMT)What is the formula used to construct the Oscillator Predictor?
Joe DiNapoli: . . . . Wed, Feb 19, 6:57PM PST ( -0900 GMT)I fully disclose everything I do, you'll never get yesterday's
trading strategy from me, I teach exactly what I use. With respect to the formula for the oscillator predictor I'm under a moral constraint with a programmer, not to divulge the formula. You can get access to oscillator predictor in the Coast Investment Software, (graphics) TRADING PACKAGE. You can simulate the oscillator predictor by properly using the detrended oscillator.
KB: . . . . Wed, Feb 19, 6:57PM PST ( -0900 GMT)

TradeNet Staff -Neal.: . . . . Wed, Feb 19, 6:59PM PST ( -0900 GMT)Hi KB! Welcome to the conference... Could you speak up,
we can't hear you in the front. :-)
dbh: . . . . Wed, Feb 19, 7:00PM PST ( -0900 GMT)Can you elaborate a bit more on "logical profit objectives"
Joe DiNapoli: . . . . Wed, Feb 19, 7:01PM PST ( -0900 GMT) I use one or both of two methods. The first is Fibonacci
analysis, see the FIBNODES SOFTWARE Web pages. I also use the Oscillator Predictor.
CACTUS: . . . . Wed, Feb 19, 7:03PM PST ( -0900 GMT)Joe: Well, for example I have the Dow Jones chart. I'm waiting for a correction because I'm looking an extraordinary negative divergence with the RSI. How can I determine if the trend is ending and it´s coming a correction time? If I take the last great correction(Nov. '96) and trace a trendline beginning on the lowest low(aprox.6250 points) and ending today, if I use the Fibonacci proportions, the first support is in the 6,744 points and the second(using the .618) is on 6555 points. Is that right? And how can I predict the correction if the trend is going only bullish.? I hope you understand my questions.
Joe DiNapoli: . . . . Wed, Feb 19, 7:04PM PST ( -0900 GMT) To Cactus, First of all I don't find Oscillator to price
divergence a satisfactory indicator to act on. I also do not use trend lines. I use only two trend indicators. Displaced Moving Averages, and the MACD Stochastic combination. I'd have to look at these on the appropriate time frame chart to give you my impression of the trend. I will continue to answer your question but I'm going to send this now.
KB: . . . . Wed, Feb 19, 7:03PM PST ( -0900 GMT)Hey, Neal I already asked two question:-) Now I am drinking my coffee and relaxing:-) I am only a newbie here, I don't want to mess with you big guys:-) Celine Dion is a wonderful singer..;-) If we could switch to rock...:-)
TradeNet Staff -Neal.: . . . . Wed, Feb 19, 7:07PM PST ( -0900 GMT)KB, thanks for posting questions, we are probably 75%
newbies here (First time on these pages for Joe too), welcome... I need a coffee myself..

CACTUS: . . . . Wed, Feb 19, 7:11PM PST ( -0900 GMT)Well, who invites the coffee's.? Aparently we´re having a brake.
Joe: . . . . Wed, Feb 19, 7:04PM PST ( -0900 GMT)Since you have spent some time with Jake B. Are you familiar with the MA-DTO system of Jake's and what do you think of it?
Joe DiNapoli: . . . .Wed, Feb 19, 7:06PM PST ( -0900 GMT) Joe, unfamiliar with that one, but I really like Jake
Bernstein and I have benefited from some of the things he teaches. My first exposure to the MACD, his version was called the DEMA (Dual Exponential Moving Average),laid the basis for my MACD Stochastic combination trend indicator. In the late 80s we did a number of seminars together. I always found his work to be of value and his treatment of clients to be particularly generous.
dapper: . . . . Wed, Feb 19, 7:12PM PST ( -0900 GMT)Hi Joe, Great to catch you here, sorry I'm late....it's a 24 hour world out there. How much longer is the conference on line? Trader Dave...
Joe DiNapoli: . . . . Wed, Feb 19, 7:15PM PST ( -0900 GMT)Dapper, that depends a bit on how many questions you
ask... I am on the east coast, so I'll get tired in a while...
Hugh (San Diego): . . . . Wed, Feb 19, 7:13PM PST ( -0900 GMT)Joe-Do you consider any technical indicators overrated? Which ones and why?
Joe DiNapoli: . . . . Wed, Feb 19, 7:23PM PST ( -0900 GMT)Hugh, I'd probably make a lot of enemies if I told you what
I thought of most technical indicators so I won't. But in my workshops and teaching material I usually sight seven key mistakes traders typically make. Let's see how many I can remember. One, initiating trades on a breakout, I buy or sell retracements not new highs or lows. Using Oscillator to price divergence as an entry tool. This is typically suicidal. Tightening up your stop without any cognizance of where to put it. You should be doing a Fib series to determine stop placement. Let's see that's three I think. A fourth would be to let the market take you out of a trade instead of having logical profit objectives. Think about it. Who are the most successful traders as a group. The floor traders of course. They always have taking profits as there priority. It's getting too late, I can't remember the other three.
dapper: . . . . Wed, Feb 19, 7:21PM PST ( -0900 GMT)I've been using Joe's methods for more than a few years now, and for all the "newbies" the beauty of his work is that it is applicable across

all time frames in all markets. Some indicators and studies have to be slowed or "speeded up" but the signals for entry and price targets remain valid. I trade R/T commodities in short time frames ..5 minutes.. but it works just as well on long term mutual funds. No astrology required either !
Ayrton: . . . . Wed, Feb 19, 7:24PM PST ( -0900 GMT)Dapper, so I should get a refund on that crystal ball I just ordered?
fox: . . . . Wed, Feb 19, 7:25PM PST ( -0900 GMT)I'm impressed. If your day trading R/T and have survived "a few years" my congratulations. I'm happy to hear it can be done!.
Joe DiNapoli: . . . . Wed, Feb 19, 7:26PM PST ( -0900 GMT)Thanks Dapper. Glad you found usefulness in my work.
dapper: . . . . Wed, Feb 19, 7:27PM PST ( -0900 GMT)how about adding to a losing position ? "It can't go any lower, can it "
Joe DiNapoli: . . . . Wed, Feb 19, 7:27PM PST ( -0900 GMT)Dapper, Yea right, it's just got to bottom out so let's
average down. Who was it that was worth about a billion dollars that said he wasn't wealthy enough to average down?
I_Do_Windows: . . . . Wed, Feb 19, 7:28PM PST ( -0900 GMT)You explained earlier that Wash and Rinse was a technique used with "directional" signals. Could you elaborate, please?
Joe DiNapoli: . . . . Wed, Feb 19, 7:37PM PST ( -0900 GMT) To I_Do_Windows, what I meant was that Wash and Rinse was more in the category of a directional signal
rather than in the category of an entry signal. Once you have a Wash and Rinse (pattern) then you could apply one of the entry signals you mentioned earlier. To elaborate more fully the directional signal gives you the context for the trade, i.e. up or down. The actual entry uses an entry technique derived from Fibonacci analysis.
dapper: . . . . Wed, Feb 19, 7:33PM PST ( -0900 GMT)FOX, I've been an active trader for over 25 years, and have made every mistake in the book. A great trader once told me "The better you get, the more problems you will have". Man, is it ever true! As long as you learn something from each mistake [yours, brokers, pit, back-offices, etc.], and always maintain a tight money management and control program you will win. JOE, any time for some of your ideas on money management?

fox: . . . . Wed, Feb 19, 7:38PM PST ( -0900 GMT)Thank you dapper, just started R/T 2 weeks ago, I've already learned several things NOT to do.
Joe DiNapoli: . . . . Wed, Feb 19, 7:45PM PST ( -0900 GMT) Dapper, money management is a big topic I spend about
three hours in my Trading Course on this subject alone. It's far more complicated than risking two or five percent of your margin on a given trade. You need to understand ruin theory, that's gambling theory, aberrant runs and much more. This information is hard to find. For years I've taught something called the three period rule. It assumes you have a good trading methodology. It goes like this. If you're not in profits after three periods, you get out of the trade. That's three days on a daily chart, fifteen minutes on a five minute chart. Hope that helps. One last comment regarding your question. If you learn how to buy and sell in the right places there will be great competition for fills in those areas. In that sense things do get harder when you get better. I'm talking about problems like X'd trades.
Joe: . . . . Wed, Feb 19, 7:35PM PST ( -0900 GMT) You said you used lagging indicators, like the displaced MA. If you adjust it to be 5 days ahead, wouldn't that be a leading indicator? You said you use Fib analysis as a leading indicator? Could you explain?
Joe DiNapoli: . . . . Wed, Feb 19, 7:38PM PST ( -0900 GMT)Unfortunately, this isn't the forum to fully explain your
question. The easy answer is no, a displaced moving average is not a leading indicator. In my upcoming book DINAPOLI LEVELS I get into a complete discussion of just what constitutes leading and lagging indicators. It's too difficult a topic to accurately cover in this forum. Yes Fibonacci analysis is a true leading indicator, when used properly.
Ayrton: . . . . Wed, Feb 19, 7:39PM PST ( -0900 GMT)Joe, what markets do you trade?
Joe DiNapoli: . . . . Wed, Feb 19, 7:41PM PST ( -0900 GMT)Aytron, I trade markets that move and conform to proven
money making situations. In 95 one of my biggest trades was in the soy bean meal market. I hadn't traded meal for over ten years. The setup was perfect and I moved on it.
Hugh (San Diego): . . . . Wed, Feb 19, 7:42PM PST ( -0900 GMT) Joe-What is a "detrended oscillator"?

Joe DiNapoli: . . . . Wed, Feb 19, 7:41PM PST ( -0900 GMT)The formula for the detrend is close minus moving
average, reasonable variations are high or low minus moving average. This oscillator was used many years ago before the RSI became popular. It has many advantages over the more common oscillators, one being that the extremes are not normalized to plus or minus 100.
CLARENCE: . . . . Wed, Feb 19, 7:46PM PST ( -0900 GMT) Joe, what is an X'd trade?
I_Do_Windows: . . . . Wed, Feb 19, 7:53PM PST ( -0900 GMT) Joe, didn't you write a magazine article about X'd trades a couple of years ago?
Joe DiNapoli: . . . . Wed, Feb 19, 7:54PM PST ( -0900 GMT) To Clarence, an X'd trade is a canceled trade and can wreak havoc in your account. It can also be devastating psychologically. See Stocks and Commodities magazine March 95. I did an article on X'd trades. I was surprised the editor printed it. A lot of traders benefited from this knowledge.
CLARENCE: . . . . Wed, Feb 19, 7:51PM PST ( -0900 GMT) I guess I'm not good enough, or I'd be experiencing X'd trades! Right? (grin)..
techharry: . . . . Wed, Feb 19, 7:43PM PST ( -0900 GMT)I hope I'm not late, do you use pivot points high or low before entering a trade ?
dapper: . . . . Wed, Feb 19, 7:47PM PST ( -0900 GMT)what constitutes a "good" market to trade in terms of contract volumn, tics per period, etc ?
Joe DiNapoli: . . . . Wed, Feb 19, 7:48PM PST ( -0900 GMT) To Techharry, Love these handles. I don't use terms like
pivot points because they mean different things to different people. If you're talking about using old highs or lows, or turning points the answer is only to the extent that they fall into my Fib analysis rules.
Ayrton: . . . . Wed, Feb 19, 7:48PM PST ( -0900 GMT)Joe, Would your methods be appropriate for mutual funds?
Joe DiNapoli: . . . . Wed, Feb 19, 7:49PM PST ( -0900 GMT)Ayrton, the unqualified answer is yes, but there can be
some difficulties. Let's say you're trading a foreign bond fund. The managers of the fund may involve themselves with certain hedging or option writing activities which could affect price in such a way that the Fib analysis would not be as accurate as it would be if you had a pure cash market trade. All in all however the Fib analysis works very well in mutual funds.
I_Do_Windows: . . . . Wed, Feb 19, 7:48PM PST ( -0900 GMT)Joe, do you have a recommendation for a source to learn "floor mechanics" that come into play for the 5 minute and faster markets?
Joe DiNapoli: . . . . Wed, Feb 19, 7:58PM PST ( -0900 GMT) To I_Do_Windows, you're asking some very pertinent
questions. With regard to learning about floor mechanics it's near impossible. You have to talk with someone who knows what's going on and who trusts you enough to talk with you. I spend about two hours in my private seminar sessions going over floor mechanics and I don't allow any recording of this information. The kind of comments I get go like this "so that's what's going on down there", "so that's why my fills always get screwed up" or "now I understand why you enter orders the way you do"
CACTUS: . . . . Wed, Feb 19, 7:48PM PST ( -0900 GMT)Joe: Do you have an answer about my questions I'm really interested on your feedback.
TradeNet Staff -Neal.: . . . . Wed, Feb 19, 7:52PM PST ( -0900 GMT)Cactus, I'll look back at your questions above, while Joe is
responding to another question, and I will remind him...
Joe DiNapoli: . . . . Wed, Feb 19, 7:56PM PST ( -0900 GMT)Cactus, I'll review your questions with Neal in a minute, still
catching up here...
TradeNet Staff -Neal.: . . . . Wed, Feb 19, 7:57PM PST ( -0900 GMT)There is a possibility that Joe will return in the future for a
more detailed in-depth conference to explain his trading tactics in gory detail.. The detailed conference could be more like his actual trading classes, teaching how to trade the way he does.. Please post a message if you are interested in attending such a seminar so we can gauge the interest..

TradeNet Staff -Neal.: . . . . Wed, Feb 19, 8:05PM PST ( -0900 GMT)Yes, Fox, the idea would be more of a training
presentation than a questions/answers session...
I_Do_Windows: . . . . Wed, Feb 19, 7:58PM PST ( -0900 GMT) I am in Neal
Hugh (San Diego): . . . . Wed, Feb 19, 8:01PM PST ( -0900 GMT) Yes, Neal. I would attend.
fox: . . . . Wed, Feb 19, 8:03PM PST ( -0900 GMT) This is my first conference. And yes, I would be very interested in a follow up conference with Joe. In that future conference, May I suggest holding all questions to allow Joe to teach us uninterrupted ? TradeNet Staff -Neal.: . . . . Wed, Feb 19, 8:05PM PST ( -0900 GMT) Yes, Fox, the idea would be more of a training presentation than a questions/answers session...
dbh: . . . . Wed, Feb 19, 8:06PM PST ( -0900 GMT) Detailed conference sounds great
Joe DiNapoli: . . . . Wed, Feb 19, 8:00PM PST ( -0900 GMT)Cactus, I believe I answered your question about Fib Arcs
etc. above, let me know if you can't find it.. I'll work on your other questions in a minute..
techharry: . . . . Wed, Feb 19, 8:00PM PST ( -0900 GMT)Joe, To me, pivot point for example will be (high+Low+close)/3. high pivot point will be (pivot point-low) low pivot point will be (high-pivot point). which % retracement do you use?
Joe DiNapoli: . . . . Wed, Feb 19, 8:09PM PST ( -0900 GMT)To Techharry, I don't use pivot points as you defined them
in any way whatsoever, so I can't give you any retracement value regarding them.
Joe DiNapoli: . . . . Wed, Feb 19, 8:03PM PST ( -0900 GMT)Cactus, I think I answered the Mexican Exchange
questions too.. I'm working on your most recent long question now..
Joe DiNapoli: . . . . Wed, Feb 19, 8:03PM PST ( -0900 GMT)To Cactus continued, The way I use Fibonacci requires the
input of more than one high and one low. For the Dow you would use

the high of the move and multiple reaction lows to create a Fibonacci series from which you could then determine support levels. I hope you understood my answer.
CLARENCE: . . . . Wed, Feb 19, 8:08PM PST ( -0900 GMT)Joe, I think the conference is almost over... You said earlier that something was really worrying you about the current stock market. Could you explain that while we still have time?
Joe DiNapoli: . . . . Wed, Feb 19, 8:17PM PST ( -0900 GMT)To Clarence, I'll try to be specific so I'm not misunderstood.
The monthly crude oil chart is showing me some startling possibilities. The recent highs on the crude should never have been achieved. By that I mean although we did not exceed Fibonacci resistance we kept hammering against it in an uncharacteristic way. If we go back up and exceed those recent highs on the monthly continuation chart we could be in for an explosion of oil prices. Anything in excess of approximately $30 would likely lead to the highs set during Saddam's fiasco. Just imaging what this would do to western Europe, Japan, and our federal reserve as we try to bail everyone out. Don't get me wrong I am not predicting explosive oil prices. I am saying that if certain Fibonacci levels are exceeded our stock market, our bond market, and for that matter the rest of the world could be in major trouble and those price levels are not very far away. On that cheery note, I'm getting close to closing. Any last minute questions?
dapper: . . . . Wed, Feb 19, 8:08PM PST ( -0900 GMT)Joe, Ref. the discussion on X-trades, and "mechanics" who are on the floor. [did I get it right?] I doubt if any professional trader would discuss X-trades, unables, split fills, etc. except in the strictest confidence. Suggest those interested try either your private seminars for a full picture or talk to a current pit trader for some possible insight. Either way you will be "enlightened"
TradeNet Staff -Neal.: . . . . Wed, Feb 19, 8:11PM PST ( -0900 GMT)Dapper, thanks for opening the way for this posting:- Joe
has several educational tools for sale. We have negotiated a discount for attendees of this conference. If you are registered to post messages on this web page, you qualify for a discount on some of Joe's products. This offer expires in 60 days. Just mention this conference when you order, we'll verify that you are registered to use our web pages at that time. NOTE! I personally purchased Joe's training tapes and manual at the Telerate conference last November. I highly recommend it! Feel free to send me email at [email protected] after reading Joe's web pages, or email Joe directly at [email protected] to ask about the training.

TradeNet Staff -Neal.: . . . . Wed, Feb 19, 8:11PM PST ( -0900 GMT)Joe DiNapoli's training materials can be ordered from his
office. COAST INVESTMENT SOFTWARE INC. VOICE (941) 346 3801 FAX (941) 346 3901
CACTUS: . . . . Wed, Feb 19, 8:12PM PST ( -0900 GMT)Joe: Thank´s. Yes, I understood your answer, and sorry about the interruption. One last question: What do you mean with a multiple reaction low? Some concepts looks different to me because maybe in Spanish are used on different terms. Neal: Sure, this is my first conference in the web, and I am interested in another conference with Joe. Greetings from Monterey, Mexico.
I_Do_Windows: . . . . Wed, Feb 19, 8:13PM PST ( -0900 GMT)DAPPER: Regarding money management, I have listened to Joe's Trading Course tapes about 8 times or so just for that reason. Really opened my eyes.
TradeNet Staff -Neal.: . . . . Wed, Feb 19, 8:16PM PST ( -0900 GMT)Greetings Cactus, your questions are not an interruption..
I_Do_Windows, I just re-listened to Joe's tapes last week, and was amazed at how much MORE I learned this time...
TradeNet Staff -Neal.: . . . . Wed, Feb 19, 8:18PM PST ( -0900 GMT)We need to start winding down, it's getting late on the east
coast, please post final questions at this time.... Joe is preparing responses to prior questions now..
dapper: . . . . Wed, Feb 19, 8:19PM PST ( -0900 GMT)Adios, to all. The next conference sounds great. Tokyo and Singapore very active, must get to work. Dapper from Australia.
Joe DiNapoli: . . . . Wed, Feb 19, 8:19PM PST ( -0900 GMT)To Cactus, Multiple reaction lows cross all geographical
boundaries. I've taught about them in about 40 different countries. Instead of looking at only the major low or the lowest low of the move, you need to look at and calculate Fib retracements off all significant lows. You cannot do this using graphic software alone since the chart would be chaotic and unreadable. This is where FIBNODES SOFTWARE comes in. You also need to be able to identify the Fibonacci retracement values with the reaction lows that create them. This is the concept of lineage. Again this is addressed in the FIBNODES SOFTWARE program or if you use a pair of proportional dividers you might be able to duplicate this on a price chart by hand. Don't worry about this being your first on line conference, it's mine too.

CACTUS: . . . . Wed, Feb 19, 8:21PM PST ( -0900 GMT)Joe: Thank´s for your time. It was so valuable to talk with you. I hope meet you again in this site. Greetings.
TradeNet Staff -Neal.: . . . . Wed, Feb 19, 8:21PM PST ( -0900 GMT)Thanks for attending Dapper!!!!
CACTUS: . . . . Wed, Feb 19, 8:22PM PST ( -0900 GMT)Dapper: It seems you know a perfect Spanish, see you in another conference. Adios amigo.
CLARENCE: . . . . Wed, Feb 19, 8:23PM PST ( -0900 GMT)Thanks for the response Joe, it'll take me a while to digest that... I would be interested in another conference too..
TradeNet Staff -Neal.: . . . . Wed, Feb 19, 8:26PM PST ( -0900 GMT)Thank you for attending everyone.. Thanks also to Joe for
taking the time to explain your tactics...
CACTUS: . . . . Wed, Feb 19, 8:26PM PST ( -0900 GMT)See you later everybody. !!!!!!!!GONE¡¡¡¡¡¡¡
Joe DiNapoli: . . . . Wed, Feb 19, 8:27PM PST ( -0900 GMT)To all, thanks for attending, this was really an interesting
and fun experience for me. You should know thatNealput this on fully at his expense, including putting my Web pages up for your behalf, as well as mine. He also pushed me to offer all of you a 25% discount on my products. He's looking out for all of you and he's doing a good job. He deserves your thanks, he certainly has mine. Good night.
I_Do_Windows: . . . . Wed, Feb 19, 8:27PM PST ( -0900 GMT)Thanks, Joe. I Do Windows! -SR
TradeNet Staff -Neal.: . . . . Wed, Feb 19, 8:27PM PST ( -0900 GMT)Hey, Joe, turn out the lights when you are done, OK?
fox: . . . . Wed, Feb 19, 8:27PM PST ( -0900 GMT)G'night from the Florida Fox
TradeNet Staff -Neal.: . . . . Wed, Feb 19, 8:29PM PST ( -0900 GMT)Good night all!!!

All original materials: © 2003 Joe DiNapoli and Coast Investment Software. Republished with
permission by Brooke Publishers, Inc.Comments: [email protected]
20 Golden Rulesfor Traders
Trading Masters NEW TO TRADING & TECHNICAL ANALYSIS?Click Here
WIZARDSTUTORIAL
HomeDaily
CoursesTactics
Resources
YOUR DAILY
MARKETGUIDE
Featuring
InteractiveTradingPicks
PICKS, CHARTS, SCANS, IDEAS &
PROFITSCheck outMORNING TRADER
NOW!
andEVERY MARKET
DAY!
LEADING AND LAGGING INDICATORS:Achieving a Balance © 1998 Joe DiNapoli and Coast Investment Software, Inc.6907 Midnight Pass, Sarasota, FL 34242941-346-3801 Fax 941-346-3901
How would you like a trading methodology that gives you predefined entry levels, reasonably tight stops, and precalculated profit objectives as soon as you enter the move? We're not through. Add to that a very high percentage of winning trades. This is not only the promise but it can also be the reality of properly mixing high quality leading and lagging indicators in an overall trading methodology.
Almost every technical indicator is a lagging indicator. Moving averages, MACD, the RSI, Stochastics, you name it, we're talking lagging indicators. First there's a move in price, then sometime later in the game, the indicator signals buy or sell. That's why lagging indicators are called lagging indicators. They lag behind market action. They give signals after the fact. Leading indicators, on the other hand, tell us ahead of time where the market is likely to find support or where the market is likely to find resistance. Most traders who have attempted to use leading indicators have looked toward some form of overbought or oversold oscillator. Most oscillators, however, are in the camp of coincident or lagging indicators. They may tell us when a market is at a resistant point or when a market is at a support level, but typically they do not give us useful information ahead of time. Traders rightfully view the use of leading indicators as a dangerous enterprise because few traders understand how to place a true leading indicator in the proper context to achieve the desired results. The trick is to achieve the proper balance by mixing leading and lagging indicators across time frames. If we can accomplish this objective, we can come up with a trading approach which is far superior to using either of the two exclusively.
Let's look at the problem more closely. Traders, being rational
POWERFULONLINE
TRADINGCOURSE
FromHARD RIGHT EDGE
YourOriginal Guide
toSuccessful
Short-Term Trading
Highly EffectiveMarket Strategies
and3-D Charting Techniques
GetMore Info

Powerful Tools
for Traders
Complete 7-Bells Scansand More
Info
human beings, prefer lagging indicators because they want the comfort level of seeing a market already in a move prior to their entry. Unfortunately, this kind of comfort comes at a price. Once the lagging indicator is firmly established in a given direction, everyone else sees the move and everyone else is getting in at about the same time. Those who provide the necessary liquidity to fill the orders of the lagging indicator traders need to make their profit, so now we're ready for a retracement. This retracement is typically to the area where the lagging indicator players put their stop. The net result is the lagging indicator trader may be right on market direction, but is all too often stopped out before the market goes the way he knew it would all along. So how do we overcome this situation? Buy precalculated dips in an overall uptrend. Sell precalculated rallies in an overall downtrend. We determine the location of such dips and rallies with high quality leading indicators.
In my trading career I have found only two leading indicators that have the reliability necessary to justify employing them. The first is the Oscillator Predictor, a study I created in the early Eighties. It is a derivative of a detrended oscillator. It tells me a day ahead of time where the market will find support or resistance. It does not tell me that the market will get to those points, it only tells me that if the market gets to those points, there will be substantial support or resistance. The second leading indicator that I use, and have developed considerably, is derived from an advanced form of Fibonacci analysis that I refer to as DiNapoli Levels. By combining varieties of expansions and retracements in unique ways, a trader is able to determine ahead of time, very accurately, where the market is likely to find tradable support or tradable resistance in an ongoing move. It doesn't matter whether they're on a one minute chart or a monthly chart; these levels are consistent throughout. The problem, however, with this very accurate leading indicator, as with all leading indicators, is that it is of little value in buying support in a strong down move or in selling resistance in a strong up move unless you're just looking to scalp the market for a very brief trade. That's why you need a strong context for the trade. Here's how it works.
First, determine the context for the trade using lagging indicators. Then establish the entry level using a high quality leading indicator. Continue to use the leading indicator to find a stop placement point. In the case of an uptrend, this would be below a substantial support level. In the case of a downtrend, the stop would be above a substantial resistance level. Notice I don't use money stops. If the stop is too large for money management criteria, simply don't take the trade. Since the stop placement point is known ahead of time, it's easy to make that calculation. Once the stop and entry are in place, it is now possible to calculate an expansion level (leading indicator) to take profits. The closing order is placed in the market immediately upon making this calculation. Do not wait for the market to get there and see what happens.
HRE SPOTLIGHT
TechnicalAnalysisMasters
John Murphy

If you are using high quality leading indicators, the advantages of this type of trading are substantial. You can achieve an extremely high percentage of winning trades. In addition, your orders will be filled with a minimum of slippage, because you are buying a dip when the market is coming at you and you're selling a rally when the market is advancing. If you're trading size, this can be a huge advantage as compared with initiating a trade with buy stops or sell stops. If you're trading a two lot, this approach can be significantly beneficial on your execution as well, but more on that later. Is there a downside? Obviously! It takes some experience to learn just how to employ the techniques. Let's say the market approach you're using to determine the direction has indicated a strong upmove. You're buying a dip within that upmove but you placed your entry order too conservatively, on a support point that is not reached. The market takes off without you. If you do this repeatedly and you're right eight out of 10 times about the overall market direction, you're oing to be filled only on the two times you're wrong! This can be frustrating to say the least and underlines the need for the accurate use and thorough knowledge of high quality leading indicators to make the methodology work. Another problem arises when you're taking profit objectives. You come to a clear point of resistance, you clear your trade, and the market keeps going. If you're not a disciplined trader, you may end up getting right back in "at the market", just as the market is about to have a serious correction. If you're managing money, you may have some explaining to do. This problem can be mitigated if you trade multiple contracts. You can always hold some. I have tried this approach over the years, and I've found that exiting all positions at predetermined logical profit objectives is always better for my bottom line.
Another method you can use to accommodate runaway bull moves is to reenter the market on pullbacks against support points on lower time frames. Let's say you may have exited a daily position on Tuesday and you reenter it on a half-hour chart on Thursday. What's interesting about this approach is that even if you reenter the market at a higher price, you may be at a safer level. That means that statistically you would be less vulnerable to adverse volatility that could hit your stops and force you to take a loss. This approach allows you to control risk without raising your stops to areas likely to be hit!
Typically, I look for my lagging indicator or coincident indicators on a higher time frame. Then I combine that indicator with my leading indicators on a lower time frame. For example, let's say a daily pattern that I use as a setup to go long has just occurred. I'll look at an hourly (or less) chart to calculate the precise entry and stop placement points. Depending upon the nature of the lagging indicator that provided the context for the trade, I determine the strength of the market. I will then use precalculated profit objectives on either the hourly or the daily chart as my exit point. The approach works equally

well using a half-hour chart as a setup and dropping to a five minute chart for your leading indicator analysis. If you're a monthly-based mutual fund trader you can consult daily analysis to determine your entry, exit, and profit objectives.
The lagging and coincident indicators I use to establish market trend or direction are displaced moving averages, a combination of the MACD and Stochastic, as well as a series of 9 price patterns. The only leading indicators I use are, as I said, a price-predicting oscillator as well as a specialized, advanced form of Fibonacci analysis. The more accurate your lagging indicators are the better your results. The more accurate your leading indicators are the better your results.
Now let's examine different types of traders to see who would be best suited to this approach and who might not be well served by this type of trading methodology. Let's take a fund manager with over five million under management. Such an individual can afford to diversify over a wide variety of markets and hedge his trading over a variety of different systems. He has the equity to take the market drawdowns that a much smaller trader couldn't afford and he can hire help to be there when he wants a day off. Maybe he doesn't need this approach. On the other hand, let's take a trader with a $25,000 to $50,000 dollar account. This trader is often an individual who is attempting to make a living out of the market. He is often a one-man shop and needs income from which he can pay his bills. He may also need the support of his friends and family to continue this enterprise. It is very difficult for your wife to understand your explanation of a 30% win ratio and substantial losses for two months, even if the gain on the third month outweighs the losses. A high accuracy trading plan that shows consistent winnings avoids this issue and entices this type of an individual back to the computer. It fosters his ability to interact with the market in a very positive way.
Another consideration is the type of brokerage operation that may be available to him. The influential connections that a larger trader is able to cultivate may not be feasible for the smaller trader. We all know a one lot in the S&P is treated differently from a 10 or a 50 lot. It may be particularly attractive to a one or a two lot trader to have price orders in the market at predetermined levels prior to the market getting there. He avoids the necessity for handpicked filling brokers doing his "bidding." In between the 50,000 and five million dollar million account there's a lot of elbow room. Where you fit in can be dictated by many factors. For hedging purposes this approach can be a godsend. You eliminate all need for context since you know already that you have to own a couple of million dollars of, say, Swiss francs or Deutschemarks . What you do at that point is simple. Look at where you are in relation to your leading indicators. Act or wait as the numbers dictate.

Typically, mixing leading and lagging indicators is not suited to strict non-judgmental trading systems. It is perfectly suited, however, to traders who allow for some level of judgment in their trading operations. System traders have to be there day in and day out taking their signals so that when the big move comes, it will bail out their losses. This is very difficult on a one-man shop. However, an approach that yields a high percentage of winning trades and that is judgmental in nature can be picked up and traded at will, at almost any time of the year. This allows for a lot of down time for other activities. After all, isn't that why most of us got into trading in the first place?
Those using this information for trading purposes are responsible for their own actions. No guarantee is made that trading signals or methods of analysis will be profitable or will not result in losses. It should not be assumed that future performance will equal or exceed past results.
All original materials: © 2003 Joe DiNapoli and Coast Investment Software. Republished with
permission by Brooke Publishers, Inc.Comments: [email protected]

20 Golden Rulesfor Traders
Book Offer NEW TO TRADING & TECHNICAL ANALYSIS?Click Here
WIZARDSBOOK OFFER
HomeDaily
CoursesTactics
Resources
YOUR DAILY
MARKETGUIDE
Featuring
InteractiveTradingPicks
PICKS, CHARTS, SCANS, IDEAS &
PROFITSCheck outMORNING TRADER
NOW!
andEVERY MARKET
DAY!
ORDER NOW TRADING WITH DINAPOLI LEVELS the most comprehensive book ever published on the practical application of Fibonacci Analysis to the Price Axis 300 Pages of trading techniques $162
POWERFULONLINE
TRADINGCOURSE
FromHARD RIGHT EDGE
YourOriginal Guide
toSuccessful
Short-Term Trading
Highly EffectiveMarket Strategies
and3-D Charting Techniques
GetMore Info

What's In The Book
The Pros Talk about DiNapoli
Levels
Read what Traders are
sayingabout DiNapoli
Levels
Order Now!
Eighteen years in formulation, 18 months in the making, professional trader, lecturer, and author Joe DiNapoli, tells it all in his first full length 300 page book.
With the trading perspective provided by this book you will be able to:
● Accurately place stops for maximum potential and minimum heartache
● Identify low risk entry levels ● Predetermine logical profit objectives ● Utilize the most effective trend-following
techniques ● Position yourself before explosive moves occur ● Implement the best overbought and oversold
oscillator available ● Utilize the Oscillator Predictor ● Understand the fundamentals of market action
and reaction ● Formulate a practical trading plan ● See how most traders sabotage their own goals ● Discover how to Mix Leading and Lagging
indicators across time frames for a high accuracy, low risk trading approach
● Enter strong, running market moves "safely" ● Understand how a unique application of the
MACD/Stochastic trend indicator tells you where the public is acting and where the smart money is as well
● Capitalize on buy and sell areas unknown by most traders
● Benefit from the mechanics of trading thrust The experts say, "The Trend is your friend." DiNapoli Levels teaches you how to define Trend. The experts say, "Buy strength and sell weakness". This book teaches you how to buy weakness in an uptrend and sell strength in a downtrend. Then it shows you where to take your profits.

Order with your Visa, Master Card or American Expressthrough our SSL Secure Interface!
Important Advice on Trading Risk and Disclaimer
All original materials: © 2003 Brooke Publishers, Inc.
Comments: [email protected]
20 Golden Rulesfor Traders
DiNapoli Courses NEW TO TRADING & TECHNICAL ANALYSIS?Click Here
WIZARDSCOURSE OFFER
HomeDaily
CoursesTactics
Resources
YOUR DAILY
MARKETGUIDE
Featuring
InteractiveTradingPicks
PICKS, CHARTS, SCANS, IDEAS &
PROFITSCheck outMORNING TRADER
NOW!
andEVERY MARKET
DAY!
HARD RIGHT EDGE offers DiNapoli Trading Courses in three forms:
Fibonacci, Money Management and Trend Analysis In Home Trading Course with the Proportional Divider and Applications Manual
$375
Fibonacci, Money Management and Trend Analysis In Home Trading Course without the Proportional Divider and Applications Manual
$275 So should I buy the course, should I buy the book
or should I take advantage of the package pricing deal and buy both?
POWERFULONLINE
TRADINGCOURSE
FromHARD RIGHT EDGE
YourOriginal Guide
toSuccessful
Short-Term Trading
Highly EffectiveMarket Strategies
and3-D Charting Techniques
GetMore Info

Order with your Visa, Master Card or American Express
through our SSL Secure Interface!
Important Advice on Trading Risk and Disclaimer
All original materials: © 2003 Brooke Publishers, Inc.
Comments: [email protected]

20 Golden Rulesfor Traders
Trading Masters NEW TO TRADING & TECHNICAL ANALYSIS?Click Here
WIZARDSTUTORIAL
HomeDaily
CoursesTactics
Resources
YOUR DAILY
MARKETGUIDE
Featuring
InteractiveTradingPicks
PICKS, CHARTS, SCANS, IDEAS &
PROFITSCheck outMORNING TRADER
NOW!
andEVERY MARKET
DAY!
MONEY MANAGEMENT Here are some quotes from some great traders and investors:
● "I haven't met a rich technician" - Jim Rogers. ● "I always laugh at people who say "I've never met a rich
technician" I love that! Its such an arrogant, nonsensical response. I used fundamentals for 9 years and got rich as a technician" - Mary Schwartz.
● "Diversify your investments" - John Templeton. ● "Diversification is a hedge for ignorance" - William O'Neil. ● "Don't bottom fish" - Peter Lynch. ● "Don't try to buy at the bottom or sell at the top" - Bernard
Baruch ● "Maybe the trend is your friend for a few minutes in Chicago,
but for the most part it is rarely a way to get rich" - Jim Rogers. ● "I believe the very best money is made at the market turns.
Everyone says you get killed trying to pick tops and bottoms and you make all your money by playing the trend in the middle. Well for twelve years I have been missing the meat in the middle but I have made a lot of money at tops and bottoms." - Paul Tudor Jones.
So here we have a group of guys who have collectively taken billions of dollars out of the market and they don't agree on a damn thing regarding how to make money. Not one. So what is a person to do? Is there anything they do agree on? Just one:
● "My basic advise is don't lose money" - Jim Rogers. ● "I'm more concerned about controlling the downside. Learn to
take the losses. The most important thing about making money is not to let your losses get out of hand." - Marty Schwartz.
● "I'm always thinking about losing money as opposed to making money. Don't focus on making money, focus on protecting what you have" - Paul Tudor Jones.
POWERFULONLINE
TRADINGCOURSE
FromHARD RIGHT EDGE
YourOriginal Guide
toSuccessful
Short-Term Trading
Highly EffectiveMarket Strategies
and3-D Charting Techniques
GetMore Info

Powerful Tools
for Traders
Complete 7-Bells Scansand More
Info
● "Rule number one of investing is never lose money. Rule number two is never forget rule number 1" - Warren Buffet.
There really are a lot of ways to make money in the market. There are tons of seminars you can pay for that will tell you "How I made $1 katrillion dollars in the stock market" and its sister book "How I Double my Money Every Hour" is available in many different forms too for only $29.95. All of these will tell you some patterns that will work sometimes and won't others. Some might have you going long with Jimmy Rogers, while others will have you doing it with Bernard Baruch, but when it gets right down to it the most critical part of making money, is not losing much. Your always going to take stops and lose some. But you don't want to lose much, because you won't make a penny tomorrow if you go broke today.
One of the most common mistakes traders will make is that of "risking the whole wad". There is not a faster way to have bad things happen to you than to do this. Studies have been done that suggest the most you should risk on any one trade is 2%. And most pros will tell you that is way too much and they risk 1/4 % to 1% on each trade. The idea here is that no one trades is going to really effect you either way. You're not going to get rich, but your also not going to have to sell the house, as has happened to people.
One other benefit of small positions is that it allows you some freedom from worry. If you are risking a fairly small amount, your not going to get shaken out. You're also not going to find yourself in a position where you say "Shesh, I can't lose this much money" and you turn bad trade into a terrible investment. So, if you are serious about this, if you want to make it long term you will practice sound money control. Before you ever enter a trade, the first thing you should ask yourself is how much am I risking here because, remember that while we are here to make money, we won't make any if we go broke.
The key to not going broke is to respect risk, take small positions that wont allow you to blow out. You must always keep in mind that in trading you are only playing the odds. You may have a setup that is correct 75% of the time but each trade is a random event. It doesn't take into account the last trade. If you have a 75% system, you can still be wrong 10 times in a row, and if you trade for any amount of time it will happen.
I once thought I had a foolproof way to make money at roulette. I would bet on black and red. I would sit at the table, and after the ball had landed on black or red 5 times in a row I would start to bet on the opposite color (so if it were 5 reds in a row I would start to bet on black) Then, if I was wrong, I would go ahead and double down, meaning that if my starting bet is $1, the next time I will be $2, then $4, then $8, then $16 ect. Eventually I would win, and would come out
HRE SPOTLIGHT
TechnicalAnalysisMasters
Jeff Cooper
$1 ahead. So I am 13 years old and really thinking I have the Holy Grail. If its so easy for a 13 year old to figure out, why is it that all the casinos are not out of business and we are all millionaires Simple. It does not work.
If we are flipping coins heads has a 50% chance of turning up on each roll, and so does tails. But each flip is independent of the last. The last coin toss has nothing to do with the one before it. It's a random event. There is a certain chance heads will occur on this roll, or that tails will. But which of them it is that comes up is a random occurrence. Each time you flip a coin it is one flip of a coin amongst the billions of times coins have been flipped. That's why you can roll 100 heads in a row if you do it long enough. That's why the first time I played roulette black came up 19 times in a row and I went home defeated.
Trading is the same. We have a certain percentage of our trades that will work out, and a certain percentage that will not. But your next trade has nothing to do with your last one. So even if you have the world's most accurate method, over time you will go broke if you don't practice good money management and risk control.
So now that we all understand why money management and risk control are very important lets cover exactly how to apply these rules to your trading. As I stated before, you shouldn't ever risk more than 2% of your account on one trade. But, as I also said, that's a bit much for most people and I'm in that group of most people. I like to keep my risk to around 1%. So lets focus our attention on risking 1% of your account on a trade. For the sake of this example let's just assume you have a very average account size, $25,000:
Say you are scanning tonight and come across XYZ which looks like it might be a great swingtrade buy if it trades at 15 3/16. The low of the prior day is 14 1/2. This means you will place your stop at 14 7/16, risking 3/4 of a point on this trade. Assuming a $25,000 trading account you can lose up to $250 per trade. You will use this number to determine how many shares you can buy, which in this case is up to, but not more than 333. Most people don't like to do odd lots, so would round down to 300. Never round up because then you throw the risk control out the window.
Let me leave you with a few more quotes on risk control:
● "If you have an approach that makes money, then money management can make the difference between success and failure... ... I try to be conservative in my risk management. I want to make sure I'll be around to play tomorrow. Risk control is essential." - Monroe Trout
● "If you personalize losses, you can't trade." - Bruce Kovner ● "The best traders have no ego. You have to swallow your
pride and get out of the losses." - Tom Baldwin ● "Never risk more than 1% of your total equity in any one trade.
By risking 1%, I am indifferent to any individual trade. Keeping your risk small and constant is absolutely critical." Larry Hite.
While all of these guys have different methods for making money, each of them agrees that risk control is the single most important aspect of trading. These individuals are the best in the world and the only thing they agree on is risk control. Think about it...
All original materials: © 2003 Brooke Publishers, Inc. and Associated Authors
Comments: [email protected]

20 Golden Rulesfor Traders
Trading Masters NEW TO TRADING & TECHNICAL ANALYSIS?Click Here
WIZARDSTUTORIAL
HomeDaily
CoursesTactics
Resources
YOUR DAILY
MARKETGUIDE
Featuring
InteractiveTradingPicks
PICKS, CHARTS, SCANS, IDEAS &
PROFITSCheck outMORNING TRADER
NOW!
andEVERY MARKET
DAY!
A TRADER FOR ALL SEASONS At the beginning of my career in the stock brokerage business, the stockbrokers and the firm's desk traders gave me the following advice:
- Buy low. Sell high. - The trend is your friend.- Cut your losses short.- Let your profits run.
What they neglected to tell me was the fact that they did not have to use these old market adages in order to "trade" profitably, and as such, had not mastered any of these concepts.
Stockbrokers are in the business of selling stocks to retail clients. Their livelihood is from commission income, which in turn depends on their sales skills. This has nothing to do with trading.
Desk and floor traders in brokerage firms are there to execute retail and institutional client orders. Most of them also trade for their own accounts and their firm's inventory accounts. Like specialists and market makers, these traders trade with the benefit of holding "the book", that is, they know where all of the buy and sell orders are and at what prices. Buying at the bid and then selling at the offer to execute all these client orders, and pocketing the spread, is very lucrative. And it does not require extraordinary talent or skill. Many of these men, knowing what their income stream will be on a particular day, proceed to trade stocks where they don't hold the book, and lose money in the process.
After the market close, these traders gather in bars, where the neophytes look up to them in hopes of gleaming pearls of wisdom so that they too may someday arrive at the pot of gold at the end of the rainbow. Little do they know that it is the structure of the system that makes money for these men and their brokerage firms. It's the way the game is set up. The traders, the salesmen, the specialists, are the
POWERFULONLINE
TRADINGCOURSE
FromHARD RIGHT EDGE
YourOriginal Guide
toSuccessful
Short-Term Trading
Highly EffectiveMarket Strategies
and3-D Charting Techniques
GetMore Info

Powerful Tools
for Traders
Complete 7-Bells Scansand More
Info
More Info
croupiers. The firm and the exchanges are the house. They are net takers from market participants, living off the avails of trading activities in this great capitalist system.
I discovered quickly that the brokers and firm's traders had no particular brand of magic, and proceeded in the quest for market knowledge alone. My library contains some 200 books about the market and trading, some dating back to the late 1800s. These books were written by the likes of William Peter Hamilton, Robert Rhea, Charles Dow, W.D. Gann, Ben Graham, Robert Edwards, John Magee, Richard Shabacker, Warren Buffet, George Soros, R. N. Elliot, Richard Wyckoff, Steve Nison, Tom Demark, Ian Notley, Welles Wilder, Justin Mamis, Jake Bernstein, Victor Sperandeo, Martin Pring, Stan Weinstein, Larry MacMillan, David Caplan, John Brooks, Victor Niederhoffer, Charles Kindleburger, Jesse Livermore, George Angell, William Eng, John Murphy, Gregory Morris, William Dunnigan, Laurence Connors, Linda Bradford Raschke, Alexander Elder, Howard Abell, Robert Prechter, Jack Schwager, Robert Hyerczyk, L.L. Angas, Ken Van Strum, Robert Beckman, R.W. McNeel, Henry Clews, John Maynard Keynes, and Burton Makiel. The list goes on. From number crunching to financial astrology, I endured them all.
I don't know why, but as a child, I distinctly remember watching with fascination, the oil shocks, the sugar shortage, wage and price inflation in the 1970s and the interest rate spike that brought it all to a sudden end. In high school, I watched the gold and real estate manias and their subsequent demise. I bought my first mutual fund in 1984 as a teenager and began trading in 1986. In 1987, a newly minted university graduate, I joined a brokerage firm. I could not find anyone who consistently traded profitably. I blew out my account twice in the early days, but luckily the dollar amounts were small. Those experiences taught me a lot about taking losses quickly. Obviously I was not a fast learner, requiring two blowouts to master the first lesson. The rest was a battle but I slowly and steadily climbed the learning curve until "oleman" came into the picture.
In the early days of the Internet, before the explosion of financial information related to the current mania, there were few places where traders could exchange information outside of the brokerage business. I stumbled upon the AvidTrader site and they had a free chat line. I hung around there for a long time and one day, a gentleman using the handle "oleman", an S&P futures trader, came into the site. We became regulars on the site and at some point, I sent him an email, asking him about his methods. He replied that he traded like Forrest Gump.
His basic logic went something like this:We are told to buy low and sell high. We are told to follow the trend. These would appear to be mutually exclusive at first glance. The only way to make these two
HRE SPOTLIGHT
TechnicalAnalysisMasters
John Murphy
statements reconcile is if we change it to "buy high, sell higher" or "sell low, buy back lower". I was struck dumb by the power and the simplicity of his idea. It was as if I had sailed for a lifetime on the open ocean expecting to fall off the edge and suddenly discovering that the earth was round instead. Perhaps it was like the moment when the apple fell on Isaac Newton's head and he "discovered" gravity. Suddenly it all became clear to me. I was free.
Let's get technical. What is an uptrend? What is a downtrend? Victor Sperandeo, in his first book, Trader Vic- Methods of a Wall Street Master, defines it perfectly:
Upward Trend - An upward trend is a series of successive rallies that penetrate previous high points, interrupted by sell-offs or declines, which terminate above the low points of the preceding sell-off. In other words, an uptrend is a price movement consisting of a series of higher highs and higher lows.
Downward Trend - A downward trend is a series of successive declines which penetrate previous low points, interrupted by rallies or increases which terminate below the high points of the preceding rally. In other words, a downtrend is a price movement consisting of a series of lower lows and lower highs.
This is simple enough but 90 percent of traders probably couldn't tell you off the top of their heads. Once we know the definition of uptrend and downtrend, we are already ahead and on our way. The next thing we need to do is to draw a trend line correctly. It becomes a game of connect the dots. Sperandeo continues:
"For an uptrend within the period of consideration, draw a line from the lowest low, up and to the highest minor low point preceding the highest high so that the line does not pass through prices in between the two low points. Extend the line upwards past the highest high point. It is possible that the line will go through prices past the highest minor high point. In fact, this is one indication of a change in trend, as will be demonstrated shortly."
"For a downtrend within the period of consideration, draw a line from the highest high point to the lowest minor high point preceding the lowest low so that the line does not pass through prices in between the two high points. Extend the line past the lowest high point downward."
Armed with the definition of uptrend and downtrend Oleman said that in his trading he would buy every dip on the way up and be wrong once at the top, whereupon prices would fail to make a higher high. And on a downtrend, he would sell every rally and be wrong once at

the bottom when it would fail to make a lower low. How much simpler could it be? It sure beat what I had seen being done by the desk traders and retail clients all around me, namely, buying every lower low trying to catch the bottom and then shorting each higher high to try to get a top. These people were trading their egos. I thought it would be a good idea to just trade like Forrest Gump and make money instead. I did not press him further for he had parted with a real gem. He did say something about using Average True Range. I did not think it was right for me to ask for more handouts. It was time for me to find a way to employ this fundamental truth. The secret was so simple and so correct. I had indeed missed the "Forrest" by getting too close to the trees.
My mission was defined. I already knew how to take my losses quickly but I was not too elegant in my approach. I wasn't great at letting my profits run because I had the trader's version of permanent post-traumatic stress disorder caused by the Crash of '87. First, I would go back to my pile of books to find methods of identifying uptrends and downtrends. Second, I would find ways to identify and buy each dip on an uptrend and to sell every rally on a downtrend. Out of those ideas, I could find better places to put stop loss orders and find ways to use stop loss orders to alleviate my anxiety when I was up on a trade.
All original materials: © 2003 Brooke Publishers, Inc.
Comments: [email protected]

20 Golden Rulesfor Traders
Trading Masters NEW TO TRADING & TECHNICAL ANALYSIS?Click Here
WIZARDSTUTORIAL
HomeDaily
CoursesTactics
Resources
YOUR DAILY
MARKETGUIDE
Featuring
InteractiveTradingPicks
PICKS, CHARTS, SCANS, IDEAS &
PROFITSCheck outMORNING TRADER
NOW!
andEVERY MARKET
DAY!
Powerful Tools
for Traders
THE HOLY GRAIL During the trading day you may hear references to terms like "Grail buy" and "Grail sale". As the community of traders has evolved, the "Grail buy" has been nicknamed "the dip", implying a place where a buy may be set up. The "Grail sale" has been nicknamed "the ding", implying a place where a short sale may be set up. This refers to the Holy Grail technique, one of many useful trading techniques for any time frame, from Linda Bradford Raschke's book, Street Smarts.
The basic concept is not new. It is widely used by those who trade trends with moving averages. The key is to buy pullbacks in an established uptrend, or sell bounces in an established downtrend and avoid trading ranges. Linda uses Welles Wilder's Average Directional Index (14-period ADX) to determine the strength of a trend, and then she uses a 20-period exponential moving average (EMA) to define support and entry points. When ADX is rising and above 30, she uses certain criteria to buy when prices retrace back to the 20-period EMA. This concept is good for entry points for both uptrends and downtrends.
POWERFULONLINE
TRADINGCOURSE
FromHARD RIGHT EDGE
YourOriginal Guide
toSuccessful
Short-Term Trading
Highly EffectiveMarket Strategies
and3-D Charting Techniques
GetMore Info
HRE SPOTLIGHT
TechnicalAnalysisMasters
John Murphy

Complete 7-Bells Scansand More
Info
The principle behind the Holy Grail set up is to take advantage of a retracement to enter in the direction of the emerging or existing trend. "Retracement" is a word used to define a pullback within an existing trend in the language of technical analysis. These patterns, called flags and pennants, were identified long ago by the likes of Richard W. Schabacker in his book Technical Analysis and Stock Market Profits. Later on, his relative, Robert Edwards, together with John Magee, popularized them in their landmark book, Technical Analysis of Stock Trends. The key to flags and pennants is that they are consolidation areas, and therefore, must be made on diminishing volume.
Linda's technique combines the use of classic chart patterns with ADX and a moving average. In our experience with the Holy Grail technique, the stated requirement of ADX to be over 30 is not critical so long as it has bottomed and is on the rise. We have refined the entry technique using the Dunnigan Bar Count method.
First of all, we believe that the trend of the ADX, rather than the absolute level, is most important. LeBeau and Lucas also share this view. So long as the trend of the ADX is rising, we will be looking for a retracement to the 20EMA as a spot to enter. Second, we have observed that an ADX level of over 50 is usually where a trend nears its climax and becomes vulnerable to an abrupt end, and we usually stand aside in those circumstances. Third, we pay attention to flags on diminishing volume.
Example #1In this example, using the Lucent Technologies daily chart, from the peak of on April 7, a consolidation began. Note that volume and ADX began dropping as price formed a triangle. On May 12, LU tried to break the downtrend line up to that point, the grey line, on volume. It was met the next day with selling and formed a key reversal day, by going higher intraday, but closing lower than the close on May 12. Breakout players were burned as LU fell back into the triangle and the downtrend line was adjusted to a new position, the blue line. On June 4 LU tried to break the downtrend line again on volume but the next day, it was met with sellers again. Note the ADX had gone sideways rather than down, as the lack of movement to the downside, combined with the upward movement of the bars began to affect the ADX calculation.
LU pulled back again toward the moving average, making only "down" and "inside" bars until June 15, when it traded in the narrowest trading range since June 4. Note volume was contracting on this pullback, forming a nice bull flag, as flags are called when the trend is up. As a test of support at the 20-day EMA approached, the moment of truth came for LU. On June 16, LU broke the downtrend line of the bull flag on volume. ADX moved up as the emerging uptrend took hold, with only three "down" days in between, on June 22, July 7 and July 13.
Buyers of the bull flag had two choices. The aggressive move was to enter a resting buy order above the high of each "down" (lower low, lower high compared to the day before) until the order was filled, with an initial stop loss just below the low of the day that the order was filled. The conservative move was to enter a resting buy order above the high of the first "up" day, namely, June 16. Once the buy order was filled, the initial stop loss would be placed just below the low of June 16. Traders could then follow LU up using the Dunnigan Bar Count Stop Method.

Example #2Here is an intraday example seen on a very liquid instrument, the S&P futures contract. On the morning of July 19, the September S&P made a Trader Vic 2B top and the market immediately traded right through the 20EMA5 down two 1421 before it bounced. By the time it reached the 20EMA5, sellers from both the 5- and 15- minute time frames were lined up at the 1425 area, ready to sell on weakness. This set up the first Grail sale. Aggressive traders can enter resting stop sell orders under the "up" bars to enter the trade. The second Grail set up was exactly the same as the first one. The third and fourth set ups were more complicated. We would have been stopped out of the third one for a small loss and not taken the fourth one since there was the possibility of a trend reversal by way of a Trader Vic 1-2-3 test. Note that each time the market fell back to test the low prior to the bear flag bounce, the target was achieved. Any extra is a bonus.

Example #3In this example, the S&P closed on its low the day before. In overnight trading on Globex, the high was 1296.60 with a low of 1283.60. As many traders consider these points to be important support and resistance levels, we label them as "pivot" points, along with the low from the day before at 1283. Clearly the S&P was in a downtrend, but it opened gap up (Globex data is not on this chart) and made three 5-minute "up" candles (higher highs and higher lows relative to the bar before). We began the day by drawing a horizontal line at 1283, with a potential Trader Vic 1-2-3 setup.
When the move reached resistance overhead (supplied by the Globex high at 1296.60 AND the 20 period exponential moving average at 1297.44) and could go no higher, sellers showed up. When the low of the third "up" candle at 1293.50 (formed a white shooting star at the arrow) was broken it was the signal to get short with the expectation that the low at 1283 would be tested. The Holy Grail sale was set up.
The trade was to get short immediately upon breaking 1293.50 with an initial stop loss at 1295.80, the morning's high, in anticipation of a test of the low at 1283. The risk was 2.3 points vs. a 10-point reward on a test of the bottom, a ratio of better than 4:1. Using a conservative trailing stop, one that is placed at the top of each "down" (lower high and lower low relative to the bar before) candle, we would close out the trade on the test of the low, when it would go no lower.
Subsequently, the S&P made a 2B bottom (which could have been traded the same way as illustrated above, but in reverse) and the market bounced to the high of the day, attracted by the magnetic effect
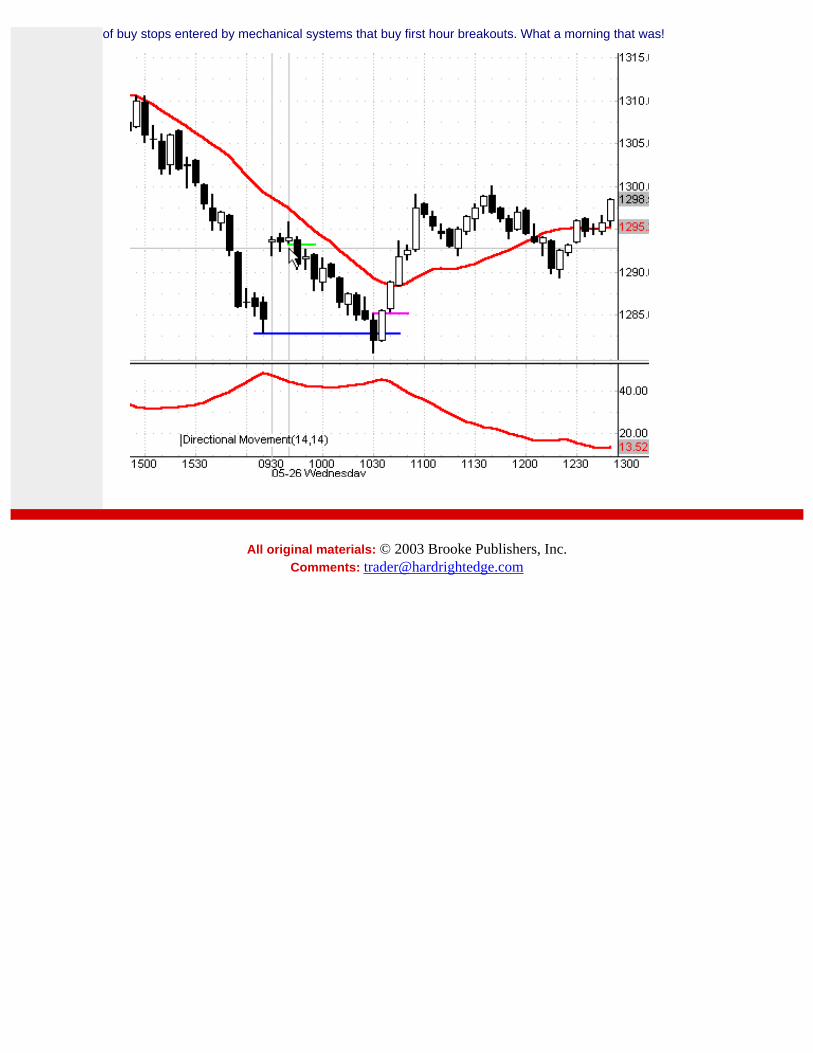
of buy stops entered by mechanical systems that buy first hour breakouts. What a morning that was!
All original materials: © 2003 Brooke Publishers, Inc.
Comments: [email protected]
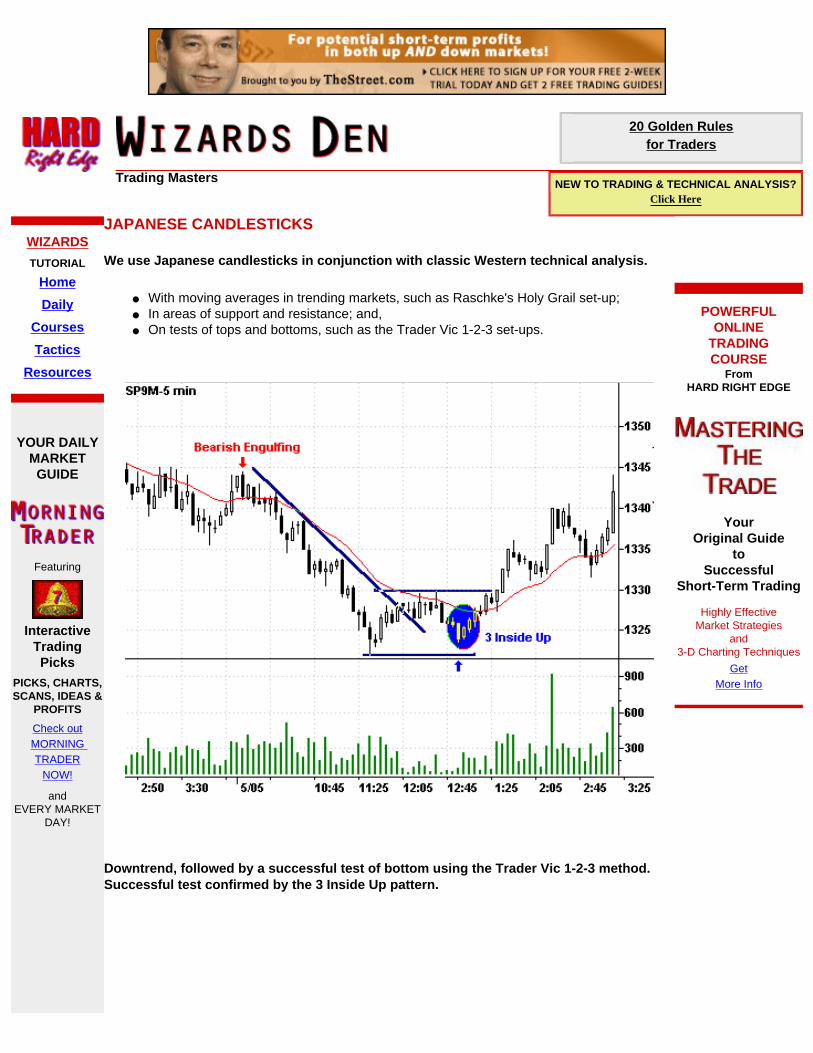
20 Golden Rulesfor Traders
Trading Masters NEW TO TRADING & TECHNICAL ANALYSIS?Click Here
WIZARDSTUTORIAL
HomeDaily
CoursesTactics
Resources
YOUR DAILY
MARKETGUIDE
Featuring
InteractiveTradingPicks
PICKS, CHARTS, SCANS, IDEAS &
PROFITSCheck outMORNING TRADER
NOW!
andEVERY MARKET
DAY!
JAPANESE CANDLESTICKS We use Japanese candlesticks in conjunction with classic Western technical analysis.
● With moving averages in trending markets, such as Raschke's Holy Grail set-up; ● In areas of support and resistance; and, ● On tests of tops and bottoms, such as the Trader Vic 1-2-3 set-ups.
Downtrend, followed by a successful test of bottom using the Trader Vic 1-2-3 method. Successful test confirmed by the 3 Inside Up pattern.
POWERFULONLINE
TRADINGCOURSE
FromHARD RIGHT EDGE
YourOriginal Guide
toSuccessful
Short-Term Trading
Highly EffectiveMarket Strategies
and3-D Charting Techniques
GetMore Info
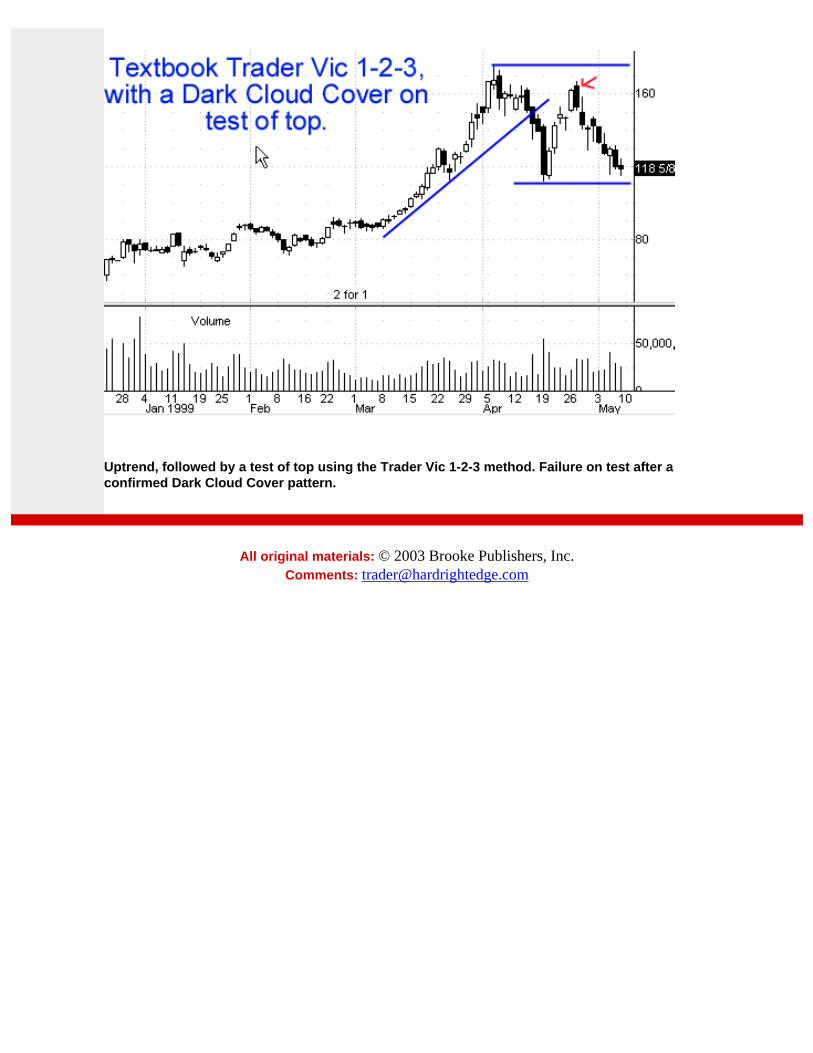
Uptrend, followed by a test of top using the Trader Vic 1-2-3 method. Failure on test after a confirmed Dark Cloud Cover pattern.
All original materials: © 2003 Brooke Publishers, Inc.
Comments: [email protected]

20 Golden Rulesfor Traders
Trading Masters NEW TO TRADING & TECHNICAL ANALYSIS?Click Here
WIZARDSTUTORIAL
HomeDaily
CoursesTactics
Resources
YOUR DAILY
MARKETGUIDE
Featuring
InteractiveTradingPicks
PICKS, CHARTS, SCANS, IDEAS &
PROFITSCheck outMORNING TRADER
NOW!
andEVERY MARKET
DAY!
Powerful Tools
for Traders
DOJIS AND SHOOTING STARS
Doji
Long-Legged Doji
Gravestone Doji
A doji represents indecision and forms part of several important formations:
● Doji Star ● Morning Doji Star ● Evening Doji Star ● Abandoned Baby ● Tri Star
POWERFULONLINE
TRADINGCOURSE
FromHARD RIGHT EDGE
YourOriginal Guide
toSuccessful
Short-Term Trading
Highly EffectiveMarket Strategies
and3-D Charting Techniques
GetMore Info
HRE SPOTLIGHT
TechnicalAnalysisMasters
John Murphy

Complete 7-Bells Scansand More
Info
In this context, the doji star that formed at the red circle was important in the overall assessment of the market. The triangle outlined in blue had a high of 1348 and a lower boundary of 1341, which is 7 points. The way to measure and project price on this descending triangle is to take the lower boundary of 1341 and subtract 7 points to arrive at 1334 and just like magic, a doji star confirmed our measurement.

In this instance, the gravestone doji indicated by the arrow occurred on a test of high, telling the trader that there are many willing sellers on this test.
Black Shooting Star
White Shooting Star
Hangman, Black or White

Here, we see a black shooting star at the test of the previous high within a Trader Vic 1-2-3 2B top reversal set up. The market could go no higher after the shooting star and this was confirmed two candles later breaking support at the 20EMA5. Note the first high was made on a relative of the doji, a spinning top.

Here, we see a black hangman at the test of the previous high within a Trader Vic 1-2-3 reversal set up. The market could go no higher after the hangman and this was confirmed four candles later breaking support at the 20EMA5. Note the first high was made on a long legged doji.

A pattern Linda Raschke calls Three Little Indians, three waves up to a climax, topped by a white hangman indicated by the arrow.
All original materials: © 2003 Brooke Publishers, Inc.
Comments: [email protected]

20 Golden Rulesfor Traders
Trading Masters NEW TO TRADING & TECHNICAL ANALYSIS?Click Here
WIZARDSTUTORIAL
HomeDaily
CoursesTactics
Resources
YOUR DAILY
MARKETGUIDE
Featuring
InteractiveTradingPicks
PICKS, CHARTS, SCANS, IDEAS &
PROFITSCheck outMORNING TRADER
NOW!
andEVERY MARKET
DAY!
PREDATOR OR PREY? Each timeframe in the market has a completely different set of players. Each one has its own predators and its own prey. Do you know your timeframe? The scary part is that if you don't know and stick to your timeframe, you're going to be someone's prey and never know why.
OK, so what are these timeframes? Let's use a pond and fish analogy. The first pond is the 2 minute timeframe. The others are the 5 minute, 15 minute, and daily ponds. Don't worry too much about the physical property of these ponds. For instance, fish in the 2 minute pond can feed on fish in the 15 minute pond. But, the pond analogy is still useful.
The 2 minute pond is the group that takes money in a way that we call slippage. They nasty little devils are fast and furious. It is amazing to watch them. They are really big fish, with tiny little mouths. They spend their day eating teenies. It takes a lot of teenies to satisfy them. So they have to be quick and repetitive. They'll choke on big pieces of meat (large positions for a long time), so they keep their bites small. These fish are comprised of Market Makers, Specialists, abridgers, and scalpers. These guys are trying to take money from all the other fish - including each other.
The 5 minute pond is full of day traders trying to take money from the 15 minute pond. These are the fish looking for intraday trends. Their mouths are built for 1/4, 1/2 or full points. Where the 2 minute fish worry about not getting enough volume, these guys worry having too much. "Who am I going to buy 3,000 shares from and how will I unload 'em." If they try to eat too much at once, their prey might panic and run away.
The 15 minute fish are big ones. These guys work all day long to fill one order. These are the institutional traders or Market Makers acting as traders. They also worry about how much volume they move, but sometimes they just can't hide it. So, they can't buy or sell all at once. They also have to hide their tracks, because the 5 minute fish are trying to spot them and eat from the same plate.
The daily pond is a funny mix. There are two main groups. There are the mutual funds and the Investradors. (I call them this because when a
POWERFULONLINE
TRADINGCOURSE
FromHARD RIGHT EDGE
YourOriginal Guide
toSuccessful
Short-Term Trading
Highly EffectiveMarket Strategies
and3-D Charting Techniques
GetMore Info

Powerful Tools
for Traders
Complete 7-Bells Scansand More
Info
position goes away from them they become Long Term investors, and when they are making money, they are traders. This confusion between Investor and Trader begets the term Investrador.) Investradors are the bottom of the food chain. They supply the money for all the other fishes. Very kind of them really. Fortunately, 80% of them are philanthropic, so there is always a stream of new funds.
The Mutual Fund fish are really big. They move from place to place in the pond, swallowing great masses of Investradors. How can they do this? Can't everyone see them coming? Aren't they the slowest fish in the pond? Yes to all of the above. So the Mutual Funds must use bait. Mutual Funds swim around with their mouths open wide. Around this mouth are numerous goodies to tempt the Investradors. They dangle Research Alerts, Upgrades/Downgrades, Sector Analysis, cover stories on Fortune Magazine, etc.
Let's take a look at this food chain from top to bottom. All the money comes from the Investradors. The mutual funds eat them alive. However, in order for the Mutual Funds to move around they need the help of the Institutional Traders. Kind of like tug boats pushing a freighter around the bay. So once the Mutual Fund fish eats all the Investradors on one path in the daily pond, he calls in the Institutional Trader fish to help change direction. These fish move millions of dollars worth of Investrador flesh. So they tell the Mutual Fund, "OK, I can do it, but you'll have to wait a day or two." Then they take the flesh to the 15 minute ponds and start moving it. This creates eddies in the waters of the 15 minute pond. A good institutional trader with a small amount of Investrador flesh in a big 15 minute pond can't even be seen. However, the larger the order and smaller the pond, the bigger eddies.
Now the astute 5 minute fish is watching the waters of the 15 minute pond. Here he notices something - a trend. The waters of the 15 minute pond can be very murky. However, it is a little easier to spot these moves in the 5 minute pond. That big fish sometimes gets too close or makes a mistake and the Daytrader Fish spots his action. He jumps in front of the Institutional Trader and steals his pound of flesh and moves on. Institutional Fish don't like Daytrader Fish.
During this entire process, the 2 minute fish run around cleaning up all the little leftovers. Finally, all the Investrador flesh is gone. The pond is red with blood, but the fish are feed.
What pond do you play in? There is money to be made in each pond. But only if you know who your prey is and who is your predator.
You can be a 2 minute fish. Are you fast? Are you happy with making teenies? But remember these guys are cannibals.
You can be a 5 minute fish. Are you patient? Do you mind scanning
HRE SPOTLIGHT
TechnicalAnalysisMasters
John Murphy

constantly looking for signs of 15 minute fish? But when it is time to act you better be fast and decisive. And you better like 1/2 point mouthfuls.
You can be a daily fish. Can you handle the big swings in price? Can you watch your stock drop 3 points, while waiting for it to gain 9?
Here's a table to help you evaluate just whom you are competing with:
NAME POND HOLDING PERIOD
FOOD SOURCE
QUALITIES
Investradors Random No clue No Clue No Clue
Mutual Funds
Daily Weeks Investradors Huge amounts of money, Marketing/research groups, and a tackle box full of Investrador lures.
Swing Traders
Daily Days Investradors Smart, careful. Decision-making after market hours.
Institutions 15 Minute
Hours Mutual Funds
Deep pockets, Move Markets over short timeframes, very astute, inside information.
Day Traders
5 Minute
Minutes 15 Minute Fish
Waits for rock solid plays. Decisive. Decision making during market hours.
Momentum 2 Minute
Seconds Investradors Timing High Volume, High Volatility Stocks.
Scalpers 2 Minute
Seconds Everyone Happy just going click, click, click all day long.

One of the most important follow-on lessons here is what timeframes to watch. Basically, you are taking money from the timeframe above you and giving money to the timeframe below you. For example, if you measure your holding period by minutes, then trade off a 5 minute chart. However, you need to monitor the 15 minute and daily charts for opportunities. Likewise, use the 2 minute chart to monitor that pond for hazards. But remember if you are playing in the 5 minute pond then stay there. Don't move from pond to pond.
Now can you decide what pond you are in? Know your prey. Know your predators.
All original materials: © 2003 Brooke Publishers, Inc.
Comments: [email protected]

20 Golden Rulesfor Traders
Trading Masters NEW TO TRADING & TECHNICAL ANALYSIS?Click Here
WIZARDSTUTORIAL
HomeDaily
CoursesTactics
Resources
YOUR DAILY
MARKETGUIDE
Featuring
InteractiveTradingPicks
PICKS, CHARTS, SCANS, IDEAS &
PROFITSCheck outMORNING TRADER
NOW!
andEVERY MARKET
DAY!
Powerful Tools
for Traders
5 PHASES OF A TRADE You can break a trade into 5 phases. Let me reword that: You should break your trades into 5 phases. Three are intellectual and 2 are reflex. Let's start by looking at the phases before the details:
Phase 1 Phase 2 Phase 3 Phase 4 Phase 5
Type Intellectual Reflex Intellectual Reflex Intellectual
Purpose Search for opportunities
Open the position
Manage the trade - follow the rules
Close the position
Analyze
Decisions Is this a setup? Are there other factors that override?
Bid, Split the spread, Market order
Am I in a profit position, or is it looking like a loss? What do my rules tell me to do?
Bid, Split the spread, Market order
Do I take the time or spend time with the family?
Process Click through chart after chart, use search software
ISLAND, ARCA, SOES,...
Watch the price, spread, chart, technicals, S&P, ...
ISLAND, ARCA, SOES, ...
Spreadsheet, chart snapshots, review diary, ...
Emotions Boredom, anxiety, wishing
Fear, Indecision
Fear, Greed, Hope, Anxiety,
Fear, Indecision
Too much work, Introspection is hard. Objectivity is harder. Embarrassment.
POWERFULONLINE
TRADINGCOURSE
FromHARD RIGHT EDGE
YourOriginal Guide
toSuccessful
Short-Term Trading
Highly EffectiveMarket Strategies
and3-D Charting Techniques
GetMore Info

Complete 7-Bells Scansand More
Info
Phase 1 - SEARCHING FOR OPPORTUNITY
This part is fun for the first hour of the day. After that I start getting a little bored.
Phase 1 is simply looking over charts or reading trade rags or whatever, to find setups for the type of trades you like. This is primarily an intellectual process. However, there are emotions that creep in that can really hose you up.
Say you like to trade breakouts. You have just spent an entire hour looking for a breakout the fits your criteria. You haven't found one. You did, however, find that you missed about 3. What is your emotional state of mind at this point? Suddenly, a setup that is a lot like one of your breakouts shows up. However, it is not exact. Your state of mind will push you towards entering that trade. An hour ago, when you were fresh, you wouldn't even consider it. Now it miraculously looks great and you enter another losing trade.
You need to define your process of looking for opportunity and stick to it. If you get bored then, find some creative angle to keep your interest up. If you get upset over every missed opportunity then find another profession.
Phase 2 - OPENING THE POSITION
This part must be reflex. From the time it takes to spot a setup until your order is in should be seconds. I have setups where I hit the offer and others where I bid for the stock. Know your setup and how to trade it. When the setup is identified, no matter how you go about it, open the position. Now. Go. Indecision Kills. If you don't have confidence in your phase 1 process then change it, but DO NOT go into phase 2 and start second guessing. That is the sure sign of a wimp. Wimps lose because they do not trust their own background work. Enough said.
Phase 3 - MANAGING THE POSITION
Well here it is. This is the most difficult part of the whole trading game for most of us. Your money is on the table and it is time to panic. Reminiscence of a Stock Operator has a great quote on comparing the professional to the amateur on this point. He says that for amateurs when the price moves against them they hope it will come back and when they profit they fear the market will take it away. They end up cutting their profits short and letting their losers run. Professionals are just the opposite. When they are losing, they fear the market will take more and when they are profiting, they hope it will continue.
Sound advice. If this is your area of trouble let me suggest something: Go ahead, fear, greed, hope, dream, but learn to ignore them. If you are successful at ignoring them, they will start to go away. The trouble is you will find that these emotions are fun, but will ALWAYS result in failure. What you must do as a professional trader is follow your rules regardless of what you feel like.
Here is what I do. I review my trades at the end of the week and see if I followed my rules exactly. Then I look to see what would have happened if I did follow them. I total all the results and get a bottom line figure. Would following the rules to the
HRE SPOTLIGHT
TechnicalAnalysisMasters
John Murphy

letter result in more money? If so, I keep trading until I can follow the rules. If not, I change the rules.
It takes time to develop confidence in your rules. However, it is time well spent. Your rules are the only weapon you have against yourself. "Luke, Luke, follow the force" only works in movies. With the market, you need cold hard realities outside of your own perceptions. When the emotions are at their highest, the quality of your decisions are at their lowest. Since Phase 3 is the most important and this is where emotions run the highest, is it any wonder most people lose at trading?
One of my favorite trades generates a lot of emotion for me. So, for this trade I have a very clear, objective exit plan. Why? Because all that emotion messes me up. When the trade is reaching the profit objective it always feels like there is more to go. I have reviewed this trade over and over and found that my written exit is the most consistent I can get. So, how do I manage the trade? When the exit signal is given I hit the bid (or offer), period. I don't hem and haw. I don't play "what if" games. I don't dream about a better trade this time. After I open the position, I get the close order ready. I have the confirmation button under the mouse. My eyes are focused, waiting for the exit. Signal, click.
Are all my trades like this? No, just this one. Because it is so emotionally charged I can't afford to do it otherwise.
Phase 4 - CLOSING THE POSITION
Just close it.
Once again this is a reflex action. From phase 3 to 4 you switch from "when do I do it?" to "how do I get out?" At this point my brain is not thinking about the trade, profits, loses, commissions, or the Futures. I have one thing to do: get out. Island, ARCA, whatever, just get me out.
Phase 5 - ANALYZE
Is this important? Ask any professional trader and you will get the same answer: Yes!
Dr. Alex Elder has an interesting way of finding out if a patient is an alcoholic. He will ask the patient to write down every time he has a drink; how much, what were you doing at the time, etc. In a word, keep a diary. If the patient refuses or questions then he is an alcoholic. If not then he is probably not.
The same goes for traders. If you are unwilling to keep a diary of your trades then you are probably addicted to trading for its own sake. You're a loser. Sorry to be so blunt, but someone has to tell you.
Do you want to be a professional trader? Then act like it. Keep records, review your performance. See what works and what doesn't. Find out what conditions goof you up the most. Search for ways to improve and work around those conditions.
If your analysis consists of looking over lost opportunities and pining away the evening you are just creating emotional baggage. You are not analyzing.

One other note on analysis: You cannot form an opinion on a setup based on one or two trades. Think about it. Does every setup/plan work every time? Of course not. You might have found the best trade in the whole world. However, it only works 1 out of 4 times, but when it works it generates huge profits. If you try something and it fails 3 times in a row it may or may not be a bad idea. Paper trade, backtest, do something to boost your confidence in your idea and then give it some time.
Analyze with real data and objectively. Then take that information back and improve Phases 1 and 3. Keep this up and the money will come, the money will come.
PUTTING IT ALL TOGETHER
Now that you have considered the 5 phases, make a copy of this chart and fill in your own Decisions, Process, and Emotions for each type of trade you make. Here's an example for my rules on trading a pullback:
Phase 1 Phase 2 Phase 3 Phase 4 Phase 5
Type Intellectual Reflex Intellectual Reflex Intellectual
Purpose Search for opportunities
Open the position
Manage the trade
Close the position
Analyze
Decisions Has there been enough movement to establish a new trend? Is the stop too far away? Has it cleared a 5 minute high?
Bid for the stock at 1/16 above the 5 minute high.
Stop out the trade if it breaks the low of the pullback. Otherwise, offer out 1/8 below the high before the pullback.
For stopping out hit the bid, for profits offer out.
Did I follow my rules on this one?
Process Look through the charts of very active stocks.
Click Watch the price alone.
Click Pull up the chart at the end of the day and mark the entry and exit points

Emotions Boredom and Frustration
Indecision Fear Indecision It is painful to review a loss and fun to review a win.
Doing this will help you analyze where you might be going wrong or what psychological demons you might be facing. (Do I need to say this?) Then fix it.
All original materials: © 2003 Brooke Publishers, Inc.
Comments: [email protected]