wmd tunnel turning vanes - nasa · wmd tunnel turning vanes ... iii vane profile loss coefficient,...
TRANSCRIPT
Wmd Tunnel Turning Vanes
jiIASA-Ta-87/9’6) UIHD PUSHEL T U R l I P G VABRS OF BODEPY DXSIGIS ( U A S A ) 23 p BC AO2/BP 101
CSCL 14B
6310 9
886-1223!?
Uncfas 04843
T.F. Gelder, R.D. Moore, J.M. Sam, and EX. McFariand Lewis Research Center a e v e w , m o
€%qxEed for ttre
sponsored by the American Institute of Aeronautics and Astmwtk S
Twenty-fourth Aer0sP;ilrx: S c i i Meeting
Reno, Nevada, January 6 8 , 1986
https://ntrs.nasa.gov/search.jsp?R=19860002772 2018-08-02T13:54:55+00:00Z
- ~ -~ -~ - ~ _-
ERRATA
NASA Technqcal Memorandum 8741 6 AI AA-86-0044
UIND TUNNEL TURNIN6 VANES OF MODERN DESIW
T.F. Gelder, R.D. Moore, J.M. Sanz, and E.R. McFarland
The Technical #teamrandurn number (mentioned on the cover and Report Docunrenta- t l o n Page) should be 87146.
WIND TUNNEL TURNING VANES OF MODERN DESIGN
T.F. Gelder, R.D. Moore, J.M. Sanz, and E.R. McFarland National Aeronautics and Space Administration
Lewis Research Center Cleveland, Ohio 44135
Abstract
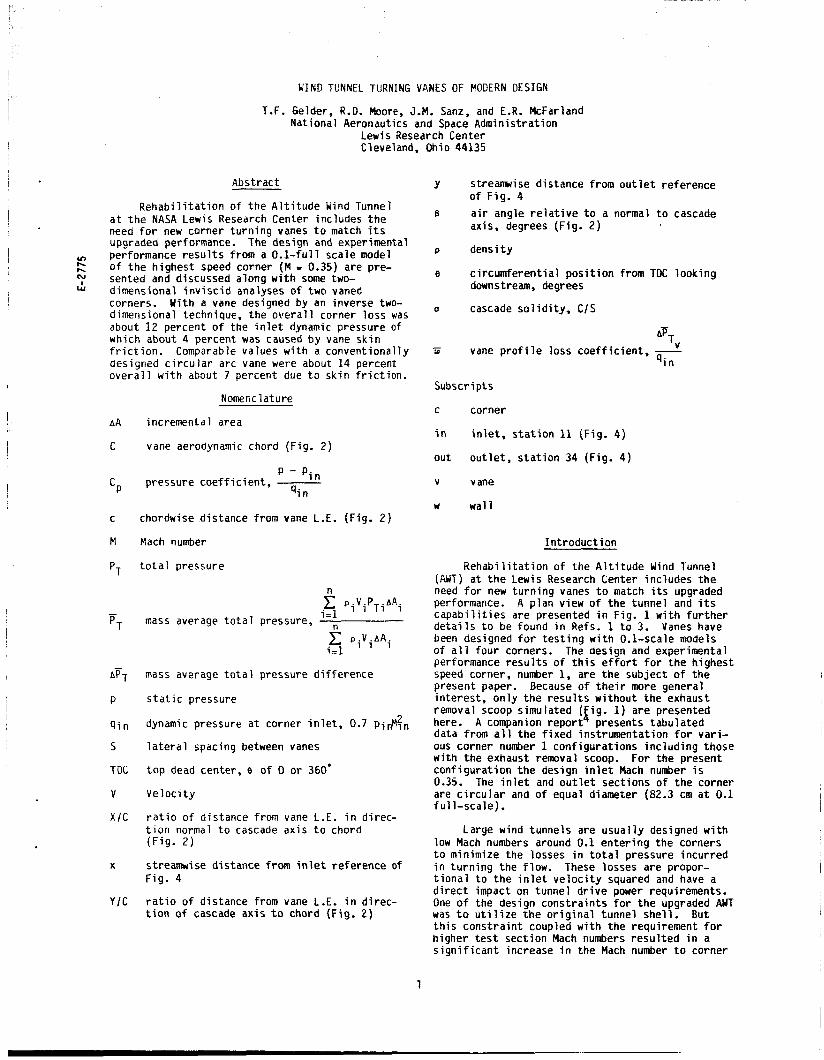
Rehabilitation of the Altitude Wind Tunnel at the NASA Lewis Research Center includes the need for new corner turning vanes to match its upgraded performance. performance results from a 0.1-full scale model of the highest speed corner (M = 0.35) are pre- sented and discussed along with some two-
corners. With a vane designed by an inverse two- dimensional technique, the overall corner loss was about 12 percent of the inlet dynamic pressure of which about 4 percent was caused by vane skin friction. Comparable values with a conventionally aesigned circular arc vane were about 14 percent overall with about 7 percent due to skin friction.
The design and experimental ,,, E y - dimensional inviscid analyses of two vaned
Nomenclature
AA incremental area
C vane aerodynamic chord (Fig. 2)
y
B
P density
e
streamwise distance from outlet reference of Fig. 4
air angle relative to a normal to cascade axis, degrees (Fig. 2)
circumferential position from TDC looking downstream, degrees
u cascade solidity, C I S
AFTv iii vane profile loss coefficient, -
qi n
Subscripts
C corner
in inlet, station 11 (Fig. 4)
out outlet, station 34 (Fig. 4 ) P - Pin
Cp pressure coefficient, - V vane qi n
w wall c
M Mach number
chordwise distance from vane L.E. (Fig. 2)
Introduction
PT total pressure
n
AFT
P
9 i n S
T DC
V
x I C
X
YIC
i=l c p.v i i P Ti .A. 1
mass average total pressure, 2 p i V i ~ A i i=l
mass average total pressure difference
static pressure
dynamic pressure at corner inlet, 0.7 Pi&n
lateral spacing between vanes
top dead center, e of 0 or 360'
Ve 1 oci ty
ratio of distance from vane L.E. in direc- tion normal to cascade axis to chord (Fig. 2)
streamwise distance from inlet reference of Fig. 4
ratio of distance from vane L.E. in direc- tion of cascade axis to chord (Fig. 2)
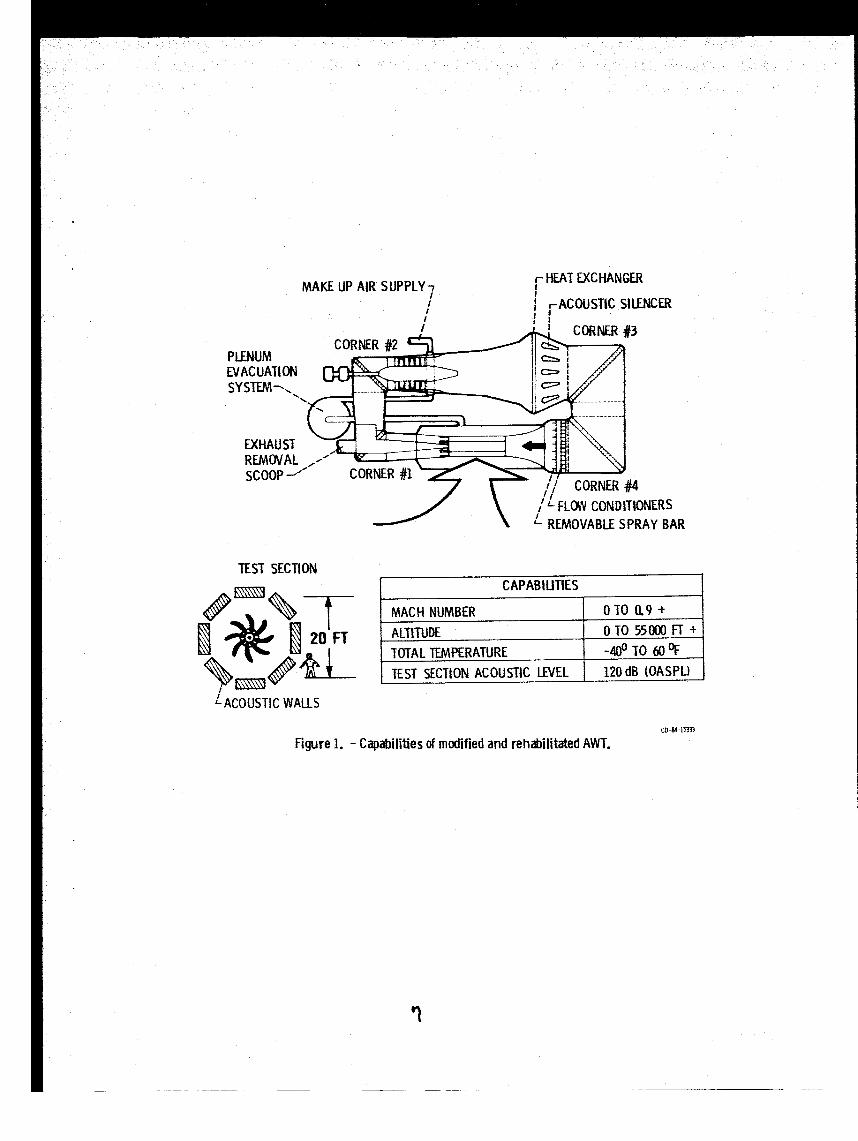
Rehabilitation of the Altitude Wind Tunnel (ANT) at the Lewis Research Lenter includes the need for new turning vanes to match its upgraded performance. A plan view of the tunnel and its capabilities are presented in Fig. 1 with further details to be found in Refs. 1 to 3. Vanes have been designed for testing with 0.1-scale models of all four corners. The design and experimental performance results of this effort for the highest speed corner, number 1, are the subject of the present paper. Because of their more general interest, only the results without the exhaust removal scoop simulated (gig. 1) are presented here. A companion report presents tabulated data from all the fixed instrumentation for vari- ous corner number 1 configurations including those with the exhaust removal scoop. configuration the design inlet Mach number i s 0.35. The inlet and outlet sections of the corner are circular and of equal diameter (82.3 cm at 0.1 full-scale).
Large wind tunnels are usually designed with low Mach numbers around 0.1 entering the corners to minimize the losses in total pressure incurred in turning the flow. tional to the inlet velocity squared and have a direct impact on tunnel drive power requirements. One of the design constraints for the upgraded AUT was t o utilize the original tunnel shell. But this constraint coupled with the requirement for higher test section Mach numbers resulted in a significant increase in the Mach number to corner
For the present
These losses are propor-
1
number 1. To s a t i s f y these severe des ign r e q u i r e - ments, a modern vane design was sought t o min imize t h e losses .
Most o f t h e a v a i l a b l e l i t e r a t u r e on wind
The i n l e t Mach numbers s t u d i e d then t u n n e l t u r n i n g vane designs i s f rom 25 t o 50 y r ~ l d . ~ - l l were much l e s s t h a n 0.35, be ing compa t ib le w i t h t h e more conven t iona l wind tunne l co rne r designs. Also, many o f t hese e a r l i e r s t u d i e s were n o t con- duc ted o r r e p o r t e d i n s u f f i c i e n t d e t a i l t o f u l l y eva lua te t h e r e s u l t s . Thus, a n a l y t i c a l and exper imen ta l s t u d i e s were conducted t o p r o v i d e w e l l documented design and performance i n f o r m a t i o n on w ind t u n n e l t u r n i n g vanes over a range o f i n l e t Mach numbers f r o m about 0.16 t o 0.40 f o r use i n a r e h a b i l i t a t e d AWT as we l l as f o r a modern d a t a base f o r more genera l a p p l i c a t i o n .
Design and A n a l y s i s Codes
Recent exper ience w i t h some t u r n i n g vanes o f modern des ign f o r t h e NASA Apes Research C e n t e r ' s 40 by 80 /80 by 1 2 0 - f t w ind tunne l has demonstrated performance improvements ove r o l d e r design^.^^,^^ Two r e c e n t l y a v a i l a b l e two-dimensional codes were u t i l i z e d f o r t h e Ames' des igns and f o r t h e p resen t AWT co rne r vane d i s. One i s an i n v e r s e des ign techn ique b y Sanz fa,89 which generates vanes o f un ique c r o s s s e c t i o n t a i l o r e d t o avo id boundary l a y e r separa t i on f rom e i t h e r su r face . I t inc ludes a boundary l a y e r c a l c u l a t i o n t o judge t h e nearness o f s e p a r a t i o n and account f o r d isp lacement t h i c k - ness. The o t r i s an i n v i s c i d a n a l y s i s code b y McFarland.16*19 I t uses an improved pane l method f o r s o l v i n g t h e governing equat ions . Vane c ross sec t i ons w i t h t h i s l a t t e r techn ique were more conven t iona l . They cons is ted o f c i r c u l a r a rc surfaces, a c i r c u l a r l ead ing edge segment,and a sharp t r a i l i n g edge. be on t h e Sanz design, h e r e i n a f t e r c a l l e d vane A o r t h e A vanes. Some comparisons w i l l b e made w i th McFar land 's convent iona l shape, h e r e i n a f t e r c a l l e d vane B o r t h e B vanes.
Emphasis i n t h i s paper w i l l
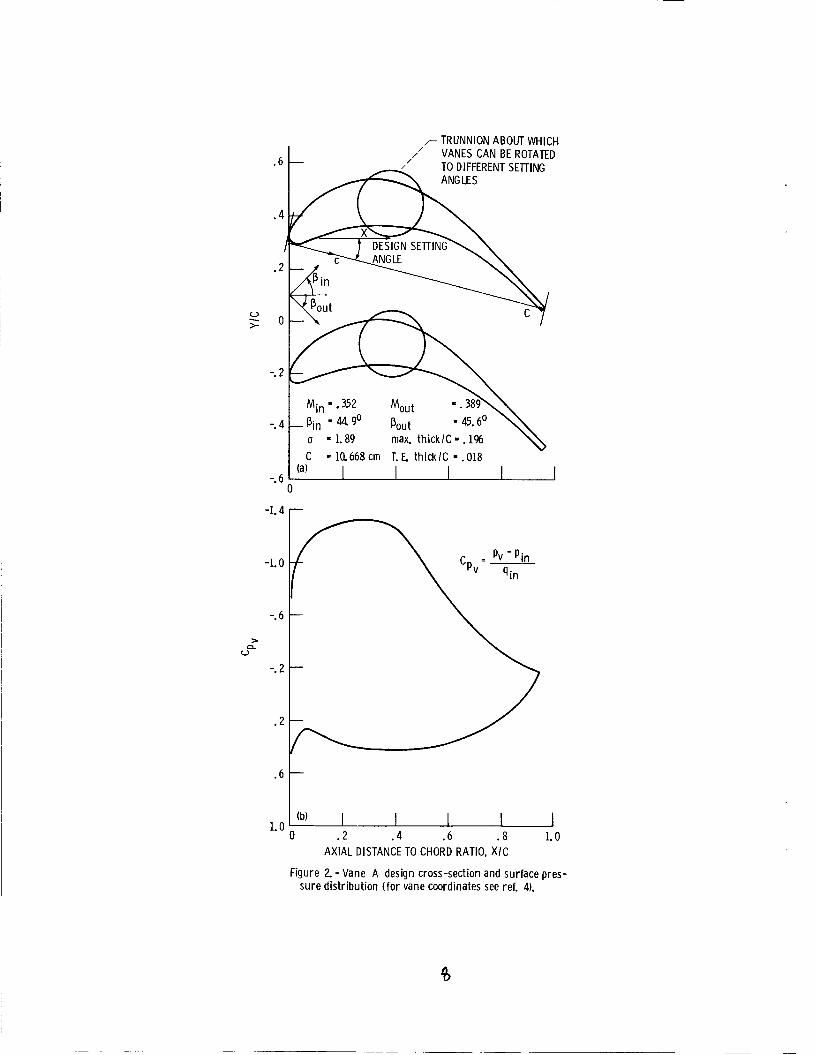
The c ross s e c t i o n and su r face pressure d i s -
The vane s o l i d i t y
t r i b u t i o n o f vane A a t des ign a re shown i n F i g . 2. It i s a r e l a t i v e l y t h i c k b lade w i t h maximum t h i c k - ness t o cho rd r a t i o o f 0.196. o r chord-to-spacing r a t i o i s 1.89, and t h e r e i s l i t t l e camber o v e r the a f t 1/3-chord. A l s o i n d i - ca ted i s a t r u n n i o n ( l o c a t e d a t each end o f t h e vane span) about which t h e e n t i r e vane c o u l d be r o t a t e d and locked t o a d i f f e r e n t s e t t i n g ang le t o a l t e r t h e l o c a l f l o w f i e l d i f des i red .
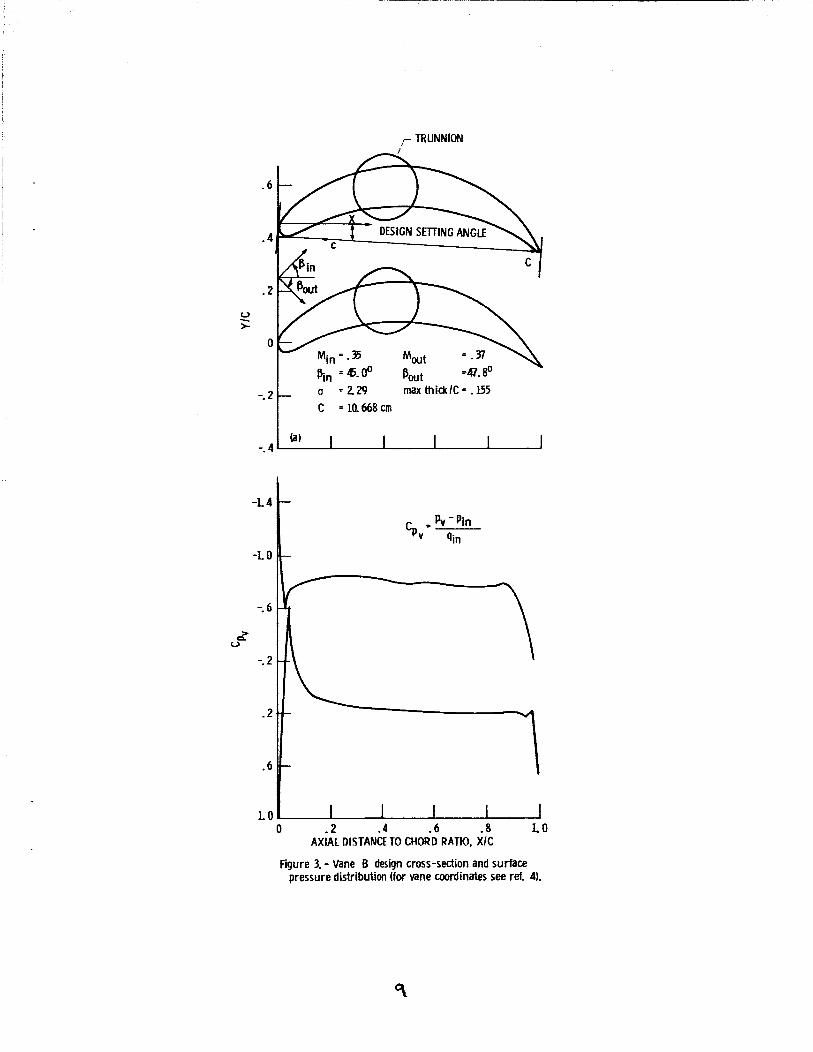
Comparable design i n f o r m a t i o n f o r vane B i s shown i n F i g . 3. Each vane B i s 20 pe rcen t t h i n n e r t h a n vane A, bu t t h e cascade s o l i d i t y i s 20 pe rcen t h i g h e r ( f o u r more vanes r e q u i r e d ) than t h e vane A c o n f i g u r a t i o n .
T e s t F a c i l i t y and I n s t r u m e n t a t i o n
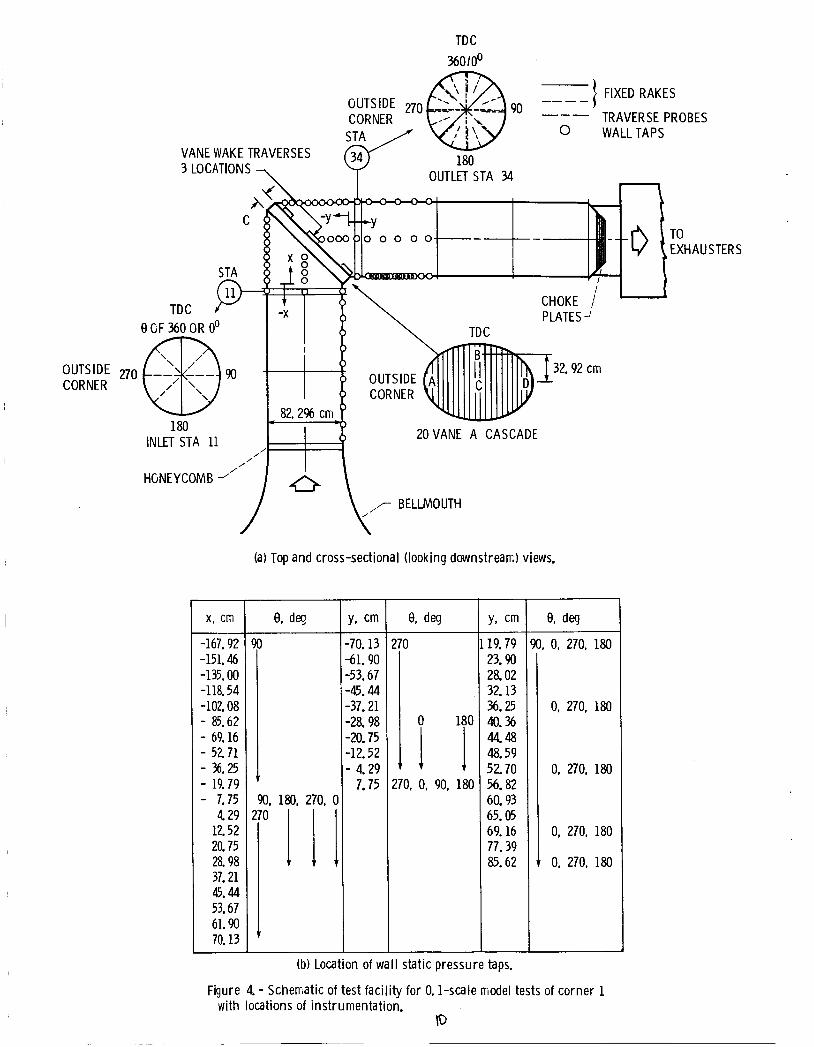
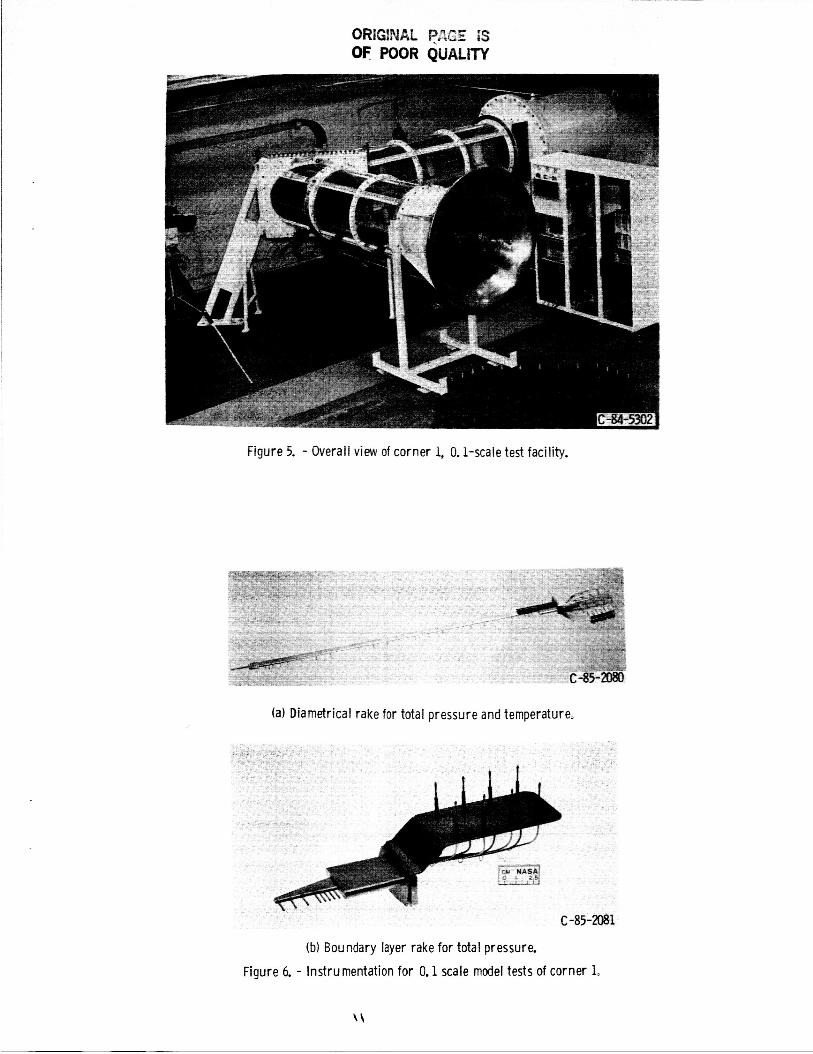
The 0.1-scale t e s t f a c i l i t y i s shown by a schematic d rawing i n F ig . 4 ( a ) and by a photograph i n F i g . 5. As i n d i c a t e d on F i g . 4 (a ) , room a i r i s drawn th rough a bel lmouth, a honeycomb, t h e co rne r vanes, and a choked nozz le p l a t e b y remote exhausters . D i f f e r e n t d iameter choke p l a t e s were used t o v a r y t h e corner i n l e t Mach number a t s ta - t i o n l l f r o m about 0.16 t o 0.40.
Some o f t h e i n s t r u m e n t a t i o n l o c a t i o n s a r e a l s o i n d i c a t e d on F i g . 4 ( a ) . T o t a l p ressure sur - veys were made a t s t a t i o n s 11 ( i n l e t ) and 34 ( o u t l e t ) . There were f i x e d t o t a l p ressure rakes , i n c l u d i n g boundary l a y e r rakes , eve ry 45" a t bo th s t a t i o n s , p l u s r a d i a l t r a v e r s e s t o 46 pe rcen t r a d i u s f r o m t h e w a l l w i t h a combina t ion probe eve ry 22.5' a t s t a t i o n 34. t r a v e r s e probes a r e shown i n F i g . 6. D e t a i l s o f t h e a i r a l i g n i n g combina t ion probe (measures t o t a l p ressure , t o t a l temperature, and f l o w angle, F i g . 6 ( c ) ) may be found i n Ref. 18.
Loca t ions o f t u n n e l w a l l s t a t i c t a p s a r e t a b u l a t e d on F ig . 4 ( b ) . vane s u r f a c e p ressu re t a p s o u t l i n i n g t h e f l o w channels a t t h e f o u r l o c a t i o n s , A t o D, i n d i c a t e d i n t h e f r o n t v iew o f t h e cascade (F ig . 4 ( a ) ) .
Vane wake surveys, one -ha l f chord beh ind t h e cascade were made a t t h e t h r e e l o c a t i o n s i n d i c a t e d on F i g . 4 ( a ) . above was used a t s e v e r a l immersions f rom t h e w a l l and across two vane gaps a t each o f t h e t h r e e l o c a t i o n s . The wake t r a v e r s e equipment was sup- p o r t e d i n a p l a t e i n s t a l l e d downstream o f t h e vanes, as shown i n F i g . 7.
were f a b r i c a t e d t o t h e same span leng th . These were mounted i n a r e c t a n g u l a r frame o r vane h o l d e r as i l l u s t r a t e d i n F i g . 8. The end w a l l s were made o f f l e x i b l e foam, t h e exposed su r face o f which was c a r e f u l l y t r immed t o f o r m t h e r e q u i r e d e l l i p t i c a l con tou r shown i n F i g . 8. The f l e x i b l e foam pro- v ided a cont inuous end w a l l su r face between t h e vane l e a d i n g and t r a i l i n g edges and made i t easy t o change vane s e t t i n g angles.
To v i s u a l i z e t h e c h a r a c t e r o f t h e f l ow , wool t u f t s were taped o n t o t h e t r a n s p a r e n t t unne l w a l l s and on some o f t h e vane sur faces .
The f i x e d rakes and
I n a d d i t i o n t h e r e were
The combina t ion probe desc r ibed
The t u r n i n g vanes o f cons tan t c r o s s s e c t i o n
R e s u l t s and D iscuss ion
The A vanes were t e s t e d a t seve ra l d i f f e r e n t combina t ions o f s e t t i n g ang les i n an a t tempt t o o p t i m i z e t h e o v e r a l l performance o f t h e co rne r . The b e s t c o n f i g u r a t i o n s t u d i e d was w i t h a l l vanes i n t h e cascade r o t a t e d 5 O counter -c lockwise ( f r o m t o p ) f rom t h e des ign s e t t i n g ang le shown on F ig . 2. t h e des ign -5 s e t t i n g ang le o r -5 r e s e t . The f o l l o w i n g d i s c u s s i o n and f i g u r e s expand on t h e performance o f t h e A vanes a t an i n l e t Mach number o f 0.35 i n two c o n f i g u r a t i o n s : one w i t h a l l vanes a t des ign -5' s e t t i n g angle, and t h e o t h e r w i t h a l l vanes a t t h e des ign s e t t i n g angle.
Charac ter o f Flow. The s t a t i c p ressure d i s - t r i b u t i o n s a long t h e o u t s i d e co rne r w a l l s a t o f 270" f o r t h e two vane s e t t i n g angles are shown i n F i g . 9. The p ressu re c o e f f i c i e n t Cpw, a long t h e co rne r i n l e t s e c t i o n i s p l o t t e d above and p a r a l l e l t o t h e i n l e t w a l l i n p a r t ( a ) . The ou t - l e t s e c t i o n Cpw's a r e p l o t t e d t o t h e s i d e o f and p a r a l l e l t o t h e o u t l e t w a l l i n p a r t ( b ) . Wi th -5" r e s e t o f t h e vanes, t h e r e was a s l i g h t decel- e r a t i o n o f t h e o u t s i d e w a l l f l o w approaching t h e cascade (as e v i d e n t by i n c r e a s i n g va lues o f C w ) and a s l i g h t a c c e l e r a t i o n a long t h e o u t s i d e way1 i n l e a v i n g t h e cascade. Wi th -5' r e s e t , t h e w a l l t u f t s showed no i n d i c a t i o n o f f l o w separa t i on o r r e v e r s a l . A lso , t h e measured o u t l e t a i r angles
T h i s o w i l l h e r e i n a f t e r be L e f e r r e d t o as
e
2
from the vane wake surveys at three locations across the cascade (Fig. 4(a)) were within about 1' of the design intent, i.e., parallel to the tunnel wails.
In contrast, at the design setting of the vanes, there was an acceleration of the outside wall flow approaching the cascade which culminated in a strong adverse pressure radient on the out- side wall at the vane outlet ?Fig. 9(b)). It was in this r-apid deceleration region where the tufts started to indicate flow separation from the out- side wall and a high degree of flow turbulence. Also, at the design setting angle of the vanes, the flow angle measurements indicated a general overturning of the flow of about 5 .
Although not shown here, along the inside corner walls (e change in static pressure approaching or leaving the cascade for either setting angle and no indication of flow separation downstream of the vanes.
of go'), there was little
Further evidence of the character of the flow is shown by contour plots of total pressure at the corner inlet and outlet stations in Figs. 10 and 11, respectively. In Fig. 10 the pressure pattern is symmetrical, as expected, with a wall boundary layer about 10 percent radius thick. In Fig. 11, the contour plots of total pressure reveal a good balance around the circumference for the design -5' setting angle (part (a)) with a large central region at relatively high pressure. The wall boundary layer appears to be about 25 percent radius thick. On the other hand at the design setting angle (part (b)), there is a distorted pattern of total pressure. Most of the outside wall, 210. < e < 330*, (approximately) shows a steep pressure gradient extending from the wall t o about 50 percent radius. Wall tufts that were mounted between the vane trailing edge and outlet station 34 over about this same e range indi- cated separation from the wall and turbulent activity similar to that observed at e o f 270O. It appears that the acute corners formed by the intersection of the silction surface of the vanes and the wall for 210' < e < 330' (approx- imately) contain critical flow regions. increased vane loading at the design setting angle compared to the design -5' setting resulted in a breakdown of the flow in these endwall regions and thus increased losses in total pressure.
were measured with a single sensor hot wire. the half-radius position at the corner inlet sta- tion the intensity varied from 1.0 to 1.3 percent. At the coper outlet station with the vanes at design -5 , the turbulence intensity at the half radius position was about 3.0 percent while within the wall boundary layer at one-tenth radius, the intensity was about 8 percent.
the flow in t analysis code p g 9 E s applied to the A vane shape at different combinations of setting angles. Although the code models only two-dimensional, inviscid flow, it can include the effects of the walls of the corner as well as the vanes. The simulated corner is illustrated in Fig. 12(b) which represents the horizontal plane containing the corner centerline. Only 14 of the actual 20
The
Some representative turbulence intensities At
Code Analyses of Flow. Several analyses of rner were made with McFarfand's
vanes could be simulated along with the walls because of computer memory limitations, but this will be shown to be inconsequential. The spacings between vanes and to either wall were accurately simulated. The inlet Mach number and air angle were also properly modelled by scaling down the total flow in the approach section to match the smaller vane number in the cascade.
Some of the results of these analyses are presented in Figs. 13 and 14. tors (with some Mach number levels indicated for reference lengths) near the inner (e of 90.) and outer (e of 270*) walls of the sorner are shown in Fig. 13. At the design -5 setting (Fig. 13(a)), the approaching flow Mach nu&ers to the outer and inner flow channels are nearly the same at about 0.35. Also, the peak off-body Mach number of about 0.6 i s in the outermost channel and diffusing this to the vane outlet level was accomplished without any flow separa- tions along the outer wall. Flow through the innemst channel is slowed to a Mach number of about 0.13 near mid-chord, but this effect does not persist in the next or subsequent channels away from the inner wall.
In contrast at the design setting angle (Fig. 13(b)), the flow approaches the outer vanes at a Mach number of about 0.45 while approaching the inner ones at a Mach number of about 0.30. In the outermost passage between the vane and the wall, the flow accelerates to slightly supersonic levels of 1.015 near vane mid-chord. these near sonic Mach numbers to an outlet value near 0.4 could not be accomplished without the experimentally observed flow separation on the outer wall. Flow through the innermost channel is slowed to a Mach number near 0.07 near mid- chord, but as before this effect does not occur in the next or other channels away from the inner wall.
Carpet plots of the Mach numbers on the vane surfaces are shown in Fig. 14. For the design -5' setting angle (Fig. 14(a)), the maximum upper surface Mach number on the outermost vane was only about 0.7. Diffusing this to the trailing edge level of about 0.3 was accomplished without any visible separation of the flow on this surface. At the design setting angle (Fig. 14(b)), Mach numbers as high as 1.2 occur on the upper surface of the outermost vane. Flow on this surface was experimentally observed to separate before the trailing edge. Only a vane or two away from either wall, at either setting angle, the vane surface Mach number distributions become nearly the same for all other interior vanes.
Selected flow vec-
Diffusing
It is also interesting to note that resetting or respacing only the first vane or two nearest either wall did not alter the character of the overall flow significantly. This was demonstrated in analytical studies like the ones just described and in the experiments with the actual hardware where such configurations were tried.'l
appear to give a useful indication of what the real flow is doing in the cascade, including that in the outermost and innermost flow channels in the horizontal plane containing the centerline at least. Perhaps visualizing similar flow patterns for other horizontal planes above and below the
These two-dimensional, inviscid analyses
3
c e n t e r l i n e i s h e l p f u l i n unders tand ing t h e f l o w breakdown i n t h e outermoSt channels f o r o t h e r e values, f r o m 210' t o 330 f o r example, w i t h t h e vanes a t t h e des ign s e t t i n g angle. Such analyses shou ld be u s e f u l i n d i r e c t i n g p o s s i b l e improve- ments t o o v e r a l l corner designs.
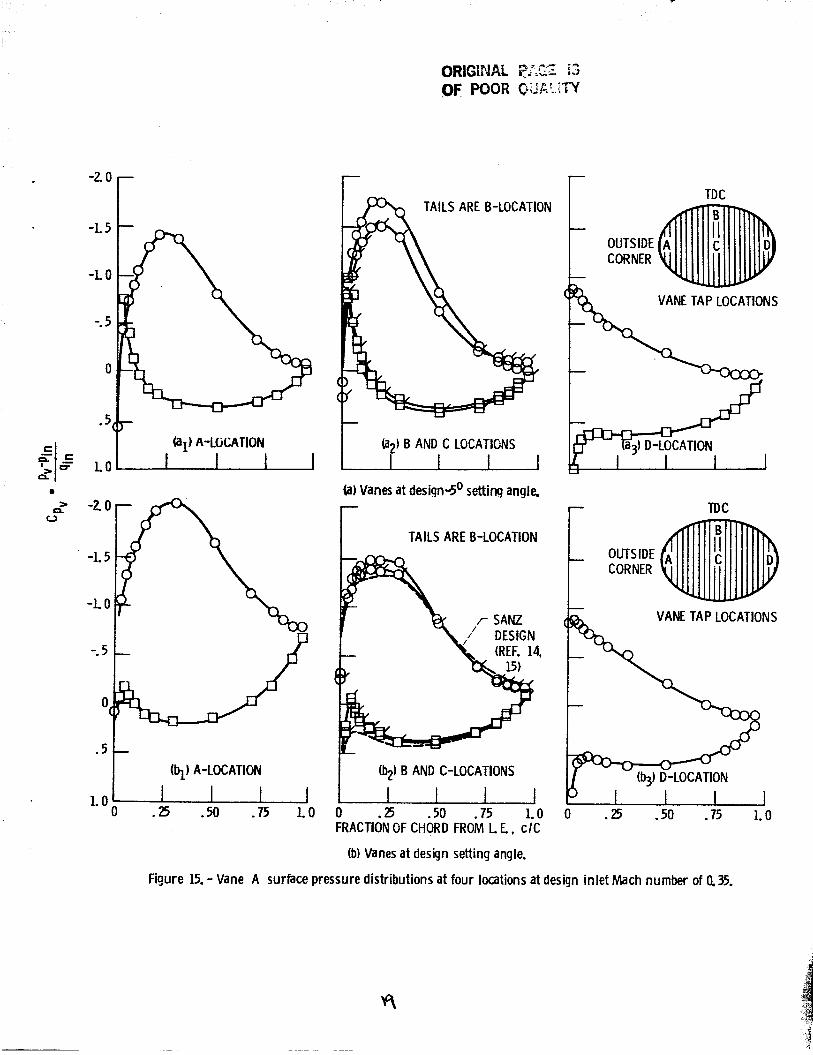
Vane s u r f a c e pressure. Exper imenta l va lues o f vane A s u r f a c e pressure d i s t r i b u t i o n s a t f o u r l o c a t i o n s and two s e t t i n g angles a r e presented i n F i g . 15. A t t h e design -5' s e t t i n g (F ig . 1 5 ( a ) ) , t h e s u r f a c e p ressu re d i s t r i b u t i o n s a re about t h e same a t l o c a t i o n s A t o C. Fo r a l l l oca t i ons , t h e upper s u r f a c e CRV d i s t r i b u t i o n s show no s ig - n i f i c a n t f l a t t e n i n g out b e f o r e t h e t r a i l i n g edge wh ich i s o f t e n i n d i c a t i v e o f f l ow separa t i on . There i s a modest adverse pressure g r a d i e n t near t h e l e a d i n g edge on the p ressu re s u r f a c e f o r l o c a t j o n s A t o C which i s caused b y t h e vane r e s e t o f -5 . However, as w i l l be shown, t h i s d i d n o t adve rse l y e f f e c t t h e vane two-dimensional l osses f o r t h i s c o n f i g u r a t i o n .
t h e c e n t r a l l oca t i ons , B and C y t h e measured sur - f ace pressures a r e c lose t o t h e i n d i c a t e d two- d imens iona l des ign values (Sanz, Refs. 14 and 15) . T h i s i s n o t t r u e a t l o c a t i o n s A and D. D i s t r i b u - t i o n s a t A and D r e f l e c t t h e unbalanced approach f l o w (see F ig . 1 3 ( b ) ) and o t h e r unknown th ree - d imens iona l e f f e c t s . A t t h e ou tboard A l o c a t i o n (F ig . 1 5 ( b ) ) , t h e r e i s no evidence f rom t h e pres- su re d i s t r i b u t i o n o f f l o w separa t i on f r o m t h e upper s u r f a c e on t h i s second vane f rom t h e o u t e r w a l l (see a l s o F i g . 14(b)) .
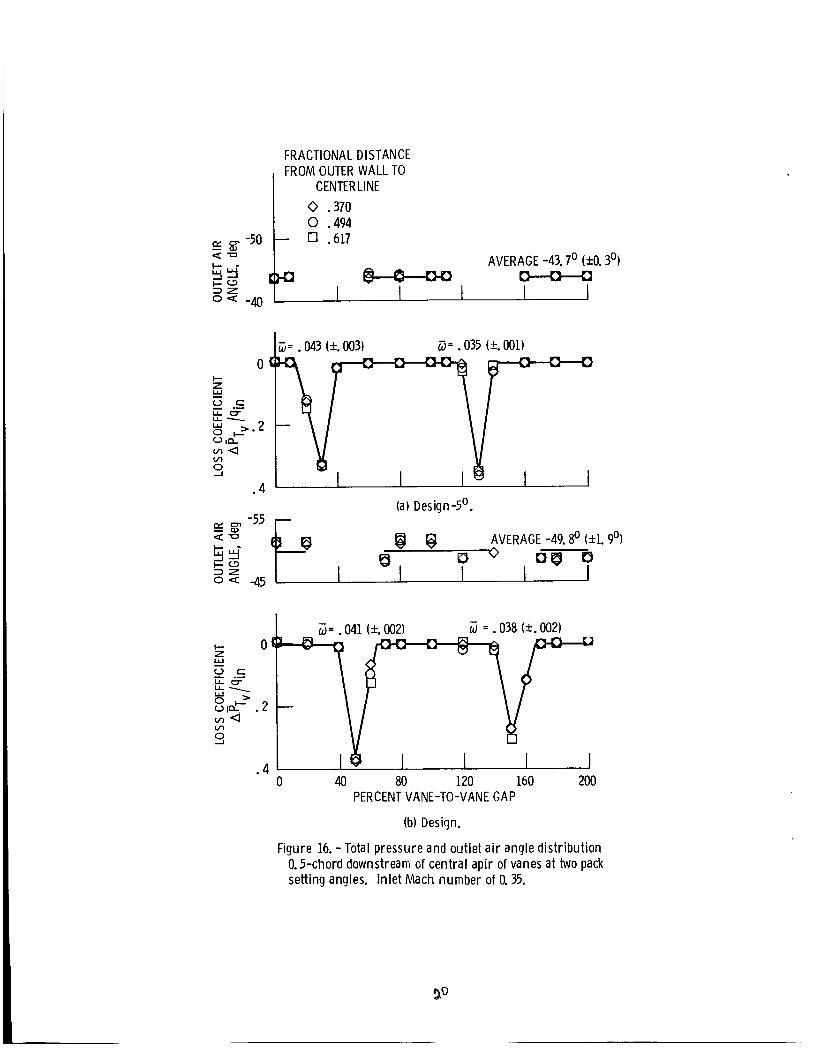
Vane wake surveys. R e s u l t s f r o m some t y p i c a l vane wake surveys behind the c e n t r a l p a i r o f vanes and a t t h r e e spanwise l o c a t i o n s a r e shown i n F i g . 16. These da ta a re f rom t h e most n e a r l y two- d imens iona l p a r t o f the f l o w . The t o t a l p ressures a re presented i n c o e f f i c i e n t form, thus i t s aver- age across a vane gap equa ls t h e p r o f i l e l o s s c o e f f i c i e n t , 0, shown. The sverage l o s s c o e f f i - c i e n t (based on mass averaged t o t a l p ressu res ) i n t h e two-dimensional regime i s about 0.04, i r r e - s p e c t i v e o f s e t t i n g angle, w i t h a d a t a s c a t t e r o f about +0.005. T h i s i s t h e vane p r o f i l e l o s s com- ponent-of t h e t o t a l corner l o s s and i s p r i m a r i l y t h e r e s u l t o f s k i n f r i c t i o n . T h i s s k i n f r i c t i o n l o s s l e v e l i s i n close greement w i t h a boundary l a y e r l o s s c a l c u l a t i o n 1 3 i f t r a n s i t i o n i s assumed near t h e lead ing edge on b o t h sur faces .
A t t h e des ign s e t t i n g ( F i g . 1 5 ( b ) ) , and f o r
There was a s i g n i f i c a n t e f f e c t o f vane s e t t i n g ang le on t h e o u t l e t a i r angles a l s o shown on F i g . 16. ( F i g . 16 (b ) ) , t h e f l o w i n t h e f r e e s t r t a m p a r t o f t h e wake survey was over tu rned about 5 s i n c e o t h e ang le measured was about -50° r a t h e r t h a n -45 ( r e f e r e n c e d t o a normal t o t h e cascade a x i s ) . T h i s may have been caused i n p a r t b y t h e f l o w s e p a r a t i o n on t h e ou ter w a l l a long w i t h o t h e r th ree-d imens iona l , v iscous e f f e c t s n o t addressed w i th t h e des ign code. By r e s e t t i n g t h e vanes -5", t h e o u t l e t a i r ang le was measured a t about -44' ( F i g . 1 6 ( a ) ) , o r w i t h i n about 1' o f t h e d e s i r e d va lue .
A t t h e design s e t t i n g ang le
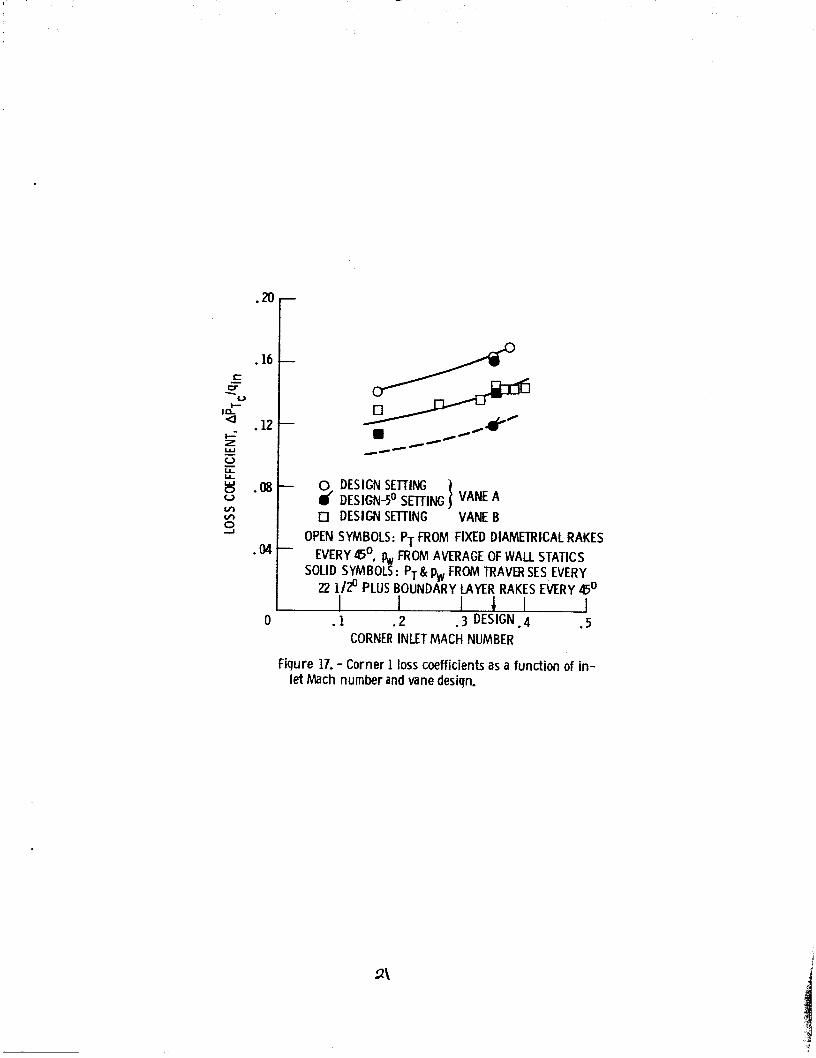
O v e r a l l co rne r losses. The co rne r 1 losses ove r a range o f i n l e t Mach nimbers a re summarized on F i a . 17. The A vanes (F iq . 2 ) a t two s e t t i n a angle; ( d e s i g n and d e ~ i g n ' - 5 ~ ) a r e shown and co i - pa red t o t h e more convent iona l c i r c u l a r a rc B
vanes (F ig . 3 ) t e s t e d a t t h e i r des ign s e t t i n g i n t h e same co rne r and f a c i l i t y .
From F i g . 17, t h e o v e r a l l co rne r loss coef - f i c i e n t f o r t h e A vanes a t t h e des ign i n l e t Mac; number of 0.35 was about 0.12 f o r t h e des ign -5 s e t t i n g ang le and about 0.16 f o r t h e des ign s e t - t i n g . Compared t o t h e des ign s e t t i n g , t h e r e s e t -5O c o n f i g u r a t i o n p rov ided a much b e t t e r ba lance o f t h e f l o w approaching t h e cascade. T h i s avo ided a breakdown o f t h e f l o w i n t h e vane end-outer w a l l i n t e r s e c t i o n r e g i o n s around t h e o u t s i d e o f t h e corner , 210" < e < 330", approx imate ly . r e f u l t was t h i s 25 pe rcen t decrease i n l oss . The -5 r e s e t a l s o p rov ided t h e d e s i r e d co rne r o u t l e t a i r angle. angle, t h e loss c o e f f i c i e n t was about 0.14. Here t h e o u t e r w a l l t u t f s i n d i c a t e d t h e f l o w remained a t tached i n t h e vane o u t l e t r e g i o n and t h e o u t l e t a i r ang le was w i t h i n about 1' o f t h a t des i red . Thus t h e r e was no reason t o r e s e t t h e B vanes. The co rne r l o s s d i f f e r e n c e between u s i n g t h e A vanes r e s e t -5' and t h e B vanes a t des ign i s due m a i n l y t o t h e lower vane s k i n f r i c t i o n component w i t h t h e A vanes. For t h e A vanes t h e s k i n f r i c - t i o n l o s s was about 0.04 ( F i g . 16 ) ; f o r t h e B vanes i t was about 0.07 ( n o t shown i n t h i s paper) .
ang le d i s t o r t i o n shou ld a l s o be b e t t e r t han f o r t h e B vane design, a t l e a s t i n t h e two-dimensional r e g i o n s o f t h e f l o w . T h i s i s because t h e r e i s no upper su r face pressure s p i k e near t h e l e a d i n g edge f o r t h e A vane (F ig . 1 5 ( a ) ) l i k e t h e r e i s f o r t h e B vane ( F i g . 3 ) . c i e n t l y inc reased b y h i g h e r than des ign i n l e t f l o w ang les t o cause premature s e p a r a t i o n f r o m t h e vane su r face and t h u s h i g h e r l o s s and an o f f des ign o u t l e t a i r angle.
decreased s l i g h t l y w i t h dec reas ing i n l e t Mach number. A l though n o t shown, vane B d a t a i n d i c a t e d t h e two-dimensional vane s k i n f r i c t i o n component o f t h e co rne r l o s s c o e f f i c i e n t d i d n o t v a r y w i t h i n l e t Mach number. Thus, t h e decrease i n co rne r l o s s i s a t t r i b u t e d t o decreased losses i n t h e vane end w a l l r e g i o n s and t o reduced eddy a c t i v i t y f r o m t u r n i n g a th ree-d imens iona l f l o w around a co rne r . These th ree-d imens iona l l osses comprise about t w o - t h i r d s o f t h t t o t a l co rne r c o e f f i c i e n t f o r t h e A vanes r e s e t -5 den t o f Reynolds number. made b y Wat tendor f .20
on mass-averaged t o t a l p ressure . L o c a l l y measured s t a t i c and t o t a l p ressures f r o m a l l rakes and combina t ion probes were used when a v a i l a b l e . However, t h e use o f an average s t a t i c p ressure f r o m t h e w a l l t a p s and t o t a l p ressures f rom t h e f i x e d d i a m e t r i c a l rakes r e s u l t e d i n n e a r l y t h e same o v e r a l l , mass-averaged, l o s s c o e f f i c i e n t s (see open versus s o l i d symbols on F ig . 1 7 ) .
The n e t
W i th t h e B vanes a t des ign s e t t i n g
The A vane t o l e r a n c e t o p o s s i b l e i n l e t f l o w
Such sp i kes c o u l d be s u f f i -
The co rne r l o s s c o e f f i c i e n t s (F ig . 17 )
and a r e b e l i e v e d t o be indepen- Such an assumption was
The l o s s c o e f f i c i e n t s o f F i g . 17 a re based
Comparisons w i t h l i t e r a t u r e . On ly two r e f e r - ences were found where o v e r a l l co rne r l o s s coef - f i c i e n t s f o r 90' t u r n i n g vanes i n a cons tan t d iameter c i r c u l a r duc t were g iven. r e l a t i v e l y low i n l e t Mach numbers o f about 0.1. Krober5 r e p o r t s a l o s s c o e f f i c i e n t o f 0.135. R e s u l t s f rom a Russian handbook o f h y d r a u l i c r e s i s t a n c e which i s t r a n s l a t e d i n t o E n g l i s h i n Ref. 10, i n d i c a t e s a range o f va lues f rom 0.26 t o
These were f o r
4
0.33. This variation depended on vane number and la te ra l spacing and was fo r corners t ha t were cut O f f t h e length of the vane chord just like t h e present configurations (see Fig. 9 ) . The minimum loss coefficient shown i n Ref. 10 was 0.18 where these corner cut-offs were rounded. A t an in l e t Mach number of 0.1, the present data indicate loss coefficients of about 0.10 f o r the A vanes reset -5" and about 0.12 fo r the B vanes.
Some recent, two-dimensi a1 resu l t s from the NASA Antes Research Centerq3 give an area- averaged loss coefficient from vane wake survey measurements f o r a McFarland designed c i rcu lar arc vane similar t o t h e B vane i n t h e present paper. This l o s s coefficient obtained i n a rectangular flow channel does not include the very near wall data a t t h e ends o r sides of t h e channel. Thus, t h e reported loss level of 0.07 f o r an inlet Mach number near 0.1 i s lower than the overall corner value i n a c i rcu lar duc t of about 0.12 f o r t h e B vanes on F i g . 17. However, from wake surveys done in the two-dimensional flow region behind t h e central pa i r of B vanes i n t h e present study (but not shown here) t h e loss coefficient was about 0.07, t h e same as the Ames result .
corner w i t h conventional circular arc vanes ( l ike the B vanes) was tested. coefficients from about 0.11 t o 0.13 a re reported f o r i n l e t Mach numbers near 0.1. These Ames' t o t a l pressure loss coefficients were determined from w a l l s t a t i c pressures across the corner using the incompressible Bernoulli equation and t h e continuity equation. These coefficients include the viscous end and s ide wall effects. A similar calculation w i t h t he B vane data from t h e present study gave about these same values which i n t u r n agree w i t h t h e mass-averaged to t a l pressure loss coef f ic ien ts on Fig. 17. However, t h i s apparent agreement between loss coefficients using t o t a l pressure differences from e i ther wall s t a t i c Pressure derived values or d i r ec t ly measured mass-averaged values may be fortuitous. T h i s i s because t h e s t a t i c pressures across e i ther i n l e t o r ou t le t s ta t ions were not constant w i t h radius fo r the present configurations tested. these variations tended t o cancel out i n deter- mining a pressure differences across t h e corners studied.
i n another Ames study,21 a two-dimensional
There, corner loss
Apparently
Sumnary of Results
T u r n i n g vanes fo r use i n the h i g h e s t speed corner, w i t h c i rcu lar ducting, of an upgraded A l t i t u d e Wind Tunnel (AWT) a t the NASA Lewis Research Center have been designed w i t h modern techniques and tested i n a 0.1 fu l l - sca le f a c i l i t y w i t h t h e following principal results.
0.35, t h e overall corner loss was only about 12 percent of the in l e t dynamic pressure with turning vanes designed by an inverse two- dimensional technique, of which about 4 percent was caused by the vane skin f r ic t ion . Comparable values f o r recently designed, b u t conventionally shaped c i rcu lar arc type vanes tested i n the same f a c i l i t y were about 14 percent overall with about 7 percent due t o s k i n f r ic t ion . corner ou t l e t a i r angles were within about 1" of the design intent.
1. A t the design corner inlet Mach number of
For both, t he
2. Use of flow solutions from a two- dimensional, inviscid analysis code t o indicate what the real flow may be doing a t l eas t i n the horizontal plane containing the corner centerline was demonstrated. Such a code should be useful in directing possible improvements t o overall corner designs.
References
1.
2.
3.
4.
5.
6.
7.
8.
9.
10.
11.
12.
13.
Chamberlin, R., "The Altitude Wind Tunnel (AN) - A Unique Fac i l i ty f o r Propu!sion System and Adverse Weather Testing, AIAA Paper 85-0314, Jan. 1985.
Abbott, J.M., Diedrich, J.H., Groeneweg, J.F., Povinelli, L.A., Reid, L., Reinrnann, J.J. and Szuch, J.R., "Analytical and Physical Modeling Program f o r the NASA Lewis Research Center's A l t i t u d e Wind Tunnel (AWT)," AIM Paper 85-0379, Jan. 1985.
Blaha, B.J. and Shaw, R.J., "The NASA A l t i t u d e Wind Tunnel : Research and Development," AIM Paper 85-0090, Jan. 1985.
Moore, R.D., Boldman,.D.R. and Shyne, R.J., "Experimental Evaluation of Two Turning Vane Designs fo r Corner 1 of 0.1-Scaled Model of NASA Lewis Research Center's A l t i t u d e Wind Tunnel," Proposed NASA TP.
Krober, G., "Guide Vanes f o r Deflecting F l u i d Currents w i t h Small Loss of Energy," NACA TM-722, 1933. ( Ingenieur-Archiv, Vol. 3, 1932).
Patterson, G.N., 'Note on t h e Design of Cor- ners i n Duct Systems," ARC R&M-1773, 1936.
Collar, A.R., "Some Experiments w i t h Cascades of Aerofoils," ARC R&M-1768, 1936.
Sa l te r , C., "Experiments on Thin T u r n i n g Vanes," ARC R&M-2469, 1946.
Winter, K.G., "Comparative Tests of Thick and Thin Turning Vanes in the Royal Aircraft Establishment 4x3-Ft. Wind Tunnel," ARC
I t s Role in Advanced Icing
RW-2589, 1947.
Idel 'chik, I.E., Handbook of Hydraulic Resis- tance. Coefficients of Local Resistance and of Friction, AEC-TR-6630, 1966.
Pope, A and Harper, J.J., Low-Speed Wind Tun- nel Testinq, John Wiley and Sons, New York, 1966.
Sanz, J.M., McFarland, E.R., Sanger, N.L., Gelder, T.F., and Cavicchi, R.H., "Design and Performance of a Fixed, Nonaccelerating Guide Vane Cascade tha t Ooerates Over an In le t Flow Angle Range of 60 Degrees,' Journal of Engi- neering f o r Gas Turbines and Power, Vol. 107, No. 2, Apr. 1985, pp. 477-484.
Corsiglia, V.R., Olson, L.E., and Falarski, M.D., "Aerodynamic Characteristics of t h e 40-by 80/80-by 120-Foot Wind Tunnel a t NASA Ames Research Center," NASA TM-85946, 1984.
5
14. Sanz. J.M.. " D e s i m o f S u D e r c r i t i c a l Cascades w i t h - H i g h S o l i d i t i , " AIM' Journa l , Vol . 21, No. 9, Sept. 1983, pp. 1289-1293.
15. Sanz, J.M., "Improved Des ign o f S u b c r i t i c a l and S u p e r c r i t i c a l Cascades Us ing Complex C h a r a c t e r i s t i c s and Boundary Layer Cor rec- t i on," U n i v e r s i t i e s Space Research Associ a- t i o n , Columbia, MD, May 1983. (NASA CR-168166).
16. McFarland, E.R., " S o l u t i o n o f P lane Cascade Flow Us ing Improved Sur face S i n g u l a r i t y Methods," Jou rna l o f Eng ineer ing f o r Power, Vo l . 104, NO. 3, J u l y 1982, pp. 668-674.
17. McFarland, E.R., "A Rap id B lade- to -B lade S o l u t i o n f o r Use i n Turbomachinery Design," Jou rna l o f Eng ineer ing f o r Gas Tu rb ines -and Power, Vo l . 106, No. 2, Apr. 1984, pp. 376-382.
18. Glawe, G.E., Krause, L.N. and Dudz insk i , T.J., "A Smal l Combinat ion Sensing Probe f o r Meas- urement o f Temperature, Pressure, and F low D i r e c t i o n , " NASA TN-D-4816, 1963.
19. L i e b l e i n , S. and Roudebush, W.H., " T h e o r e t i c a l Loss R e l a t i o n s f o r Low-Speed Two-Dimensional- Cascade Flow," NACA TN-3662, 1956.
20. Wat tendor f , F.L., " F a c t o r s I n f l u e n c i n g t h e Energy R a t i o o f R e t u r n F low Wind Tunnels," F i f t h I n t e r n a t i o n a l Congress f o r A p p l i e d Mechanics, J.P. Har tog and H. Pe ters , eds., Wi ley , New York, 1939, pp. 526-530.
21. Ecke r t , W.T., W e t t l a u f e r , B.M. and Mort , K.W., "The Aerodynamic Performance o f Severa l F low C o n t r o l Dev ices f o r I n t e r n a l F low Systems," NASA TP-1972, 1982.
6
MAKE UP AIR SUPPLY7 I
I I
r HEAT EXCHANGER I
rACOUSllC SILTNCER ! I
PLENUM WAC UATi ON SYSTEM-, \
EXHAUST REMOVAL SCOOP -I
fL FLOW CONDITIONERS REMOVABLE SPRAY BAR
TEST SECTION
LACOUSTfC WALLS
I C APABIUTIES 1 MACH NUMBER OTO (L9 + ALTITUDE TCTTAL 'IEMPERATURE - @ T O 6 0 9 . TEST SECTION ACOUSTIC LEVEL
0 TO 55000 IT +
120dB (OASPL)
CD-U-15333
Figure 1. - Capabilities of modified and rehabilitated AWT.
.6
. 4
.2
u I > o
-. 2
-. 4
-. 6 0
-1.4
-1.0
-. 6
> n
V
-. 2
.2
r TRUNNION ABOUT WHICH /' VANES CAN BE ROTATED
// TO DIFFERENT SEillNG - ANGLES
= .389 = 45.6'
max. thicklC = -1% \ Mout -pin 41.9~ Pout
Min .352
(J = 1.89 C = 10.668 cm T. E. thicklC = .018
(a I I
(b) 1 0 . 2 . 4 .6 . 8 1.0
Figure 2. - Vane A design cross-section and surface pres-
1.0 I AXIAL DISTANCE TO CHORD RATIO, XIC
sure distribution ( for vane coordinates see ref. 4).
,r- TRUNNION
-. 2
-. 4
-L 4
-I 0
-. 6
> n u -. 2
. 2
.6
LO
I / - _1
- u -229 max thidtlC = -155 C -1Q668m
(a) 1 I I I I
0 - 2 . 4 .6 . 8 LO AXIAL DISTANCE TO CHORD RATIO. X/C
Figure 3. - Vane B design cross-section and surface pressure distribution (for vane coordinates see ref. 4).
TD C 36010O
TRAVERSE PROBES --- 0 WALL TAPS
VANE WAKE TRAVERSES
OUTLET STA 34
PLATES-'
20VANE A CASCADE INLET STA 11
HGNEYCOMB
OUTSIDE CORNER
270
(a) Top and cross-sectional (looking downstream) views.
x, cm
-167.92 -151.46 -135.00 -118.54 -102.08 - 85.62 - 69.16 - 52.71 - 36.25 - 19.79 - 7.75
4.29 12.52 20.75 28.98 37.21 45.44 53.67 61.90 70.13
-70.13 -61.90 -53.67 -45.44 -37.21 -28.98 -20.75 -12.52 - 4.29
7.75
y, cm
19.79 23.90
32.13 36.25 40.36 44.48 48.59 52.70 56.82 60.93 65.05 69.16 77.39 85.62
2 8 02
(b) Location of wall static pressure taps.
0, 270, 180
0, 270, 180
0, 270, 180
0, 270, 180
0. 270, 180
TER S
Figure 4. - Schenatic of test facil i ty for 0. l-scale model tests of corner 1 with locations of instrumentation.
10
ORlGIPSAE k3Ls,Gk IS OF POOR QUALITY
Figure 5. - OveraI
~~
view of corner 1, 0.1-scale test facility.
(a) Diametrical rake for total pressure and temperature,
(b) Boundary layer rake for total pressure.
Figure 6. - Instrumentation for 0.1 scale model tests of corner 1,
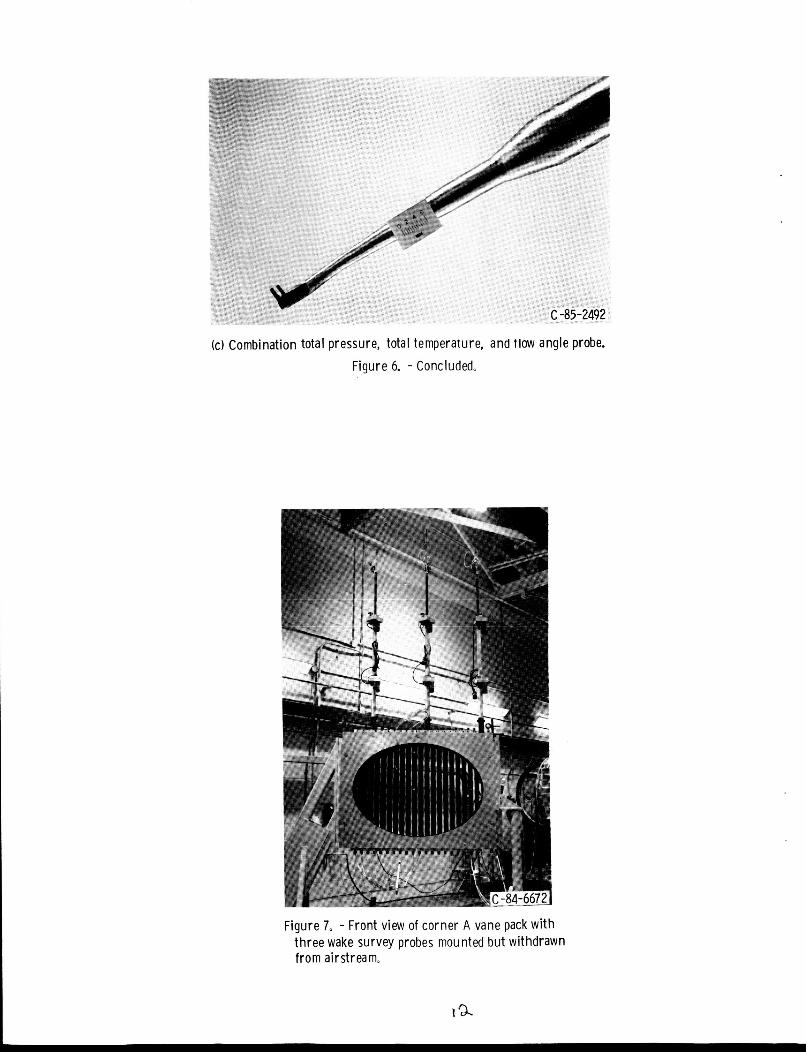
(c) Combination total pressure, total temperature, and tlow angle probe. Figure 6. - Concluded,
Figure 7. - Front view of corner A vane pack w i t h three wake survey probes mounted bu t withdrawn f rom airstream,
ra
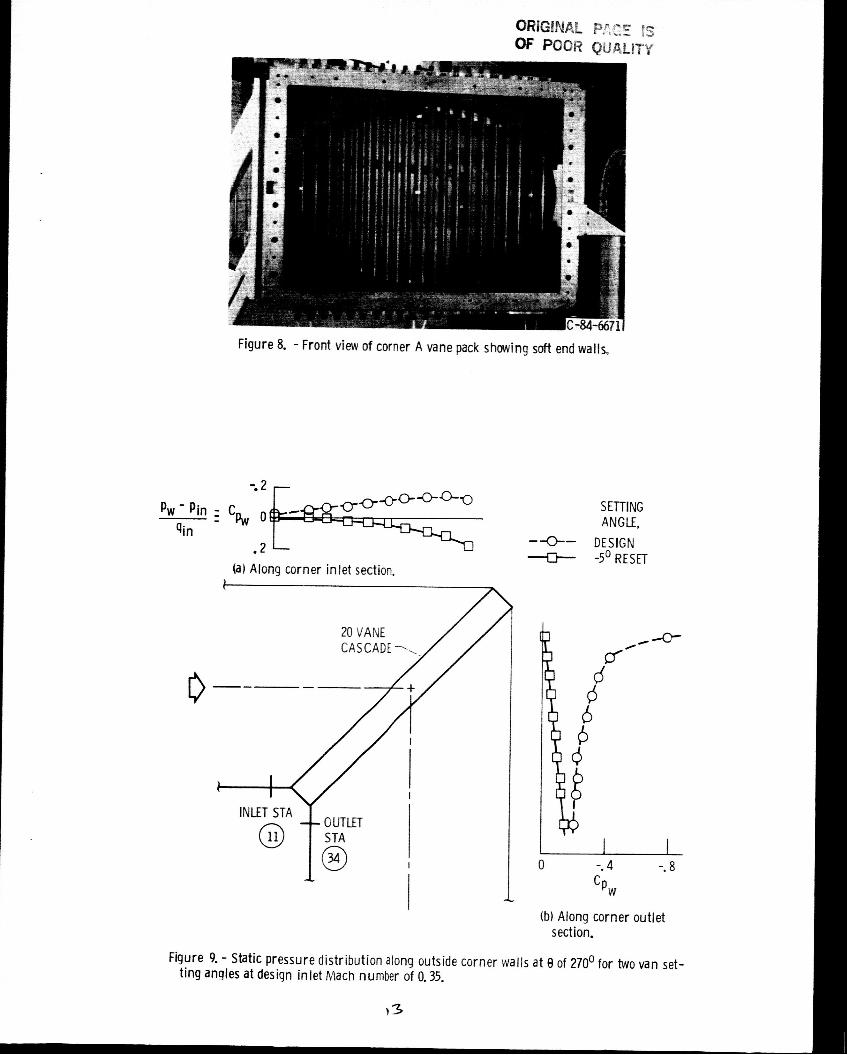
Figure 8. - Front view of corner A vane pack showing soft end walls,
(a) Along corner in le t section.
SETTING ANGLE,
-e- DESIGN -fl- -5ORESET
1 0 -. 4 -. 8
(b) Along corner outlet section.
Figure 9. - Static pressure distr ibution along outside corner walls at 9 of 270Ofor two van set- t ing angles at design inlet Mach number of 0.35.
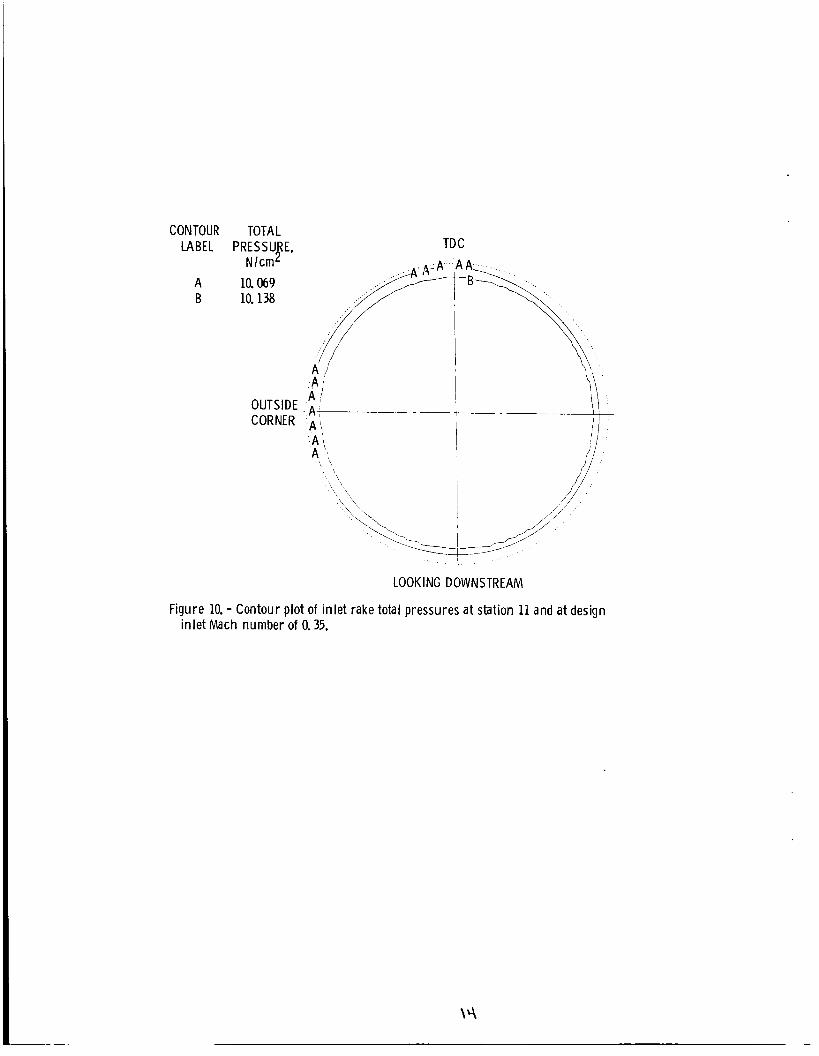
CONTOUR TOTAL LABEL PRESSU E,
A 10.069 B 10.138
Nlcm P
OUTS ID E CORNER
TD C
r
LOOK I NG DOWN STREAM
Figure 10. - Contour plot of inlet rake total pressures at station 11 and at design in let Mach number of 0.35.
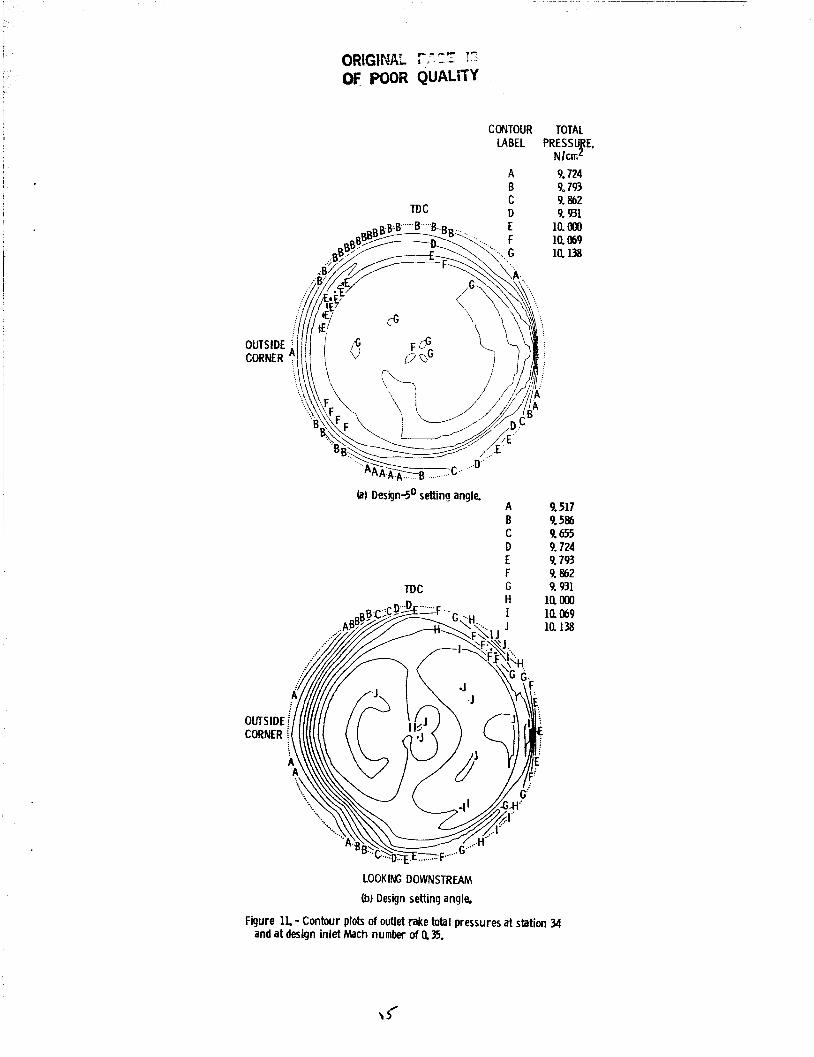
TDC
CONTOUR TOTAL LABEL P R E S S E,
A 9.7 24 B 9,793 C 9.862 D 9.931
la OOO
Nlm T
io. 069 la 1%
OUTSIDE CORNER
b) Design-SO setting angle. A 9.517 B 9.586 C 9.655 D 9.724 E 9.793 F 9. 862
TDC G 9.931
LOOKING DOWNSTREAM
0) Design setting angle.
F i u r e 11 - Contour plots of outlet rake total pressures at station 34 and at design inlet Mach number of Q35.
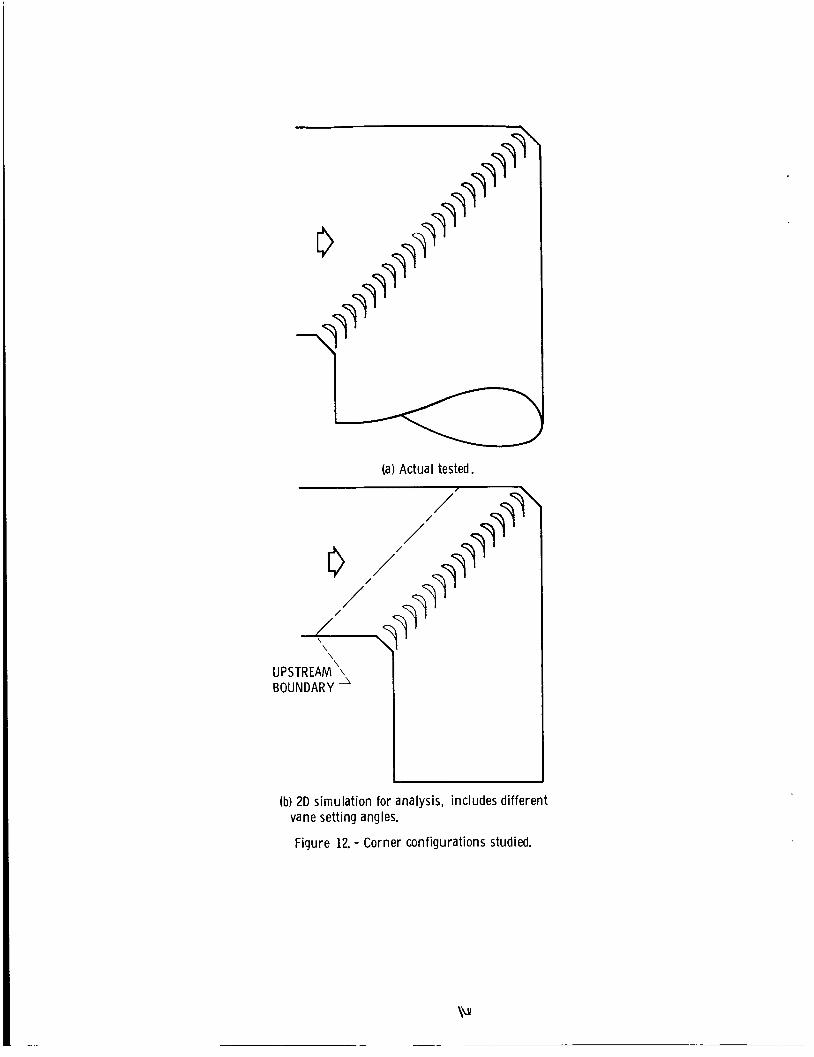
(a) Actual tested.
(b) 2D simulation for analysis, includes different vane setting angles.
Fiqure 12. - Corner configurations studied.
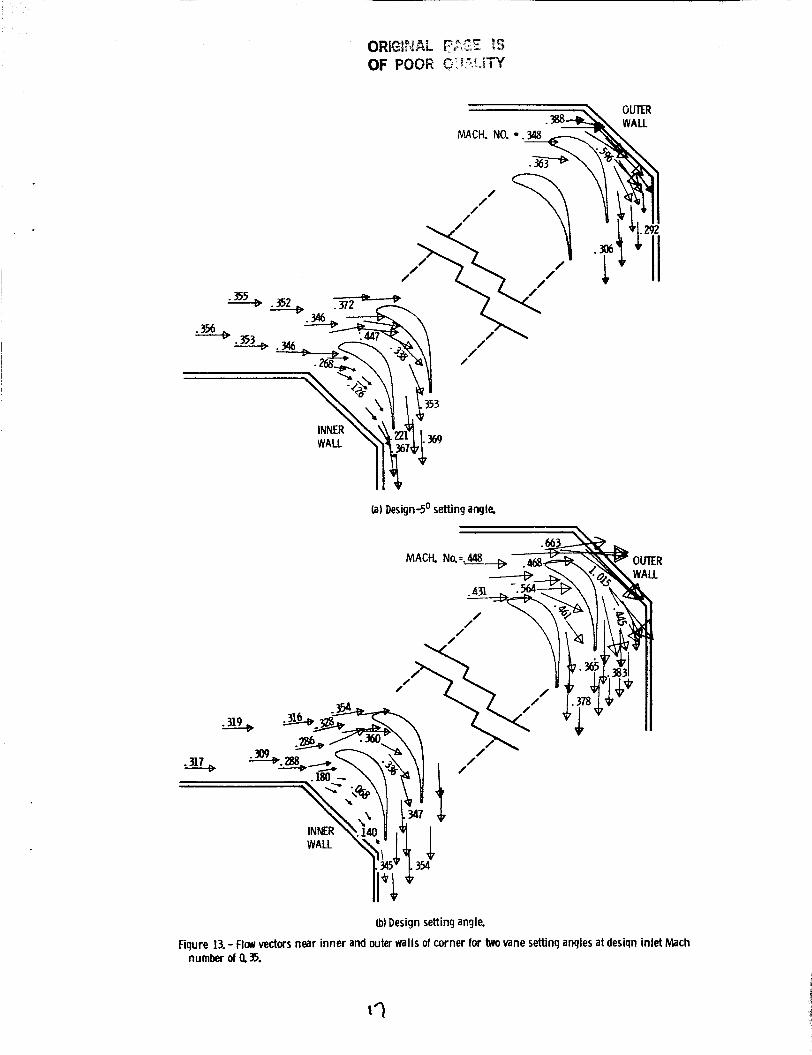
(a) Design-SO setting angle
/ 0
. / I ’
0) Design setting angle.
Figure 13. - FIN vectors near inner and outer walls of corner for two vane settinq anqles at desiqn inlet Mach number of 0.35.
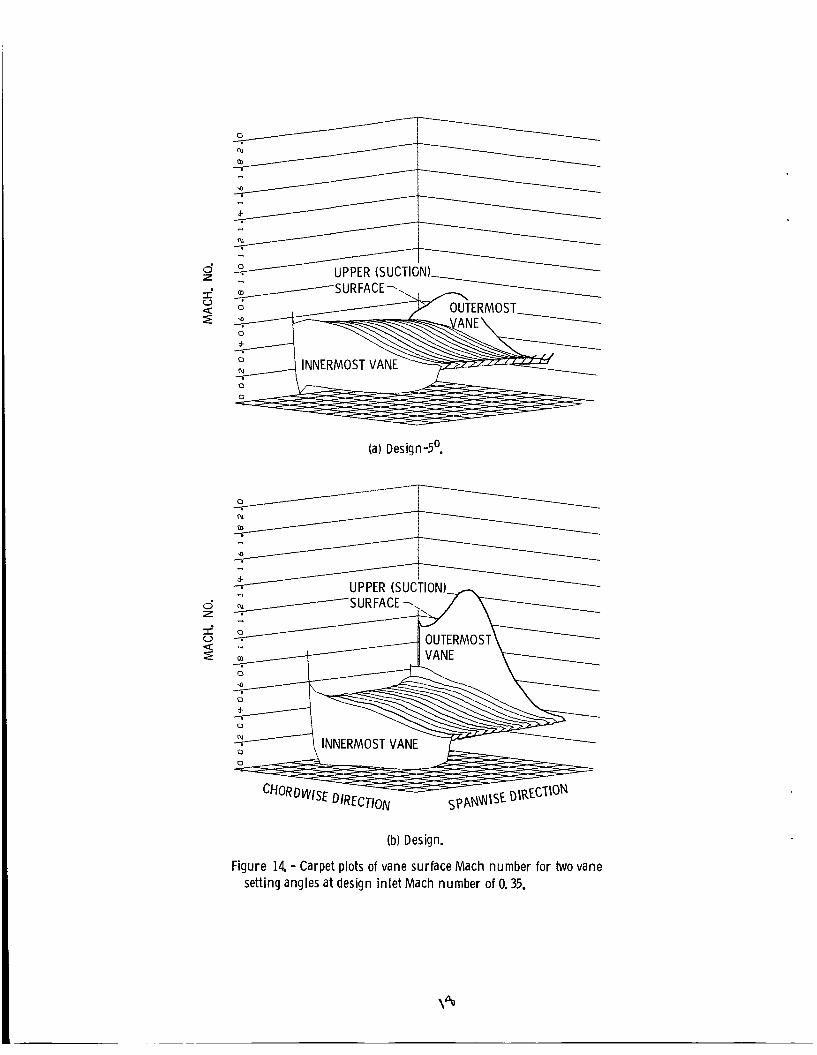
UPPER (SUCTION)
INNERMOST VA
(a) Design-5'.
... -
SURFACE -,
i a - s VANE
(b) Design.
Figure 14. - Carpet plots of vane surface Mach number for two vane setting angles at design in le t Mach number of 0.35.
-2.0
-1 5
-1 0
-. 5
0
.5 (ai) A-LOCATION
I 1 1 I CL
> n 0
(bl) A-LOCATION
0 -25 .M .75 1.0 1.0
(a) Vanes at setting angle.
TAILS ARE B-LOCATION r
($1 B AND C-LOCATIONS
0 .25 .50 .75 1.0 FRACTION OF CHORD FROM L E., c lC
(b) Vanes at design setting angle.
TDC
- OUTSIDE CORNER
- h
VANE TAP LOCATIONS
-
K , a3) D-LOCATION
TDC -
- OLITSIDE CORNER
VANE TAP LOCATIONS k
> I I I J 0 .25 -50 .75 1.0
Feure 15. - Vane A surface pressure distributions at four locations at design inlet Mach number of 0.35.
-50 Ex ; <-=
S k l I-= 3 3 2 o < -40
IC= .043 (+. 003) 3= .035 (+. 001)
CENTERLINE 0 .370 0 .494
- 0 .617
AVERAGE -43.7' (*O, 3') C%l - -
I
0
' . 2
. 4 (a) Desiqn-5'.
- I w= -041 (+. 002) w = .038 (+. 002)
. 4 I I 0 40 80 120 160 200
PERCENT VANE-TO-VANE GAP
(b) Design.
Figure 16. - Total pressure and outlet a i r angle distribution 0.5-chord downstream of central apir of vanes at two pack setting angles. In let Mach number of 0.35.
v1 vi s
.04
2\
D DESlGNSElTlNG VANE B OPEN SYMBOLS: PT FROM FIXED DIAMETRICAL RAKES
FROM AVERAGE OF WALL STATICS FROM TRAVW SES EVERY : PT &
-
zz 1/20 PLUS BOUNDARY LAYER RAKES EVERY 6 0
2. Government Accession No. . Report No. NASA TM-87/* AI AA-86-0044
I. Title and Subtitle
Wind Tunnel Turning Vanes of Modern Design
3. Recipient's Catalog No.
5. Report Date
6. Performing Organization Code
r. Author@)
505-62-3A 8. Performing Organization Report No.
T.F. Gelder, R.D. Moore, J.M. Sanz, and E.R. McFarland
Unc lass i f i ed
E-2775
Unclassified
3. Performing Organization Name and Address
National Aeronautics and Space Administration Lewis Research Center Cleveland, Ohio 44135
11. Contract or Grant No.
13. Type of Report and Period Covered
2. Sponsoring Agency Name and Address I Technical Memorandum National Aeronautics and Space Administration Washington, D.C. 20546
14. Sponsoring Agency Code
5. Supplementary Notes
Prepared for the Twenty-fourth Aerospace Sciences Meeting sponsored by the American Institute of Aeronautics and Astronautics, Reno, Nevada, January, 6-8, 1986.
6. Abstract
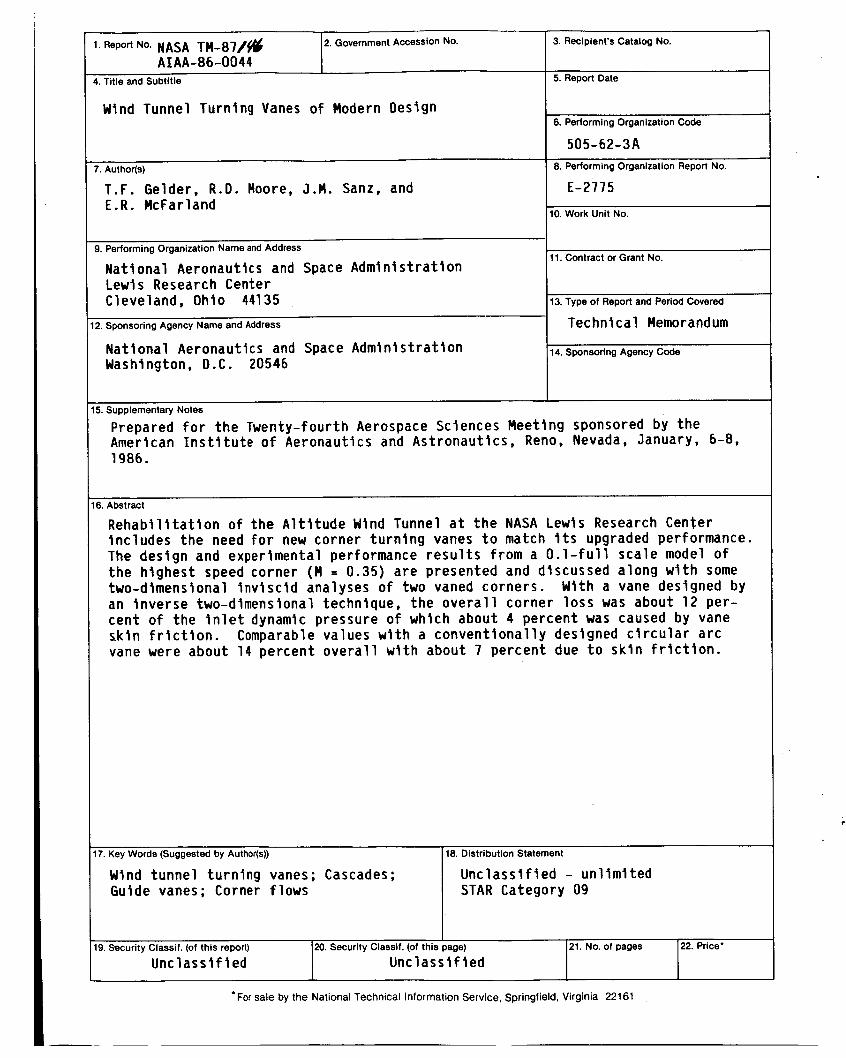
Rehabilitation of the Altitude Wind Tunnel at the NASA Lewis Research Center includes the need for new corner turning vanes to match its upgraded performance. The design and experimental performance results from a 0.1-full scale model of the highest speed corner (M = 0.35) are presented and discussed along with some two-dimensional inviscid analyses of two vaned corners. an inverse two-dimensional technique, the overall corner loss was about 12 per- cent of the inlet dynamic pressure o f which about 4 percent was caused by vane skin friction. Comparable values with a conventionally designed circular arc vane were about 14 percent overall with about 7 percent due to skin frlction.
With a vane designed by
7. Key Words (Suggested by Author@))
Wind tunnel turning vanes; Cascades; Guide vanes; Corner flows
9. Security Classif. (of this report) 120. Security Classif. (of this
18. Distribution Statement
Unclassified - unlimited STAR Category 09
w e ) 121. No. of pages 122. Price'
'For sale by the National Technical Information Service, Springfield. Virginia 221 61