wn (tsx): george weston pitch - queen's...
TRANSCRIPT

WN (TSX): George Weston PitchWaterloo Stock Pitch Competition
October 2015
BY: MIKE VANDERLINDEN, KELVIN LI AND DANNY KIM
QUEEN’S CAPITAL
6.6%
0.8%
5.7%
0.0%
2.0%
4.0%
6.0%
8.0%
10.0%
12.0%
14.0%
2009 2010 2011 2012 2013 2014 LTM
EBITDA Margin %
Net Income Margin %
Return on Equity %
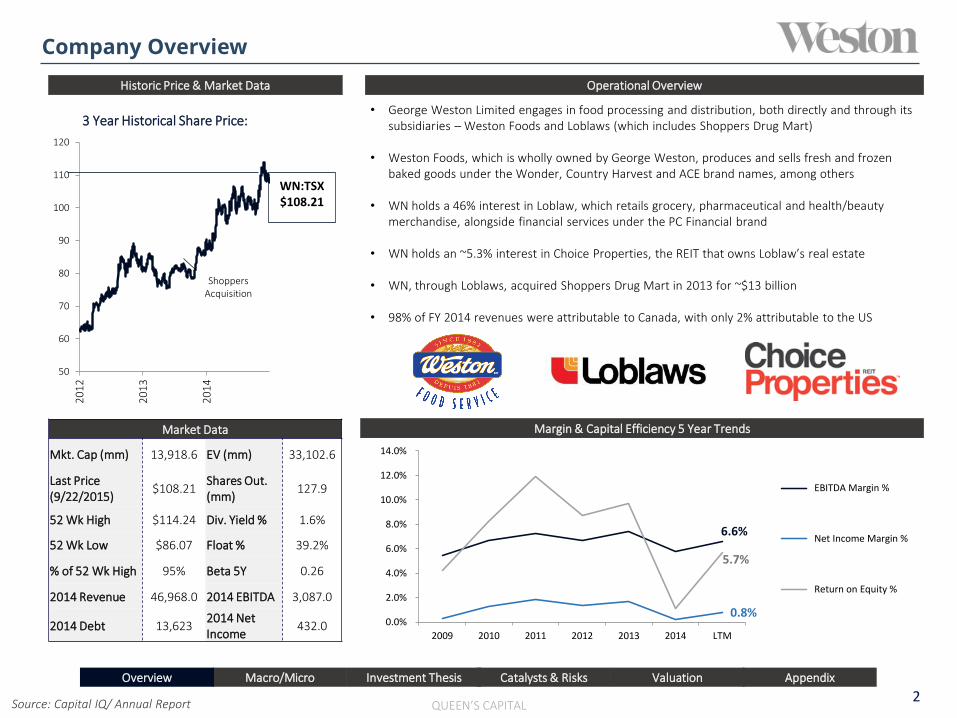
• George Weston Limited engages in food processing and distribution, both directly and through its subsidiaries – Weston Foods and Loblaws (which includes Shoppers Drug Mart)
• Weston Foods, which is wholly owned by George Weston, produces and sells fresh and frozen baked goods under the Wonder, Country Harvest and ACE brand names, among others
• WN holds a 46% interest in Loblaw, which retails grocery, pharmaceutical and health/beauty merchandise, alongside financial services under the PC Financial brand
• WN holds an ~5.3% interest in Choice Properties, the REIT that owns Loblaw’s real estate
• WN, through Loblaws, acquired Shoppers Drug Mart in 2013 for ~$13 billion
• 98% of FY 2014 revenues were attributable to Canada, with only 2% attributable to the US
Company Overview
Macro/Micro Investment Thesis
QUEEN’S CAPITAL2
Source: Capital IQ/ Annual Report
Overview Catalysts & Risks Valuation Appendix
Market Data
Mkt. Cap (mm) 13,918.6 EV (mm) 33,102.6
Last Price (9/22/2015)
$108.21Shares Out. (mm)
127.9
52 Wk High $114.24 Div. Yield % 1.6%
52 Wk Low $86.07 Float % 39.2%
% of 52 Wk High 95% Beta 5Y 0.26
2014 Revenue 46,968.0 2014 EBITDA 3,087.0
2014 Debt 13,6232014 Net Income
432.0
50
60
70
80
90
100
110
120
20
12
20
13
20
14
3 Year Historical Share Price:
WN:TSX$108.21
Margin & Capital Efficiency 5 Year Trends
Operational OverviewHistoric Price & Market Data
Shoppers Acquisition

Macro Outlook
QUEEN’S CAPITAL3
Source: Capital IQ/ Annual Report/ Bloomberg Data
Consumer Staples Historical Outperformance Low Oil Prices Benefit George Weston’s Share Price
50%
70%
90%
110%
130%
150%
170%
190%
210%
230%
20
12
20
13
20
14
SPTSX Consumer Staples Index
SPTSX Index
y = -0.4037x + 137.94R² = 0.6357
0
20
40
60
80
100
120
140
0 20 40 60 80 100 120
WN
-T S
har
e P
rice
(In
dex
ed)
Brent ICE Crude Price (Indexed)
• The SPTSX Capped Consumer Staples Index has broadly outperformed the SPTSX over the past year, returning ~110% over the past 3 years, in comparison to the S&P/TSX total three year return of ~15.7%
• As a food processor and distributor, WN’s stock price is highly negatively correlated with Brent Futures prices, as shown by our regression analysis below, as well as other input prices, such as the prices of flour and sugar
• 63% of the variance in WN’s stock price may be explained by crude prices, while an r value of ~0.79 indicates a strong correlation. Decreasing oil prices may cause investors to flock to safe consumer staple investments
• Industry margins are also expected to grow, with the price of wheat projected to fall at an annualized pace of 0.1% until 2020. This will lower input costs and make hedging predictions easier for WN
• The price of sugar is expected to level out after several years of rapid growth
Summary
Investment ThesisOverview Catalysts & Risks Valuation Appendix
WN Should Outperform in a Continued Low Interest Rate Environment
0%
50%
100%
150%
200%
2012 2013 2014 2015
• Canadian interest rates should remain bottomed out over the medium term (i.e. 1 year or more), given a recent economic slowdown and the effects of low crude prices on the inflation outlook
• Given an aggressive acquisition strategy, moderate leverage and anticipated increases to consumer spending, WN should continue to benefit from prolonged low interest rates/yields
WN Share Price
10 Yr Cdn. Gov Bond
Macro/Micro

Micro Outlook
QUEEN’S CAPITAL4
Source: Capital IQ/ IBISWorld Research/ Texture+Stability Solutions
Transition Towards Healthy Eating Amongst ConsumersGrowing Demand for Premium Goods in Grocery Industry
Investment ThesisOverview Catalysts & Risks Valuation Appendix
• Gluten free products are in demand. This trend is partially the result of increasing awareness of celiac disease
• Sales in the gluten-free business exceeded $10 million in 2013 just in Canada, George Weston now plans to focus on growing that segment in the U.S. 34% annual growth up to 2014
• WN holds a gluten free product line called All But Gluten to capitalize on this growing trend
• Industry revenues in the bakery business are expected to grow at a CAGR of 2.1% from 2015-2020, providing Weston foods with moderate upside
• Per capita disposable income is anticipated to rise 1.4% per year on average to 2020
• Consumers trade up to premium varieties of produce, meat and other grocery products
• Despite intensifying competition from alternative retailers, grocery stores are anticipated to benefit from rising income levels, which will allow some consumers to purchase organic, all-natural and value-added products at industry establishments
• Loblaw and Sobeys will even seek to introduce organic food stores to attract a growing consumer segment that chooses to purchase all organic foods. Additionally, the leading grocery store chains are expected to expand their organic private-label offerings, which will help maintain profitability
16.10%
27.60%
56.30%
George Weston
Canada Bread CompanyOther
Bread Production Industry Focused on Acquisitions
• The Canadian Bread industry is largely owned by 2 competitors Canada Bread company and George Weston
• The other 56.30% of market share is owned by smaller bread production companies
• Acquisitions are in focus within the industry as the major players seek to capture more market share
0
5000
10000
15000
20000
25000
2011 2012 2013
Gluten-Free Market Growth: Global United States
CAGR 40%
CAGR 27%
Macro/Micro

Investment Thesis I: Weston Foods Stub Undervaluation
QUEEN’S CAPITAL5
Source: Capital IQ/ Annual Report/ Scotiabank Research/ RBC Research
Investment ThesisOverview Catalysts & Risks Valuation Appendix
• Extensive, growth-related investments into PP&E, people and innovation are expected to yield paybacks for WF - with EBITDA down 13% y/y, Q2 marked the trough of investment spending
• Production lines at the Indianapolis cake facility will become operational and additional improvements to WF’s cracker and cookie facilities are expected
• Capacity expansions in US doughnut and Brampton ACE facilities in the long-term
• $300 mm in planned CAPEX for 2015 is a significant increase from historic’ CAPEX at $128 mm in 2014 and $111 mm in 2013, highlighting management’s desire to position for long-term profitability
• As startup costs diminish over time and price increases are finalized, current levels of EBIT contraction and margin erosion will moderate entering 2016, per management’s guidance
Aggressive CAPEX Strategy to Yield Benefits
Solid Product Portfolio and Distribution Scale
Loblaws’ Activities Overshadows Stub
• With 29 different brands under the Weston Foods umbrella, reputable names such as Wonder Bread, Weight Watchers, D’Italiano, and Country Harvest can be leveraged
• 14% market share in the baked goods market in Canada positions Weston Foods as a national leader in the industry
• Weston Foods’ distribution scale incorporates highly visible outlets including Costco and Shoppers Drug Mart, allowing for reliable distribution of fresh goods, economies of scale and growth in sales volume.
• WF is focusing on greater sales in distribution centers other than Loblaws
WF Trades at A Discount to Historical EV/EBITDA Multiples
• Sales growth of $111 mil in 2014 represents a 6.1% increase for WF while Loblaws saw a 3.7% increase
• Loblaws’ acquisition of Shoppers Drug Mart directs investor focus onto actual Loblaws stock while WF’s assets are undervalued
24 4093 111 128
300
0
100
200
300
400
2010 2011 2012 2013 2014 2015E
We
sto
n F
oo
ds
CA
PEX
($
mm
)
0%
20%
40%
60%
80%
100%
120%
140%
2012 2013 2014
WN Change
Lblws Change
CAGR: 65.7%
George Weston vs. Loblaws Price Change:
2.0x
4.0x
6.0x
8.0x
10.0x
12.0x
Oct
-12
Dec
-12
Feb
-13
Ap
r-1
3
Jun
-13
Au
g-1
3
Oct
-13
Dec
-13
Feb
-14
Ap
r-1
4
Jun
-14
Au
g-1
4
Oct
-14
Dec
-14
Feb
-15
Ap
r-1
5
Jun
-15
Au
g-1
5
Avg. 8.08x
Avg. 6.94x
Macro/Micro
WF EV/EBITDA:

• Rising FCF and EBITDA margins at Loblaw indicate that the company has stabilized and successfully integrated SC following its acquisition
• FCF from operational synergies and higher margins should allow WN to delever, grow the business and return capital to shareholders
• After its $1.7 billion debt repayment commitment in Q4/15, WN should have sufficient FCF to aggressively buy back Loblaw shares and complete bolt on bakery acquisitions, should appropriate opportunities surface
• WN Management has stated its intent purchase $1 billion in L shares annually, resulting in a ~150 bps increase in ownership until majority ownership is regained in late 2018E, pushing L’s stock price higher
• Weston Foods also intends to pursue small acquisitions in the US and Canada to gain innovative products and entry into new markets, made possible by aggressive FCF growth at a CAGR of ~17.8%
Investment Thesis II: Stability of Loblaw Cash Flows & Heightened Capital Deployment
QUEEN’S CAPITAL6
Source: Capital IQ, RBC Capital Markets, Thomson ONE, Barclays
Investment ThesisOverview Catalysts & Risks Valuation Appendix
Summary Deleveraging of Loblaws Will Free Up Capital and Reduce Risk
Weston Foods Innovative Acquisitions In New Spaces
7.00%
7.20%
7.40%
7.60%
7.80%
8.00%
8.20%
8.40%
8.60%
8.80%
0
500
1000
1500
2000
2500
2014 2015 2016E 2017E
L-T FCF
L-T EBITDAMargin (%)
• Specialty cake manufacturer with LTM net sales of ~$14.3mm, based in Mississauga, ON
• Deal completed on March 6, 2015
• Specialty decorated cake manufacturer with LTM net sales of ~$15.40mm, based in Nashville, TN
• Deal completed on January 20, 2015
• Produces specialty Rye breads with undisclosed LTM sales, based in Chicago, IL
• Deal completed on May 5, 2014
Macro/Micro
40%
60%
80%
100%
120%
140%
2012 2013 2014
TotalDebt/Equity LTDebt/Equity
Loblaws’ Historical Debt:
Rising FCF Generation and EBITDA Margins Increase Growth
• Loblaws’ deleveraging targets post Shoppers acquisition are on track, freeing up capital to redeploy for share buybacks that are planned to increase George Weston’s stake to a majority ownership (currently 46% diluted from Shoppers acquisition)
• Loblaws’ gross Debt/EBITDA decreased to 2.70x in Q2/2015, down from 4.46x in Q2/2014
• Another alternative is to redeploy approximately $1B under short-term investments to fund WF and meet its growth objectives

Risks
QUEEN’S CAPITAL7
Source : Annual Report/ RBC Coverage/IBISworld Industry Report
Investment ThesisOverview Catalysts & Risks Valuation Appendix
FOREX Risk
• Although currency translation has positively impacted WF’s revenues previously, portions of the company’s financial assets are denominated in US dollars, thereby exposing WF to foreign exchange losses
Execution on CAPEX and M&A
• SG&A expenses associated with increased CAPEX and potentially aggressive startup plans may weigh on gross margins
• Potential acquisitions at high multiples or an acquisition that the company has trouble integrating due to a divergence from its core competencies in baking
• Management assures partial offset of investment-related expenses through price, volume and productivity increases
Sensitive to Input Prices
Changes in Consumer Tendencies and Competitive Landscape
• High price sensitivity, low switching costs and a continuing upward trend towards healthy alternatives in the bakery business places may limit WF’s ability to leverage their brands and charge premiums
• Competition continues to accelerate due to low-cost emerging market producers driving import penetration and shrinking the pricing power of existing, domestic players
-30%
-20%
-10%
0%
10%
20%
30%
40%
2008 2009 2010 2011 2012 2013 2014
UnitedStatesItaly
Mexico
UnitedKingdomChina
$0.70
$0.75
$0.80
$0.85
$0.90
$0.95
$1.00
Sep
Oct
No
v
Dec Jan
Feb
Mar
Ap
r
May Jun
Jul
Au
g
Sep
• WF’s operational expenses are directly linked to the fluctuations in the prices of commodities including wheat, sugars and vegetable oils
• World prices of wheat expected to be predictable and stagnate, allowing WF to adjust prices accordingly
4
4.5
5
5.5
6
6.5
7
Sep
-14
No
v-1
4
Jan
-15
Mar
-15
May
-15
Jul-
15
Sep
-15
No
v-1
5
Jan
-16
Mar
-16
May
-16
Jul-
16
Sep
-16
WheatHistoricalPricing
WheatFutureContracts
Macro/Micro
% Change of Baked Goods Imports into Canada:

Catalysts
QUEEN’S CAPITAL8
Source : Annual Report/ RBC Coverage/IBISworld Industry Report
Investment ThesisOverview Catalysts & Risks Valuation Appendix
Dividend Increases Consistently for the Past 3 Years
• If sales volumes for WF remain consistent as per management’s guidance, future earnings in 2016 will realize the benefits of today’s investments and redirect investor interest towards an attractive stub valuation
Further Strategic/Accretive AcquisitionsHealthier Earnings Reports Associated with Diminishing Startup Costs
0
50
100
150
200
250
300
2010 2011 2012 2013 2014
Profit Before Tax CAPEX
1,400
1,500
1,600
1,700
1,800
1,900
2,000
2010 2011 2012 2013 2014
WF Historical Revenues WF Profit Before Tax vs. CAPEX
Macro/Micro
• Management has reiterated its desire to make acquisitions that allow entry into new markets or add capability through innovation
• Another major strategic acquisition in the consumer staples space would also likely push Loblaw’s stock price higher (as it did when Loblaw acquired Shoppers Drug Mart in 2013).
• With Net Debt/EBITDA multiples falling as WN deleverages and given strong FCF growth, the potential for another major acquisition remains, should appropriate opportunities surface.
0
20
40
60
80
100
120
2012 2013 2014
$0.425$0.420$0.415$0.38
• Over the past 3 years, George Weston has increased its dividend consistently
• Utilizing todays share price this would imply a growth in dividend yield from 1.4% to 1.6%
• This signals Increasing free cash flow generation and management’s commitment to providing shareholder value
• This also demonstrates the company’s ability to efficiently manage their use of capital
Share Price & Dividend Increases:

9Investment ThesisOverview Catalysts & Risks Valuation Appendix
QUEEN’S CAPITAL
Valuation
$-
$2
$4
$6
$8
$10
$12
$14
$16
$18
$20
P/AFFO NAVPU
$-
$10
$20
$30
$40
$50
$60
$70
$80
$90
$100
P/ELTM
EV/Rev LTM
EV/RevNTM
EV/EBITDALTM
EV/EBITDANTM
EV/EBIT P/BV DCF(GGM)
DCF(Multiples)
$-
$5
$10
$15
$20
$25
$30
$35
EV/RevLTM
EV/RevNTM
EV/EBITDALTM
EV/EBITDANTM
EV/EBIT DCF(GGM)
DCF(Multiples)
Sum of the Parts Football Field
Choice Properties Loblaws Companies Ltd. Weston Foods Stub
$12.00 Target Price
$11.41 Current Price
$67.00 Target Price
$69.15 Current Price
$22.39 Target Price
$5.68 Current Price
Company Shares Owned Share Price Mkt. Cap (mm)
Loblaws 188 64.0 12033.01
Choice 21.7 12.08 262.19
Weston Foods 127.9 22.39 2864.30
George Weston (Mkt.Cap) 15159.50
George Weston Current Share Price 108.21
George Weston Target Share Price 119
Implied Upside 9.9%$110 $115 $120 $125 $130 $135
Scotia Capital
Barclays
BMO Capital Markets
RBC Capital Mkts
Credit Suisse
CIBC World Markets
Analyst Average:$124
Macro/Micro
Source : Annual Report/ Capital IQ

10
Weston Foods Stub Comparables
P/E EV/Revenue EV/EBITDA EV/EBIT P/BV Debt/
Mkt. Cap (mm) EV (mm) LTM NTM LTM NTM LTM NTM LTM LTM Equity
J&J Snack Foods Corp. (NasdaqGS:JJSF) 21810.0 2056.0 30.6x 28.82x 2.1x 2.05x 14.0x 13.07x 18.7x 4.8x 0.1%
Lancaster Colony Corporation (NasdaqGS:LANC) 2721.2 2539.0 26.9x 24.35x 2.3x 2.17x 14.5x 13.38x 16.5x 7.0x -
Grupo Bimbo, S.A.B. de C.V. (BMV:BIMBO A) 11861.6 1570.7 48.5x 28.60x 1.3x 1.21x 11.5x 10.88x 15.9x NM 118.9%
Flowers Foods, Inc. (NYSE:FLO) 5200.0 5846.7 28.0x 23.73x 1.5x 1.49x 13.1x 12.06x 18.5x 19.3x 69.4%
Weston Foods Stub 727.1 3359 1.7x 1.7x 10.8x 9.7x 13.9x
High 21,810.0 5,846.7 48.5x 28.82x 2.3x 2.17x 14.5x 13.38x 18.7x 19.3x 118.9%
Low 2,721.2 1,570.7 26.9x 23.73x 1.3x 1.21x 11.5x 10.88x 15.9x 4.8x 0.1%
Mean 10,398.2 3,074.2 33.5x 26.37x 1.8x 1.73x 13.3x 12.35x 17.4x 10.4x 62.8%
Median 8,530.8 2,297.5 29.3x 26.47x 1.8x 1.77x 13.6x 12.57x 17.5x 7.0x 69.4%
Investment ThesisOverview Catalysts & Risks Valuation Appendix
QUEEN’S CAPITAL
Valuation
Loblaws ComparablesP/E EV/Revenue EV/EBITDA EV/EBIT P/BV Debt/
Mkt. Cap (mm) EV (mm) LTM NTM LTM NTM LTM NTM LTM LTM Equity
Whole Foods Market, Inc. (NasdaqGS:WFM) 11,340.6 10,712.6 19.0x 18.06x 0.7x 0.65x 7.6x 7.25x 10.8x 3.5x 1.6%
Metro Inc. (TSX:MRU) 6,581.3 7,566.1 18.5x 16.33x 0.8x 0.80x 11.2x 11.36x 13.8x 21.7x 37.1%
Loblaw Companies Limited (TSX:L) 21,405.9 29,786.9 40.4x 18.11x 0.9x 0.86x 11.4x 10.31x 21.2x 198.6x 97.4%
High 11340.6 10712.6 19.0x 18.06x 0.8x 0.80x 11.2x 11.4x 13.80x 21.70x 37%
Low 6581.3 7566.1 18.5x 16.33x 0.7x 0.65x 7.6x 7.3x 10.80x 3.50x 2%
Mean 8960.95 9139.35 18.8x 17.20x 0.8x 0.73x 9.4x 9.3x 12.30x 12.60x 19%
Median 8960.95 9139.35 18.8x 17.20x 0.8x 0.73x 9.4x 9.3x 12.30x 12.60x 19%
Choice Properties ComparablesMkt. EV Premium EV/EBITDA Distribution AFFO Debt to P/FFO P/AFFO
Cap (mm) (mm) (Disc) to NAV LTM 2015E 2016E Yield (%) Payout (%) GBV LTM 2015E 2016E LTM 2015E 2016E
Riocan Real Estate Investment Trust (TSX:REI.UN) 6,790.8 12,149.1 1.10% 20.8x 19.60x 18.70x 5.3% 90.0% 43.0% 17.9x 17.50x 16.60x 20.40x 19.60x 18.70x
First Capital Realty Inc. (TSX:FCR) 4,227.9 7,928.1 -2.60% 19.5x 20.00x 19.20x 4.9% 90.0% 45.0% 17.9x 17.8x 17.0x 19.7x 19.3x 18.3x
CT Real Estate Investment Trust (REIT) (TSX:CRT.UN) 2,469.7 5,640.2 8.08% 19.3x 17.5x 16.9x 5.1% 82.0% 48.0% 13.0x 12.3x 11.8x 17.3x 15.6x 15.0x
Crombie Real Estate Investment Trust (TSX:CRR.UN) 1,680.5 3,781.4 -14.10% 16.1x 15.16x 14.10x 7.1% 94.0% 51.0% 11.6x 11.3x 10.9x 14.1x 13.6x 13.1x
Smart Real Estate Investment Trust (TSX:SRU.UN) 4,519.7 9,016.9 -1.06% 20.1x 17.92x 16.60x 5.4% 81.7% 46.0% 15.3x 14.3x 13.7x 16.1x 15.1x 14.5x
Choice Properties Real Estate Investment Trust (TSX:CHP.UN) 3,492.1 9,050.2 -6.10% 16.8x 14.90x 14.70x 6.0% 82.0% 46.0% 12.4x 11.70x 11.30x 15.20x 14.30x 13.60x
High 6,790.8 12,149.1 8% 20.8x 20.0x 19.2x 7.1% 94.0% 51.0% 17.9x 17.8x 17.0 20.4x 19.6x 18.7x
Low 1,680.5 3,781.4 -14% 16.1x 15.2x 14.1x 4.9% 81.7% 43.0% 13.0x 11.3x 10.9 14.1x 13.6x 13.1x
Mean 3,937.7 7,703.1 -2% 19.1x 18.3x 17.3x 5.6% 87.5% 46.6% 15.1x 14.6x 14.0 17.5x 16.6x 15.9x
Median 4,227.9 7,928.1 -1% 19.8x 19.6x 18.7x 5.3% 90.0% 46.0% 15.3x 14.3x 13.7 17.3x 15.6x 15.0x
Macro/Micro
Source : Annual Report/ Capital IQ

Valuation
11
Weston Foods DCF
Historic Forecasted PeriodHistoric Avg.
2011 2012 2013 2014 2015 2016 2017 2018 2019
Weston Foods Revenue 1,772.0 1,765.0 1,812.0 1,923.0 1,965.3 2,004.6 2,040.7 2,073.3 2,102.4 1,818.0
Yr to Yr Growth % -0.4% 3% 6% 2.2% 2.0% 1.8% 1.6% 1.4% 3%
Weston Foods COGS N/A (1,235.5) (1,268.4) (1,346.1) (1,375.7) (1,403.2) (1,428.5) (1,451.3) (1,471.7) (1,283.3)
Weston Foods Gross Profit N/A 529.5 543.6 576.9 589.6 601.4 612.2 622.0 630.7 550.0
Gross Profit Margin % N/A 30% 30% 30% 30% 30% 30% 30% 30% 30%
Weston Foods SG&A N/A (195.5) (221.6) (265.9) (243.3) (248.1) (252.6) (256.6) (260.2) (227.7)
Weston Foods EBITDA N/A 334.0 322.0 311.0 346.3 353.3 359.6 365.4 370.5 322.3
Weston Foods Depreciation (60.0) (59.0) (63.0) (70.0) (68.8) (70.2) (71.4) (72.6) (73.6) (63.0)
Weston Foods EBIT N/A 275.0 259.0 241.0 277.5 283.1 288.2 292.8 296.9 258.3
Less: Weston Foods Taxes N/A (68.8) (64.8) (60.3) (69.4) (70.8) (72.0) (73.2) (74.2) (64.6)
Less: Weston Foods Capital Expenditures (39.0) (93.0) (111.0) (128.0) (100.2) (102.2) (104.1) (105.7) (107.2) (92.8)
Less: Increase in Weston Foods NWC (36.7) (3.0) (11.5) (61.7) (29.5) (30.1) (30.6) (31.1) (31.5) (28.2)
Add: Weston Foods Depreciation (60.0) 59.0 63.0 70.0 68.8 70.2 71.4 72.6 73.6 33.0 TV (GGM) TV (Multiples)
Free Cash Flow to the Enterprise N/A 169.3 134.8 61.0 147.2 150.2 152.9 155.3 157.5 121.7 3506.7 4575.5
PV of Cash Flows 61.0 139.2 134.3 129.3 124.2 119.1 2651.6 3459.7
NPV Implied Enterprise Value (GGM) 3,358.7
NPV Implied Enterprise Value (Multiples) 4,166.8
2011 2012 2013 2014 2015 2016 2017 2018 2019 Historic Avg.
COGS % of Sales N/A 70% 70% 70% 70.0% 70.0% 70.0% 70.0% 70.0% 70.0%
SG&A % of Sales N/A 11% 12% 14% 12.4% 12.4% 12.4% 12.4% 12.4% 12.4%
Depreciation % of Sales 3% 3% 3% 4% 3.5% 3.5% 3.5% 3.5% 3.5% 3.5%
Tax Rate N/A 25% 25% 25% 25.0% 25.0% 25.0% 25.0% 25.0% 25.0%
CAPEX % of Sales 2% 5% 6% 7% 5.1% 5.1% 5.1% 5.1% 5.1% 5.1%
Increase in NWC % of Sales 2% 0% 1% 3% 1.5% 1.5% 1.5% 1.5% 1.5% 1.5%
Stub Assumptions
WF's Historic Gross Profit Margin % 30%
WF's Portion of NWC 3%
WF Tax Rate 25%
EV-> Equity Value
Holdco Discount 10%
Net debt 488
Preferred Shares 817
Equity Value (GGM) 2,053.7
Equity Value (Multiples) 2,861.8
Shares Outstanding 127.9
Share Price (GGM) 16.1
Share Price (Multiples) 22.4
WACC Calculation
Cost of Debt 7%
Weight of Debt 64%
Cost of Equity 7%
Weight of Equity 31%
Cost of Preferred 1.3%
Weight of Preferred 4%
Tax Rate 25%
Rf 2.30%
Rm 8%
Beta 0.83
Preferred Dividend 1.45
WACC 5.7%
Unlever and Lever of Beta
Industry Beta 0.48
Industry Debt/Equity 63%
Unlevered Industry Beta 0.33
Levered WF Beta 0.83
Terminal Value
Terminal Growth Rate 1%
Terminal Value (GGM) 3506.7
Exit Multiple 12.35x
Investment ThesisOverview Catalysts & Risks Valuation Appendix
QUEEN’S CAPITAL
Macro/Micro
Source : Annual Report/ Capital IQ

12
Appendix
TOPIC PAGE #
Loblaws DCF 13
How to Trade the Stub 14
Capitalization Structure 15
Product Portfolio 15
Stub Current Price 15
Weston Foods DCF Sensitivities 16
Loblaws DCF Sensitivities 17
Choice Properties NAV and Sensitivities
18
Financial Ratios 19
WN Path to Majority Ownership 19
US to CAD Yield Regression 20
Issuer Ratings 20
Detailed Debt Information 21-22
Appendices
TOPIC PAGE #
Holders 23
Financial Statements 24

Appendix
13
Loblaw Companies Ltd. DCF
Historic Forecasted PeriodHistoric Avg.
2011 2012 2013 2014 2015 2016 2017 2018 2019
Revenue 31,250.0 31,604.0 32,371.0 42,611.0 47,724.3 52,496.8 56,696.5 60,098.3 63,704.2 34,459.0
Yr to Yr Growth 1.1% 2% 32% 12.0% 10.0% 8.0% 6.0% 6.0% 12%
COGS (23,894.0) (24,185.0) (24,701.0) (31,265.0) (36,111.2) (39,722.3) (42,900.1) (45,474.1) (48,202.6) (26,011.3)
Gross Profit 7,356.0 7,419.0 7,670.0 11,346.0 11,613.1 12,774.4 13,796.4 14,624.2 15,501.6 8,447.8
Gross Profit Margin % 24% 23% 24% 27% 24% 24% 24% 24% 24% 24%
SG&A (5,982.0) (6,252.0) (6,341.0) (9,801.0) (9,735.8) (10,709.3) (11,566.1) (12,260.0) (12,995.7) (7,094.0)
EBIT 1,374.0 1,167.0 1,329.0 1,545.0 1,877.4 2,065.1 2,230.3 2,364.1 2,506.0 1,458.5
Less: Taxes (288.0) (210.0) (226.0) (25.0) (375.5) (413.0) (446.1) (472.8) (501.2) (187.3)
Less: Capex (987.0) (1,017.0) (865.0) (996.0) (966.3) (976.3) (986.3) (996.3) (1,006.3) (966.3)
Less: Increase in NWC (119.0) (42.0) (353.0) (1,991.0) (763.6) (839.9) (907.1) (961.6) (1,019.3) (626.3)
Add: D&A 688.0 762.0 809.0 1,035.0 1,145.4 1,259.9 1,360.7 1,442.4 1,528.9 823.5 TV (GGM) TV (Multiples)
Free Cash Flow to the Enterprise 668.0 660.0 694.0 (432.0) 917.4 1,095.8 1,251.6 1,375.8 1,508.2 501.5 49591.1 31472.0
PV of Cash Flows (432.0) 880.7 1,009.9 1,107.3 1,168.5 1,229.6 40432.7 25659.8
NPV Implied Enterprise Value (GGM) 45,396.7
NPV Implied Enterprise Value (Multiples) 30,623.8
2011 2012 2013 2014 2015 2016 2017 2018 2019 Historic Avg.
COGS % of Sales 76% 77% 76% 73% 75.7% 75.7% 75.7% 75.7% 75.7% 75.7%
SG&A % of Sales 19% 20% 20% 23% 20.4% 20.4% 20.4% 20.4% 20.4% 20.4%
Depreciation % of Sales 2% 2% 2% 2% 2.4% 2.4% 2.4% 2.4% 2.4% 2.4%
Tax Rate 21% 18% 17% 2% 20.0% 20.0% 20.0% 20.0% 20.0% 14.4%
CAPEX Avg (987.0) (1,017.0) (865.0) (996.0) (966.3) (976.3) (986.3) (996.3) (1,006.3) (966.3)
Increase in NWC % of Sales 0% 0% 1% 5% 1.6% 1.6% 1.6% 1.6% 1.6% 1.6%
EV-> Equity Value
Debt 12251
Cash 1337
Minority Interest 9
Preferred Shares 221
Equity Value (GGM) 34,712.7
Equity Value (Multiples) 19,939.8
Shares Outstanding 412.5
Share Price (GGM) 84.2
Share Price (Multiples) 48.3
WACC Calculation
Cost of Debt 6%
Weight of Debt 48%
Cost of Equity 3.5%
Weight of Equity 51%
Cost of Preferred 5.3%
Weight of Preferred 1%
Tax Rate 20%
Rf 2.30%
Rm 8%
Beta 0.21
WACC 4.17%
Unlever and Lever of Beta
Industry Beta 0.15
Industry Debt/Equity 37%
Unlevered Industry Beta 0.12
Levered WF Beta 0.21
Terminal Value
Terminal Growth Rate 1.0%
Terminal Value (GGM) 49591
Exit Multiple 7.8x
Investment ThesisOverview Catalysts & Risks Valuation Appendix
QUEEN’S CAPITAL
Macro/Micro
Source : Annual Report/ Capital IQ

14Investment ThesisOverview Catalysts & Risks Valuation Appendix
QUEEN’S CAPITAL
Appendix
Trading the Weston Foods Stub
-100%
-80%
-60%
-40%
-20%
0%
20%
40%
60%
80%
100%
Long WN Short CHP Short L Isolate WF
Weston Foods Choice Properties Loblaws
Buy $1,000,000of WN
Short $200,000of CHP
Short $930,000of Loblaws
Isolate $50,000of Weston Foods
Macro/Micro
Source : Annual Report/ Capital IQ

15Investment ThesisOverview Catalysts & Risks Valuation Appendix
QUEEN’S CAPITAL
Appendix
Current Stub Price Calculation
Weston Foods Stub Current Value Calculation
Company Shares Owned Share Price Market Capitalization (mm)
Loblaws 188.0 $69.15 $13,000.20
Choice Properties 21.7 $11.41 $247.60
Loblaws + Choice Properties $13,247.80
George Weston Mkt. Cap 127.9 $109.24 $13,974.90
Less: Loblaws + Choice Properties $13,247.80
Weston Foods Stub Value $727.10
George Weston Shares Outstanding $127.90
Current Weston Stub Value $5.68
Macro/Micro
Capital Structure Summary
Debt, 47.9%
Common Equity, 23.1%
Preferred Equity, 3.7%
Minority Interest,
25.4%
Millions % of Total
Total Revolving Credit865.0 6.3%
Total Term Loans610.0 4.5%
Total Senior Bonds and Notes11,118.0 81.6%
Total Capital Leases601.0 4.4%
General/Other Borrowings730.0 5.4%
Product Portfolio
Source : Annual Report/ Capital IQ

Appendix
16
Weston Foods Sensitivities
QUEEN’S CAPITAL
Enterprise Value (GGM)
Terminal Growth Rate
WA
CC
%
3358.7 0.50% 0.75% 1.00% 1.25% 1.50% 1.75%
3.0% 6356.8 6978.8 7756.2 8755.8 10088.5 11954.4
4.0% 4586.2 4882.1 5227.4 5635.3 6124.9 6723.3
5.0% 3600.2 3769.6 3960.1 4176.1 4422.9 4707.7
5.7% 3134.5 3257.1 3392.7 3543.5 3712.3 3902.4
6.0% 2971.0 3079.0 3197.8 3329.1 3475.0 3638.1
7.0% 2534.0 2607.9 2688.0 2775.1 2870.1 2974.1
Share Price (GGM)
Terminal Growth Rate
WA
CC
%
0.50% 0.75% 1.00% 1.25% 1.50% 1.75%
3.0% 39.5 44.4 50.4 58.2 68.7 83.2
4.0% 25.6 28.0 30.7 33.8 37.7 42.4
5.0% 17.9 19.3 20.8 22.4 24.4 26.6
5.7% 14.3 15.3 16.3 17.5 18.8 20.3
6.0% 13.0 13.9 14.8 15.8 17.0 18.2
7.0% 9.6 10.2 10.8 11.5 12.2 13.0
Enterprise Value (Multiples)
Exit Multiple
WA
CC
%
4166.8 11.0x 12.0x 12.4x 13.0x 14.0x 15.0x
3.0% 4274.7 4594.3 4706.1 4913.9 5233.5 5553.0
4.0% 4089.2 4393.7 4500.3 4698.2 5002.7 5307.2
5.0% 3913.8 4204.1 4305.7 4494.4 4784.7 5075.0
5.7% 3796.8 4077.6 4175.9 4358.4 4639.2 4920.0
6.0% 3748.0 4024.8 4121.7 4301.7 4578.5 4855.4
7.0% 3591.0 3855.2 3947.6 4119.3 4383.5 4647.6
Share Price (Multiples)
Exit Multiple
WA
CC
%
11.0x 12.0x 12.4x 13.0x 14.0x 15.0x
3.0% 23.2 25.7 26.6 28.2 30.7 33.2
4.0% 21.8 24.1 25.0 26.5 28.9 31.3
5.0% 20.4 22.7 23.5 24.9 27.2 29.5
5.7% 19.5 21.7 22.4 23.9 26.1 28.3
6.0% 19.1 21.3 22.0 23.4 25.6 27.8
7.0% 17.9 19.9 20.7 22.0 24.1 26.1
Investment ThesisOverview Catalysts & Risks Valuation AppendixMacro/Micro
Source : Annual Report/ Capital IQ

Appendix
17
Loblaw Companies Ltd. DCF Sensitivities
Source: Capital IQ/ Annual Report QUEEN’S CAPITAL
Enterprise Value (GGM)
Terminal Growth Rate
WA
CC
%
##### 0.50% 0.75% 1.00% 1.25% 1.50% 1.75%
3.0% 58759.6 64715.0 72159.4 81730.7 94492.4 112358.8
3.5% 48884.1 52866.8 57646.0 63487.2 70788.7 80176.4
4.0% 41825.4 44658.7 47964.3 51870.9 56558.9 62288.6
4.2% 39862.5 42413.6 45367.0 48826.2 52933.2 57888.7
4.5% 36527.2 38635.0 41043.9 43823.5 47066.2 50898.6
5.0% 32403.0 34024.9 35849.6 37917.5 40280.9 43007.9
Share Price (GGM)
Terminal Growth Rate
WA
CC
%
0.50% 0.75% 1.00% 1.25% 1.50% 1.75%
3.0% 116.5 131.0 149.0 172.2 203.2 246.5
3.5% 92.6 102.3 113.8 128.0 145.7 168.5
4.0% 75.5 82.4 90.4 99.8 111.2 125.1
4.2% 70.7 76.9 84.1 92.5 102.4 114.4
4.5% 62.6 67.8 73.6 80.3 88.2 97.5
5.0% 52.7 56.6 61.0 66.0 71.7 78.4
Enterprise Value (Multiples)
Exit Multiple
WA
CC
%
##### 6.0x 7.0x 7.8x 8.0x 9.0x 10.0x
3.0% 26043.4 29523.9 32308.4 33004.5 36485.0 39965.5
3.5% 25458.5 28855.8 31573.6 32253.0 35650.3 39047.5
4.0% 24889.8 28206.2 30859.3 31522.5 34838.9 38155.3
4.2% 24700.0 27989.4 30621.0 31278.8 34568.2 37857.6
4.5% 24336.8 27574.6 30164.8 30812.4 34050.2 37287.9
5.0% 23799.0 26960.4 29489.5 30121.8 33283.3 36444.7
Share Price (Multiples)
Exit Multiple
WA
CC
%
6.0x 7.0x 7.8x 8.0x 9.0x 10.0x
3.0% 37.2 45.7 52.4 54.1 62.5 71.0
3.5% 35.8 44.1 50.6 52.3 60.5 68.8
4.0% 34.4 42.5 48.9 50.5 58.6 66.6
4.2% 34.0 42.0 48.3 49.9 57.9 65.9
4.5% 33.1 40.9 47.2 48.8 56.6 64.5
5.0% 31.8 39.5 45.6 47.1 54.8 62.4
Investment ThesisOverview Catalysts & Risks Valuation AppendixMacro/Micro

Appendix
18
Choice Properties Valuation Details
Source: Capital IQ/ Annual Report QUEEN’S CAPITAL
NAVPU Sensitivity Analysis
2015E NOI ($mm)
$421.38 $471.38 $521.38 $571.38 $621.38
Cap
Rat
e (%
)
6.1% $8.25 $10.47 $12.69 $14.92 $17.14
6.2% $7.94 $10.13 $12.32 $14.50 $16.69
6.3% $7.65 $9.80 $11.95 $14.10 $16.26
6.4% $7.36 $9.48 $11.60 $13.72 $15.84
6.5% $7.09 $9.17 $11.26 $13.34 $15.43
P/AFFO Multiple Sensitivity Analysis
2015E P/AFFO
14.0x 14.5x 15.0x 15.5x 16.0x
AFF
O 2
01
5E
71.0% $9.94 $10.30 $10.65 $11.01 $11.36
76.0% $10.64 $11.02 $11.40 $11.78 $12.16
81.0% $11.34 $11.75 $12.15 $12.56 $12.96
86.0% $12.04 $12.47 $12.90 $13.33 $13.76
91.0% $12.74 $13.20 $13.65 $14.11 $14.56
Valuation II - Net Asset Value (NAVPU) $mm
2015E NOI 521.38
Target Capitalization Rate 6.25%
Gross Property Value 8342.08
Assets 8464.90
Less: Investment Properties 8248.80
Other Tangible Assets 216.10
Total Assets 8558.18
Less: Total Liabilities 4114.08
Net Asset Value 4444.10
Fully Diluted Units Oustanding 371.8
NAVPU $ 11.95
Investment ThesisOverview Catalysts & Risks Valuation AppendixMacro/Micro

Appendix
19
Financial Ratios
Source: Capital IQ/ Annual Report QUEEN’S CAPITAL
Investment ThesisOverview Catalysts & Risks Valuation AppendixMacro/Micro
George Weston On the Path Towards Majority Ownership
63.00%
45.60% 45.60% 47.20% 48.70% 50.20%
0%
10%
20%
30%
40%
50%
60%
70%
2013 2014 2015E 2016E 2017E 2018E
WN Loblaw Ownership
1.3x
1.6x
1.5x1.6x
1.6x1.5x
0.0x
0.2x
0.4x
0.6x
0.8x
1.0x
1.2x
1.4x
1.6x
1.8x
2010 2011 2012 2013 2014 2015
Current Ratio
4.8x
5.4x
4.9x4.5x
3.0x
3.7x
0.0x
1.0x
2.0x
3.0x
4.0x
5.0x
6.0x
2010 2011 2012 2013 2014 2015
EBITDA / Interest Exp.
52.2%
50.8%
49.9%
52.3%
49.1%
47.9%
45.0%
46.0%
47.0%
48.0%
49.0%
50.0%
51.0%
52.0%
53.0%
2010 2011 2012 2013 2014 2015
Total Debt/Capital
24.9%
24.6% 24.6% 24.7%
25.5%
26.6%
23.0%
23.5%
24.0%
24.5%
25.0%
25.5%
26.0%
26.5%
27.0%
2010 2011 2012 2013 2014 2015
Gross Margin %

Appendix
20
US Yield to CAD Yield Regressions
Source: CapitalQ/ Thomson One/ Government of Canada QUEEN’S CAPITAL
Investment ThesisOverview Catalysts & Risks Valuation AppendixMacro/Micro
y = 0.2289x + 3.2529R² = 0.0821
0
1
2
3
4
5
6
0 1 2 3 4 5 6Can
ada
10
Yea
r B
on
d Y
ield
US Treasury 10 Year Bond Yield (%)
2004-2008 Cdn. Vs. US Yield Regression:
y = 0.9638x - 0.0037R² = 0.8922
0
0.5
1
1.5
2
2.5
3
3.5
4
4.5
0 1 2 3 4 5
Can
ada
10
Yea
r B
on
d Y
ield
US Treasury 10 Year Bond Yield (%)
2008-2015 Cdn. Vs. US Yield Regression:
Agency (Scope) Rating Date
S&P Short-term Issuer Credit Rating (Foreign) (2) NR 13-May-2003
A-2 06-Mar-2003
S&P Short-term Issuer Credit Rating (Domestic) (2) NR 13-May-2003
A-2 06-Mar-2003
S&P Senior Unsecured (Domestic) (1) BBB 03-May-2007
S&P Long-term Issuer Rating (Foreign) (4) BBB 03-May-2007
BBB+ 31-Oct-2006
A- 09-Oct-2001
A 12-Jan-2001
S&P Long-term Issuer Rating (Domestic) (4) BBB 03-May-2007
BBB+ 31-Oct-2006
A- 09-Oct-2001
A 12-Jan-2001
Dominion Bond Rating Service (DBRS) - Long-term Issuer (Foreign) (1)
BBB 14-Sep-2012
Dominion Bond Rating Service (DBRS) - Long-term Issuer (Domestic) (1)
BBB 29-Aug-2013
Issuer Ratings

Appendix
21
Detailed Debt Information 1
Source: Thomson One QUEEN’S CAPITAL
Investment ThesisOverview Catalysts & Risks Valuation AppendixMacro/Micro
Description Maturity Date Amount Outstanding (USD) Issued Amount (USD) Cpn Class Country Debt Type Mod Dur OA Dur OAS Yield Yld Type Yld Event Yld Date Price
WN IO Str 15/11/08
08-Nov-2015 Stripped Coupon Canada Intrst Only 0.105 0.109 69.0 1.143 MAT MAT 09-Nov-2015 100.000
WN IO Str 16/05/08
08-May-2016 Stripped Coupon Canada Intrst Only 0.602 0.604 86.0 1.311 MAT MAT 09-May-2016 99.000
WN 4 16/10/25 MTN
25-Oct-2016 262,467,192 262,467,192 Fixed Coupon Canada Unsecrd Nt 1.034 1.035 103.0 1.534 MAT MAT 25-Oct-2016 102.000
WN IO Str 16/11/08
08-Nov-2016 Stripped Coupon Canada Intrst Only 1.098 1.102 79.0 1.295 MAT MAT 08-Nov-2016 99.000
WN IO Str 17/05/08
08-May-2017 Stripped Coupon Canada Intrst Only 1.591 1.590 125.0 1.785 MAT MAT 08-May-2017 97.000
WN IO Str 17/11/08
08-Nov-2017 Stripped Coupon Canada Intrst Only 2.087 2.090 123.0 1.784 MAT MAT 08-Nov-2017 96.000
WN IO Str 18/05/08
08-May-2018 Stripped Coupon Canada Intrst Only 2.590 2.588 62.0 1.184 MAT MAT 08-May-2018 97.000
WN IO Str 18/11/08
08-Nov-2018 Stripped Coupon Canada Intrst Only 3.087 3.089 59.0 1.184 MAT MAT 08-Nov-2018 96.000
WN IO Str 19/05/08
08-May-2019 Stripped Coupon Canada Intrst Only 3.581 3.578 72.0 1.374 MAT MAT 08-May-2019 95.000
WN IO Str 19/11/08
08-Nov-2019 Stripped Coupon Canada Intrst Only 4.077 4.079 66.0 1.384 MAT MAT 08-Nov-2019 94.000
WN IO Str 20/05/08
08-May-2020 Stripped Coupon Canada Intrst Only 4.570 4.569 76.0 1.564 MAT MAT 08-May-2020 93.000
WN IO Str 20/11/08
08-Nov-2020 Stripped Coupon Canada Intrst Only 5.062 5.068 82.0 1.714 MAT MAT 09-Nov-2020 92.000
WN IO Str 21/05/08
08-May-2021 Stripped Coupon Canada Intrst Only 5.549 5.554 107.0 2.038 MAT MAT 10-May-2021 89.000
WN IO Str 21/11/08
08-Nov-2021 Stripped Coupon Canada Intrst Only 6.054 6.056 67.0 1.718 MAT MAT 08-Nov-2021 90.000
WN IO Str 22/05/08
08-May-2022 Stripped Coupon Canada Intrst Only 6.527 6.529 127.0 2.398 MAT MAT 09-May-2022 85.000
WN IO Str 22/11/08
08-Nov-2022 Stripped Coupon Canada Intrst Only 7.020 7.022 125.0 2.448 MAT MAT 08-Nov-2022 84.000
WN IO Str 23/05/08
08-May-2023 Stripped Coupon Canada Intrst Only 7.485 7.483 196.0 3.231 MAT MAT 08-May-2023 78.000
WN IO Str 23/11/08
08-Nov-2023 Stripped Coupon Canada Intrst Only 7.995 7.997 142.0 2.761 MAT MAT 08-Nov-2023 80.000
WN IO Str 24/05/08
08-May-2024 Stripped Coupon Canada Intrst Only 8.498 8.498 114.0 2.541 MAT MAT 08-May-2024 80.000

Appendix
22
Detailed Debt Information 2
Source: Thomson One QUEEN’S CAPITAL
Investment ThesisOverview Catalysts & Risks Valuation AppendixMacro/Micro
Description Maturity Date Amount Outstanding (USD) Issued Amount (USD) Cpn Class Country Debt Type Mod Dur OA Dur OAS Yield Yld Type Yld Event Yld Date Price
WN 4 24/06/17 '24 17-Jun-2024 149,981,252 149,981,252 Fixed Coupon Canada Bond 7.235 7.156 217.0 3.521 MAT MAT 17-Jun-2024 104.000
WN IO Str 24/11/08 08-Nov-2024 Stripped Coupon Canada Intrst Only 8.964 8.968 169.0 3.161 MAT MAT 08-Nov-2024 75.000
WN IO Str 25/05/08 08-May-2025 Stripped Coupon Canada Intrst Only 9.479 9.479 115.0 2.671 MAT MAT 08-May-2025 78.000
WN IO Str 25/11/08 08-Nov-2025 Stripped Coupon Canada Intrst Only 9.976 9.985 102.0 2.601 MAT MAT 10-Nov-2025 77.000
WN IO Str 26/05/08 08-May-2026 Stripped Coupon Canada Intrst Only 10.460 10.460 115.0 2.781 MAT MAT 08-May-2026 75.000
WN IO Str 26/11/08 08-Nov-2026 Stripped Coupon Canada Intrst Only 10.953 10.959 110.0 2.781 MAT MAT 09-Nov-2026 74.000
WN IO Str 27/05/08 08-May-2027 Stripped Coupon Canada Intrst Only 11.441 11.445 116.0 2.884 MAT MAT 10-May-2027 72.000
WN IO Str 27/11/08 08-Nov-2027 Stripped Coupon Canada Intrst Only 11.938 11.941 103.0 2.804 MAT MAT 08-Nov-2027 71.000
WN IO Str 28/05/08 08-May-2028 Stripped Coupon Canada Intrst Only 12.403 12.405 145.0 3.264 MAT MAT 08-May-2028 66.000
WN IO Str 28/11/08 08-Nov-2028 Stripped Coupon Canada Intrst Only 12.900 12.906 133.0 3.184 MAT MAT 08-Nov-2028 66.000
WN IO Str 29/05/08 08-May-2029 Stripped Coupon Canada Intrst Only 13.384 13.386 141.0 3.304 MAT MAT 08-May-2029 64.000
WN IO Str 29/11/08 08-Nov-2029 Stripped Coupon Canada Intrst Only 13.880 13.886 130.0 3.244 MAT MAT 08-Nov-2029 64.000
WN IO Str 30/05/08 08-May-2030 Stripped Coupon Canada Intrst Only 14.362 14.363 141.0 3.394 MAT MAT 08-May-2030 61.000
WN IO Str 30/11/08 08-Nov-2030 Stripped Coupon Canada Intrst Only 14.857 14.863 132.0 3.344 MAT MAT 08-Nov-2030 61.000
WN PO Str 30/11/08 08-Nov-2030 Stripped Coupon Canada Prin Only 14.880 14.885 101.0 3.034 MAT MAT 08-Nov-2030 63.000
WN 7 32/02/05 MTN 05-Feb-2032 112,485,939 112,485,939 Fixed Coupon Canada Unsecrd Nt 10.293 10.126 303.0 4.884 MAT MAT 05-Feb-2032 125.000
WN 7 33/03/01 MTN 01-Mar-2033 74,990,626 74,990,626 Fixed Coupon Canada Unsecrd Nt 10.870 10.666 300.0 4.924 MAT MAT 01-Mar-2033 120.000
WN 5 Perp '15 Perpetual 131,233,596 131,233,596 Fixed Coupon CanadaPreferred
Stock-- -- -- -- --
WN 5 Perp '15 Perpetual 149,981,252 149,981,252 Fixed Coupon CanadaPreferred
Stock-- -- -- -- --
WN 5 Perp '15 Perpetual 149,981,252 149,981,252 Fixed Coupon CanadaPreferred
Stock-- -- -- -- --