wo7-2: remote monitoring of pipeline cathodic protection ...members.igu.org/old/igu...
TRANSCRIPT

WO7-2:
Remote Monitoring of Pipeline Cathodic Protection
and Coating Integrity
Lars Vendelbo Nielsen
MetriCorr ApS

WO7-2:
Focus on
Corrosion Rate Monitoring in “Problematic” Test Posts
Lars Vendelbo Nielsen
MetriCorr ApS

Cathodic Protection Potential
Why keep starring when nothing happens?

AC INTERFERENCE
DC STRAY CURRENTS
TELLURICS
PROBLEMATIC TEST SITES

Tracks return
DC sub-station
Overhead feeder
A B
AC Interference
~
DC interference
AC and DC Interference
6
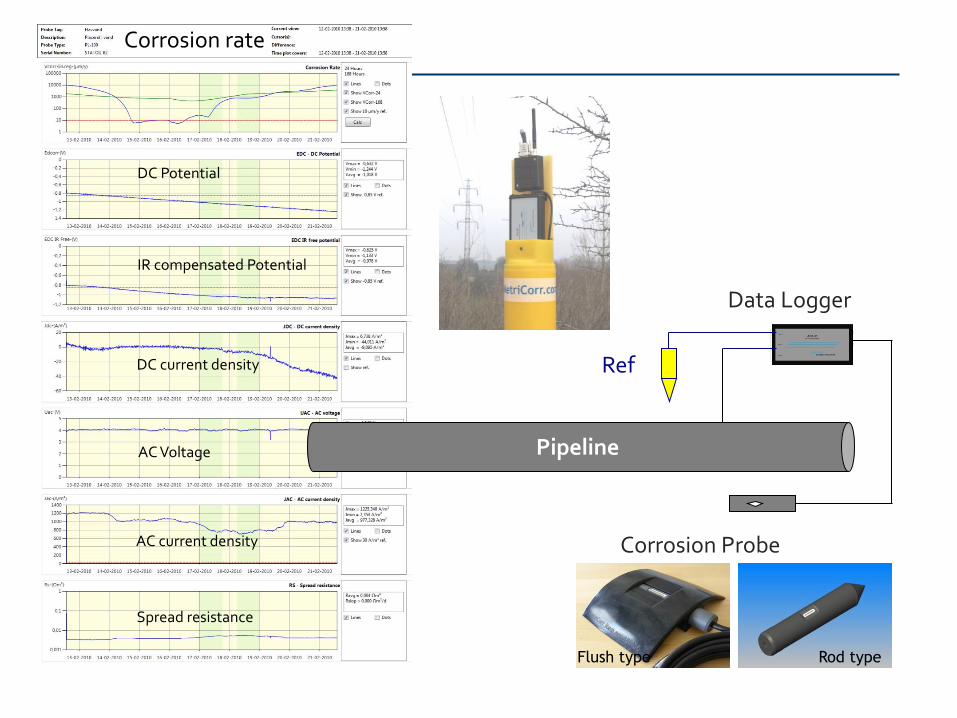
Pipeline
Corrosion Probe
Rod type Flush type
Ref
Data Logger
Corrosion rate
DC Potential
IR compensated Potential
DC current density
AC Voltage
AC current density
Spread resistance


Solar

Data flow

11
Pipeline
MetriCorr Probe
Rod type Flush type
Ref
MetriCorr Logger
Corrosion rate
DC Potential
IR compensated Potential
DC current density
AC Voltage
AC current density
Spread resistance

L
dw
(T) ρ
d
L
W
CR
ΔRt
(T) ρ
d
L
W
dt
dRCR
R
1
W
L(T) ρd
dW
L(T) ρ R
m
2
m
2
m
m
0TT
0mm α)(1)(Tρ (T)ρ
Specialized Electrical Resistance Technology

Corrosion rate calculation


Start stop Analysis covers Measpoints AVG int Vcorr Edc-avg IR.free-avg Jdc-avg Uac-avg Jac-avg Rs-avg.
days n Minutes mpy V V A/m² V A/m² Ωm²
09/03/2012 20:59 11/03/2012 22:34 2.06 291 10 0.0 -1.71 -1.366 1.349 5.739 22.557 0.255
12/03/2012 05:35 16/03/2012 13:04 4.31 620 10 0.0 -1.68 -1.331 1.278 9.853 36.249 0.273
26/03/2012 10:39 30/03/2012 02:28 3.59 456 11 0.0 -1.65 -1.333 1.25 7.865 31.197 0.253
16/03/2012 17:23 18/03/2012 23:17 2.24 322 10 0.0 -1.686 -1.357 1.117 8.136 27.688 0.294
23/03/2012 04:05 26/03/2012 02:42 2.94 418 10 0.0 -1.68 -1.351 1.302 7.618 30.391 0.252
10/02/2012 23:45 13/02/2012 01:04 2.04 280 10 0.0 -1.709 -1.322 1.679 5.953 26.256 0.231
21/02/2012 17:20 25/02/2012 07:14 3.57 515 10 0.1 -1.709 -1.315 1.29 10.68 35.256 0.304
25/02/2012 20:36 04/03/2012 23:17 8.1 1163 10 0.1 -1.681 -1.355 1.233 7.562 28.672 0.265
18/02/2012 11:05 21/02/2012 09:42 2.94 414 10 0.2 -1.735 -1.321 1.463 8.599 30.7 0.284
05/03/2012 12:39 09/03/2012 12:05 3.97 572 10 0.2 -1.661 -1.305 1.526 11.688 50.76 0.234
19/03/2012 05:03 22/03/2012 23:14 3.75 538 10 0.2 -1.69 -1.335 1.268 12.368 45.078 0.28
15/02/2012 16:17 18/02/2012 03:27 2.46 349 10 0.6 -1.732 -1.222 2.188 16.278 72.902 0.241
13/02/2012 05:06 15/02/2012 06:44 2.06 290 10 4.2 -1.724 -1.124 3.95 26.585 183.883 0.163
03/02/2012 23:42 06/02/2012 03:45 2.16 278 11 5.8 -1.749 -1.288 5.817 5.238 67.014 0.082
06/02/2012 08:19 10/02/2012 19:38 4.46 601 10 14.0 -1.718 -1.078 6.351 26.754 268.973 0.111
01/02/2012 14:09 03/02/2012 20:02 2.24 302 10 22.5 -1.727 -1.055 9.529 24.114 346.438 0.071
>40 mpy 4-39 mpy
1-4 mpy 0.4 -1 mpy <0.4 mpy
Development of criteria for CEN EN 15280

Examples from the field
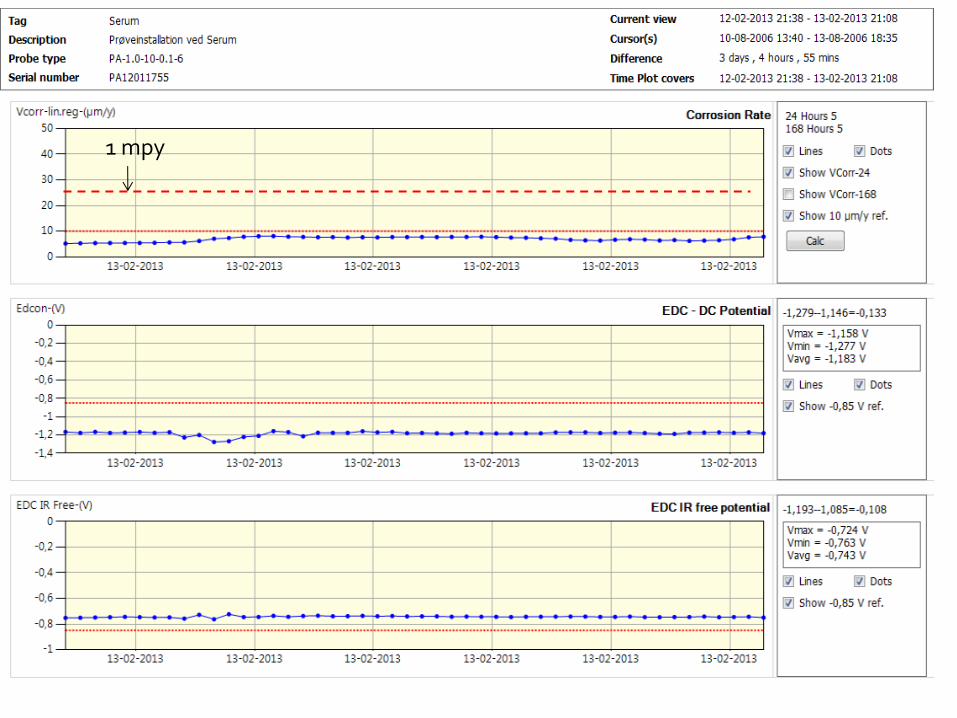
1 mpy

Corrosion rate

Corrosion rate
Corrosion rate

AC corrosion Morphology
Corrosion rate easily
up to10 mm/y (400 mpy) !

VICIOUS CIRCLE OF AC CORROSION
Increased
AC current Excessive CP
Depolarization
”thorough mitigation”
Induced AC
Reduced Spread resistance
Alkalinity Ohm’s law
Small defect Too much CP
Pre-requisites

AC CORROSION CHARACTERISTICS
CP can mitigate Corrosion

AC CORROSION CHARACTERISTICS
CP can mitigate AC Corrosion but…
AC Corrosion can be found to increase with increasing CP

CP does protect

Too much CP gives corrosion
CR (mpy)
100
0

DC INTERFERENCE

Corrosion Rate = ?
DC INTERFERENCE

Corrosion Rate = 0.000
DC INTERFERENCE

Corrosion Rate = 0.000 mm/y
9 out of 10 cases
DC INTERFERENCE

Probe-Tag: 5500 K11A-1
Probe Type: PA-0.4-10-0.1-6
Probe serial No.: PA04270025
Test initiated: 20-12-2005
0
100
200
300
400
500
600
700
800
900
1000
17/03/06 18/03/06 19/03/06 20/03/06 21/03/06 22/03/06 23/03/06 24/03/06 25/03/06
Date
AC
cu
rre
nt -
A/m
2
Co
rro
sio
n r
ate
mic
ron
/y
-80
-70
-60
-50
-40
-30
-20
-10
0
10
20
JD
C A
/m2
Ua
c (V
)
Corrosion rate Uac Jdc
Mixed AC/DC Interference - MEASUREMENTS

Mixed AC/DC Interference - ANALYSIS
0
100
200
300
400
500
600
700
0 50 100 150 200 250 300 350 400
Average AC current density (A/m2)
Vco
rr (
µm
/y)
DC stray current
with moderate AC.
DC stray current
with high AC
Low DC stray current
with high AC

Tracks positive feeder (I1)
Substation
+ - Overhead negative return (I1+I2+I3)
Alternative current path I2:
Partly insulating sleepers
V
Alternative current path I3:
Automated potential-equalizer via PE-earth (Max 50V)
Alternative current path (I2+I3)
Mixed AC/DC Interference –
SIMPLE SOLUTION MAKING OPERATOR HAPPY

Remote Monitoring - Data flow and Presentation

Remote Monitoring - Data flow and Presentation
Automated processing and feedback to T/R (Dynamic Cathodic Protection)

Vcorr Thickness Edc EIRFree Jdc Uac Jac Rs
µm/y µm V V A/m2 V A/m2 Ω*m2
MLCWB 1800+139 PA13012124 42 43,571 -1,578 -1,155 -3,475 10,436 87,697 0,143 2014 May 17 02:45
MLCWB 1800+139 PA13012089 45 468,876 -1,583 -1,177 -0,958 10,436 24,672 0,446 2014 May 17 02:45
MLCWB 1794+536 PA12011904 12 467,351 -1,683 -1,190 -2,306 13,768 66,210 0,216 2014 May 17 02:45
MLCWB 1794+536 PA12011898 10 98,876 -1,684 -1,477 -0,124 13,770 7,253 1,882 2014 May 17 02:45
MLCWB 1798+194 PA13012126 0 499,998 -1,695 -1,253 -3,300 11,744 89,192 0,138 2014 May 17 02:45
MLCWB 1798+194 PA13012082 0 100,001 -1,692 -1,342 -0,436 11,745 14,361 0,808 2014 May 17 02:45
MLCWB 1823+172 PA12011905 41 478,247 -1,471 -1,157 -3,970 10,583 133,767 0,080 2014 May 17 02:45
MLCWB 1823+172 PA13012080 34 89,756 -1,473 -1,238 -1,647 10,584 76,130 0,149 2014 May 17 02:45
MLCWB 1827+362 pa12011886 3 490,748 -1,569 -1,326 -2,409 2,947 29,297 0,102 2014 May 17 02:45
MLCWB 1827+362 PA13012084 0 96,441 -1,568 -1,297 -1,174 2,947 12,811 0,235 2014 May 17 02:45
Pipeline Tag Probe S/N Latest measurement
Your Data

Graphs Alarms

PIPELINE
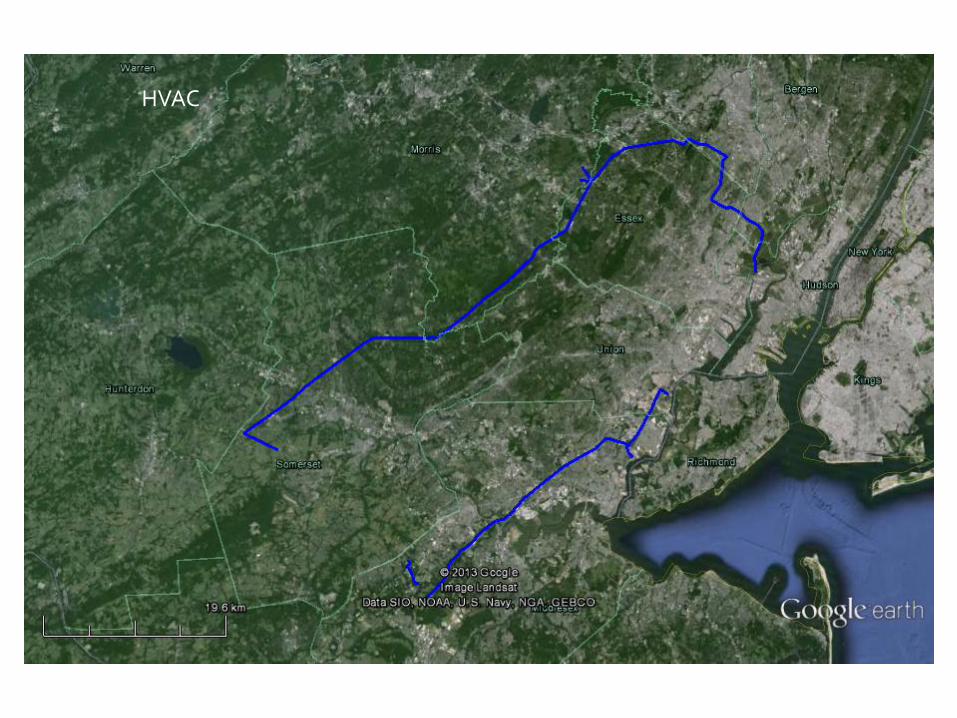
HVAC

AC Mitigation

PCR’s

T/R’s

Corrosion Probe installation points

HVAC + ER Probe installation points

Points & Postulates
• Corrosion rate probes can be applied with success for verification of
cathodic protection effectiveness in problematic areas (AC/DC
interference, complex piping systems, difficulties with achieving CP
criterion etc.)
• If combined with simultaneous electrical fingerprint measurements
(current densities, potentials, spread resistance), the corrosion rate
probes can be a very powerful tool in establishing cause of corrosion and
verify corrective actions.
• The concept is readily made part of a Remote Monitoring System
through which corrosion rate measurements simplifies the monitoring
process and reveals risk areas where potentials do not apply.
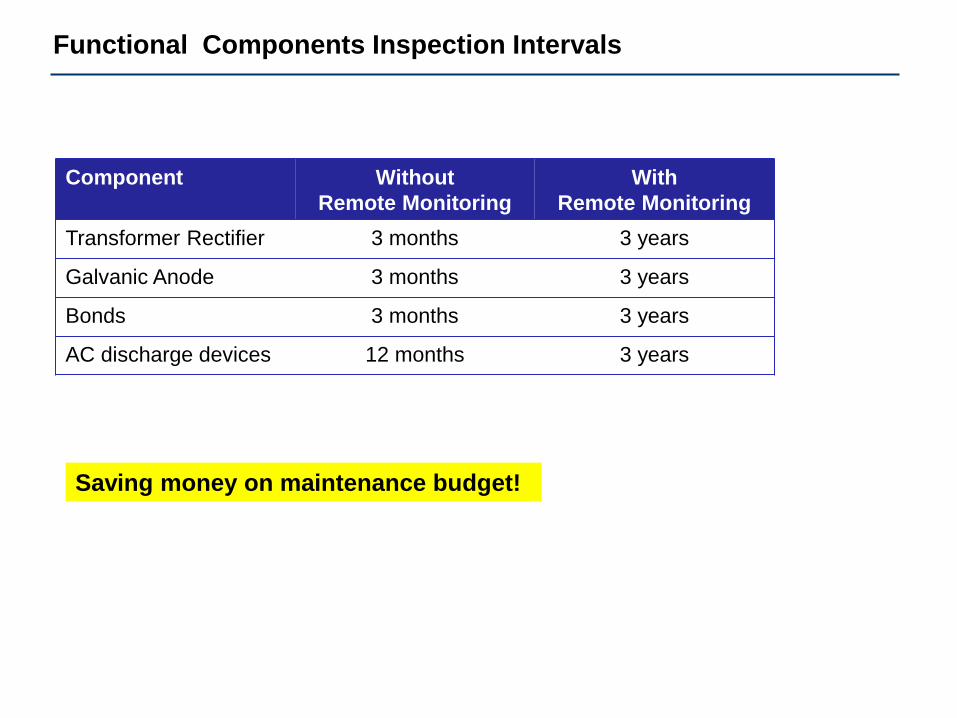
Functional Components Inspection Intervals
Component Without
Remote Monitoring
With
Remote Monitoring
Transformer Rectifier 3 months 3 years
Galvanic Anode 3 months 3 years
Bonds 3 months 3 years
AC discharge devices 12 months 3 years
Saving money on maintenance budget!
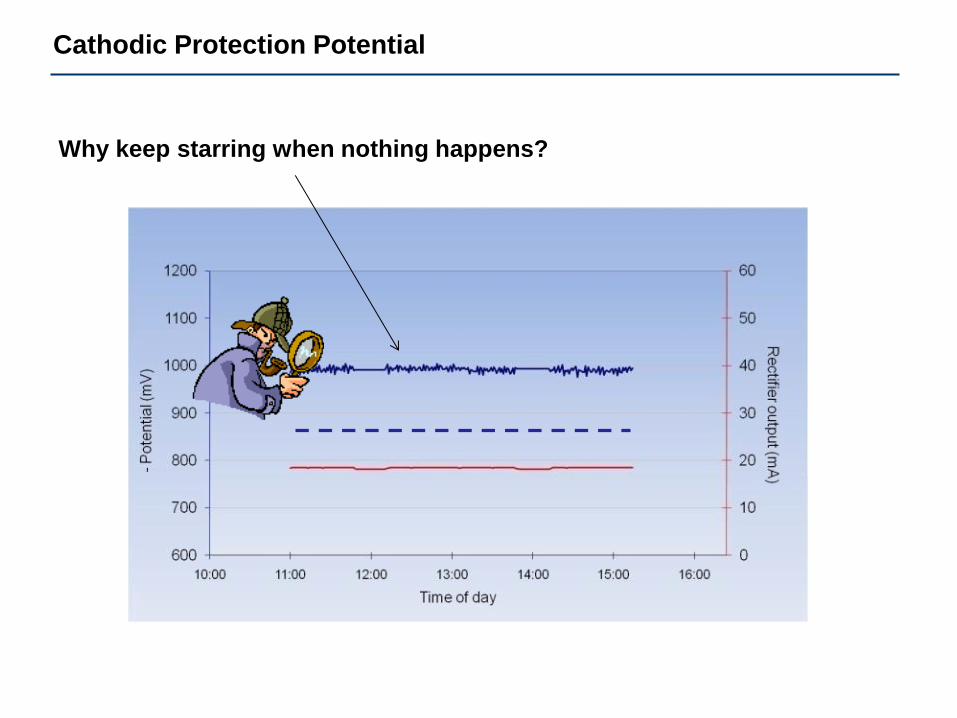
Cathodic Protection Potential
Why keep starring when nothing happens?

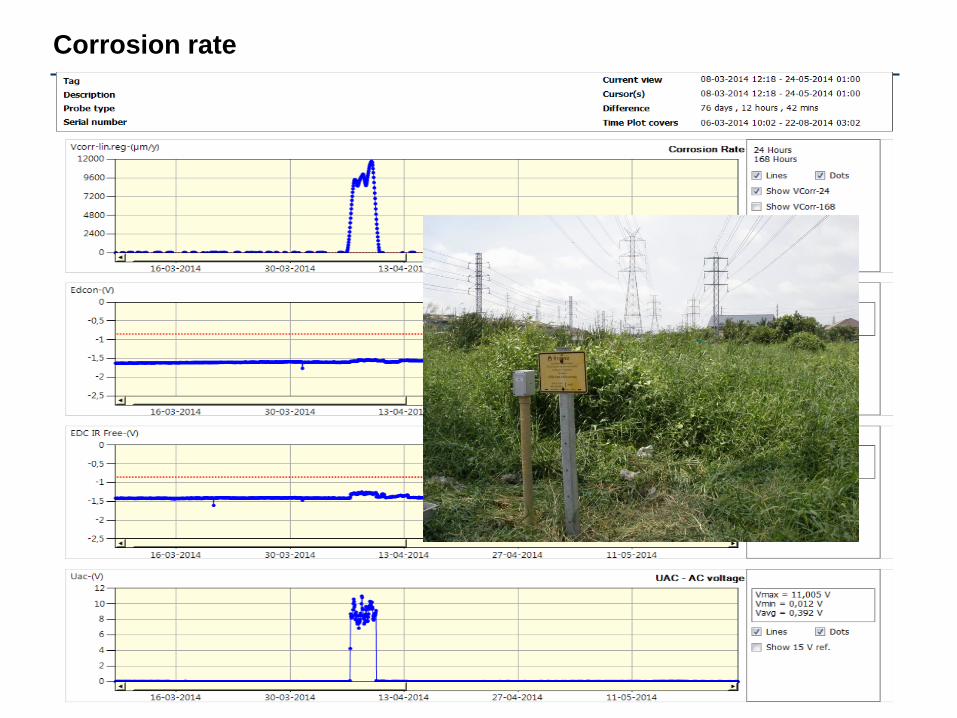
Coating Integrity Monitor
Who would have guessed that
this day around noon a highway
crash barrier was hammered
right down in the head of a
pipeline leaving a large crack
and a dent? Plot showing conventional cathodic protection monitoring data
throughout a detrimental third party damage.

Coating Integrity Monitor
Who would have guessed that
this day around noon a highway
crash barrier was hammered
right down in the head of a
pipeline leaving a large crack
and a dent? Plot showing conventional cathodic protection monitoring data
throughout a detrimental third party damage.
Coating Resistance Monitoring
Plot showing the MetriCorr Pipeline Integrity Monitor data
throughout a detrimental third party damage. NACE -10065
ON-LINE MONITORING OF AVERAGE COATING RESISTANCE WITH
OFF-POTENTIAL MODE T/R’s
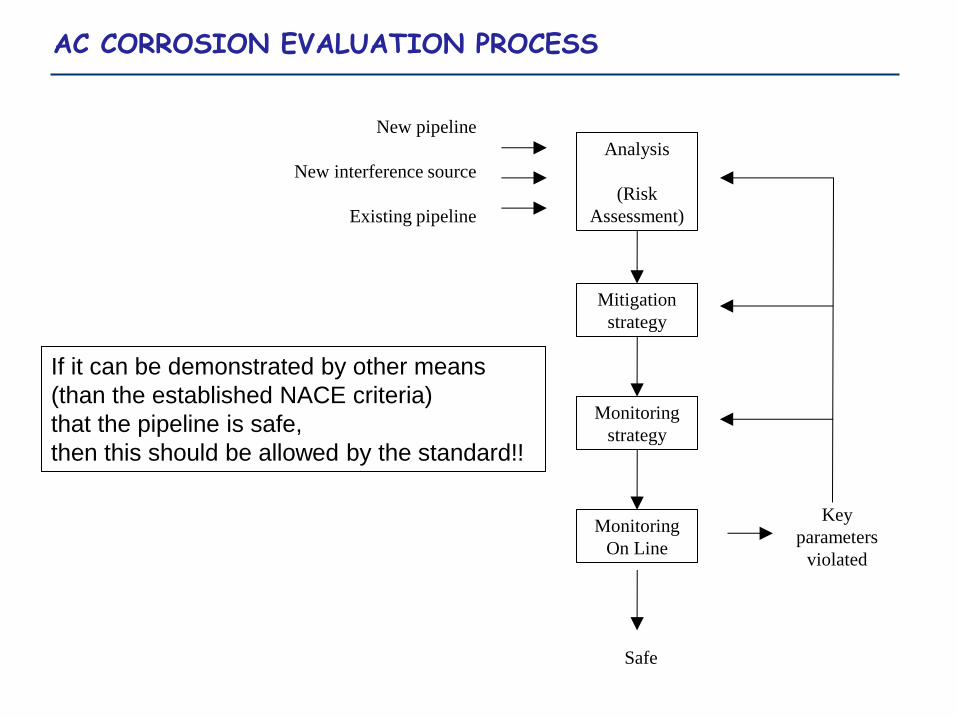
Analysis
(Risk
Assessment)
Mitigation
strategy
Monitoring
strategy
Monitoring
On Line
Safe
Key
parameters
violated
New pipeline
New interference source
Existing pipeline
If it can be demonstrated by other means
(than the established NACE criteria)
that the pipeline is safe,
then this should be allowed by the standard!!
AC CORROSION EVALUATION PROCESS

-1.500
-1.000
-0.500
0.000
0.500
1.000
1.500
0 2 4 6 8 10 12 14 16
pH
E (
V v
s S
CE
)Fe
Fe2+
Fe3+
Fe3O4
Fe2O3
HFeO2-
AC CORROSION CHARACTERISTICS
Pipe surface
Influx
(IDC) Out-flux
(Diffusion – texture) Accumulation
(pH increase)
OH- neutralisation (Mg/Ca)
H2O
OH-

-1.500
-1.000
-0.500
0.000
0.500
1.000
1.500
0 2 4 6 8 10 12 14 16
pH
E (
V v
s S
CE
)
Fe
Fe 2+
Fe 3+
Fe 3 O 4
Fe 2 O 3
HFeO 2 -
Fe → Fe 2+ + 2e-
O2 + 2H2O + 4e- → 4OH-
2H2O + 2e- → H2 + 2OH-
Vcorr Ianodic ?
Answer to the AC corrosion challenge: Increase the CP level Absolutely not
POURBAIX DIAGRAM AC CASE

RRef RCoup
Excitation current
Iexc
.
VR VC
0)(tR
0)(tR
(t)R
(t)R0)(t d d(t)
R
C
C
R
- assuming uniform temperature distribution between Ref and Coup
Temperature compensation (1)
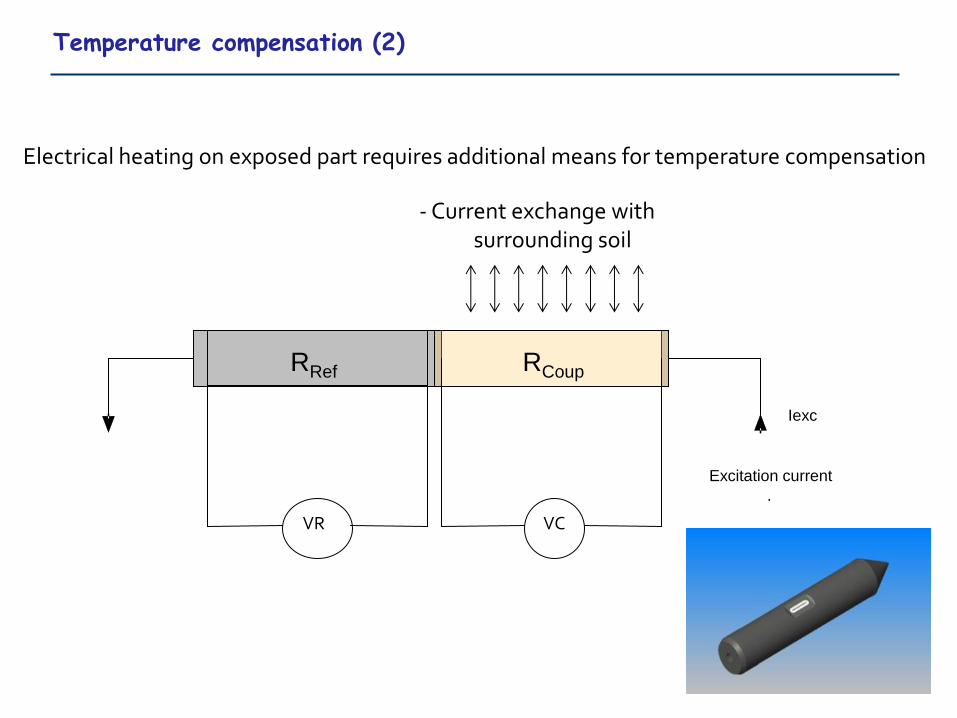
RRef RCoup
Excitation current
Iexc
.
VR VC
Electrical heating on exposed part requires additional means for temperature compensation
Temperature compensation (2)
- Current exchange with surrounding soil

ALL DATA POINTS
CEN – EN 15280 Voltage CRITERIA

ALL DATA POINTS
CEN – EN 15280 CRITERIA