wolters kluwer half year results 2001 rob pieterse, chairman of the executive board analysts &...
TRANSCRIPT

Wolters KluwerWolters Kluwer
Half Year Results 2001Half Year Results 2001
Rob Pieterse, Chairman of the Executive BoardRob Pieterse, Chairman of the Executive Board
Analysts & Investors, August/September 2001Analysts & Investors, August/September 2001

2
HIGHLIGHTS HY1-2001HIGHLIGHTS HY1-2001
• Benchmark results consistent with full year 2001 forecastBenchmark results consistent with full year 2001 forecast
• Overall organic sales growth disappointing Overall organic sales growth disappointing
• IHS immediate priority to address unsatisfactory performance IHS immediate priority to address unsatisfactory performance
• Strong increase in electronic sales, up 37%: now 26% of total (20%)Strong increase in electronic sales, up 37%: now 26% of total (20%)
• Internet sales doubled to EUR 175 million: now 10% of total (5%)Internet sales doubled to EUR 175 million: now 10% of total (5%)
• Many acquisitions of (smart) information tool companies Many acquisitions of (smart) information tool companies
• Portfolio reviews LTB Europe and North America concludedPortfolio reviews LTB Europe and North America concluded
• Professional Training sale almost completedProfessional Training sale almost completed
• Accounting for intangibles in line with new (IAS) standardsAccounting for intangibles in line with new (IAS) standards
• Outlook for 2001 reiterated: Ordinary Net Profit before Amortization of Outlook for 2001 reiterated: Ordinary Net Profit before Amortization of
Intangible Fixed Assets up approximately 5%, at constant currenciesIntangible Fixed Assets up approximately 5%, at constant currencies
Focus on Growing DifferentlyFocus on Growing Differently

3
SUMMARY FIGURES HY1-2001SUMMARY FIGURES HY1-2001• Single-digit sales growth, +7% (+5% at constant currencies)Single-digit sales growth, +7% (+5% at constant currencies)
• Organic sales growth 2%, due to modest market growth and product Organic sales growth 2%, due to modest market growth and product development lead-timedevelopment lead-time
• Doubling of profitable Internet sales; strong growth electronic salesDoubling of profitable Internet sales; strong growth electronic sales
• Again healthy flow of acquisitions, focused on (smart) information tool and Again healthy flow of acquisitions, focused on (smart) information tool and service companies, as well as electronic publishingservice companies, as well as electronic publishing
• EBITA growth -5% (-8% at constant currencies)EBITA growth -5% (-8% at constant currencies)
• IHS reports unsatisfactory underlying performanceIHS reports unsatisfactory underlying performance
• Increased product development spending by operating companiesIncreased product development spending by operating companies
• No new provisions for reorganizationsNo new provisions for reorganizations
• Additional (Internet) product development investment: EUR 43 million (HY1-Additional (Internet) product development investment: EUR 43 million (HY1-2000: EUR 8 million)2000: EUR 8 million)
• Excluding additional (Internet) product development spending EBITA Excluding additional (Internet) product development spending EBITA +5% (+2% at constant currencies)+5% (+2% at constant currencies)
• Ordinary net income before amortization of intangible fixed assets on Ordinary net income before amortization of intangible fixed assets on track, at EUR 173 million (HY1-2000: EUR 191 million)track, at EUR 173 million (HY1-2000: EUR 191 million)

4
RESULTS HY1-2001RESULTS HY1-2001EUR millionEUR million HY1-2001HY1-2001 HY1-2000HY1-2000
Pro forma restatedPro forma restated**
Variance Variance
%%
SalesSales
EBITAEBITA
EBITA marginEBITA margin
1,8081,808
344344
19.0%19.0%
1,6901,690
362362
21.4%21.4%
77
(5)(5)
Amortization of intangiblesAmortization of intangibles (149)(149) (130)(130)
EBITEBIT 195195 232232 (16)(16)
Financing resultsFinancing results
Ordinary pre-tax income (after Ordinary pre-tax income (after amortization) amortization)
Taxation**Taxation**
(88)(88) (84)(84)
107107
(72)(72)
(1)(1)
148148
(78)(78)
(2)(2)
(28)(28)
Minority interestMinority interest
Ordinary net income (after amortization)Ordinary net income (after amortization) 3434 6868
Results on divestments (after taxation)Results on divestments (after taxation) 3030 00
Net incomeNet income 6464 6868 (6)(6)
Ordinary net income before amortization Ordinary net income before amortization of intangiblesof intangibles
173173 191191 (9)(9)
Ordinary EPS before amortization of Ordinary EPS before amortization of intangibles, fully dilutedintangibles, fully diluted
0.620.62 0.690.69 (10)(10)
** Restated f Restated for or aamortization of mortization of iintangiblesntangibles**** Pre-Pre-ttax preax pre-a-amortization effective tax rate 32.3% (HY1-2000: 30.4 %)mortization effective tax rate 32.3% (HY1-2000: 30.4 %)

5
BREAKDOWN OF GROWTHBREAKDOWN OF GROWTH
12%12%
(2%)(2%)
----
0%0%
Reorganization ProvisionsReorganization Provisions
Additional InternetAdditional Internet
20%20%(5%)(5%)18%18%7%7%TotalTotal
CurrenciesCurrencies
11%11%
9%9%
(8%)(8%)
3%3%
11%11%
7%7%
5%5%
2%2%At constant currenciesAt constant currencies
(1%)(1%)(2%)(2%)DivestmentsDivestments
3%3%
9%9%
(12%)(12%)
5%5%
(1%)(1%)
4%4%
9%9%
2%2%
5%5%
(2%)(2%)
Sub-totalSub-total
AcquisitionsAcquisitions
(7%)(7%) (2%)(2%)
----
(10%)(10%)4%4%2%2%
----
0%0%
OrganicOrganic
HY1-2001HY1-2001HY1-2000HY1-2000HY1-2001HY1-2001
EBITAEBITASalesSales
HY1-2000HY1-2000

MODEST ORGANIC SALES GROWTHMODEST ORGANIC SALES GROWTH
• Sales: From 4% in HY1-2000 to 2%Sales: From 4% in HY1-2000 to 2%
• LTB Europe improves organic growth from last year’s 1% to 2%LTB Europe improves organic growth from last year’s 1% to 2%
• LTB North America has slow start, growing 2% organicallyLTB North America has slow start, growing 2% organically
• IHS faces modest organic sales decline compared with healthy IHS faces modest organic sales decline compared with healthy performance HY1-2000performance HY1-2000
• Education realizes strong growth HY1-2001Education realizes strong growth HY1-2001
• EBITA pre additional (Internet) spending: EBITA pre additional (Internet) spending: From -7% in HY1-2000 to -2%From -7% in HY1-2000 to -2%
• Modest organic EBITA decline LTB Europe compared with large Modest organic EBITA decline LTB Europe compared with large organic fall HY1-2000organic fall HY1-2000
• LTB North America matches organic EBITA and sales growthLTB North America matches organic EBITA and sales growth
• IHS sees organic EBITA under pressure, on balance causing IHS sees organic EBITA under pressure, on balance causing the 2% organic Wolters Kluwer EBITA declinethe 2% organic Wolters Kluwer EBITA decline
6

7
INTERNET AND OTHER ELECTRONIC SALES INTERNET AND OTHER ELECTRONIC SALES Half Year FiguresHalf Year Figures
2089
175
245
255
295
0
100
200
300
400
500
600
HY1-99 HY1-00 HY1-01
Other electronicsales
Internet sales
26%26%
20%20%
18%18%
Percentage figures represent electronic sales as part of total salesPercentage figures represent electronic sales as part of total sales

8
INTERNET AND OTHER ELECTRONIC SALES INTERNET AND OTHER ELECTRONIC SALES Full Year FiguresFull Year Figures
48228
350
504
582
670
0
200
400
600
800
1000
1200
FY-99 FY-00 FY-01E
Other electronicsales
Internet sales
26%26%
22%22%
18%18%
Percentage figures represent electronic sales as part of total salesPercentage figures represent electronic sales as part of total sales

9
SUCCESSFUL ACQUISITION PROGRAMSUCCESSFUL ACQUISITION PROGRAM
• 13 transactions (HY1-2000: 18) 13 transactions (HY1-2000: 18) Annualized sales EUR 177 million (HY1-2000: EUR 145 million)Annualized sales EUR 177 million (HY1-2000: EUR 145 million)
• Stronger focus on (smart) information tools Stronger focus on (smart) information tools Nearly allNearly all acquisitions are (smart) information tool companiesacquisitions are (smart) information tool companies
• High growth properties High growth properties Generally (smart) information tool companies have high organic growth; Generally (smart) information tool companies have high organic growth; margins at least in line with Wolters Kluwer averagemargins at least in line with Wolters Kluwer average
• Numerous affordable opportunities Numerous affordable opportunities Large pool of small and medium sized companies with strategic fit; Large pool of small and medium sized companies with strategic fit; multiples in line with traditional pricesmultiples in line with traditional prices
• Bringing new skills and competenciesBringing new skills and competencies
Increasingly High Growth (Smart) Information Tool CompaniesIncreasingly High Growth (Smart) Information Tool Companies

10
OUTCOME PORTFOLIO REVIEWS OUTCOME PORTFOLIO REVIEWS LTB Europe and LTB North AmericaLTB Europe and LTB North America• LTB Europe LTB Europe
• Focus on 6 core rather than 16 customer segments Focus on 6 core rather than 16 customer segments
• From country to matrix approach From country to matrix approach
• Implement new organization structure: customer segment facilitatorsImplement new organization structure: customer segment facilitators
• Harvest or divest non-core customer segmentsHarvest or divest non-core customer segments
• Divest ten Hagen & Stam Divest ten Hagen & Stam
• Improve operational excellence throughout clusterImprove operational excellence throughout cluster
• LTB North AmericaLTB North America
• Increase focus on legal & transaction compliance for the banking, Increase focus on legal & transaction compliance for the banking,
insurance and securities industries insurance and securities industries
• Accelerated expansion into (smart) information (productivity) tools Accelerated expansion into (smart) information (productivity) tools
• Discontinue Healthcare Administration Business (Aspen)Discontinue Healthcare Administration Business (Aspen)
Aimed at Sustainable GrowthAimed at Sustainable Growth

11
STRATEGIC FOUNDATIONS STRATEGIC FOUNDATIONS Five Business Principles - ProgressFive Business Principles - Progress
• Portfolio review: Portfolio review: e.g.e.g. LTB Europe and LTB North America concludedLTB Europe and LTB North America concluded
• (Smart) information tools: (Smart) information tools: e.g.e.g. Acquisition program on trackAcquisition program on track
• Fostering entrepreneurship: Fostering entrepreneurship: e.g.e.g. UpgradingUpgrading cluster management and incentives in progresscluster management and incentives in progress
• Operational excellence: Operational excellence: e.g. Improvinge.g. Improving customer relation management systems in progresscustomer relation management systems in progress
• Leveraging scale: Leveraging scale: e.g.e.g. Technology deals closedTechnology deals closed

12
LEGAL,TAX & BUSINESS EUROPE: LEGAL,TAX & BUSINESS EUROPE: Portfolio Review ConcludedPortfolio Review Concluded
EUR millionEUR million HY1-HY1-20012001
HY1-HY1-20002000
Variance Variance OrganicOrganic
growthgrowth
Organic after Organic after InternetInternet
SalesSales 656588 624624 5%5% 2%2% 2%2%
EBITAEBITA 119119 121121 (2%)(2%) (1%)(1%) (6%)(6%)
EBITA MarginEBITA Margin 18.1%18.1% 19.4%19.4%
FTE’s (average)FTE’s (average) 7,9777,977 7,5117,511
• Cluster management team installed and portfolio review concludedCluster management team installed and portfolio review concluded• Decision to focus on core customer segments accounting for some 75% Decision to focus on core customer segments accounting for some 75%
of sales, with sales growth target of 7%; margin target over 20% of sales, with sales growth target of 7%; margin target over 20% • Modest improvement organic sales growth, focus on operational Modest improvement organic sales growth, focus on operational
excellence excellence • Excellent performance France; substantial results improvement Excellent performance France; substantial results improvement
Netherlands (amongst others ten Hagen & Stam)Netherlands (amongst others ten Hagen & Stam)• Reorganizations in progress in notably the Netherlands, Belgium and Reorganizations in progress in notably the Netherlands, Belgium and
Spain Spain
Priority:Priority: Focus Resources on Growth AreasFocus Resources on Growth Areas

13
LEGAL, TAX & BUSINESS NORTH AMERICA: LEGAL, TAX & BUSINESS NORTH AMERICA: Strong Growth Internet SalesStrong Growth Internet Sales
• Electronic sales now 42% of total, Internet sales more than doubled to Electronic sales now 42% of total, Internet sales more than doubled to EUR 86 million, 15% of total sales EUR 86 million, 15% of total sales
• LIS growing strongly, despite slowing business formations and trademark LIS growing strongly, despite slowing business formations and trademark activitiesactivities
• Portfolio review: increased focus on compliance business for the banking, Portfolio review: increased focus on compliance business for the banking, insurance and securities industriesinsurance and securities industries
• Healthy flow of (smart information tool) acquisitions: Loislaw, CBF Healthy flow of (smart information tool) acquisitions: Loislaw, CBF Systems, and TSoftSystems, and TSoft
• Integration Loislaw progressing well: on track for FY-2001 EBITA break-Integration Loislaw progressing well: on track for FY-2001 EBITA break-even target even target
Priority:Priority: Extend Leading Market Position into Extend Leading Market Position into Smart Information Tools and ServicesSmart Information Tools and Services
EUR millionEUR million HY1-HY1-20012001
HY1-HY1-20002000
Variance Variance OrganicOrganic
growthgrowth
Organic after Organic after InternetInternet
SalesSales 585844 505505 16%16% 2%2% 2%2%
EBITAEBITA 147147 146146 1%1% 2%2% (11%)(11%)
EBITA MarginEBITA Margin 25.0%25.0% 28.8%28.8%
FTE’s (average)FTE’s (average) 6,1866,186 5,7235,723

14
LEGAL, TAX & BUSINESS ASIA PACIFIC: LEGAL, TAX & BUSINESS ASIA PACIFIC: Strong Growth CCH AsiaStrong Growth CCH Asia
• Sales of electronic products up 50%; Internet represents 13% of total salesSales of electronic products up 50%; Internet represents 13% of total sales• High organic growth of EBITA offset by negative currency impactHigh organic growth of EBITA offset by negative currency impact• Double-digit organic sales growth for CCH AsiaDouble-digit organic sales growth for CCH Asia
Priority: Priority: Further Expansion into AsiaFurther Expansion into Asia
EUR millionEUR million HY1-HY1-20012001
HY1-HY1-20002000
VarianceVariance OrganicOrganic
growthgrowth
Organic after Organic after InternetInternet
SalesSales 3131 3232 (3%)(3%) 0%0% 0%0%
EBITAEBITA 55 66 (16%)(16%) 11%11% (8%)(8%)
EBITA MarginEBITA Margin 17.5%17.5% 20.1%20.1%
FTE’s (average)FTE’s (average) 526526 484484

15
INTERNATIONAL HEALTH & SCIENCE:INTERNATIONAL HEALTH & SCIENCE:Addressing Performance Immediate Priority Addressing Performance Immediate Priority
• Organic growth held back by LWW, in part due to bankruptcy of Organic growth held back by LWW, in part due to bankruptcy of wholesaler in second half of 2000wholesaler in second half of 2000
• Acquisition of SilverPlatter (June 2001) further enhances Ovid’s leading Acquisition of SilverPlatter (June 2001) further enhances Ovid’s leading position as provider of databases and research tools for the medical and position as provider of databases and research tools for the medical and academic marketsacademic markets
• Decision on single electronic delivery platform takenDecision on single electronic delivery platform taken• Selective allocation of resources aimed at growth and electronic leverageSelective allocation of resources aimed at growth and electronic leverage
Priority:Priority: Acceleration of Electronic Delivery Acceleration of Electronic Delivery of Content and Software Toolsof Content and Software Tools
EUR millionEUR million HY1-HY1-20012001
HY1-HY1-20002000
VarianceVariance OrganicOrganic
growthgrowth
Organic after Organic after InternetInternet
SalesSales 382382 339339 13%13% (1%)(1%) (1%)(1%)
EBITAEBITA 7575 8080 (6%)(6%) (11%)(11%) (19%)(19%)
EBITA MarginEBITA Margin 19.6%19.6% 23.6%23.6%
FTE’s (average)FTE’s (average) 2,7922,792 2,5312,531

16
EDUCATION: EDUCATION: Netherlands and Sweden Doing WellNetherlands and Sweden Doing Well
• High seasonality both in sales and costsHigh seasonality both in sales and costs• Strong performance in the Netherlands and Sweden, with favorable Strong performance in the Netherlands and Sweden, with favorable
phasing towards the first half-yearphasing towards the first half-year• Now ready to move forward with reorganization of Swedish operation, Now ready to move forward with reorganization of Swedish operation,
reducing the headcountreducing the headcount
Priority:Priority: Expand E-learning Activities Expand E-learning Activities
EUR millionEUR million HY1-HY1-20012001
HY1-HY1-20002000
VarianceVariance OrganicOrganic
growthgrowth
Organic after Organic after InternetInternet
SalesSales 115115 113113 1%1% 6%6% 6%6%
EBITAEBITA 77 1212 (33%)(33%) (4%)(4%) (27%)(27%)
EBITA MarginEBITA Margin 6.46.4 10.4%10.4%
FTE’s (average)FTE’s (average) 1,4571,457 1,4981,498
17
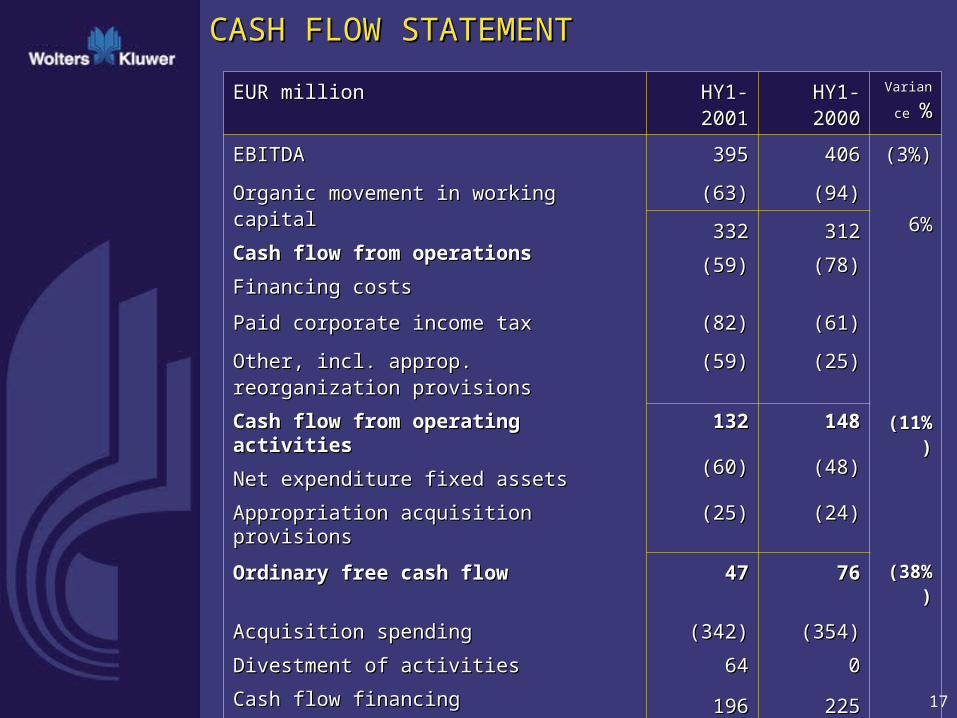
CASH FLOW STATEMENTCASH FLOW STATEMENT
EUR millionEUR million HY1-2001HY1-2001 HY1-2000HY1-2000 VarianceVariance
%%
EBITDAEBITDA 395395 406406 (3%)(3%)
Organic movement in working capital Organic movement in working capital
Cash flow from operationsCash flow from operations
Financing costsFinancing costs
(63)(63) (94)(94)
6%6%332332
(59)(59)
312312
(78)(78)
Paid corporate income tax Paid corporate income tax (82)(82) (61)(61)
Other, incl. approp. reorganization provisionsOther, incl. approp. reorganization provisions (59)(59) (25)(25)
Cash flow from operating activitiesCash flow from operating activities 132132 148148 (11%)(11%)
(60)(60) (48)(48)Net expenditure fixed assetsNet expenditure fixed assets
Appropriation acquisition provisionsAppropriation acquisition provisions (25)(25) (24)(24)
Ordinary free cash flowOrdinary free cash flow 4747 7676 ((38%38%))
Acquisition spendingAcquisition spending
Divestment of activitiesDivestment of activities
Cash flow financingCash flow financing
(342)(342)
6464
(354)(354)
00
196196 225225
Net cash flowNet cash flow (35)(35) (53)(53)
18
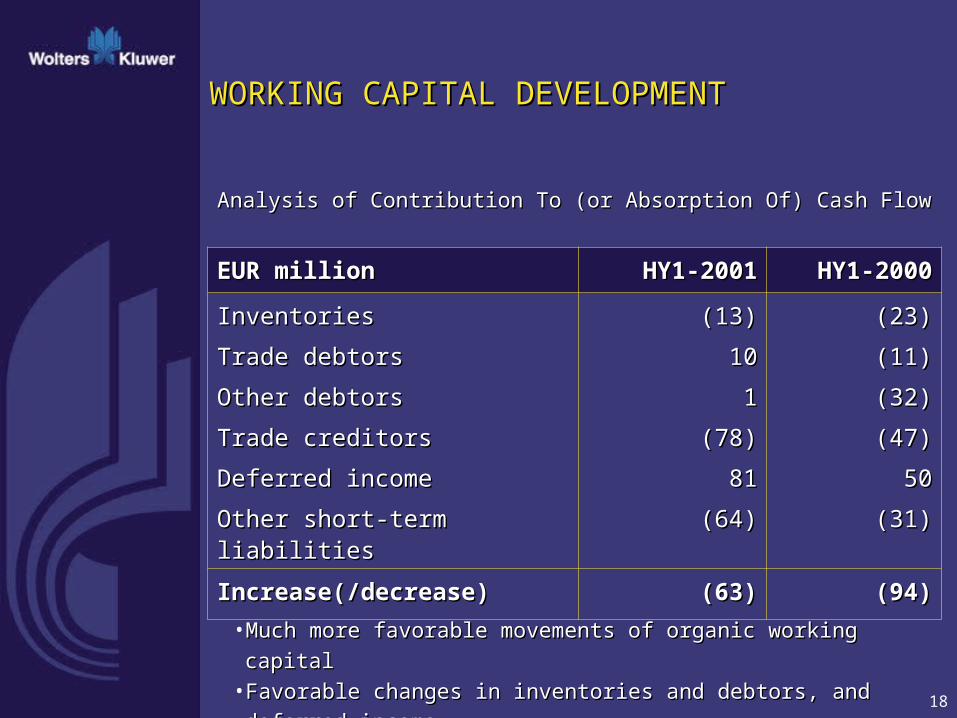
WORKING CAPITAL DEVELOPMENTWORKING CAPITAL DEVELOPMENT
Analysis of Contribution To (or Absorption Of) Cash FlowAnalysis of Contribution To (or Absorption Of) Cash Flow
EUR millionEUR million HY1-2001HY1-2001 HY1-2000HY1-2000
InventoriesInventories
Trade debtorsTrade debtors
Other debtorsOther debtors
Trade creditorsTrade creditors
Deferred incomeDeferred income
Other short-term liabilitiesOther short-term liabilities
(13)(13)
1010
11
(78)(78)
8181
(64)(64)
(23)(23)
(11)(11)
(32)(32)
(47)(47)
5050
(31)(31)
Increase(/decrease)Increase(/decrease) (63)(63) (94)(94)
• Much more favorable movements of organic working capitalMuch more favorable movements of organic working capital• Favorable changes in inventories and debtors, and deferred incomeFavorable changes in inventories and debtors, and deferred income

19
SUMMARYSUMMARY
• Benchmark results consistent with full year 2001 forecastBenchmark results consistent with full year 2001 forecast
• Continued focus on creating conditions sustainable double-digit growthContinued focus on creating conditions sustainable double-digit growth
• Electronic sales targeted to end 2001 above EUR 1 billionElectronic sales targeted to end 2001 above EUR 1 billion
• Internet sales expected to end 2001 at approximately EUR 350 millionInternet sales expected to end 2001 at approximately EUR 350 million
• LTB Europe now focused on implementation of new strategyLTB Europe now focused on implementation of new strategy
• IHS improving managerial execution and tightening strategic visionIHS improving managerial execution and tightening strategic vision
• More acquisitions of (smart) information tool companies More acquisitions of (smart) information tool companies
• Professional Training sale to be completed in HY2-2001 (ROVC) and Professional Training sale to be completed in HY2-2001 (ROVC) and
2002 (ISBW)2002 (ISBW)
Focus on Growing DifferentlyFocus on Growing Differently
20
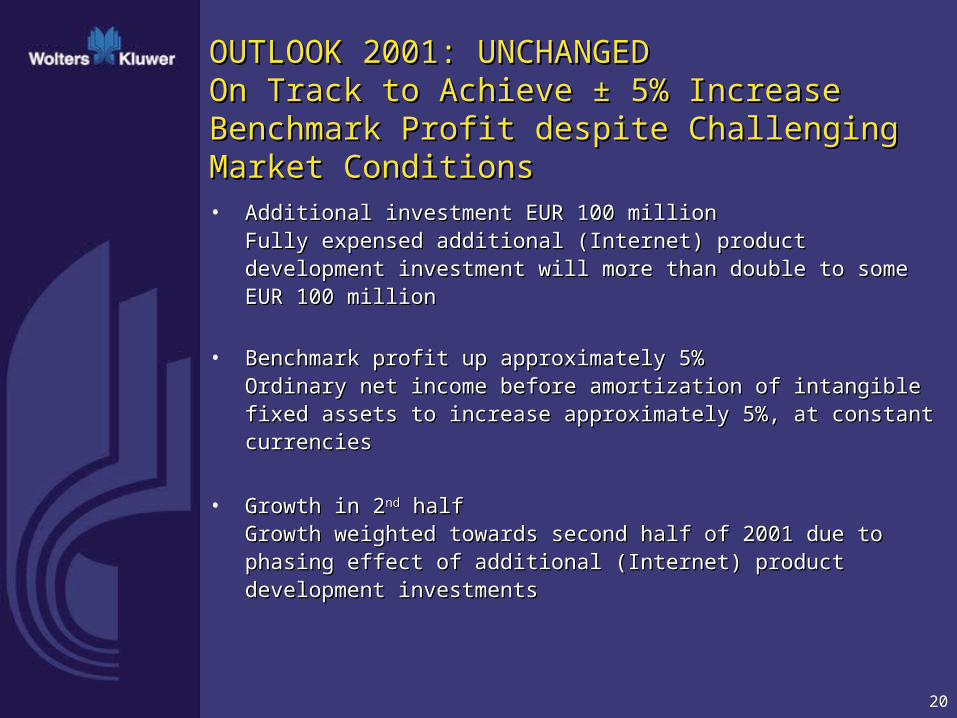
OUTLOOK 2001: UNCHANGEDOUTLOOK 2001: UNCHANGEDOn Track to Achieve On Track to Achieve ± ± 5% Increase Benchmark 5% Increase Benchmark Profit despite Challenging Market Conditions Profit despite Challenging Market Conditions
• Additional investment EUR 100 millionAdditional investment EUR 100 millionFully expensed additional (Internet) product development investment will Fully expensed additional (Internet) product development investment will more than double to some EUR 100 millionmore than double to some EUR 100 million
• Benchmark profit up approximately 5%Benchmark profit up approximately 5%Ordinary net income before amortization of intangible fixed assets to Ordinary net income before amortization of intangible fixed assets to increase approximately 5%, at constant currenciesincrease approximately 5%, at constant currencies
• Growth in 2Growth in 2ndnd half halfGrowth weighted towards second half of 2001 due to phasing effect of Growth weighted towards second half of 2001 due to phasing effect of additional (Internet) product development investmentsadditional (Internet) product development investments

AppendicesAppendices

22
ACQUISITIONSACQUISITIONS
EUR millionEUR million HY1-HY1-20012001
FY-FY-20002000
HY1-HY1-20002000
Total 1998-Total 1998-HY1-2001HY1-2001
Number of transactionsNumber of transactions
(including minority stakes)(including minority stakes)
1313 3737 1818 117117
Total investmentTotal investment 362362 458458 354354 2,2892,289
Acquired annual salesAcquired annual sales 177177 211211 145145 1,0351,035
Sales multiplierSales multiplier
EBITA multiplierEBITA multiplier
2.02.0
8.08.0
2.22.2
6.86.8
2.42.4
7.07.0
2.22.2
8.38.3
• (Smart) information tool and electronic publishing companies(Smart) information tool and electronic publishing companies• For example Loislaw, CBF Systems, TSoft, Compliance International, For example Loislaw, CBF Systems, TSoft, Compliance International,
and SilverPlatterand SilverPlatter

23
MOST IMPORTANT ACQUISITIONS MOST IMPORTANT ACQUISITIONS IN HY1-2001IN HY1-2001
Legal Tax & Business Legal Tax & Business North AmericaNorth America
CompanyCompany ActivityActivity Annual Sales (EUR m)Annual Sales (EUR m)
LoislawLoislaw Online provider ofOnline provider of
comprehensive legal comprehensive legal
informationinformation
2323
CBF SystemsCBF Systems Mortgage products for Mortgage products for financial services industryfinancial services industry
2626
TSoftTSoft Lending softwareLending software 44
Compliance InternationalCompliance International Electronic regulatory Electronic regulatory information for financial information for financial services industryservices industry
44
International Health & International Health & ScienceScience
CompanyCompany ActivityActivity Annual Sales ( EUR m)Annual Sales ( EUR m)
SilverPlatterSilverPlatter Electronic publisher of Electronic publisher of medical and scientific medical and scientific databasesdatabases
7272

24
PORTFOLIO BREAKDOWN PORTFOLIO BREAKDOWN Sales by MediaSales by Media
EUR millionEUR million Breakdown %Breakdown % HY1-HY1-20012001
HY1-HY1-20002000
Variance Variance
ElectronicElectronic 26%26% 470470 344344 37%37%
Print Print 72%72% 1,3001,300 1,2711,271 2%2%
TrainingTraining 2%2% 3838 7575 (49%)(49%)
TotalTotal 100%100% 1,8081,808 1,6901,690 7%7%

25
PORTFOLIO BREAKDOWNPORTFOLIO BREAKDOWNStrong Growth Electronic SalesStrong Growth Electronic Sales
Breakdown %Breakdown % HY1 -HY1 -20012001
HY1-HY1-20002000
Variance Variance
EUR EUR millionmillion
EUR EUR millionmillion
InternetInternet 37%37% 175175 8989 97%97%
Other onlineOther online 5%5% 2424 2323 4%4%
Sub-totalSub-total 42%42% 199199 112112 78%78%
CD-RomCD-Rom 58%58% 271271 232232 17%17%
Total electronicTotal electronic 100%100% 470470 344344 37%37%
Overview Internet salesOverview Internet sales EUR millionEUR million % of cluster (HY1 2000)% of cluster (HY1 2000)LTB Europe LTB Europe 32 32 5% 5% (3%)(3%)LTB North AmericaLTB North America 8686 15% 15% (7%)(7%)LTB Asia PacificLTB Asia Pacific 44 13%13% (0%)(0%)International Health and ScienceInternational Health and Science 5151 13%13% (9%)(9%)EducationEducation 2 2 2%2% (1%)(1%)
175175 10%10% (5%)(5%)

26
PORTFOLIO BREAKDOWN PORTFOLIO BREAKDOWN Slowly Decreasing Print BaseSlowly Decreasing Print Base
Breakdown %Breakdown % HY1 -HY1 -20012001
HY1-HY1-20002000
Variance Variance
EUR EUR millionmillion
EUR EUR millionmillion
Loose-leavesLoose-leaves 30%30% 382382 404404 (5%)(5%)
Journals & Journals & NewslettersNewsletters
27%27% 349349 364364 (4%)(4%)
BooksBooks 26%26% 344344 310310 11%11%
(Document) (Document) servicesservices
17%17% 225225 193193 17%17%
Total printTotal print 100%100% 1,3001,300 1,2711,271 2%2%

27
ADDITIONAL (INTERNET) PRODUCT ADDITIONAL (INTERNET) PRODUCT DEVELOPMENT INVESTMENTSDEVELOPMENT INVESTMENTS
Breakdown by ClusterBreakdown by Cluster
EUR millionEUR million
HY1-2001HY1-2001 HY1-2000HY1-2000
Legal, Tax & Business EuropeLegal, Tax & Business Europe 1010 44
Legal, Tax & Business North AmericaLegal, Tax & Business North America 2121 22
Legal, Tax & Business Asia PacificLegal, Tax & Business Asia Pacific 11 ----
International Health & ScienceInternational Health & Science 99 22
EducationEducation 22 ----
TOTALTOTAL 4343 88

28
CLUSTER BREAKDOWN SALES CLUSTER BREAKDOWN SALES 2000 And HY1-20012000 And HY1-2001
Breakdown by ClusterBreakdown by Cluster SALES SALES
EUR millionEUR million
HY1-HY1-20012001
HY1-HY1-20002000
FY-FY-20002000
Legal, Tax & Business EuropeLegal, Tax & Business Europe 658658 624624 1,3161,316
Legal, Tax & Business North Legal, Tax & Business North AmericaAmerica
584584 505505 1,0931,093
Legal, Tax & Business Asia PacificLegal, Tax & Business Asia Pacific 3131 3232 6060
International Health & ScienceInternational Health & Science 382382 339339 752752
EducationEducation 115115 113113 311311
Professional TrainingProfessional Training 3838 7777 132132
TOTALTOTAL 1,8081,808 1,6901,690 3,6643,664

29
CLUSTER BREAKDOWN EBITA CLUSTER BREAKDOWN EBITA 2000 And HY1-20012000 And HY1-2001
Breakdown by ClusterBreakdown by Cluster EBITA EBITA
EUR millionEUR million
HY1-HY1-20012001
HY1-HY1-20002000
FY FY 20002000
Legal, Tax & Business EuropeLegal, Tax & Business Europe 119119 121121 237237
Legal, Tax & Business North AmericaLegal, Tax & Business North America 147147 146146 333333
Legal, Tax & Business Asia PacificLegal, Tax & Business Asia Pacific 55 66 1212
International Health & ScienceInternational Health & Science 7575 8080 179179
EducationEducation 77 1212 5454
Professional TrainingProfessional Training 33 1010 1111
CorporateCorporate -12-12 -13-13 -37-37
TOTALTOTAL 344344 362362 789789

30
BREAKDOWN SALES GROWTH BREAKDOWN SALES GROWTH 2000 And HY1-20012000 And HY1-2001
HY1-HY1-20012001
HY1-HY1-20002000
FY 2000FY 2000
OrganicOrganic 2%2% 4%4% 5%5%
AcquisitionsAcquisitions 5%5% 9%9% 8%8%
DivestmentsDivestments (2%)(2%) (2%)(2%) (1%)(1%)
Total Constant RatesTotal Constant Rates 5%5% 11%11% 12%12%
CurrenciesCurrencies 2%2% 7%7% 7%7%
Total Total 7%7% 18%18% 19%19%

31
BREAKDOWN EBITA GROWTH BREAKDOWN EBITA GROWTH 2000 And HY1-20012000 And HY1-2001
HY1-2001HY1-2001 HY1-2000HY1-2000 FY 2000FY 2000
OrganicOrganic (2%)(2%) (7%)(7%) 0%0%
ProvisionsProvisions ---- 12%12% (4%)(4%)
Internet spendInternet spend (10%)(10%) (2%)(2%) (5%)(5%)
Sub-totalSub-total (12%)(12%) 3%3% (9%)(9%)
AcquisitionsAcquisitions 5%5% 9%9% 8%8%
DivestmentsDivestments (1%)(1%) (1%)(1%) (1%)(1%)
Total Constant RatesTotal Constant Rates (8%)(8%) 11%11% (2%)(2%)
CurrenciesCurrencies 3%3% 9%9% 9%9%
Total Total (5%)(5%) 20%20% 7%7%

32
CHARACTERISTICS OF BUSINESSCHARACTERISTICS OF BUSINESS
• Growth orientedGrowth orientedDouble-digit sales growth in each of past five years; sales tripled since 1994Double-digit sales growth in each of past five years; sales tripled since 1994
• Geographic diversificationGeographic diversificationBusiness is geographically balanced with activities in three continentsBusiness is geographically balanced with activities in three continents
• Local play, global leverageLocal play, global leverageOften local information markets served by local operating companies, yet capitalizing on Often local information markets served by local operating companies, yet capitalizing on global scaleglobal scale
• Focus on professionalsFocus on professionalsClearly defined portfolio, fully focused on professional customer groupsClearly defined portfolio, fully focused on professional customer groups
• Need-To-KnowNeed-To-KnowThe company has a strong base of proprietary and copyrighted content and tools (approx. The company has a strong base of proprietary and copyrighted content and tools (approx. 75% of sales) that are crucial (need-to-know) for professionals in their work75% of sales) that are crucial (need-to-know) for professionals in their work
• Strong subscription baseStrong subscription baseMore than 50% of sales is subscription based (prepaid), and we have established a loyal More than 50% of sales is subscription based (prepaid), and we have established a loyal customer basecustomer base
• Well-established brandsWell-established brandsWe own some of the oldest and longest established, and most respected brands in our We own some of the oldest and longest established, and most respected brands in our markets that represent core values such as authority, quality, reliability and trustmarkets that represent core values such as authority, quality, reliability and trust
• Almost Recession proofAlmost Recession proofStrong subscription base, need-to-have services, low dependency on advertisingStrong subscription base, need-to-have services, low dependency on advertising
33
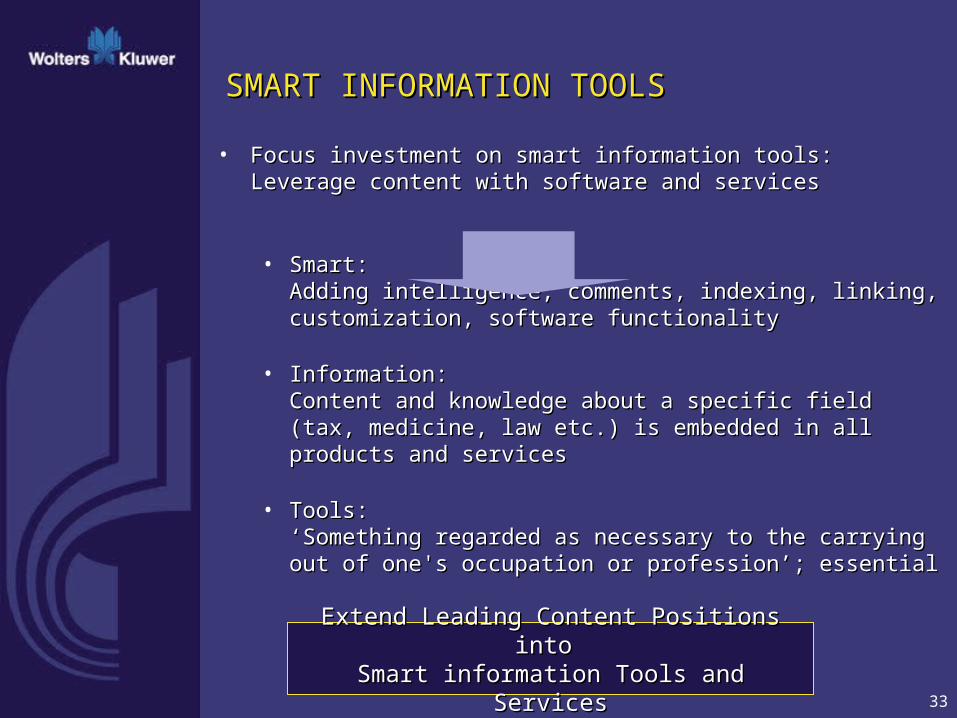
SMART INFORMATION TOOLSSMART INFORMATION TOOLS
• Focus investment on smart information tools:Focus investment on smart information tools: Leverage content with software and servicesLeverage content with software and services
• SmartSmart: : Adding intelligence; comments, indexing, linking, Adding intelligence; comments, indexing, linking, customization, software functionalitycustomization, software functionality
• InformationInformation: : Content and knowledge about a specific field (tax, medicine, Content and knowledge about a specific field (tax, medicine, law etc.) is embedded in all products and serviceslaw etc.) is embedded in all products and services
• ToolsTools: : ‘Something regarded as necessary to the carrying out of ‘Something regarded as necessary to the carrying out of one's occupation or profession’; essentialone's occupation or profession’; essential
Extend Leading Content Positions into Extend Leading Content Positions into Smart information Tools and ServicesSmart information Tools and Services

34
CONSOLIDATED BALANCE SHEETCONSOLIDATED BALANCE SHEET
EUR millionEUR million HY1-2001HY1-2001 HY1-2000HY1-2000Pro forma restatedPro forma restated**
Total fixed assetsTotal fixed assets 5,1885,188 4,5464,546
Total current assetsTotal current assets 1,2421,242 1,1031,103
Total current liabilitiesTotal current liabilities
Working capitalWorking capital
(1,796)(1,796) (1,554)(1,554)
(554)(554) (451)(451)
Capital EmployedCapital Employed 4,6344,634 4,0954,095
Shareholders’ equityShareholders’ equity 1,5021,502 1,1721,172
Minority interestsMinority interests
ProvisionsProvisions
Long-term loansLong-term loans
22
355355
2,7752,775
44
246246
2,6732,673
Total FinancingTotal Financing 4,6344,634 4,0954,095
* For amortization of intangibles* For amortization of intangibles

35
IMPACT CHANGED ACCOUNTING IMPACT CHANGED ACCOUNTING STANDARDS INTANGIBLES STANDARDS INTANGIBLES • Publishing RightsPublishing Rights
• In past no amortization requirement In past no amortization requirement
• New standards assume economic life of 20 years (unless compelling grounds point to New standards assume economic life of 20 years (unless compelling grounds point to more, up to 40 years) more, up to 40 years)
• Retrospective amortization charge against shareholders’ equity: EUR 451 millionRetrospective amortization charge against shareholders’ equity: EUR 451 million
• Amortization through P&L: HY1-2001 EUR 42 million chargeAmortization through P&L: HY1-2001 EUR 42 million charge
• Goodwill Goodwill • Until 2000 amortized over average period of 33 years Until 2000 amortized over average period of 33 years
• New standards assume economic life of 20 years (unless compelling grounds point to New standards assume economic life of 20 years (unless compelling grounds point to more, up to 40 years) more, up to 40 years)
• No retrospective charge, but increased prospective chargeNo retrospective charge, but increased prospective charge
• Amortization through P&L: HY1-2001 EUR 107 million chargeAmortization through P&L: HY1-2001 EUR 107 million charge
• If already applied in 2000, goodwill amortization charge would have been If already applied in 2000, goodwill amortization charge would have been
EUR 193 million compared with EUR 121 million reportedEUR 193 million compared with EUR 121 million reported
• ImpairmentImpairment• New standards prescribe stricter measures for valuing intangible assetsNew standards prescribe stricter measures for valuing intangible assets
• One-off correction of EUR 162 million (3% of total intangibles) against shareholders’ equityOne-off correction of EUR 162 million (3% of total intangibles) against shareholders’ equity
• Possible future corrections to be charged through P&LPossible future corrections to be charged through P&L

Wolters KluwerWolters Kluwer
Half Year Results 2001Half Year Results 2001
Rob Pieterse, Chairman of the Executive BoardRob Pieterse, Chairman of the Executive Board
Analysts & Investors, August 2001Analysts & Investors, August 2001