women in hospitality industry leadership
TRANSCRIPT

2021
WOMEN IN HOSPITALITY INDUSTRY LEADERSHIP

Our mission is to see women in more than one in three positions at all levels of hospitality industry leadership and ownership.
2 | Women in Hospitality Industry Leadership 2021

April 19, 2021Castell Project’s fourth annual report benchmarking women in hospitality industry leadership reflects broad awareness of the value of women in leadership. The statistics are the result of expanding work across the industry to develop female, as well as male, talent for hotel companies.
This has been a year of upheaval due to the COVID-19 pan-demic. In essence, the entire industry is going through a simul-taneous massive restructuring. This is both the challenge and opportunity of an era.
We strongly believe that taking advantage of this reset to optimize diverse leadership for the future will be a defining characteristic of those companies that are most successful in the post-pandemic years. Enabling women to serve as leaders not only doubles the talent pool available, giving diverse companies more and better opportunities. It also aligns these companies with their customers, markets and workforce.
Purpose of Castell ProjectCastell Project, Inc., a 501c3 non-profit, implements initiatives that enable companies and their female employees to fully benefit from workforce participation. Castell Project initiatives include:
• Tracking performance on diversity, with benchmark statistics including this report
• Providing leadership training to accelerate women on the corporate ladder; Castell BUILD and Castell ELEVATE pro-grams will be offered in 2021
• Presenting the WSH List and Castell Award to enhance wo-men’s image through presence on the podium both for their own careers and to inspire others
• Hosting Castell@College panels showing college students the richness of careers in hospitality for both women and men, including those with families
• Launching Fortuna’s Table to bring women into hotel owner-ship; for this entrepreneurial industry, ownership is a major route to leadership
This report is due to the generous support of the AHLA Foun-dation. The Foundation’s mission is to help people build ca-reers, improve their lives, and strengthen the lodging industry.
Contact and more information may be found at www.CastellProject.org. We would be delighted to work with your company as well as women advancing in the hospitality industry.
Board of Directors
Castell Project, Inc.
Companies with more than 30 percent women on their executive teams are significantly more likely to outperform those with between 10 and 30 percent women, and these companies in turn are more likely to outperform those with fewer or no women executives. As a result, there is a substantial performance differential—48 percent—between the most and least gender-diverse companies. 4
www.castellproject.org | 3

The “Why”The past year has been a time of extraordinary awakening to the opportunity diversity holds for businesses as well as other aspects of life. Previously taboo discussions of bias and other factors enabling discrimination are now the focus of intense interest. This change is not comfortable but is necessary and beneficial to the industry and the economy.
Change of the magnitude we are seeing is difficult to navigate un-der the best of circumstances. COVID-19 accelerated change by altering many aspects of our day-to-day lives. It also added layers of complexity to business operations as we navigate transitions in where and how we work, travel and live our lives. This annual re-port is a statistical tool first to understand where we are and then to support future planning given a changing marketplace.
Executive SummaryIn 2020, rhetoric around women and other diversity in leader-ship escalated, influenced by social unrest in the USA. Mean-while, representation of women in hospitality industry leader-ship barely moved.
• Overall, the odds of a woman reaching the executive lead-ership level (CEO, partner/principal, president, C-suite) were one woman to 5.9 men at the end of 2019. A year later, at the end of 2020, odds were 5.7 men per woman. Change at these levels is slow because they are usually career capping long-term positions. However, economic drivers including the strain of responding to COVID-19 and demographic drivers, such as a preponderance of Baby Boomer men in these roles, will result in significant turnover in the next few years. The challenge for the industry is to fully develop a diverse talent pool so that the best candidate for the company can emerge. The best candidate is sometimes, but not always, male.
• The fields of investment/development and technology/information have the lowest performance in the hospitality industry with regard to developing women. Female repre-sentation in investment/development improved marginally from 2019 to 2020 while technology/information slipped marginally. While there is discussion in both fields about opening opportunity to women, action requires cultural change and that has been slow. The reset after COVID-19 is a critical opportunity to use the technological and work-place adaptations of the past year to support the necessary cultural change in these fields.
• While there was not material year-over year progress, wom-en are nearly half of directors, one of every three vice pres-idents, and nearly a quarter of EVP/SVPs. There is a strong bench of female talent to move the industry forward.
There is ample evidence that diverse and inclusive companies are likely to make better, bolder decisions—a critical capability in the crisis. For example, diverse teams have been shown to be more likely to radically innovate and anticipate shifts in consumer needs and consumption patterns—helping their companies to gain a competitive edge.4
4 | Women in Hospitality Industry Leadership 2021

• Where they went: 11 percent of people listed in this dataset left their company from year-end 2019 to year-end 2020. This includes 12 percent of women compared to 10 per-cent of men in the sample. Of this group, 27 percent found employment within the hospitality industry, with a slightly higher proportion of men than women gaining re-employ-ment to-date. The full impact of the pandemic is larger than reflected in these statistics because of furloughs and delays in showing change on company websites and LinkedIn. We expect these numbers to increase during 2021.
• HR continues to be dominated by women. Sales/Marketing and Revenue Management are close to or above parity for women at most levels. Legal also has strong representation for women.
• The cost of the pandemic to hospitality industry employ-ment has been in the news. According to the US Bureau of Labor Statistics (BLS), average employment in Traveler Accommodation fell 35 percent (479,000 people) from 2019 to 2020. This average is reduced by full employ-ment in the months before the pandemic. Because there are more women than men employed in the hospitality industry, women lost 32 percent more jobs. Work at the property level was dramatically reduced by the reduction in travel and by hotel closures. While many companies restructured at the corporate level, the pandemic created additional work in areas including asset management, finance, accounting, legal, human resources, etc. Statis-tics in this report reflect employment in corporate offices rather than at the property level.
Executive team diversity will be a differentiating characteristic of the companies that thrive in the coming years. The statistics in this report are an indicator of where companies can improve their potential.
Keeping children at home through the pandemic put additional stress on an already stretched female workforce. This was true for property-level team members who faced additional financial strains as well as the challenge of supervising education, often without the tools to be effective. It was also true for managerial and executive women who were already challenged between the demands of home and work before losing their support sys-tems. Despite these extraordinary challenges, men and women adapted remarkably and creatively to manage through the year-plus of the pandemic.
We wouldn’t benefit from going back to business-as-usual-cir-ca 2018. Carrying the innovation of the past year forward and building on it offers true opportunity for our companies and the men and women working in the hospitality industry.
This growing polarization between high and low performers is reflected in an increased likelihood of a performance penalty. In 2019, fourth-quartile companies for executive-team gender diversity were 19 percent more likely than companies in the other three quartiles to underperform on profitability. This is up from 15 percent in 2017 and nine percent in 2015. And for companies in the fourth quartile of both gender and ethnic diversity the penalty is even steeper: in 2019 they are 27 percent more likely to underperform on profitability than all other companies in our data set.4
www.castellproject.org | 5

6 | Women in Hospitality Industry Leadership 2021

MethodologyThis report represents the public face of the hospitality indus-try. The data collected reports hospitality industry leadership appearing on its websites. Companies are selective about who they show on the web, so this public face of the industry may not be the full picture.
This report uses a new dataset purpose-built for Castell Project reports. We plan to expand this dataset each year.
There are 7,243 people in this dataset for 2020 and 6,692 for 2019.The dataset includes everyone listed on hotel company websites from director to CEO level. Additional titles are in the dataset, but sample sizes are not sufficiently robust to repre-sent these populations.
We cross-referenced everyone identified on the hotel company websites against their individual LinkedIn pages, recognizing that company websites may not be up-to-date and that LinkedIn profiles may not always be current. Data was recorded in late 2019/early 2020 and again in late 2020/early 2021 to establish trends and enable a comparison pre- and post-pandemic.
There are 801 hotel companies reflected in this report. The hotel company sample was drawn from the STR Directory of Hotel and Lodging Companies. It includes most hotel compa-nies listed in the STR Directory that: (1) are based in the US or Canada, (2) have over five hotels and/or over 700 rooms and (3) show executives on their websites.
Considerations for using this report:
• Virtually all the companies list their president and/or CEO. Many list directors, vice presidents, senior/executive vice pres-idents, chiefs in the c-suite, etc. However, listings are less com-plete further down the hierarchy. This means that the dataset is most representative at senior levels. Since the sample is large at each level, it is reasonably representative of the industry. However, the confidence level is lower for junior titles.
• Some of the industry’s largest employers (Marriott, Hilton, IHG) have been leaders with diversity initiatives over the past ten to twenty+ years and have robust populations of diverse directors, vice presidents, SVPs and EVPs. To the extent that large company director to senior/executive vice president level employees are not shown on corporate web-sites, diversity at these levels may be under-reported.
In past reports, hotel investment conference rosters were used to provide a snapshot of the real estate portion of the industry. Only one of these conferences took place in 2020; the others did not have live events due to COVID-19. We plan to incorpo-rate this analysis again in the 2022 report.
There are 801 hotel companies reflected in this report. The hotel company sample was drawn from the STR Directory of Hotel and Lodging Companies.
www.castellproject.org | 7

STR Directory of Hotel & Lodging Companies was used as a large sample of hotel company executives in prior reports. The Directory was only used for its listing of hotel companies in this year’s report while the data has been replaced by the new dataset. As a result, this year’s statistics will not match statistics in prior reports and should not be used together in trend analyses.
Levels and Fields in this ReportThis report classifies each person by gender, field (operations, construction, accounting/finance, etc.) and level (CEO to di-rector). The fields and levels used in this analysis are defined in the appendix. We also classify each person by race, and this is presented in a separate report, Black Representation in Hospi-tality Industry Leadership.
COVID-19 PandemicTo the extent job changes are shown on company websites and LinkedIn, we developed statistics to assess the impact of the COVID-19 pandemic to date. Although we cross-referenced company websites with individual LinkedIn pages, it is prob-able that more people are furloughed or unemployed than is reflected in this data. Not all companies have updated their websites and individuals often prefer to present themselves as employed on LinkedIn. However, the following statistics are presented as an indicator.
Where they went:
• 11 percent of people listed in this dataset left their company from 2019 to 2020.
• People leaving companies included 12 percent of women and 10 percent of men in the sample.
• Among those leaving their companies, 27 percent found employment within the hospitality industry, with a slightly higher proportion of men than women gaining re-employ-ment to date.
• An additional three percent changed jobs/titles within their company. A slightly higher proportion of women than men changed jobs/titles within their company.
• Only 44 (0.5 percent) of the people who left were at the CEO, president and partner/principal level. A slightly higher proportion of these were men than women. Not unexpect-edly, most of those who left companies during the pandem-ic were in junior level positions.
• We expect to see additional impact in next year’s report as websites and LinkedIn reflect new placements more fully.
11% of people listed in this
dataset left their company from 2019 to 2020.
8 | Women in Hospitality Industry Leadership 2021
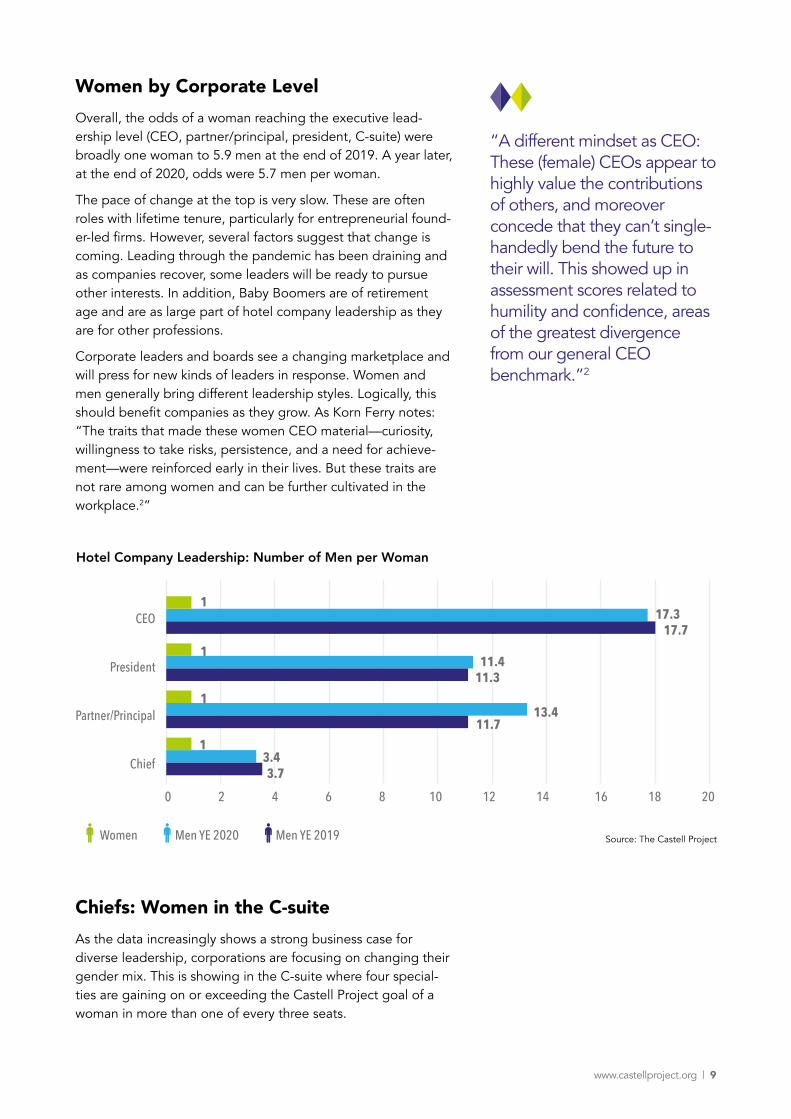
Women by Corporate Level Overall, the odds of a woman reaching the executive lead-ership level (CEO, partner/principal, president, C-suite) were broadly one woman to 5.9 men at the end of 2019. A year later, at the end of 2020, odds were 5.7 men per woman.
The pace of change at the top is very slow. These are often roles with lifetime tenure, particularly for entrepreneurial found-er-led firms. However, several factors suggest that change is coming. Leading through the pandemic has been draining and as companies recover, some leaders will be ready to pursue other interests. In addition, Baby Boomers are of retirement age and are as large part of hotel company leadership as they are for other professions.
Corporate leaders and boards see a changing marketplace and will press for new kinds of leaders in response. Women and men generally bring different leadership styles. Logically, this should benefit companies as they grow. As Korn Ferry notes: “The traits that made these women CEO material—curiosity, willingness to take risks, persistence, and a need for achieve-ment—were reinforced early in their lives. But these traits are not rare among women and can be further cultivated in the workplace.2”
“A different mindset as CEO: These (female) CEOs appear to highly value the contributions of others, and moreover concede that they can’t single-handedly bend the future to their will. This showed up in assessment scores related to humility and confidence, areas of the greatest divergence from our general CEO benchmark.”2
Chief
President
Partner/Principal
CEO
0
1
1
1
1
17.3
11.4
3.43.7
13.4
17.7
11.3
11.7
82 10 164 12 186 14 20
Hotel Company Leadership: Number of Men per Woman
Women Men YE 2020 Men YE 2019 Source: The Castell Project
Chiefs: Women in the C-suite As the data increasingly shows a strong business case for diverse leadership, corporations are focusing on changing their gender mix. This is showing in the C-suite where four special-ties are gaining on or exceeding the Castell Project goal of a woman in more than one of every three seats.
www.castellproject.org | 9

Along with research on the financial benefits of diverse leader-ship, data is emerging about additional positive attributes of women leaders – and debunking some of the misconceptions that have been used to justify bias.
LevelBy level, directors are now almost half female. This is not evenly distributed by field, as shown in subsequent charts, but is positive. Change from year-end 2019 to year-end 2020 was marginal. The pandemic was not a time when companies delib-erately invested in leadership change. Statistics show women losing ground at the president, partner/principal and managing director levels. However, there are so few women in leadership that the underlying numerical changes were small.
Although the positive numerical changes were small, it is encour-aging to see women making even marginal gains among CEOs and in the C-suite (chiefs). While there was not material year-over year progress, women are nearly half of directors, one of every three vice presidents, nearly a quarter of EVP/SVPs and Chiefs.
Accounting/ Finance
Technology/ Information
Sales/ Marketing
Overall
Operations
Investment/ Development
Legal
HR
16.9
8.6
1
1
19.5
9.2
4.45.0
1
1
3.4
2.42.3
1
1
1
0.8
0.6
1.1
3.4
0.7
3.7
3.6
1
0 205 2510 15
Chiefs: Number of Men per Woman
Source: The Castell ProjectWomen Men YE 2020 Men YE 2019
“Women were rated more positively on 13 of the 19 competencies in our assessment to comprise overall leadership effectiveness.” 1
10 | Women in Hospitality Industry Leadership 2021
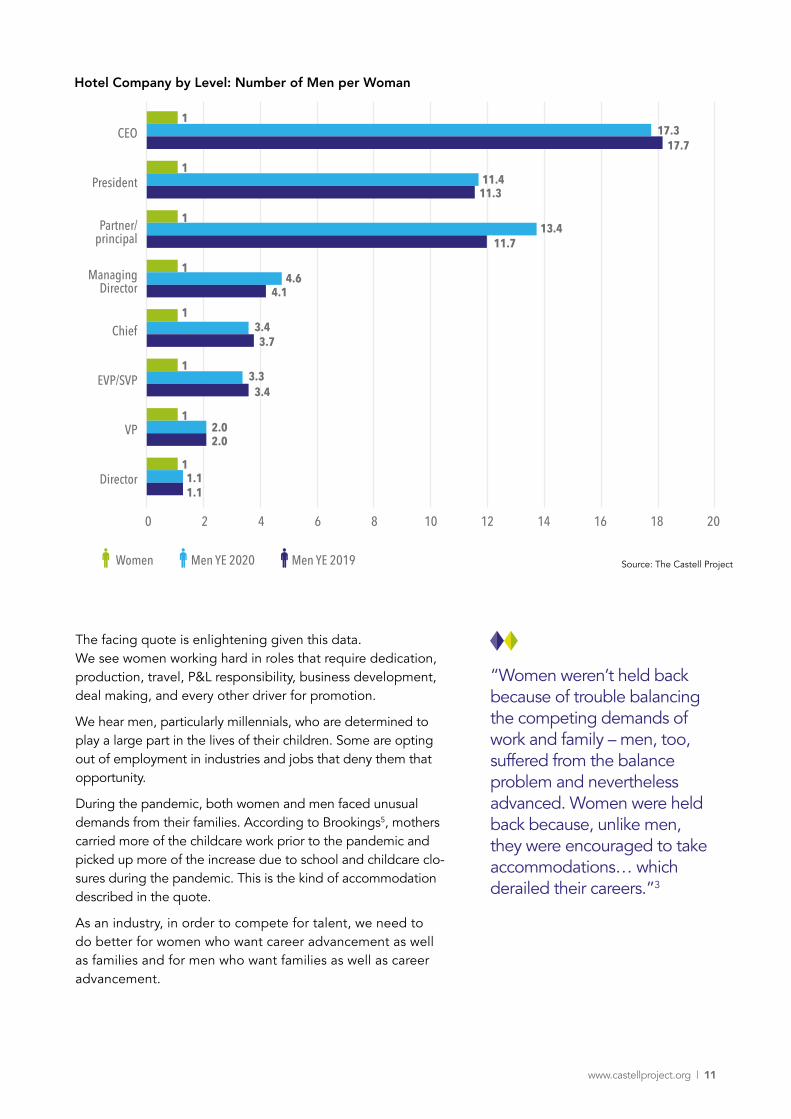
“Women weren’t held back because of trouble balancing the competing demands of work and family – men, too, suffered from the balance problem and nevertheless advanced. Women were held back because, unlike men, they were encouraged to take accommodations… which derailed their careers.”3
The facing quote is enlightening given this data. We see women working hard in roles that require dedication, production, travel, P&L responsibility, business development, deal making, and every other driver for promotion.
We hear men, particularly millennials, who are determined to play a large part in the lives of their children. Some are opting out of employment in industries and jobs that deny them that opportunity.
During the pandemic, both women and men faced unusual demands from their families. According to Brookings5, mothers carried more of the childcare work prior to the pandemic and picked up more of the increase due to school and childcare clo-sures during the pandemic. This is the kind of accommodation described in the quote.
As an industry, in order to compete for talent, we need to do better for women who want career advancement as well as families and for men who want families as well as career advancement.
Managing Director
President
EVP/SVP
Director
Partner/principal
CEO
Chief
VP
0 82 10 164 12 186 14 20
Hotel Company by Level: Number of Men per Woman
Women Men YE 2020 Men YE 2019 Source: The Castell Project
117.3
11.411.3
13.411.7
4.64.1
3.4
3.33.4
2.02.0
3.7
17.7
1
1
1
1
1
1
11.11.1
www.castellproject.org | 11

Women in Hotel Companies by Field or SpecialtyChanges in women’s share by field are marginal. We expect to see these numbers improve more substantially over time. Some fields already are open to participation from women at all levels. Others, notably investment/development and technol-ogy/information, lag severely. These are not fields that require brawn. This is a cultural problem that is limiting future access to talent and future performance for these fields.
Assets Management
Revenue Management
Accounting/ Finance
Technology/ Information
Sales/ Marketing
Operations
Construction/ Design
Investment/ Development
Legal
HR
9.2
8.0
3.9
1
1
1
1
1
1
1
1
1
1
9.4
7.6
3.7
3.8
3.3
2.2
2.22.2
0.8
0.70.8
0.30.2
0.9
3.6
2.1
3.8
0 8721 10943 65
Hotel Companies by Field: Number of Men per Woman
Source: The Castell ProjectWomen Men YE 2020 Men YE 2019
Returning to the status quo should not be the goal. Instead, we should aim higher—for an economy that compensates women fairly for their work, improves access to jobs through family-friendly policies, and supports women in their chosen roles as breadwinners, mothers, or some combination of the two. 5
12 | Women in Hospitality Industry Leadership 2021
1
1
1
1
3.3
4.1
1.5
0.7
1.5
0.8
3.6
4.8
0 41 52 63
Chief
EVP/SVP
VP
Director
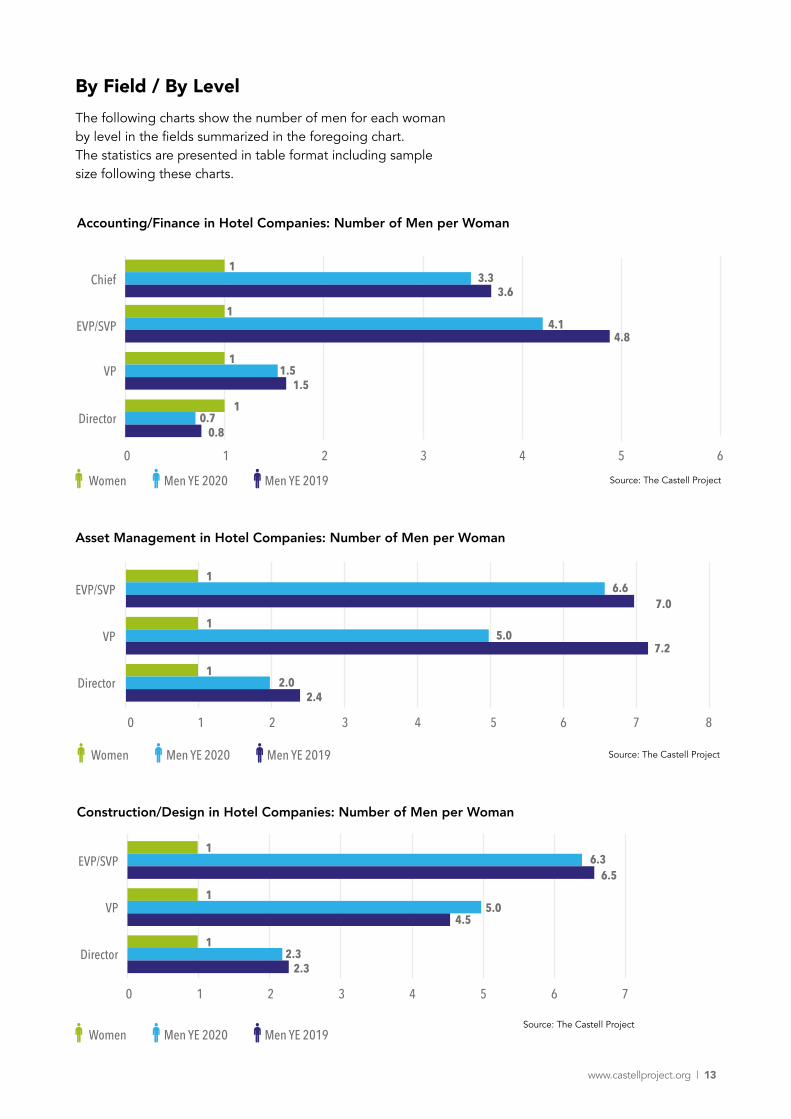
Accounting/Finance in Hotel Companies: Number of Men per Woman
Source: The Castell ProjectWomen Men YE 2020 Men YE 2019
By Field / By LevelThe following charts show the number of men for each woman by level in the fields summarized in the foregoing chart. The statistics are presented in table format including sample size following these charts.
1
1
1
6.6
5.0
2.02.4
7.0
7.2
0 41 5 82 63 7
EVP/SVP
Director
VP
Asset Management in Hotel Companies: Number of Men per Woman
Source: The Castell ProjectWomen Men YE 2020 Men YE 2019
1
1
1
6.3
5.0
2.32.3
6.5
4.5
0 41 52 63 7
EVP/SVP
Director
VP
Construction/Design in Hotel Companies: Number of Men per Woman
Women Men YE 2020 Men YE 2019Source: The Castell Project
www.castellproject.org | 13

1
1
1
1
0.7
0.6
0.3
0.2
0.3
0.1
0.7
0.5
0 0.80.2 10.4 1.20.6
Chief
EVP/SVP
VP
Director
Hotel Company HR: Number of Men per Woman
Women Men YE 2020 Men YE 2019 Source: The Castell Project
1
1
1
1
17.0
9.0
7.1
7.7
8.2
6.6
15.8
7.4
0 8 142 10 164 12 186
Chief
EVP/SVP
VP
Director
Investment/Development in Hotel Companies: Number of Men per Woman
Women Men YE 2020 Men YE 2019 Source: The Castell Project
Returning to the status quo should not be the goal. Instead, we should aim higher—for an economy that compensates women fairly for their work, improves access to jobs through family-friendly policies, and supports women in their chosen roles as breadwinners, mothers, or some combination of the two. 5
14 | Women in Hospitality Industry Leadership 2021

1
1
1
1
4.5
3.6
4.3
2.52.4
4.3
4.4
4.4
0 20.5 2.5 3.51 3 4.51.5 4 5
EVP/SVP
Chief
Director
VP
Operations in Hotel Companies: Number of Men per Woman
Women Men YE 2020 Men YE 2019Source: The Castell Project
1
1
1
1
1
0.9
0.8
0.5
0.9
0.6
1.1
1.2
0 0.80.2 10.4 1.41.20.6
Chief
EVP/SVP
VP
Director
Hotel Company Sales & Marketing: Number of Men per Woman
Women Men YE 2020 Men YE 2019 Source: The Castell Project
www.castellproject.org | 15

Chief EVP/SVP VP Director Sample
Accounting/ Finance
YE 2019 22% 17% 40% 57% 707
YE 2020 23% 20% 40% 58% 699
Asset Management
YE 2019 13% 12% 29% 122
YE 2020 13% 17% 33% 113
Construction/ Design
YE 2019 13% 18% 30% 180
YE 2020 14% 17% 30% 185
HR
YE 2019 61% 65% 78% 89% 340
YE 2020 59% 64% 78% 87% 330
Investment/ Development
YE 2019 6% 12% 11% 13% 465
YE 2020 6% 10% 12% 12% 468
Legal
YE 2019 31% 50% 31% 50% 168
YE 2020 30% 71% 25% 40% 170
Operations
YE 2019 19% 19% 19% 29% 1075
YE 2020 22% 18% 19% 29% 1109
Revenue Management
YE 2019 50% 36% 49% 59% 230
YE 2020 43% 55% 52% 62% 229
Sales/ Marketing
YE 2019 47% 45% 54% 63% 578
YE 2020 51% 53% 55% 65% 536
Technology/ Information
YE 2019 10% 0% 9% 18% 136
YE 2020 10% 0% 6% 17% 133
Statistical Summary
Share of Positions Held by Women in the Hospitality Industry
Source: The Castell Project, Inc.
16 | Women in Hospitality Industry Leadership 2021

DirectorPeople with the title of direc-tor, corporate director, senior director, etc. in all fields. However, hotel level direc-tors (director of sales, etc.) and area directors (regional director of operations, for example) are excluded from this dataset. Regional vice presidents are classified as directors in this dataset.
VPVice presidents in all fields. Vice presidents who also are C-suite chiefs are classified as chiefs. Those who also carry a partner or principal title are classified as partner/principal.
EVP/SVPExecutive and senior vice presidents in all fields. Those who also carry a “chief” C-suite title are classified as chiefs.
Chief (C-suite)Executives with “chief-of-ficer” in their title – CFO, COO, CMO, CLO, etc. Gen-eral counsels are classified as CLOs. Some chiefs also are presidents or SVPs, for instance. Dual titles includ-ing chief and director, VP or EVP/SVP are categorized by their chief role. Dual titles including president or CEO are classified as president or CEO and also shown in the distribution of chiefs.
Principal/PartnerPrincipal, partner, member, shareholder, regional man-aging partner, vice chair and co-chair.
Managing DirectorManaging directors, man-aging principals and senior managing directors as well as “head” titles.
PresidentPresident, owner and found-er. Presidents with the addi-tional title of CEO are listed under CEO. Those who are also chiefs are included in the leadership statistics as pres-idents and are also included in the C-suite detail.
CEOCEOs, as well as CEOs with additional titles such as CEO and chairman, president or managing director.
BoardChairman and board director. We do not present board representation in this report. However, our report on Di-versity of Hospitality Industry Public Boards 2021 is available at www.CastellProject.org.
Levels: DefinitionsTitles held by men and women are organized by level in this report using the following groups of titles.
References
1. Research: Women are Bet-ter Leaders During a Crisis Jack Zenger and Joseph Folkman, Harvard Business Review, December 30, 2020
2. Women CEOs Speak: Stra-tegies for the next genera-tion of female executives and how companies can pave the road. Korn Ferry Institute, 2017
3. Hotels that Promote Wo-men Perceived as Fai-rer, Less Discriminatory, University of Houston, International Journal of Contemporary Hospita-lity Management www.emerald.com/insight/content/doi/10.1109/IH-CHM-07-2020-0647) July 2020
4. Diversity Wins: How Inclu-sion Matters. McKinsey & Company May 2020
5. Why has COVID-19 been especially harmful for wor-king women? Brookings, 19A The Brookings Gender Equality Series, October 2020
www.castellproject.org | 17

Board of the Castell Project, Inc.
Peggy Berg, Chair, Castell Project, Inc.
Mary Beth Cutshall, Executive Vice President and Chief Development Officer, HVMG; Managing Partner, Amara Capital. Castell Project, Vice Chair
Eve Moore, Vice President of Operations, Legacy Ventures. Castell Project Secretary
Catherine Morgen, Partner, Morris, Manning & Martin. Castell Project Treasurer
Chris Daly, President, Daly Gray. Castell MarComm committee chair
Fern Kanter, Executive Vice President, CHM Warnick. Castell@College committee chair
Kirk Kinsell, Principal, Panther Ridge Partners. Castell Partners and Funding committee chair
Tracy Prigmore, Founder and Managing Partner, TLTsolutions; Founder, She Has a Deal. Fortuna’s Table committee co-chair
Rachel Moosa, Managing Director and Founder, The Hospitality Gig
Talene Staab, Vice President & Global Head of Tru by Hilton
Staff Deborah Cox, Vice President, Castell Project, Inc.
18 | Women in Hospitality Industry Leadership 2021

As an industry, in order to compete for talent, we need todo better for women who want
career advancement as wellas families and for men who
want families as well as careeradvancement.
