women in the adf report - department of defence · defence people group, department of defence,...
TRANSCRIPT

Women in the ADF Report
2013–14
Supplement to the Defence Annual Report 2013–14

Defence People Group, Department of Defence, Australia 2014 Cover photo by ABIS Jo Dilorenzo, 1st Joint Public Affairs Unit Two women deployed to Afghanistan as part of Operation Slipper look out over the heavy weapons range in Tarin Kowt, Afghanistan. Source: Australian Defence Image Library

Page 3 of 54
Contents Women in the ADF .......................................................................................................................... 6
Women’s participation ................................................................................................................ 6 ADF enlistments ................................................................................................................... 16 Recruitment of women initiatives ....................................................................................... 19 ADF promotions.................................................................................................................... 22 Representation of women on Defence senior decision-making committees .............. 24 Women and men retained after parental leave ............................................................... 25 Career breaks ....................................................................................................................... 26 Gender pay audit .................................................................................................................. 29 Separation rates ................................................................................................................... 33
Women’s experience ................................................................................................................ 34 Attitudes and perceptions ................................................................................................... 34
Mentoring, networking and sponsorship ................................................................................ 41 Education ............................................................................................................................... 44
Access to flexible working arrangements .............................................................................. 45 Formalised Flexible Work Arrangements ......................................................................... 46
Broderick review’s phase 2, recommendations 6, 9 and 13............................................... 49 Recommendation 6: Promotional gateways .................................................................... 49 Recommendation 9: Recruitment growth targets............................................................ 52 Recommendation 13: Flexible work arrangement targets ............................................. 53
List of figures and tables Figures Figure 1: Percentage of women at each officer rank, by service, 30 June 2014................ 9 Figure 2: Percentage of women at each other rank, by service, 30 June 2014 ............... 10 Figure 3: Percentage of ADF women in each state and territory, 30 June 2014.............. 12 Figure 4: Percentage of women in each occupational group, by service, 30 June 2014 . 15 Figure 5: Percentage of female ADF permanent force enlistments, by type and service, 2013–14........................................................................................................................... 17 Figure 6: Percentage of female ADF permanent force ab initio enlistments, by type and service, 2013–14 ............................................................................................................. 17 Figure 7: Percentage of women ADF permanent force prior service enlistments, by type and service, 2013–14 ...................................................................................................... 19 Figure 8: Proportion of officer promotions filled by women and percentage of women in ranks below, 2013–14...................................................................................................... 23 Figure 9: Proportion of other ranks promotions filled by women and percentage of women in ranks below, 2013–14.................................................................................................. 23 Figure 10: Percentage of women and men in key Defence decision-making bodies, 30 June 2014 ........................................................................................................................ 24 Figure 11: Percentages of women and men retained after taking paid maternity or parental leave in the 18 months to 30 June 2014 .......................................................................... 26 Figure 12: Percentage of career breaks taken by women and men, by service, 2013–1428 Figure 13: ADF gender pay gap, Australian national pay gap and public administration and safety industry pay gap.................................................................................................... 29 Figure 14: Average gender pay gap at each officer rank, by service, 30 June 2014 ....... 31 Figure 15: Average gender pay gap at each other rank, by service, 30 June 2014 ........ 31 Figure 16: ADF permanent force 12-month rolling separation rate, by service, rank group and gender, 30 June 2014............................................................................................... 33

Page 4 of 54
Figure 17: Percentages of ADF women and men agreeing or strongly agreeing with YourSay items about job satisfaction, 2013–14 ............................................................... 36 Figure 18: Percentages of ADF women and men agreeing or strongly agreeing with YourSay items about morale and intention to leave, 2013–14......................................... 37 Figure 19: Percentages of ADF women and men agreeing or strongly agreeing with YourSay items about Pathway to Change, 2013–14 ....................................................... 38 Figure 20: Percentages of ADF women and men agreeing or strongly agreeing with YourSay items about leadership, 2013–14 ...................................................................... 38 Figure 21: Percentages of ADF women and men agreeing or strongly agreeing with YourSay items about identification with Defence, 2013–14 ............................................. 39 Figure 22: Percentage of women in ADF sponsored study, by service and percentage of women in the workforce, 30 June 2014 ........................................................................... 44 Figure 23: Percentages of ADF women and men responding positively to YourSay items about flexible work, 2013–14 ........................................................................................... 46 Tables Table 1: ADF permanent force, by gender and rank, 30 June 2014[1][8][9][10][11] .................. 8 Table 2: ADF permanent force, by gender and employment location, 30 June 2014[1][2][6][7][8][9] ................................................................................................................. 11 Table 3: Key bases in each Australian state and territory, by service.............................. 12 Table 4: ADF permanent force, by gender, occupational group and rank group, 30 June 2014[1][2][3][4][5][6][7] .............................................................................................................. 13 Table 5: ADF permanent force enlistments (all modes of entry), by gender and rank group, 2013–14[1][2][3][4][5] ............................................................................................................. 16 Table 6: ADF permanent force ab initio enlistments, by gender and rank group, 2013–14[1][2][3][4][5] ....................................................................................................................... 16 Table 7: ADF permanent force prior service enlistments, by gender, mode of entry, and rank group, 2013–14[1][2][3][4][5] .......................................................................................... 18 Table 8: Recruitment of women initiatives, Army, 2013–14 ............................................. 20 Table 9: Recruitment of women initiatives, Air Force, 2013–14 ....................................... 20 Table 10: ADF permanent force promotions (number and proportion of women and men substantively promoted to each rank), 2013–14[1][2][5] ...................................................... 22 Table 11: Gender balance in key Defence decision-making bodies, 30 June 2014[1][2] ... 24 Table 12: Numbers and proportions of Navy members retained after taking paid maternity or parental leave in the 18 months to 30 June 2014 [1] .................................................... 25 Table 13: Numbers and proportions of Army members retained after taking paid maternity or parental leave in the 18 months to 30 June 2014 [1] .................................................... 25 Table 14: Numbers and proportions of Air Force members retained after taking paid maternity or parental leave in the 18 months to 30 June 2014 [1]..................................... 26 Table 15: Navy members retained after taking a career break of three months or more, 2013–14[1][2][3][4] ................................................................................................................ 27 Table 16: Army members retained after taking a career break of three months or more, 2013–14[1][2][3][4] ................................................................................................................ 27 Table 17: Air Force members retained after taking a career break of three months or more, 2013–14[1][2][3][4] ................................................................................................................ 28 Table 18: Gender pay gap in ADF—comparisons of average actual salary by service and rank, 30 June 2014[1][2][3][4][5] ............................................................................................. 30 Table 19: ADF permanent force 12-month rolling separation rates, by gender and rank group, 30 June 2014[1] ..................................................................................................... 33 Table 20: YourSay surveys (October 2013 and February 2014)—responses on ADF men’s and women’s experiences[1][2][3][4][5][6] ............................................................................... 35

Page 5 of 54
Table 21: 2013 YourSay Leaving Defence—top 10 reasons for ADF members leaving Defence [1]........................................................................................................................ 40 Table 22: Women’s Integrated Networking Group program............................................. 43 Table 23: Women’s Technical Network............................................................................ 44 Table 24: ADF education sponsorship, by service and gender, 2014.............................. 44 Table 25: YourSay surveys (October 2013 and February 2014)—responses on flexible work, by service and gender[1][2][3][4][5][6] ............................................................................ 45 Table 26: Navy shore-based members engaged in enduring Flexible Work Arrangements, by type, 2013–14 ............................................................................................................. 47 Table 27: Navy shore-based members engaged in enduring Flexible Work Arrangements, by gender, 2013–14......................................................................................................... 47 Table 28: Flexible Work Arrangement Occurrences in the Army, 2013–14 ..................... 48 Table 29: Flexible Work Arrangement occurrences in the Air Force, 2013–14................ 49 Table 30: Navy officer staff college attendance and command appointments, 2013–14[1]49 Table 31: Navy other ranks promotional gateway to Petty Officer (Navy Sergeant equivalent), 2013–14 ....................................................................................................... 50 Table 32: Army officer staff college attendance and command appointments, 2013–14[1][2][3]............................................................................................................................. 50 Table 33: Army other ranks promotional gateways to rank of Sergeant, 2013–14[1][2] ..... 50 Table 34: Air Force officer staff college attendance and command appointments, 2013–14[1][2][3][4][5] ....................................................................................................................... 51 Table 35: Air Force other ranks promotional gateways to rank of Sergeant, 2013–14[1][2] 51 Table 36: Army officer women and men on Flexible Work Arrangements, 2012–14 ....... 53 Table 37: Army other ranks women and men on Flexible Work Arrangements, 2013–14 54 Table 38: Air Force officer women and men on Flexible Work Arrangements, 2013–14 . 54 Table 39: Air Force other ranks women and men on Flexible Work Arrangements, 2013–14..................................................................................................................................... 54

Page 6 of 54
Women in the ADF The review into the treatment of women in the Australian Defence Force—phase 2 report, by Sex Discrimination Commissioner Elizabeth Broderick, identified a strong capability imperative to improve the treatment of women in the ADF and to enhance their career opportunities. Defence is committed to a range of strategies and targets required to achieve the recommendations of the Broderick review.
Recommendation 3 of the review was the publication of a Women in the ADF report, as a supplement to the Defence annual report, to include information in the broad areas of:
women’s participation
women’s experience
access to flexible work
sexual harassment and abuse.
In addition to addressing the requirements of recommendation 3, the Women in the ADF report is also the vehicle for service reporting against recommendation 6 (promotional gateways), recommendation 9 (recruitment targets for women) and recommendation 13 (flexible work targets).
The inaugural Women in the ADF report was published as an online supplement to the Defence Annual Report 2012–13 and provided a baseline for future reporting on women’s participation and experience in the ADF. This second report incorporates feedback from the Australian Human Rights Commission’s 2014 Audit Report to include changes such as the addition of more discussion and analysis of data, and making the report more suited to a general public audience. The report’s fourth element—sexual harassment and abuse—now has its own dedicated report as an online supplement separate from the Women in the ADF report, reflecting its relevance to both women and men in the ADF.
The 2013–14 Women in the ADF report capitalises on the baseline collected for the previous year’s report, comparing past and current data. This facilitates a quantitative assessment of the progress that Defence’s cultural reform efforts have achieved. While cultural reform takes time, this comparison shows that considerable gains were made in 2013–14. The proportion of women in the ADF has increased, women are more likely to access flexible work, and ADF members—particularly women—have become much more positive about Pathway to Change, indicating that they can see cultural change occurring, and can see how Defence will benefit from it.
These improvements indicate the success of the implementation of Broderick’s recommendations, and of the broader Pathway to Change strategy. They also reinforce the need for Defence to remain committed to cultural reform and to continue to make further progress. Defence will produce a Women in the ADF report each year to enable an accurate measurement of progress in women’s employment and experience, identify areas of concern and highlight successful initiatives across the three services.
Women’s participation
Gender diversity brings tangible benefits to organisations as they access a wider talent pool and reflect the community.1 Furthermore, a greater representation of women in senior management improves organisational performance and brings a diversity of thought to decision making.2 The Review into the Treatment of Women in the Australian Defence
1 Catalyst, 2004, The bottom line: Connecting corporate performance and gender diversity. 2 Catalyst, 2011, The bottom line: Connecting corporate performance and women’s representation on boards.

Page 7 of 54
Force3 further outlines that increased participation of women is imperative at all levels for Defence to attract the best talent, increase capability, be a first class and high-performing employer, and take a leadership position as one of Australia’s largest employers.
This section analyses various aspects of women’s participation, including current workforce participation at different ranks and gender differences in pay at those ranks; recruitment, separations and promotions; and enabling factors such as mentoring, sponsorship, and continuing employment after maternity leave.
The tables begin by showing the number and proportion of women and men in the ADF workforce by rank, employment location and occupational group.
3 Australian Human Rights Commission 2012, Review into the Treatment of Women in the Australian Defence Force—Phase 2 Report, Sydney.

Page 8 of 54
Table 1: ADF permanent force, by gender and rank, 30 June 2014[1][8][9][10][11]
2013-14 Women % Δ Men % Women % Δ Men % Women % Δ Men % Women % Δ Men %
Officers[2]
General (E) (O10) 0 0 0.0% 0 0 0 0.0% 0.0% 1 100.0% 0 0 0.0% 0 0 0 0.0% 0.0% 1 100.0%Lieutenant General (E) (O09) 0 0.0% 0.0% 4 100.0% 0 0.0% 0.0% 3 100.0% 0 0.0% 0.0% 2 100.0% 0 0.0% 0.0% 9 100.0%Major General (E) (O08) 1 6.3% -0.4% 15 93.8% 1 5.9% 5.9% 16 94.1% 0 0.0% 0.0% 10 100.0% 2 4.7% 2.2% 41 95.3%Brigadier (E) (O07) 1 2.6% 0.0% 38 97.4% 6 10.3% -0.6% 52 89.7% 4 10.0% 3.2% 36 90.0% 11 8.0% 0.8% 126 92.0%Colonel (E) (O06) 18 16.2% 2.5% 93 83.8% 18 10.5% 1.4% 153 89.5% 17 11.6% 1.3% 130 88.4% 53 12.4% 1.6% 376 87.6%
Sub-total ADF Senior Leaders[3] 20 11.8% 1.4% 150 88.2% 25 10.0% 1.2% 225 90.0% 21 10.6% 1.6% 178 89.4% 66 10.7% 1.4% 553 89.3%Lieutenant Colonel (E) (O05) 47 11.9% 0.1% 347 88.1% 78 12.5% 1.5% 547 87.5% 69 14.1% 0.5% 420 85.9% 194 12.9% 0.8% 1,314 87.1%
Sub-total Pipeline for ADF Senior Leaders[4] 47 11.9% 0.1% 347 88.1% 78 12.5% 1.5% 547 87.5% 69 14.1% 0.5% 420 85.9% 194 12.9% 0.8% 1,314 87.1%Major (E) (O04) 146 19.4% 0.8% 605 80.6% 267 15.0% 0.5% 1,514 85.0% 218 19.4% 1.2% 906 80.6% 631 17.3% 0.7% 3,025 82.7%Captain (E) (O03) 278 22.1% -0.4% 982 77.9% 281 15.0% 0.0% 1,593 85.0% 374 21.3% 0.5% 1,380 78.7% 933 19.1% 0.1% 3,955 80.9%Lieutenant (E) (O02) 71 22.5% -0.7% 244 77.5% 219 21.4% 2.0% 803 78.6% 177 27.7% 0.8% 463 72.3% 467 23.6% 1.2% 1,510 76.4%Second Lieutenant (E) (O01) 8 17.0% -6.2% 39 83.0% 1 50.0% 50.0% 1 50.0% 47 18.7% -1.3% 205 81.3% 56 18.6% -2.0% 245 81.4%Officer Cadet (E) (O00) 80 22.6% -0.7% 274 77.4% 128 16.1% -0.5% 668 83.9% 97 22.7% 1.7% 330 77.3% 305 19.3% 0.1% 1,272 80.7%Total Officers 650 19.8% -0.1% 2,641 80.2% 999 15.7% 0.6% 5,351 84.3% 1,003 20.5% 0.8% 3,882 79.5% 2,652 18.3% 0.5% 11,874 81.7%
Other Ranks[2]
Warrant Officer Class 1 (E) (E10 and E09)[5]14 6.6% 0.2% 198 93.4% 66 9.9% 0.4% 600 90.1% 43 7.9% 0.4% 500 92.1% 123 8.7% 0.3% 1,298 91.3%
Warrant Officer Class 2 (E) (E08)/Staff Sergeant (E07) 88 9.2% -0.2% 873 90.8% 193 9.6% 0.3% 1,816 90.4% 117 15.3% 0.5% 649 84.7% 398 10.7% 0.2% 3,338 89.3%Sergeant (E) (E06) 178 12.7% 0.2% 1,227 87.3% 296 11.3% 0.0% 2,332 88.7% 252 15.4% -0.4% 1,384 84.6% 726 12.8% -0.1% 4,943 87.2%Corporal (E) (E05)/Lance Corporal (E04)[6]
477 20.3% 0.2% 1,868 79.7% 640 12.0% 0.1% 4,693 88.0% 413 17.1% 1.2% 2,006 82.9% 1,530 15.2% 0.5% 8,567 84.8%Private Proficient (E) (E03) 790 20.3% -0.2% 3,104 79.7% 577 7.9% 0.5% 6,702 92.1% 514 17.6% 0.2% 2,405 82.4% 1,881 13.3% 0.3% 12,211 86.7%Private (E) (E02) 160 21.6% 2.4% 582 78.4% 245 13.2% 3.7% 1,617 86.8% 100 22.2% 1.0% 351 77.8% 505 16.5% 3.0% 2,550 83.5%Private Trainee(E) (E01 and E51)[7]
123 18.6% -0.6% 539 81.4% 237 11.9% 2.1% 1,754 88.1% 100 23.1% 1.7% 332 76.9% 460 14.9% 1.4% 2,625 85.1%Private Recruit (E) (E00) 81 32.5% 10.4% 168 67.5% 169 18.2% 0.4% 758 81.8% 43 24.0% 2.3% 136 76.0% 293 21.6% 2.3% 1,062 78.4%Total Other Ranks 1,911 18.3% 0.3% 8,559 81.7% 2,423 10.7% 0.9% 20,272 89.3% 1,582 16.9% 0.6% 7,763 83.1% 5,916 13.9% 0.7% 36,594 86.1%Total ADF Permanent 2,561 18.6% 0.2% 11,200 81.4% 3,422 11.8% 0.8% 25,623 88.2% 2,585 18.2% 0.7% 11,645 81.8% 8,568 15.0% 0.6% 48,468 85.0%
Navy Army Air Force ADF
Source: Defence HR system Notes 1. Figures in this table are based on the ADF permanent force (substantive headcount) at 30 June 2014. 2. The Army rank descriptions with an (E) following them also refer to the equivalent rank in the Navy and Air Force. 3. For the purposes of this report, ADF senior leaders refer to those with ranks of Colonel (E) and above. 4. In this report, the pipeline for senior leadership roles includes those members at Lieutenant Colonel (E) level. 5. Warrant Officer Class 1 figures include Warrant Officer—Navy, Regimental Sergeant Major—Army (E10) and Warrant Officer—Air Force. 6. E04 is an Army-only rank. 7. The Air Force rank of Non-Commissioned Officer Cadet (E51) is included with Private Trainee (E) figures, and includes 2 women and 21 men. 8. Delta (Δ) figures show the difference in percentages of women from 30 June 2014 and 30 June 2013. 9. Cells highlighted in green indicate that the 2013–14 percentage of women was at least 5 per cent greater than the 2012–13 percentage of women. 10. Cells highlighted in red indicate that the 2013–14 percentage of women was at least 5 per cent less than the 2012–13 percentage of women. 11. Percentages may not sum due to rounding.

Page 9 of 54
Figure 1: Percentage of women at each officer rank, by service, 30 June 2014
Navy officers
22.6%
17.0%
22.5%
22.1%
19.4%
11.9%
16.2%
2.6%
6.3%
0.0%
0.0%
0.0% 10.0% 20.0%
MIDN
ASLT
SBLT
LEUT
LCDR
CMDR
CAPT
CDRE
RADM
VADM
ADML
% Women
Army officers
16.1%
21.4%
15.0%
15.0%
12.5%
10.5%
10.3%
5.9%
0.0%
0.0%
0.0% 10.0% 20.0%
OCDT
LT
CAPT
MAJ
LTCOL
COL
BRIG
MAJGEN
LTGEN
GEN
% Women
Air Force officers
22.7%
18.7%
27.7%
21.3%
19.4%
14.1%
11.6%
10.0%
0.0%
0.0%
0.0%
0.0% 10.0% 20.0% 30.0%
OFFCDT
PLTOFF
FLGOFF
FLTLT
SQNLDR
WGCDR
GPCAPT
AIRCDRE
AVM
AIRMSHL
ACM
% Women
Figure 1 shows the proportion of women throughout the ADF officer workforce. The Navy has a comparatively strong proportion of women in the junior officer ranks; however, that proportion declines at the Commander level and again at the Commodore level. The proportion of 6.3 per cent at Rear Admiral represents one woman in a total of 16 permanent two-star positions. The most notable change over the past year was the increase in the proportion of female Captains from 13.7 per cent to 16.2 per cent. The proportion of female Acting Sub Lieutenants decreased; however, this reflected a difference of only eight women in the small group at this rank.
While the junior officer ranks of the Army have a smaller proportion of women than the Navy and the Air Force, Figure 1 shows that the Army is relatively successful in retaining women’s representation with increasing rank. In 2013–14, the Army promoted a woman to Major General, raising the proportion of female two-stars to 5.9 per cent. There were also small increases in the proportion of women at Lieutenant, Major, Lieutenant Colonel and Colonel ranks. The rank of Second Lieutenant has not been included in this chart, as that rank is not commonly used; there are only two Army members at that rank.
The rank of Air Force Flying Officer has the highest proportion of women throughout the Services, at 27.7 per cent. This proportion steadily declines with each increase in rank; however, in 2013–14 there was an increase in the number of women in higher ranks. The proportion of female Air Commodores increased from 6.8 per cent to 10.0 per cent, and there were incremental increases in the proportion of women at the ranks of Officer Cadet, Flying Officer, Flight Lieutenant, Squadron Leader, Wing Commander and Group Captain.
After a concerted effort to improve the participation and advancement of women throughout the ADF, the proportion of female officers increased from 17.8 per cent in 2012–13 to 18.3 per cent in 2013–14. The proportion of female officers in the senior leadership group rose from 9.3 per cent to 10.7 per cent.

Page 10 of 54
Figure 2: Percentage of women at each other rank, by service, 30 June 2014
Navy other ranks
32.5%
18.6%
21.6%
20.3%
20.3%
12.7%
9.2%
6.6%
0% 10% 20% 30%
REC
SMN*
SMN
AB
LS
PO
CPO
WO
% Women
Army other ranks
18.2%
11.9%
13.2%
7.9%
12.0%
11.3%
9.6%
9.9%
0.0% 10.0% 20.0%
REC
PTE TRN
PTE
PTE P
CPL/LCPL
SGT
WO2/SSGT
WO1
% Women
Air Force other ranks
24.0%
23.1%
22.2%
17.6%
17.1%
15.4%
15.3%
7.9%
0.0% 10.0% 20.0% 30.0%
REC
AC/W TRN
AC/W
LAC/W
CPL
SGT
FSGT
WOFF
% Women
Figure 2 shows the proportions of women at each of the other ranks throughout the ADF. The Navy has a comparatively strong representation of female Able Seamen and Leading Seamen; then, mirroring the pattern for Navy officers, there is a decline moving into the Senior Non-Commissioned Officer (NCO) ranks. By far the biggest change in 2013–14 from the previous year for female Navy other ranks was the proportion of female recruits. The Navy Recruitment of Women Scheme has had clear success: the proportion of women at the rank of Recruit rose from 22.1 per cent to 32.5 per cent over the past year.
While the Army’s other ranks hold the lowest proportion of women throughout the ADF (10.7 per cent), the Army has less variation in the proportion of women throughout its other ranks, resulting in a relatively flat rank profile. There have been increases in the proportions of women at the Private Trainee, Private, and Private Proficient ranks, indicating that more female recruits are successfully moving through initial training and through their initial employment. This is likely to be due to targeted programs to assist female recruits, such as the Army Preconditioning Course, which prepares women for the physical challenges of initial training that often impede their progress.
The Air Force does not show a similar reduction in the proportion of women moving from recruit to Aircraftman/Aircraftwoman Trainee, but has only a small decrease in the proportion, from 24.0 per cent to 22.2 per cent. The proportion of women decreases at Leading Aircraftman/Aircraftwoman and at Warrant Officer. The Air Force has had improvements throughout its other ranks in women’s participation, most notably increasing at the recruit (21.7 per cent to 24.0 per cent) and Corporal (15.8 per cent to 17.1 per cent) levels. The Air Force has been targeting women’s participation through several schemes addressing recruitment, retention and advancement.
Throughout the ADF for all rank groups, the proportion of women at each rank has increased, which has contributed to the overall rise in the proportion of women from 14.4 per cent at 30 June 2013 to 15.0 per cent at 30 June 2014. This reflects a net increase of 482 women.
Page 11 of 54
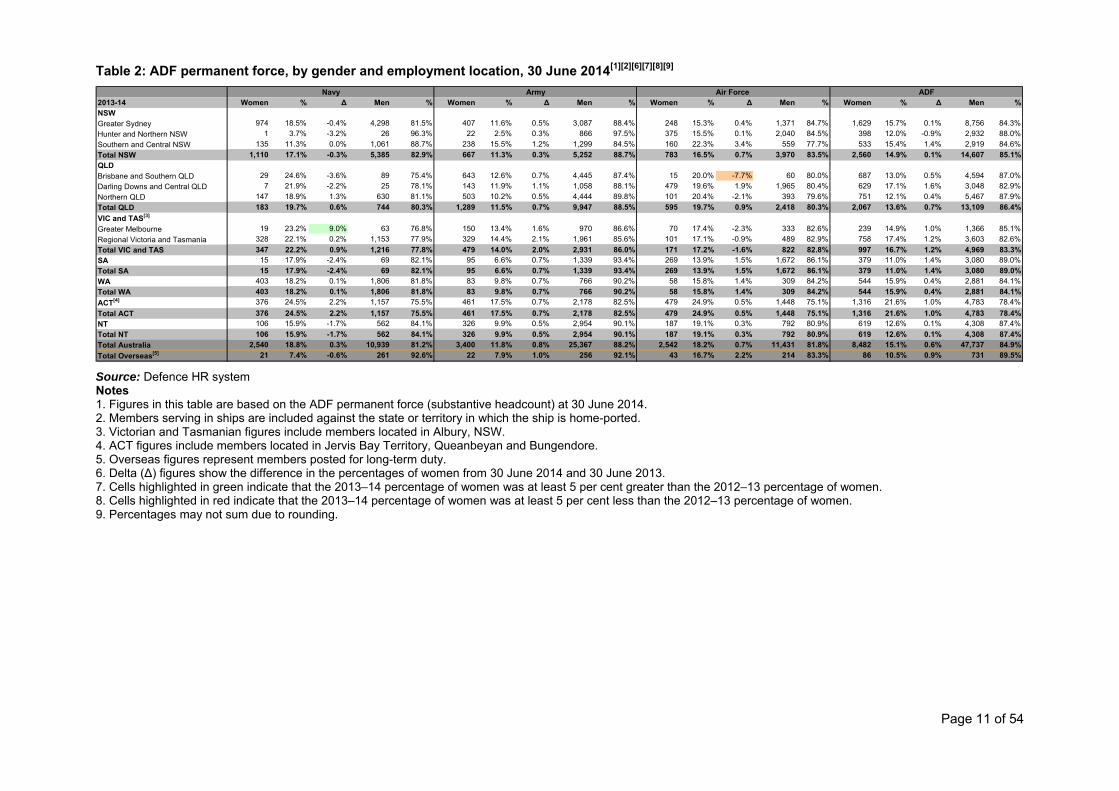
Table 2: ADF permanent force, by gender and employment location, 30 June 2014[1][2][6][7][8][9]
2013-14 Women % Δ Men % Women % Δ Men % Women % Δ Men % Women % Δ Men %NSWGreater Sydney 974 18.5% -0.4% 4,298 81.5% 407 11.6% 0.5% 3,087 88.4% 248 15.3% 0.4% 1,371 84.7% 1,629 15.7% 0.1% 8,756 84.3%
Hunter and Northern NSW 1 3.7% -3.2% 26 96.3% 22 2.5% 0.3% 866 97.5% 375 15.5% 0.1% 2,040 84.5% 398 12.0% -0.9% 2,932 88.0%
Southern and Central NSW 135 11.3% 0.0% 1,061 88.7% 238 15.5% 1.2% 1,299 84.5% 160 22.3% 3.4% 559 77.7% 533 15.4% 1.4% 2,919 84.6%
Total NSW 1,110 17.1% -0.3% 5,385 82.9% 667 11.3% 0.3% 5,252 88.7% 783 16.5% 0.7% 3,970 83.5% 2,560 14.9% 0.1% 14,607 85.1%
QLDBrisbane and Southern QLD 29 24.6% -3.6% 89 75.4% 643 12.6% 0.7% 4,445 87.4% 15 20.0% -7.7% 60 80.0% 687 13.0% 0.5% 4,594 87.0%
Darling Downs and Central QLD 7 21.9% -2.2% 25 78.1% 143 11.9% 1.1% 1,058 88.1% 479 19.6% 1.9% 1,965 80.4% 629 17.1% 1.6% 3,048 82.9%
Northern QLD 147 18.9% 1.3% 630 81.1% 503 10.2% 0.5% 4,444 89.8% 101 20.4% -2.1% 393 79.6% 751 12.1% 0.4% 5,467 87.9%
Total QLD 183 19.7% 0.6% 744 80.3% 1,289 11.5% 0.7% 9,947 88.5% 595 19.7% 0.9% 2,418 80.3% 2,067 13.6% 0.7% 13,109 86.4%
VIC and TAS[3]
Greater Melbourne 19 23.2% 9.0% 63 76.8% 150 13.4% 1.6% 970 86.6% 70 17.4% -2.3% 333 82.6% 239 14.9% 1.0% 1,366 85.1%
Regional Victoria and Tasmania 328 22.1% 0.2% 1,153 77.9% 329 14.4% 2.1% 1,961 85.6% 101 17.1% -0.9% 489 82.9% 758 17.4% 1.2% 3,603 82.6%
Total VIC and TAS 347 22.2% 0.9% 1,216 77.8% 479 14.0% 2.0% 2,931 86.0% 171 17.2% -1.6% 822 82.8% 997 16.7% 1.2% 4,969 83.3%
SA 15 17.9% -2.4% 69 82.1% 95 6.6% 0.7% 1,339 93.4% 269 13.9% 1.5% 1,672 86.1% 379 11.0% 1.4% 3,080 89.0%
Total SA 15 17.9% -2.4% 69 82.1% 95 6.6% 0.7% 1,339 93.4% 269 13.9% 1.5% 1,672 86.1% 379 11.0% 1.4% 3,080 89.0%
WA 403 18.2% 0.1% 1,806 81.8% 83 9.8% 0.7% 766 90.2% 58 15.8% 1.4% 309 84.2% 544 15.9% 0.4% 2,881 84.1%
Total WA 403 18.2% 0.1% 1,806 81.8% 83 9.8% 0.7% 766 90.2% 58 15.8% 1.4% 309 84.2% 544 15.9% 0.4% 2,881 84.1%
ACT[4] 376 24.5% 2.2% 1,157 75.5% 461 17.5% 0.7% 2,178 82.5% 479 24.9% 0.5% 1,448 75.1% 1,316 21.6% 1.0% 4,783 78.4%
Total ACT 376 24.5% 2.2% 1,157 75.5% 461 17.5% 0.7% 2,178 82.5% 479 24.9% 0.5% 1,448 75.1% 1,316 21.6% 1.0% 4,783 78.4%
NT 106 15.9% -1.7% 562 84.1% 326 9.9% 0.5% 2,954 90.1% 187 19.1% 0.3% 792 80.9% 619 12.6% 0.1% 4,308 87.4%
Total NT 106 15.9% -1.7% 562 84.1% 326 9.9% 0.5% 2,954 90.1% 187 19.1% 0.3% 792 80.9% 619 12.6% 0.1% 4,308 87.4%
Total Australia 2,540 18.8% 0.3% 10,939 81.2% 3,400 11.8% 0.8% 25,367 88.2% 2,542 18.2% 0.7% 11,431 81.8% 8,482 15.1% 0.6% 47,737 84.9%
Total Overseas[5] 21 7.4% -0.6% 261 92.6% 22 7.9% 1.0% 256 92.1% 43 16.7% 2.2% 214 83.3% 86 10.5% 0.9% 731 89.5%
Navy Army Air Force ADF
Source: Defence HR system Notes 1. Figures in this table are based on the ADF permanent force (substantive headcount) at 30 June 2014. 2. Members serving in ships are included against the state or territory in which the ship is home-ported. 3. Victorian and Tasmanian figures include members located in Albury, NSW. 4. ACT figures include members located in Jervis Bay Territory, Queanbeyan and Bungendore. 5. Overseas figures represent members posted for long-term duty. 6. Delta (Δ) figures show the difference in the percentages of women from 30 June 2014 and 30 June 2013. 7. Cells highlighted in green indicate that the 2013–14 percentage of women was at least 5 per cent greater than the 2012–13 percentage of women. 8. Cells highlighted in red indicate that the 2013–14 percentage of women was at least 5 per cent less than the 2012–13 percentage of women. 9. Percentages may not sum due to rounding.

Page 12 of 54
Figure 3: Percentage of ADF women in each state and territory, 30 June 2014
Western Australia
15.9% women
Northern Territory
12.6% women Queensland
13.6% women
South Australia
11.0% women
New South Wales
14.9% women
Victoria and Tasmania
16.7% women
Australian Capital Territory
21.6% women
Figure 3 shows the proportion of women in the permanent ADF in each state or territory at the end of 2013–14. While there was some variation, the ACT had by far the highest proportion of women. This was most likely influenced by the higher proportion of office-based work in the ADF headquarters offices and the lower proportion of combat-related roles in the ACT compared with the rest of the country. There was also a higher proportion of officers in the ACT compared with the other states and territories, and there was a higher proportion of women in the officer ranks compared with the other ranks. While there was little change in these figures over 2013–14, there were small increases in female participation rates in the ACT. This reflects the increases in female participation in the wider ADF. The proportions of women in each state and territory are perhaps most influenced by the main bases in the particular jurisdiction. There are several bases and establishments in each state, as well as offices in capital cities’ central business districts. Table 3 summarises the main bases and the service of the main base population.
Table 3: Key bases in each Australian state and territory, by service
Navy Army Air Force Tri-Service
New South Wales Garden Island Precinct
HMAS Albatross
Holsworthy Barracks
Blamey Barracks Kapooka
RAAF Williamtown
RAAF Richmond
Queensland HMAS Cairns Lavarack Barracks
Enoggera Barracks
RAAF Amberley
RAAF Townsville
Victoria and Tasmania
HMAS Cerberus Simpson Barracks
Puckapunyal Military Area
Gaza Ridge Barracks
RAAF Williams
RAAF East Sale
Angelsea Barracks
South Australia RAAF Edinburgh
Keswick Barracks
RAAF Edinburgh
Western Australia HMAS Stirling Irwin Barracks, Karrakatta RAAF Pearce
Australian Capital Territory
HMAS Harman—Navy Royal Military College of Australia Duntroon
Russell Offices
Northern Territory Darwin Fleet Base North Robertson Barracks
Larrakeyah Barracks
RAAF Darwin
RAAF Tindal

Page 13 of 54
Table 4: ADF permanent force, by gender, occupational group and rank group, 30 June 2014[1][2][3][4][5][6][7]
2013-14 Women % Δ Men % Women % Δ Men % Women % Δ Men % Women % Δ Men %AviationOfficers 17 5.3% 0.2% 302 94.7% 21 5.1% 1.0% 390 94.9% 186 9.4% 0.4% 1,783 90.6% 224 8.3% 0.5% 2,475 91.7%
Other Ranks 5 4.5% -1.7% 107 95.5% 37 10.9% 1.0% 302 89.1% 58 33.3% -0.8% 116 66.7% 100 16.0% -0.7% 525 84.0%
Total Aviation 22 5.1% -0.2% 409 94.9% 58 7.7% 1.1% 692 92.3% 244 11.4% 0.2% 1,899 88.6% 324 9.7% 0.3% 3,000 90.3%
Combat and SecurityOfficers 263 18.9% -0.2% 1,128 81.1% 30 2.0% 0.5% 1,476 98.0% 6 5.8% 1.0% 97 94.2% 299 10.0% 0.3% 2,701 90.0%
Other Ranks 390 15.6% 0.8% 2,116 84.4% 91 1.2% 0.1% 7,612 98.8% 99 9.9% 1.9% 906 90.1% 580 5.2% 0.4% 10,634 94.8%
Total Combat and Security 653 16.8% 0.5% 3,244 83.2% 121 1.3% 0.2% 9,088 98.7% 105 9.5% 1.8% 1,003 90.5% 879 6.2% 0.4% 13,335 93.8%
Communications, Intelligence and SurveillanceOfficers 19 25.7% 0.7% 55 74.3% 134 19.1% 0.1% 568 80.9% 65 32.3% -0.1% 136 67.7% 218 22.3% 0.4% 759 77.7%
Other Ranks 476 30.9% -1.2% 1,064 69.1% 252 12.3% 0.5% 1,796 87.7% 282 22.3% -1.4% 983 77.7% 1,010 20.8% -0.6% 3,843 79.2%
Total Communications, Intelligence and Surveillance 495 30.7% -1.0% 1,119 69.3% 386 14.0% 0.3% 2,364 86.0% 347 23.7% -1.0% 1,119 76.3% 1,228 21.1% -0.4% 4,602 78.9%
Engineering, Technical and ConstructionOfficers 78 10.3% 0.2% 676 89.7% 88 8.5% 0.2% 950 91.5% 117 9.7% 0.2% 1,088 90.3% 283 9.4% 0.2% 2,714 90.6%
Other Ranks 255 5.8% 0.0% 4,149 94.2% 95 1.8% 0.2% 5,281 98.2% 144 3.1% 0.4% 4,526 96.9% 494 3.4% 0.2% 13,956 96.6%
Total Engineering, Technical and Construction 333 6.5% 0.1% 4,825 93.5% 183 2.9% 0.2% 6,231 97.1% 261 4.4% 0.3% 5,614 95.6% 777 4.5% 0.3% 16,670 95.5%
HealthOfficers 70 43.2% -1.5% 92 56.8% 294 45.4% -0.2% 354 54.6% 214 60.6% -0.8% 139 39.4% 578 49.7% -0.4% 585 50.3%
Other Ranks 175 50.1% 2.6% 174 49.9% 354 40.0% 3.0% 530 60.0% 123 52.6% -0.4% 111 47.4% 652 44.4% 2.4% 815 55.6%
Total Health 245 47.9% 1.3% 266 52.1% 648 42.3% 1.6% 884 57.7% 337 57.4% -0.6% 250 42.6% 1,230 46.8% 1.2% 1,400 53.2%
Logistics, Administration and SupportOfficers 203 37.9% 0.9% 332 62.1% 298 25.2% 1.6% 884 74.8% 412 41.0% 0.9% 593 59.0% 913 33.5% 1.2% 1,809 66.5%
Other Ranks 610 39.2% 1.2% 948 60.8% 1,594 25.1% 2.1% 4,748 74.9% 876 43.9% 0.7% 1,120 56.1% 3,080 31.1% 1.7% 6,816 68.9%
Total Logistics, Administration and Support 813 38.8% 1.0% 1,280 61.2% 1,892 25.1% 2.0% 5,632 74.9% 1,288 42.9% 0.7% 1,713 57.1% 3,993 31.6% 1.6% 8,625 68.4%
Not Allocated to Occupational GroupSenior Officers 0 0.0% - 56 100.0% 8 0.0% - 72 90.0% 3 0.0% - 46 93.9% 11 5.9% - 174 94.1%
Warrant Officer of the Service 0 0.0% - 1 100.0% 0 0.0% - 1 100.0% 0 0.0% - 1 100.0% 0 0.0% - 3 100.0%
Unallocated Trainees 0 0.0% - 0 - 126 0.0% - 659 83.9% 0 0.0% - 0 - 126 16.1% - 659 83.9%
Total Not Allocated to Occupational Group 0 0.0% - 57 100.0% 134 15.5% - 732 84.5% 3 6.0% - 47 94.0% 137 14.1% - 836 85.9%
Total ADF Permanent 2,561 18.6% 0.2% 11,200 81.4% 3,422 11.8% 0.8% 25,623 88.2% 2,585 18.2% 0.7% 11,645 81.8% 8,568 15.0% 0.6% 48,468 85.0%
Navy Army Air Force ADF
Source: Defence HR system Notes 1. Figures are based on the ADF permanent force substantive headcount at 30 June 2014. 2. Delta (Δ) figures show the difference in the percentages of women from 30 June 2014 and 30 June 2013. 3. Cells highlighted in green indicate that the 2013–14 percentage of women was at least 5 per cent greater than the 2012–13 percentage of women. 4. Cells highlighted in red indicate that the 2013–14 percentage of women was at least 5 per cent less than the 2012–13 percentage of women. 5. Deltas have not been calculated for category of ‘Not allocated to occupational group’, as they were categorised differently in 2012–13. 6. Percentages may not sum due to rounding. 7. Occupations in each occupational group are: Aviation: Air Combat Officer, Aircrew, Aviation Officer, Aviation Operations Manager, Crew Attendant, Groundcrewman, Joint Battlefield Airspace Control, Loadmaster,
Maritime Aviation Warfare Officer, Pilot, Aviation Instructors. Combat and security: Investigators, Air Base Protection, Airfield Defence Guards, Armoured Officer, Artillery, Combat Instructors, Cavalryman, Combat Controller,
Commando, Driver Armoured Fighting Vehicle, Emergency Responder, Firefighter, Ground Based Air Defence, Infantry Officer, Light Cavalry, Offensive Support, Surveillance and Target Acquisition, Military Police, Operator Radar, Patrolman, Rifleman, SAS Trooper, Security Police, Tank Crewman, Boatswain’s Mate, Clearance Diver, Combat Systems Operator, Maritime Geospatial Officer, Maritime Warfare Officer, Naval Police Coxswain, Principal Warfare Officer.
Communications, intelligence and surveillance: Acoustic Warfare Analyst, Air Intelligence Analyst, Air Surveillance Operator, Airborne Electronics Analyst, Analyst Intelligence Operations, Intelligence Instructor, Communications and Information Systems Controller, Communications Systems, Cryptologic Linguist, Electronic Warfare, Geospatial Imagery Intelligence Analyst, Geospatial Technician, Hydrographic Systems Operator, Imagery Specialist, Information Systems, Intelligence, Operator Unmanned Aerial System, Operator, Supervisor Communications.

Page 14 of 54
Engineering, technical and construction: Aeronautical Engineer, Air Technician, Aircraft Fitter, Aircraft Finisher, Airfield Engineer, Armament, Armament Engineer, Artificer, Engineering Instructor, Avionics, Bricklayer, Carpenter, Combat Engineer, Communication Electronic, Draftsman Architectural, Electrical and Mechanical Engineering Officer, Electrical Engineer, Electrician, Electronics Submariner, Engineer, Explosive Ordnance Disposal, Fitter Armament, Flight Engineer, General Hand, Ground Mechanical Engineering, Ground Support Engineering Manager, Ground Support Equipment, Manager Works, Marine Engineer, Marine Technician, Mechanic Recovery, Mechanic Vehicle, Metalsmith, Non-Destructive Inspection Technician, Plant Operator, Painter, Plumber, Technician Aircraft, Technician Avionics, Technician Electrical, Technician Electronic Systems, Telecommunications Systems, Weapons Electrical Aircraft Engineer, Weapons Electrical Engineer, Works Supervisor. Health: Allied Health Professional, Health Instructor, Combat Medical Attendant, Combat Paramedic, Dental Assistant, Dentist, Dental Technician, Environmental Health Officer, Examiner Psychological, Laboratory Technician, Medical Administration, Medical Assistant, Medical Officer, Medical Operator, Nurse, Operating Theatre Technician, Pharmacist, Physical Training Instructor, Physiotherapist, Preventive Medicine, Psychologist, Radiographer, Radiologist, Scientist. Logistics, administration and support: Air Dispatcher, Ammunition Supplier, Administration Assistant, Baker, Band Officer, Batman, Cargo Specialist, Catering Officer, Chaplain, Clerk, Storeman, Cook, Driver, Education Officer, Executive Warrant Officer, Handler Petroleum, Infantry Operations Clerk, Infantry Resource Storeman, Legal Officer, Logistics Officer, Management Executive, Marine Specialist, Maritime Logistics Personnel Operations, Maritime Logistics Chef, Maritime Logistics Officer, Maritime Logistics Steward, Maritime Logistics Supply Chain, Mess Operator, Motor Transport Driver, Movements, Multimedia Technician, Musician, Operator Admin, Operator Catering, Operator Movements, Operator Petroleum, Operator Supply, Operator Unit Supply, Ordnance Officer, Pay Officer, Personnel Capability Officer, Photographer Public Relations, Piper Drummer Bugler, Postal Clerk, Public Relations Officer, Reporter, Rigger Parachute, Supplier, Training Systems Officer, Transport Officer.

Page 15 of 54
Figure 4: Percentage of women in each occupational group, by service, 30 June 2014
Navy
5.1%
6.5%
16.8%
30.7%
38.8%
47.9%
0.0% 10.0% 20.0% 30.0% 40.0% 50.0%
Aviation
Eng, Tech & Const
Combat & Sec
Comms, Intel & Surv
Log, Admin & Support
Health
Army
7.7%
2.9%
1.3%
14.0%
25.1%
42.3%
0.0% 10.0% 20.0% 30.0% 40.0%
Aviation
Eng, Tech & Const
Combat & Sec
Comms, Intel & Surv
Log, Admin & Support
Health
Air Force
11.4%
4.4%
9.5%
23.7%
42.9%
57.4%
0.0% 10.0% 20.0% 30.0% 40.0% 50.0% 60.0%
Aviation
Eng, Tech & Const
Combat & Sec
Comms, Intel & Surv
Log, Admin & Support
Health
Figure 4 shows how gender representation differs in occupation groups, and how those differences are broadly consistent between the services. In each service, health and logistics, administration and support have the highest proportion of women, while the groups with the lowest proportion of women are combat and security; engineering, technical and construction; and aviation. These concentrations of women and men are closely aligned with traditional female and male work roles.
There have been small improvements in the proportion of women in traditionally male occupations. Defence leadership is committed to addressing occupational segregation in the ADF and has agreed to apply targets to employment groups with less than 15 per cent representation of women. The Navy is developing a model to achieve this aim, and has already set a 25 per cent female recruiting goal in occupational groups with less than 15 per cent of women. The Navy is also analysing workforce design to identify opportunities for greater flexibility in the timing of sea service employment obligations throughout Navy career profiles. Army’s strategy will begin by addressing the perception that any career in the Army is seen as a traditionally male occupation. As a first step, the Army will build up its female participation overall, and will then target specific occupations that have low female representation. The Army has several programs to address this, including the Women’s Networking Forum, the Enhanced Career Management Model and the removal of gender restrictions. The Air Force has had several programs aimed at improving women’s participation in non-traditional roles, such as recruiting targets and programs for pilots, and bolstering support for those women with tailored mentoring and networking programs.
Page 16 of 54
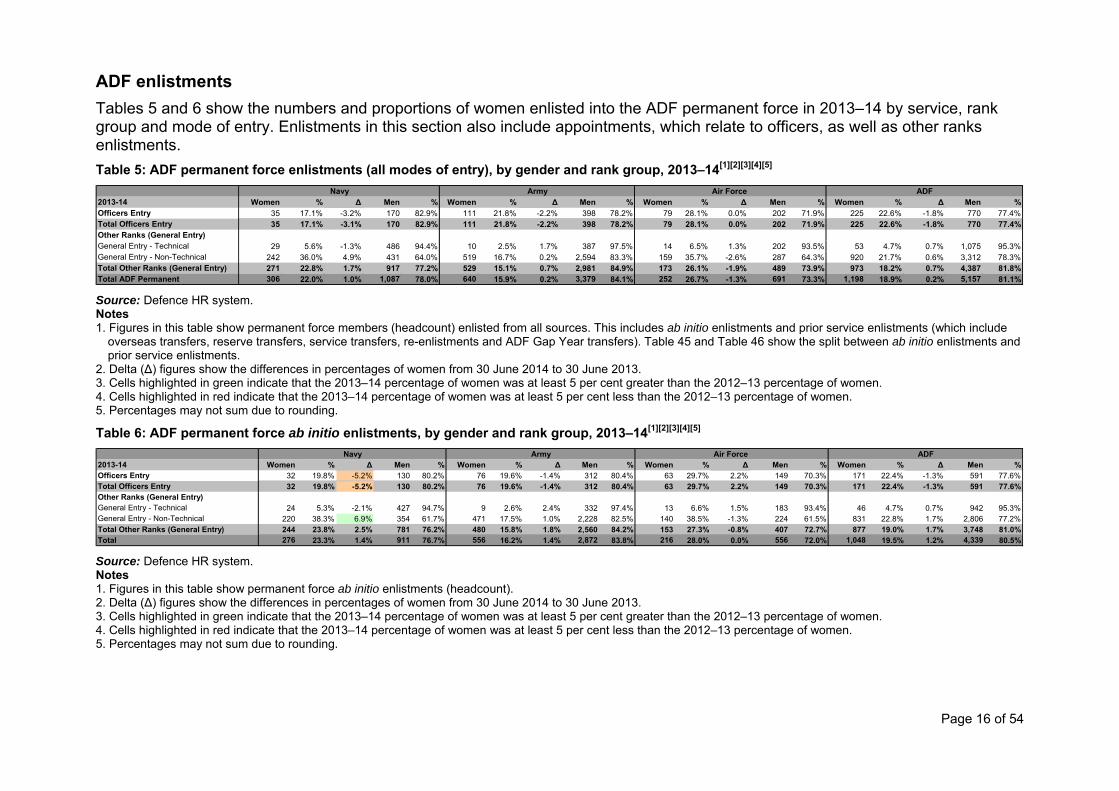
ADF enlistments
Tables 5 and 6 show the numbers and proportions of women enlisted into the ADF permanent force in 2013–14 by service, rank group and mode of entry. Enlistments in this section also include appointments, which relate to officers, as well as other ranks enlistments.
Table 5: ADF permanent force enlistments (all modes of entry), by gender and rank group, 2013–14[1][2][3][4][5]
2013-14 Women % Δ Men % Women % Δ Men % Women % Δ Men % Women % Δ Men %Officers Entry 35 17.1% -3.2% 170 82.9% 111 21.8% -2.2% 398 78.2% 79 28.1% 0.0% 202 71.9% 225 22.6% -1.8% 770 77.4%Total Officers Entry 35 17.1% -3.1% 170 82.9% 111 21.8% -2.2% 398 78.2% 79 28.1% 0.0% 202 71.9% 225 22.6% -1.8% 770 77.4%Other Ranks (General Entry)General Entry - Technical 29 5.6% -1.3% 486 94.4% 10 2.5% 1.7% 387 97.5% 14 6.5% 1.3% 202 93.5% 53 4.7% 0.7% 1,075 95.3%General Entry - Non-Technical 242 36.0% 4.9% 431 64.0% 519 16.7% 0.2% 2,594 83.3% 159 35.7% -2.6% 287 64.3% 920 21.7% 0.6% 3,312 78.3%Total Other Ranks (General Entry) 271 22.8% 1.7% 917 77.2% 529 15.1% 0.7% 2,981 84.9% 173 26.1% -1.9% 489 73.9% 973 18.2% 0.7% 4,387 81.8%Total ADF Permanent 306 22.0% 1.0% 1,087 78.0% 640 15.9% 0.2% 3,379 84.1% 252 26.7% -1.3% 691 73.3% 1,198 18.9% 0.2% 5,157 81.1%
Navy Army Air Force ADF
Source: Defence HR system. Notes 1. Figures in this table show permanent force members (headcount) enlisted from all sources. This includes ab initio enlistments and prior service enlistments (which include
overseas transfers, reserve transfers, service transfers, re-enlistments and ADF Gap Year transfers). Table 45 and Table 46 show the split between ab initio enlistments and prior service enlistments.
2. Delta (Δ) figures show the differences in percentages of women from 30 June 2014 to 30 June 2013. 3. Cells highlighted in green indicate that the 2013–14 percentage of women was at least 5 per cent greater than the 2012–13 percentage of women. 4. Cells highlighted in red indicate that the 2013–14 percentage of women was at least 5 per cent less than the 2012–13 percentage of women. 5. Percentages may not sum due to rounding.
Table 6: ADF permanent force ab initio enlistments, by gender and rank group, 2013–14[1][2][3][4][5]
2013-14 Women % Δ Men % Women % Δ Men % Women % Δ Men % Women % Δ Men %Officers Entry 32 19.8% -5.2% 130 80.2% 76 19.6% -1.4% 312 80.4% 63 29.7% 2.2% 149 70.3% 171 22.4% -1.3% 591 77.6%Total Officers Entry 32 19.8% -5.2% 130 80.2% 76 19.6% -1.4% 312 80.4% 63 29.7% 2.2% 149 70.3% 171 22.4% -1.3% 591 77.6%Other Ranks (General Entry)General Entry - Technical 24 5.3% -2.1% 427 94.7% 9 2.6% 2.4% 332 97.4% 13 6.6% 1.5% 183 93.4% 46 4.7% 0.7% 942 95.3%General Entry - Non-Technical 220 38.3% 6.9% 354 61.7% 471 17.5% 1.0% 2,228 82.5% 140 38.5% -1.3% 224 61.5% 831 22.8% 1.7% 2,806 77.2%Total Other Ranks (General Entry) 244 23.8% 2.5% 781 76.2% 480 15.8% 1.8% 2,560 84.2% 153 27.3% -0.8% 407 72.7% 877 19.0% 1.7% 3,748 81.0%Total 276 23.3% 1.4% 911 76.7% 556 16.2% 1.4% 2,872 83.8% 216 28.0% 0.0% 556 72.0% 1,048 19.5% 1.2% 4,339 80.5%
Navy Army Air Force ADF
Source: Defence HR system. Notes 1. Figures in this table show permanent force ab initio enlistments (headcount). 2. Delta (Δ) figures show the differences in percentages of women from 30 June 2014 to 30 June 2013. 3. Cells highlighted in green indicate that the 2013–14 percentage of women was at least 5 per cent greater than the 2012–13 percentage of women. 4. Cells highlighted in red indicate that the 2013–14 percentage of women was at least 5 per cent less than the 2012–13 percentage of women. 5. Percentages may not sum due to rounding.

Page 17 of 54
Figure 5: Percentage of female ADF permanent force enlistments, by type and service, 2013–14
17.1%
5.6%
36.0%
21.8%
2.5%
16.7%
28.1%
6.5%
35.7%
0%
10%
20%
30%
40%
50%
60%
70%
80%
90%
100%
Officers Entry General Entry - Technical General Entry - Non-Technical
Navy
Army
Air Force
Figure 5 shows the proportion of female permanent force enlistments who have entered as officers or who have enlisted through general entry for either technical or non-technical roles. Technical roles for general entry enlistees are the most challenging in recruiting women for all services. For the Navy and the Air Force, general entry for non-technical enlistments have a higher proportion of women than officer appointments; however, the opposite is true for the Army, where the proportion of women appointed as officers is higher than for non-technical general entry enlistments.
The proportion of women appointed as officers has decreased slightly for the Navy and the Army; however, the proportion of women enlisted to general entry non-technical roles has increased, particularly in the Navy and the Air Force. The proportion of women enlisted to technical general entry positions has decreased slightly for the Navy and increased slightly for the Army and the Air Force.
Figure 6: Percentage of female ADF permanent force ab initio enlistments, by type and service, 2013–14
19.8%
5.3%
38.3%
19.6%
2.6%
17.5%
29.7%
6.6%
38.5%
0%
10%
20%
30%
40%
50%
60%
70%
80%
90%
100%
Officers Entry General Entry - Technical General Entry - Non-Technical
Navy
Army
Air Force
Figure 6 shows the proportion of female ab initio enlistments by type of enlistment for each service. This involves recruits who have not had prior military service. Ab initio enlistments make up most of the total enlistments (5,387 out of 6,355), so the proportions of female ab initio enlistments are very similar to the proportions in the total enlistments. Compared with 2012–13, Navy ab initio figures changed: the proportion of female officer appointments decreased slightly, and the proportion of female non-technical general entry enlistments increased. There were no significant changes in the Army or the Air Force from 2012–13 to 2013–14.

Page 18 of 54
Table 7: ADF permanent force prior service enlistments, by gender, mode of entry, and rank group, 2013–14[1][2][3][4][5]
2013-14 Women % Δ Men % Women % Δ Men % Women % Δ Men % Women % Δ Men %OVERSEAS ENTRANTSOfficers 3 14.3% 14.3% 18 85.7% 3 9.7% -17.6% 28 90.3% 1 9.1% 9.1% 10 90.9% 7 11.1% -6.0% 56 88.9%Sub-total Officer Entry 3 14.3% 14.3% 18 85.7% 3 9.7% -17.6% 28 90.3% 1 9.1% 9.1% 10 90.9% 7 11.1% -6.0% 56 88.9%Other RanksGeneral Entry - Technical 1 3.7% -1.6% 26 96.3% 0 0.0% 0.0% 16 100.0% 0 0.0% 0.0% 0 0 1 2.3% -1.9% 42 97.7%General Entry - Non-Technical 0 0.0% 0.0% 17 100.0% 0 0.0% 0.0% 21 100.0% 0 0.0% 0.0% 0 0 0 0.0% 0.0% 38 100.0%Sub-total Other Ranks (General Entry) 1 2.3% -1.5% 43 97.7% 0 0.0% 0.0% 37 100.0% 0 0.0% 0.0% 0 0 1 1.2% -1.6% 80 98.8%
Total Overseas Entrants 4 6.2% 3.5% 61 93.8% 3 4.4% -14.4% 65 95.6% 1 9.1% 9.1% 10 90.9% 8 5.6% -4.3% 136 94.4%RESERVE TRANSFERSOfficers 0 0.0% -11.1% 13 100.0% 31 43.1% 6.3% 41 56.9% 9 22.0% -7.2% 32 78.0% 40 31.7% -0.4% 86 68.3%Sub-total Officer Entry 0 0.0% -11.1% 13 100.0% 31 43.1% 6.3% 41 56.9% 9 22.0% -7.2% 32 78.0% 40 31.7% -0.4% 86 68.3%Other RanksGeneral Entry - Technical 0 0.0% 0.0% 14 100.0% 1 3.6% 3.6% 27 96.4% 0 0.0% 0.0% 5 100.0% 1 2.1% 2.1% 46 97.9%General Entry - Non-Technical 10 25.0% -16.7% 30 75.0% 44 14.0% -4.0% 271 86.0% 9 29.0% -27.0% 22 71.0% 63 16.3% -6.7% 323 83.7%Sub-total Other Ranks (General Entry) 10 18.5% -8.5% 44 81.5% 45 13.1% -3.5% 298 86.9% 9 25.0% -21.7% 27 75.0% 64 14.8% -5.5% 369 85.2%Total Reserve transfers 10 14.9% -6.9% 57 85.1% 76 18.3% -3.5% 339 81.7% 18 23.4% -15.5% 59 76.6% 104 18.6% -5.1% 455 81.4%SERVICE TRANSFERSOfficers 0 0.0% -7.7% 7 100.0% 1 12.5% 3.4% 7 87.5% 3 30.0% 0.0% 7 70.0% 4 16.0% 1.3% 21 84.0%Sub-total Officer Entry 0 0.0% -7.7% 7 100.0% 1 12.5% 3.4% 7 87.5% 3 30.0% 0.0% 7 70.0% 4 16.0% 1.3% 21 84.0%Other RanksGeneral Entry - Technical 2 16.7% 16.7% 10 83.3% 0 0.0% -100.0% 3 100.0% 0 0.0% 0.0% 9 100.0% 2 8.3% 1.2% 22 91.7%General Entry - Non-Technical 5 21.7% 4.3% 18 78.3% 2 10.5% -2.5% 17 89.5% 5 25.0% 1.5% 15 75.0% 12 19.4% 1.9% 50 80.6%Sub-total Other Ranks (General Entry) 7 20.0% 6.2% 28 80.0% 2 9.1% -7.6% 20 90.9% 5 17.2% 0.5% 24 82.8% 14 16.3% 0.7% 72 83.7%Total Service Transfers 7 16.7% 4.8% 35 83.3% 3 10.0% -4.3% 27 90.0% 8 20.5% -0.1% 31 79.5% 18 16.2% 0.9% 93 83.8%RE-ENLISTMENTSOfficers 0 0.0% 0.0% 2 100.0% 0 0.0% -12.5% 10 100.0% 3 42.9% -7.1% 4 57.1% 3 15.8% -4.2% 16 84.2%Sub-total Officer Entry 0 0.0% 0.0% 2 100.0% 0 0.0% -12.5% 10 100.0% 3 42.9% -7.1% 4 57.1% 3 15.8% -4.2% 16 84.2%Other RanksGeneral Entry - Technical 2 18.2% 18.2% 9 81.8% 0 0.0% -25.0% 9 100.0% 1 16.7% 2.4% 5 83.3% 3 11.5% -2.8% 23 88.5%General Entry - Non-Technical 7 36.8% -2.1% 12 63.2% 2 3.4% -1.3% 57 96.6% 5 16.1% -5.5% 26 83.9% 14 12.8% -0.8% 95 87.2%Sub-total Other Ranks (General Entry) 9 30.0% -3.3% 21 70.0% 2 2.9% -2.7% 66 97.1% 6 16.2% -4.3% 31 83.8% 17 12.6% -1.0% 118 87.4%Total Re-enlistments 9 28.1% -1.1% 23 71.9% 2 2.6% -4.1% 76 97.4% 9 20.5% -3.5% 35 79.5% 20 13.0% -1.5% 134 87.0%ADF GAP YEAR TRANSFERSOfficers 0 0 0.0% 0 0 0 0 -50.0% 0 0 0 0 0.0% 0 0 0 0 -50.0% 0 0Sub-total Officer Entry 0 0.0% 0.0% 0 0.0% 0 0 -50.0% 0 0.0% 0 0 0.0% 0 0 0 0 -50.0% 0 0Other Ranks
General Entry - Technical 0 0 0.0% 0 0 0 0 0.0% 0 0 0 0 0.0% 0 0 0 0 0.0% 0 0General Entry - Non-Technical 0 0 0.0% 0 0 0 0 -35.3% 0 0 0 0 0.0% 0 0 0 0 -35.3% 0 0Sub-total Other Ranks (General Entry) 0 0 0.0% 0 0 0 0 -35.3% 0 0 0 0 0.0% 0 0 0 0 -35.3% 0 0Total ADF Gap Year Transfers 0 0 0.0% 0 0 0 0 -35.8% 0 0 0 0 0.0% 0 0 0 0 -35.8% 0 0Total Prior Service Entry 30 14.6% -1.2% 176 85.4% 84 14.2% -5.6% 507 85.8% 36 21.1% -7.5% 135 78.9% 150 15.5% -4.9% 818 84.5%
Navy Army Air Force ADF
Source: Defence HR system Notes 1. Figures in this table show permanent force prior service enlistments (headcount). 2. Delta (Δ) figures show the differences in percentages of women from 30 June 2014 to 30 June 2013. 3. Cells highlighted in green indicate that the 2013–14 percentage of women was at least 5 per cent greater than the 2012–13 percentage of women. 4. Cells highlighted in red indicate that the 2013–14 percentage of women was at least 5 per cent less than the 2012–13 percentage of women. 5. Percentages may not sum due to rounding.

Page 19 of 54
Figure 7: Percentage of women ADF permanent force prior service enlistments, by type and service, 2013–14
6.2%
14.9% 16.7%
28.1%
0.0%4.4%
18.3%
10.0%
2.6%0.0%
9.1%
23.4%20.5% 20.5%
0.0%0%
10%
20%
30%
40%
50%
60%
70%
80%
90%
100%
Overseas Entrants Reserve Transfers Service Transfers Re-Enlistments ADF Gap YearTransfers
Navy
Army
Air Force
Figure 7 shows the proportion of women enlisted to the ADF who had prior service. Prior service enlistees make up 15.2 per cent of total enlistees, and women with prior service make up 12.5 per cent of total female enlistees. The most common type of prior service is Reserve service (57.8 per cent of all prior service enlistments). This is especially true for women: 69.3 per cent of all female prior service enlistments transferred from the Reserves. Reserve transfers had the highest proportions of women for the Army and the Air Force, while the Navy had even higher female proportions in their transfers from other services and their re-enlistments.
The proportion of ADF Gap Year Programme transfers fell to zero, as the Gap Year Programme was not active in the previous year. A new Gap Year Programme was launched in 2014, with recruitment to start in January 2015, so this figure is expected to rise in future years. Other changes in proportions are influenced by the small numbers in each category, particularly by service. There was a small increase in the number of male overseas entrants and in male non-technical general entry Reserve transfers, which reduced women’s participation rates in those categories to a small extent at the ADF level.
Recruitment of women initiatives
Navy
The Navy has committed to increasing the number of women in employment categories in which women are currently under-represented. It is aiming to achieve this through a number of targeted recruiting initiatives, including:
the launch of the Women in Navy web pages (on the Defence jobs website)
the establishment of a specialist recruiting team (Women for Navy), specifically aimed at improving the recruitment of women and comprising one Lieutenant Commander and four women (Petty Officer/Leading Seaman) to be embedded in Brisbane, Parramatta, Melbourne and Perth recruiting offices
the establishment of recruiting goals within Defence Force Recruiting targets
a reduced initial minimum period of service for selected categories (to be implemented for other ranks enlistment to specified categories from January 2015)

Page 20 of 54
a new officer entry scheme that gives ADFA entry officers an opportunity to defer degree studies to expedite their achievement of professional qualifications (under development for ADFA officers).
Significantly increasing female recruiting is a key strategy for achieving the Navy’s goal of 25 per cent female participation by 2023. This target will be met by recruiting greater numbers of women into the areas where women are currently under-represented, including trades, engineering and aviation. The Navy Recruitment of Women Strategy employs a marketing campaign to highlight the lifestyle and opportunities open to women, and is aimed at improving women’s propensity to join the service. The female achievement rate in 2013–14 was 22.9 per cent overall (up 1.2 per cent from 2012–13), including officers at 20.1 per cent (down 1.1 per cent) and sailors at 23.4 per cent (up 1.5 per cent). Two hundred and twenty-one female sailors were recruited 2013–14 (an increase of 50 from 2012–13). Forty-one female officers were recruited in 2013–14 (an increase of 10 from 2012–13).
Army
Table 8: Recruitment of women initiatives, Army, 2013–14
Recruiting Initiative Women RecruitedRecruit to Area 8Reduced Initial Minimum Period of Service 373Recruit When Ready 80Army Pre-Conditioning Course 18 Source: Director General Personnel—Army.
The Army has refined the use of ‘Recruit when ready’ to ensure that female recruits do not experience excessively long waiting periods before the commencement of their initial employment training. The Army received 208 inquiries from female candidates to undertake the ADF Gap Year (from a total of 809 inquiries). The Army pre-conditioning course has been reviewed and has been replaced at the Army Recruit Training Centre with a pre-conditioning platoon. The program of the pre-conditioning course will be implemented in the pre-conditioning platoon in addition to the first week of the Army recruit course (induction). The Army continues to maintain its specialist recruiting team of 10 uniformed female members.
Air Force
Table 9: Recruitment of women initiatives, Air Force, 2013–14
Recruiting Initiative Women RecruitedRecruit to Area 1Reduced Initial Minimum Period of Service 128Recruit When Ready Not yet implementedGraduate Pilot Scheme 1Women in non-traditional employment roles (WINTER) campaign 54 (achieved female only targets)Experiential Camp for Girls 53 participantsSpecialist Recruitment Team Women 4 x female serving members embedded into
Defence Force Recruiting Brisbane, Parramatta, Melbourne and Adelaide, to focus specifically on female recruitment)
Source: Director General Personnel—Air Force.
During 2013–14, the Air Force implemented the following recruiting initiatives to attract and retain women:
Female targets: Specific female recruiting targets were included as part of the overall Air Force recruiting program for 2013–14. The targets were set against employment categories in which women are under-represented (mainly in the engineering, technical and aircrew fields). A total of 132 targets were set, of which 54 were

Page 21 of 54
achieved. Targets have also been set for 2014–15. The targets are aspirational; where they cannot be met, roles will generally be opened up to male candidates to avoid under-recruiting. Targeted recruiting processes will continue to mature in 2014–15.
Recruit-to-area: This initiative is linked to the female recruiting targets. To support the achievement of the targets and the retention of women employed against them, the Air Force will offer recruit-to-area as an incentive for women seeking employment against the specified targets. The development of this initiative is being finalised, and full implementation is expected in 2014–15.
Reduced initial minimum period of service: From July 2013, the Air Force implemented a two-year trial of initial minimum period of service (IMPS) reductions for many employment categories. The trial is likely to be extended to enable an assessment of the success of this initiative. During 2013–14, 115 female airmen and 13 female officers were recruited to workforces with a reduced IMPS.
Recruit-when-ready: Under this initiative, women found suitable for the Air Force will be fast-tracked through the recruitment process. The initiative is still under development.
Changes to female pilot obligations: The Air Force has set aside the IMPS for direct-entry female pilots and is trialling, as a replacement, a two-year return of service obligation commencing on graduation from the initial operational conversion course. In effect, women appointed in the direct-entry pilot will not be obligated to serve until such time as they graduate from the operational conversion course following on from Basic Flying Training School and No. 2 Flying Training School. This initiative removed an otherwise lengthy on-appointment commitment that might dissuade women from joining the Air Force as pilots. In 2013–14, six female direct-entry pilots were recruited; this compares favourably to the preceding two financial years, when only two were recruited.
Graduate Pilot Scheme: The Graduate Pilot Scheme is a targeted pilot recruitment model that aims to encourage women pursuing careers as civilian pilots and studying a Bachelor of Aviation degree at a civilian university to consider joining the Air Force. One female pilot was recruited under this scheme in 2013–14; a larger number is expected in 2014–15.
Experiential camp for girls: In an effort to raise the Air Force’s profile as an employer of choice for women aged between 16 and 24, the service established two experiential camps for girls. The main objective of Flight Camp and Tech Camp is to provide a hands-on, risk-free experiential opportunity for young girls to experience aviation and technical roles in the Air Force. This includes the opportunity to engage with currently serving women from those employment groups. A secondary aim is to provide exposure to Air Force life, fitness standards, leadership and adventure training. To date, 53 girls have participated in the camps, and 80 per cent have engaged with Defence Force Recruiting to pursue Air Force careers. During 2014–15, it is expected that up to another five camps will be conducted.

Page 22 of 54
ADF promotions
Table 10 shows the number of ADF women and men promoted to each rank in 2013–14.
Table 10: ADF permanent force promotions (number and proportion of women and men substantively promoted to each rank), 2013–14[1][2][5]
2013-14 Women % Δ Men % Women % Δ Men % Women % Δ Men % Women % Δ Men %OfficersGeneral (E) (O10) 0 - 0.0% 0 - 0 - 0.0% 0 - 0 - 0.0% 0 - 0 - 0.0% 0 -
Lieutenant General (E) (O09) 0 0.0% 0.0% 2 100.0% 0 0.0% 0.0% 1 100.0% 0 - 0.0% 0 - 0 0.0% 0.0% 3 100.0%
Major General (E) (O08) 0 0.0% 0.0% 3 100.0% 1 25.0% 25.0% 3 75.0% 0 0.0% 0.0% 4 100.0% 1 9.1% 9.1% 10 90.9%
Brigadier (E) (O07) 0 0.0% 0.0% 6 100.0% 2 18.2% 8.2% 9 81.8% 1 16.7% -8.3% 5 83.3% 3 13.0% 0.5% 20 87.0%
Colonel (E) (O06) 2 18.2% 10.5% 9 81.8% 4 14.3% 0.8% 24 85.7% 6 26.1% 7.3% 17 73.9% 12 19.4% 4.7% 50 80.6%
Lieutenant Colonel (E) (O05) 7 18.9% 4.9% 30 81.1% 15 21.7% 2.9% 54 78.3% 10 14.5% -4.6% 59 85.5% 32 18.3% 0.7% 143 81.7%
Major (E) (O04) 19 22.4% 7.7% 66 77.6% 43 16.5% -0.3% 218 83.5% 33 25.4% 6.4% 97 74.6% 95 20.0% 2.9% 381 80.0%
Total Officers 28 19.4% 6.5% 116 80.6% 65 17.4% 0.9% 309 82.6% 50 21.6% 2.4% 182 78.4% 143 19.1% 2.4% 607 80.9%
Other Ranks
Warrant Officer Class 1 (E) (E10 and E09)[3] 1 5.3% -1.0% 18 94.7% 6 10.5% 0.0% 51 89.5% 6 12.2% 5.2% 43 87.8% 13 10.4% 1.9% 112 89.6%
Warrant Officer Class 2 (E) (E08) 10 9.7% -3.4% 93 90.3% 26 11.0% 1.0% 210 89.0% 20 15.3% -0.2% 111 84.7% 56 11.9% -0.1% 414 88.1%
Sergeant (E) (E06) 27 13.0% -5.7% 180 87.0% 39 10.0% -4.6% 351 90.0% 29 13.9% -8.3% 179 86.1% 95 11.8% -5.4% 710 88.2%
Corporal (E) (E05)/Lance Corporal (E04)[4] 92 18.9% -3.9% 395 81.1% 162 9.6% -2.8% 1,529 90.4% 70 23.3% -1.2% 231 76.7% 324 13.1% -2.7% 2,155 86.9%
Total Other Ranks 130 15.9% -4.1% 686 84.1% 233 9.8% -2.7% 2,141 90.2% 125 18.1% -2.5% 564 81.9% 488 12.6% -2.8% 3,391 87.4%
Total ADF Permanent 158 16.5% -2.4% 802 83.5% 298 10.8% -2.1% 2,450 89.2% 175 19.0% -1.1% 746 81.0% 631 13.6% -1.9% 3,998 86.4%
Navy Army Air Force ADF
Source: Defence HR system Notes 1. Figures in this table show ADF permanent force members (trained force only) promoted to each rank in 2013–14. 2. Only promotions to those ranks for which merit selection applies are shown (i.e. promotions to the officer ranks of O04 and above and the other ranks of E04 and above). 3. Warrant Officer Class 1 (E) figures include Warrant Officer—Navy, Regimental Sergeant Major—Army, and Warrant Officer—Air Force. 4. E04 is an Army-only rank. 5. Percentages may not sum due to rounding.
Page 23 of 54
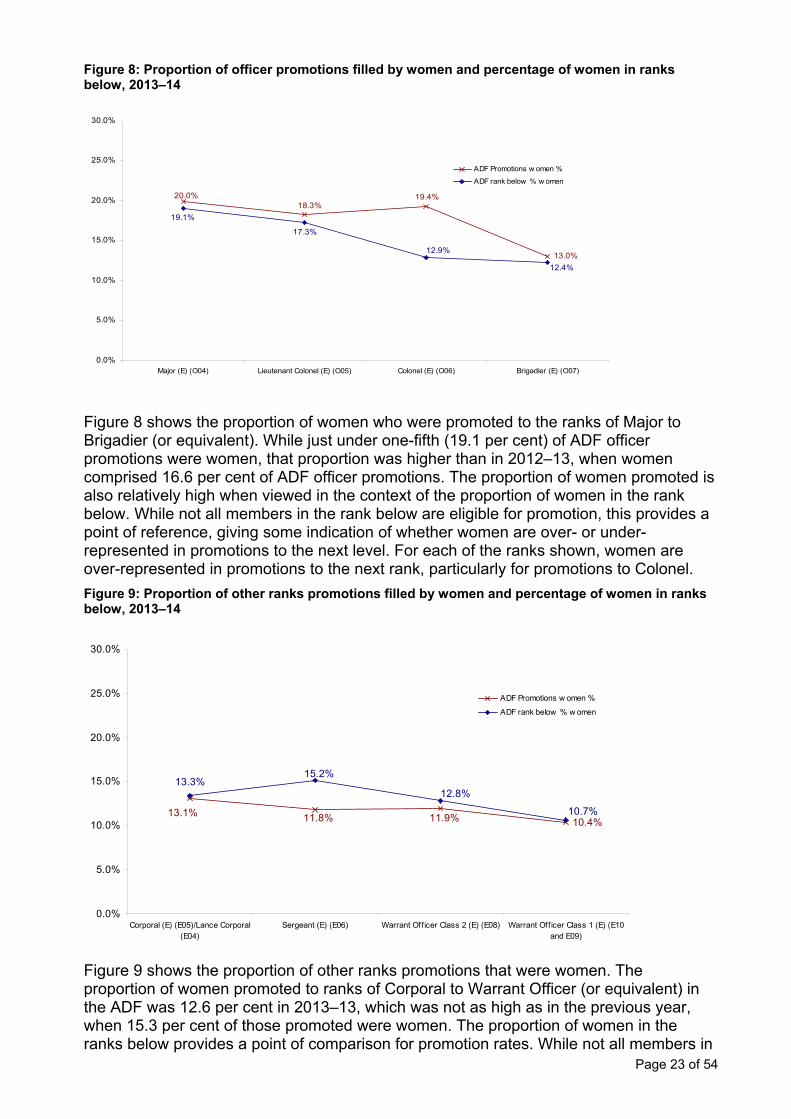
Figure 8: Proportion of officer promotions filled by women and percentage of women in ranks below, 2013–14
13.0%
20.0% 19.4%18.3%
12.4%
19.1%
17.3%
12.9%
0.0%
5.0%
10.0%
15.0%
20.0%
25.0%
30.0%
Major (E) (O04) Lieutenant Colonel (E) (O05) Colonel (E) (O06) Brigadier (E) (O07)
ADF Promotions w omen %
ADF rank below % w omen
Figure 8 shows the proportion of women who were promoted to the ranks of Major to Brigadier (or equivalent). While just under one-fifth (19.1 per cent) of ADF officer promotions were women, that proportion was higher than in 2012–13, when women comprised 16.6 per cent of ADF officer promotions. The proportion of women promoted is also relatively high when viewed in the context of the proportion of women in the rank below. While not all members in the rank below are eligible for promotion, this provides a point of reference, giving some indication of whether women are over- or under-represented in promotions to the next level. For each of the ranks shown, women are over-represented in promotions to the next rank, particularly for promotions to Colonel.
Figure 9: Proportion of other ranks promotions filled by women and percentage of women in ranks below, 2013–14
10.4%11.8% 11.9%13.1% 10.7%
12.8%
15.2%13.3%
0.0%
5.0%
10.0%
15.0%
20.0%
25.0%
30.0%
Corporal (E) (E05)/Lance Corporal(E04)
Sergeant (E) (E06) Warrant Off icer Class 2 (E) (E08) Warrant Off icer Class 1 (E) (E10and E09)
ADF Promotions w omen %
ADF rank below % w omen
Figure 9 shows the proportion of other ranks promotions that were women. The proportion of women promoted to ranks of Corporal to Warrant Officer (or equivalent) in the ADF was 12.6 per cent in 2013–13, which was not as high as in the previous year, when 15.3 per cent of those promoted were women. The proportion of women in the ranks below provides a point of comparison for promotion rates. While not all members in

Page 24 of 54
the ranks below are eligible for promotion, this provides an indication of whether women are over- or under-represented in promotions to the next level. For Corporal and Warrant Officer (1 and 2) ranks, the representation of women is very close to the proportion of women in the rank below, indicating that women are proportionately represented in these promotions. However, promotions to the rank of Sergeant have a slightly lower proportion of women than in the rank below.
Representation of women on Defence senior decision-making committees
Table 11 shows the gender balance on key Defence decision-making bodies at 30 June 2014.
Table 11: Gender balance in key Defence decision-making bodies, 30 June 2014[1][2]
Committee Vacant HeadcountWomen Men Women Men Women Men Positions % Women % Men
Secretary and Chief of the Defence Force Advisory Committee (SCAC)
0 6 2 9 0 0 0 17 11.8% 88.2%
Defence Committee (DC)0 6 2 9 0 0 0 17 11.8% 88.2%
Chiefs of Service Committee (COSC)1 7 2 2 0 0 0 12 25.0% 75.0%
Defence Capability Committee0 9 3 7 0 0 0 19 15.8% 84.2%
Defence Civilian Committee 0 1 4 10 0 0 0 15 26.7% 73.3%
Defence Audit and Risk Committee (DARC)0 1 0 2 1 2 0 6 16.7% 83.3%
Defence Capability and Investment Committee (DCIC)0 6 1 10 0 0 0 17 5.9% 94.1%
Chief of Navy Senior Advisory Committee (CNSAC)1 8 1 0 0 0 0 10 20.0% 80.0%
Chief of Army Senior Advisory Committee (CASAC)1 9 1 0 0 0 0 11 18.2% 81.8%
Chief of Air Force Advisory Committee (CAFAC)1 16 0 2 0 0 0 19 5.3% 94.7%
Human Resources Development Board (HRDB)0 5 1 9 0 0 0 15 6.7% 93.3%
ADF APS Non-Defence Total
Source: Senior committee secretariats Notes 1. Appointment on these boards and committees is determined by position. 2. Figures include permanent members only; invited guests and observers are not included.
Figure 10: Percentage of women and men in key Defence decision-making bodies, 30 June 2014
Men86.1%
Women13.9%
Figure 10 shows the proportions of women and men in key Defence decision-making bodies. There was a modest increase in the proportion of women in these committees, from 12.2 per cent in June 2013 to 13.9 per cent at 30 June 2014. This increase was largely driven by the addition of women to the Chief of Army Senior Advisory Committee, the Defence Audit and Risk Committee, the Secretary and Chief of the Defence Force Advisory Committee, the Defence Committee and the Defence Capability Committee.

Page 25 of 54
Women and men retained after parental leave
Tables 12 to 14 show the numbers and percentages of ADF members (by service) retained after taking maternity or parental leave in the 18 months to 30 June 2014, sorted by gender and rank. The tables include the numbers of women and men at each rank who took any variant of parental leave (including maternity and adoption leave), and how many were still serving in the ADF at 30 June 2014. Women and men not considered to be retained include those who left the permanent service and those who transferred from the permanent forces to serve in a Reserve capacity.
Table 12: Numbers and proportions of Navy members retained after taking paid maternity or parental leave in the 18 months to 30 June 2014[1]
RankTaken Leave Retained % Retained Rank
Taken Leave Retained % Retained
Admiral (O10) - - - Admiral (O10) - - -Vice Admiral (O09) - - - Vice Admiral (O09) - - -Rear Admiral (O08) - - - Rear Admiral (O08) - - -Commodore (O07) - - - Commodore (O07) - - -Captain (O06) - - - Captain (O06) 3 3 100.0%Commander (O05) 1 1 100.0% Commander (O05) 8 7 87.5%Lieutenant Commander (O04) 13 13 100.0% Lieutenant Commander (O04) 18 16 88.9%Lieutenant (O03) 15 13 86.7% Lieutenant (O03) 47 43 91.5%Sub Lieutenant (O02) 1 0 0.0% Sub Lieutenant (O02) 7 5 71.4%Acting Sub Lieutenant (O01) 2 2 100.0% Acting Sub Lieutenant (O01) - - -Midshipman (O00) - - - Midshipman (O00) 2 2 100.0%Warrant Officer (E09) - - - Warrant Officer (E09) 1 1 100.0%Chief Petty Officer (E08) 4 4 100.0% Chief Petty Officer (E08) 14 10 71.4%Petty Officer (E06) 23 18 78.3% Petty Officer (E06) 73 65 89.0%Leading Seaman (E05) 44 34 77.3% Leading Seaman (E05) 108 89 82.4%Able Seaman (E03) 71 43 60.6% Able Seaman (E03) 103 86 83.5%Seaman (E02) 1 1 100.0% Seaman (E02) 16 13 81.3%Seaman* (E01) 1 1 100.0% Seaman* (E01) 3 3 100.0%Total 176 130 73.9% Total 403 343 85.1%
Women Men
Source: Defence HR system. Note 1. Leave types include adoption leave—paid, forces maternity leave—ADF, paid parental leave—ADF, maternity
leave—paid and parental leave.
Table 13: Numbers and proportions of Army members retained after taking paid maternity or parental leave in the 18 months to 30 June 2014[1]
RankTaken Leave Retained % Retained Rank
Taken Leave Retained % Retained
General (O10) - - - General (O10) - - -Lieutenant General (O09) - - - Lieutenant General (O09) - - -Major General (O08) - - - Major General (O08) - - -Brigadier (O07) - - - Brigadier (O07) - - -Colonel (O06) 0 0 - Colonel (O06) 1 1 100.0%Lieutenant Colonel (O05) 3 3 100.0% Lieutenant Colonel (O05) 22 21 95.5%Major (O04) 17 17 100.0% Major (O04) 61 57 93.4%Captain (O03) 28 27 96.4% Captain (O03) 110 101 91.8%Lieutenant (O02) 7 7 100.0% Lieutenant (O02) 38 37 97.4%Second Lieutenant (O01) - - - Second Lieutenant (O01) - - -Officer Cadet (O00) - - - Officer Cadet (O00) 2 2 100.0%Warrant Officer Class 1 (E09) - - - Warrant Officer Class 1 (E09) 5 5 100.0%Warrant Officer Class 2 (E08) 5 5 100.0% Warrant Officer Class 2 (E08) 44 42 95.5%Sergeant (E06) 21 19 90.5% Sergeant (E06) 160 140 87.5%Corporal (E05) 46 40 87.0% Corporal (E05) 294 252 85.7%Lance Corporal (E04) 3 3 100.0% Lance Corporal (E04) 85 65 76.5%Private Proficient (E03) 44 33 75.0% Private Proficient (E03) 386 294 76.2%Private (E02) 5 5 100.0% Private (E02) 69 67 97.1%Private Trainee (E01) - - - Private Trainee (E01) 25 21 84.0%Total 179 159 88.8% Total 1,302 1,105 84.9%
Women Men
Source: Defence HR system. Note 1. Leave types include adoption leave—paid, forces maternity leave—ADF, paid parental leave—ADF, maternity
leave—paid and parental leave.
Page 26 of 54
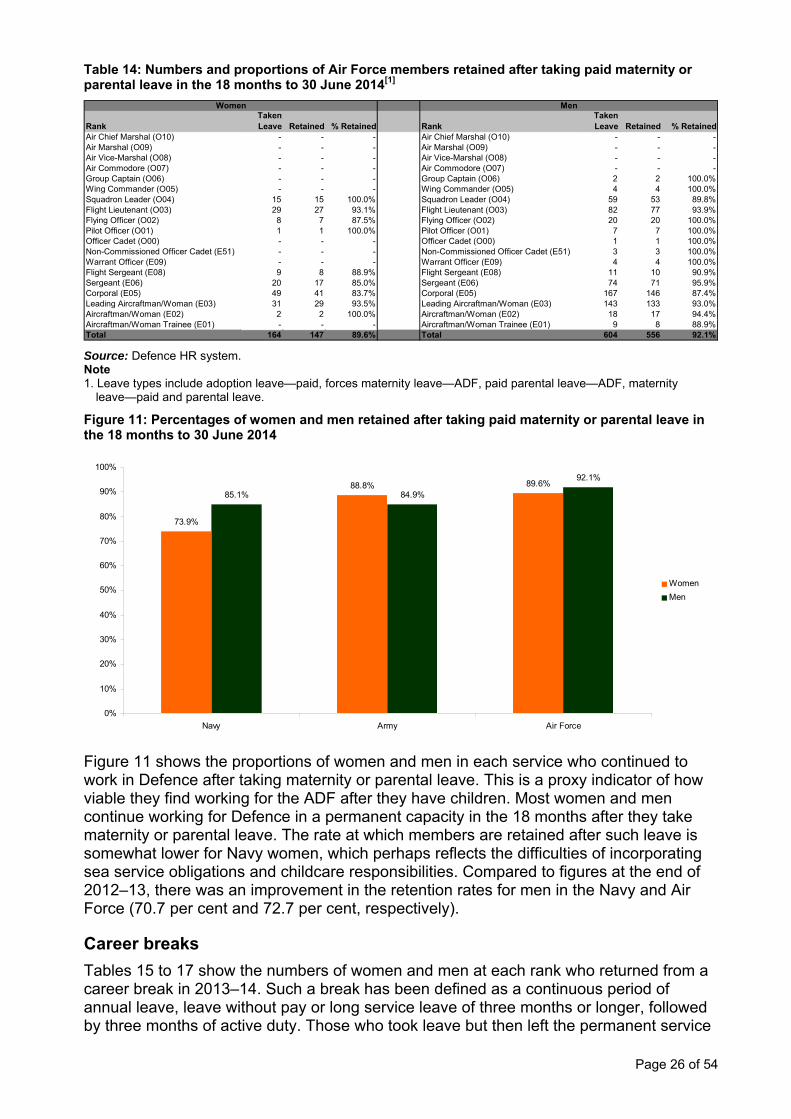
Table 14: Numbers and proportions of Air Force members retained after taking paid maternity or parental leave in the 18 months to 30 June 2014[1]
RankTaken Leave Retained % Retained Rank
Taken Leave Retained % Retained
Air Chief Marshal (O10) - - - Air Chief Marshal (O10) - - -Air Marshal (O09) - - - Air Marshal (O09) - - -Air Vice-Marshal (O08) - - - Air Vice-Marshal (O08) - - -Air Commodore (O07) - - - Air Commodore (O07) - - -Group Captain (O06) - - - Group Captain (O06) 2 2 100.0%Wing Commander (O05) - - - Wing Commander (O05) 4 4 100.0%Squadron Leader (O04) 15 15 100.0% Squadron Leader (O04) 59 53 89.8%Flight Lieutenant (O03) 29 27 93.1% Flight Lieutenant (O03) 82 77 93.9%Flying Officer (O02) 8 7 87.5% Flying Officer (O02) 20 20 100.0%Pilot Officer (O01) 1 1 100.0% Pilot Officer (O01) 7 7 100.0%Officer Cadet (O00) - - - Officer Cadet (O00) 1 1 100.0%Non-Commissioned Officer Cadet (E51) - - - Non-Commissioned Officer Cadet (E51) 3 3 100.0%Warrant Officer (E09) - - - Warrant Officer (E09) 4 4 100.0%Flight Sergeant (E08) 9 8 88.9% Flight Sergeant (E08) 11 10 90.9%Sergeant (E06) 20 17 85.0% Sergeant (E06) 74 71 95.9%Corporal (E05) 49 41 83.7% Corporal (E05) 167 146 87.4%Leading Aircraftman/Woman (E03) 31 29 93.5% Leading Aircraftman/Woman (E03) 143 133 93.0%Aircraftman/Woman (E02) 2 2 100.0% Aircraftman/Woman (E02) 18 17 94.4%Aircraftman/Woman Trainee (E01) - - - Aircraftman/Woman Trainee (E01) 9 8 88.9%Total 164 147 89.6% Total 604 556 92.1%
Women Men
Source: Defence HR system. Note 1. Leave types include adoption leave—paid, forces maternity leave—ADF, paid parental leave—ADF, maternity
leave—paid and parental leave.
Figure 11: Percentages of women and men retained after taking paid maternity or parental leave in the 18 months to 30 June 2014
73.9%
88.8% 89.6%85.1% 84.9%
92.1%
0%
10%
20%
30%
40%
50%
60%
70%
80%
90%
100%
Navy Army Air Force
Women
Men
Figure 11 shows the proportions of women and men in each service who continued to work in Defence after taking maternity or parental leave. This is a proxy indicator of how viable they find working for the ADF after they have children. Most women and men continue working for Defence in a permanent capacity in the 18 months after they take maternity or parental leave. The rate at which members are retained after such leave is somewhat lower for Navy women, which perhaps reflects the difficulties of incorporating sea service obligations and childcare responsibilities. Compared to figures at the end of 2012–13, there was an improvement in the retention rates for men in the Navy and Air Force (70.7 per cent and 72.7 per cent, respectively).
Career breaks
Tables 15 to 17 show the numbers of women and men at each rank who returned from a career break in 2013–14. Such a break has been defined as a continuous period of annual leave, leave without pay or long service leave of three months or longer, followed by three months of active duty. Those who took leave but then left the permanent service

Page 27 of 54
are not included; only those retained in the ADF for at least three months after their return from leave are considered to have been on a career break.
Table 15: Navy members retained after taking a career break of three months or more, 2013–14[1][2][3][4]
Rank Women % Men % Total Admiral (O10) - - - - -Vice Admiral (O09) - - - - -Rear Admiral (O08) - - - - -Commodore (O07) - - - - -Captain (O06) 0 0.0% 1 100.0% 1Commander (O05) 2 22.2% 7 77.8% 9Lieutenant Commander (O04) 4 21.1% 15 78.9% 19Lieutenant (O03) 9 45.0% 11 55.0% 20Sub Lieutenant (O02) 1 50.0% 1 50.0% 2Acting Sub Lieutenant (O01) 1 100.0% 0 0.0% 1Midshipman (O00) 0 0.0% 2 100.0% 2Warrant Officer (E09) 0 0.0% 2 100.0% 2Chief Petty Officer (E08) 0 0.0% 9 100.0% 9Petty Officer (E06) 5 41.7% 7 58.3% 12Leading Seaman (E05) 0 0.0% 8 100.0% 8Able Seaman (E03) 2 28.6% 5 71.4% 7Seaman (E02) 0 0.0% 1 100.0% 1Seaman * (E01) - - - - -Recruit (E00) - - - - -Total 24 25.8% 69 74.2% 93
Number and Proportion of Women and Men Taking Career Breaks at each Rank (Retained only)
Source: Defence HR system. Notes 1. Figures include members who took a continuous period of leave for three months or longer and who remained in the
service for at least three months after returning from leave. 2. Leave types include long service leave, forces annual leave and leave without pay. 3. Figures exclude members who took a leave break but subsequently left the service. 4. Figures exclude members who took any form of paid maternity or parental leave in the 18 months before the first
date of leave.
Table 16: Army members retained after taking a career break of three months or more, 2013–14[1][2][3][4]
Rank Women % Men % Total General (O10) - - - - -Lieutenant General (O09) - - - - -Major General (O08) - - - - -Brigadier (O07) 2 100.0% 0 0.0% 2Colonel (O06) 0 0.0% 9 100.0% 9Lieutenant Colonel (O05) 1 5.9% 16 94.1% 17Major (O04) 8 13.6% 51 86.4% 59Captain (O03) 10 22.7% 34 77.3% 44Lieutenant (O02) 2 40.0% 3 60.0% 5Officer Cadet (O00) 3 75.0% 1 25.0% 4Warrant Officer Class 1 (E09) 1 7.7% 12 92.3% 13Warrant Officer Class 2 (E08) 1 4.2% 23 95.8% 24Sergeant (E06) 5 9.3% 49 90.7% 54Corporal (E05) 4 10.0% 36 90.0% 40Lance Corporal (E04) 1 7.7% 12 92.3% 13Private Proficient (E03) 2 2.9% 66 97.1% 68Private (E02) - - - - -Private Trainee (E01) - - - - -Recruit (E00) - - - - -Total 40 11.4% 312 88.6% 352
Number and Proportion of Women and Men Taking Career Breaks at each Rank (Retained only)
Source: Defence HR system. Notes: 1. Figures include members who took a continuous period of leave for three months or longer and who remained in the
service for at least three months after returning from leave. 2. Leave types include long service leave, forces annual leave and leave without pay. 3. Figures exclude members who took a leave break but subsequently left the service. 4. Figures exclude members who took any form of paid maternity or parental leave in the 18 months before the first
date of leave.

Page 28 of 54
Table 17: Air Force members retained after taking a career break of three months or more, 2013–14[1][2][3][4]
Rank Women % Men % Total Air Chief Marshal (O10) - - - - -Air Marshal (O09) - - - - -Air Vice-Marshal (O08) - - - - -Air Commodore (O07) - - - - -Group Captain (O06) - - - - -Wing Commander (O05) 0 0.0% 4 100.0% 4Squadron Leader (O04) 8 57.1% 6 42.9% 14Flight Lieutenant (O03) 6 40.0% 9 60.0% 15Flying Officer (O02) 3 30.0% 7 70.0% 10Officer Cadet (O00) - - - - -Warrant Officer (E09) 0 0.0% 7 100.0% 7Flight Sergeant (E08) 0 0.0% 2 100.0% 2Sergeant (E06) 4 40.0% 6 60.0% 10Corporal (E05) 8 17.4% 38 82.6% 46Leading Aircraftman/Woman (E03) 2 10.0% 18 90.0% 20Aircraftman/Woman (E02) - - - - -Aircraftman/Woman Trainee (E01) - - - - -Aircraftman/Woman Recruit (E00) - - - - -Total 31 24.2% 97 75.8% 128
Number and Proportion of Women and Men Taking Career Breaks at each Rank (Retained only)
Source: Defence HR system. Notes 1 Figures include members who took a continuous period of leave for three months or longer and who remained in
service for at least three months after returning from leave. 2. Leave types include long service leave, forces annual leave and leave without pay. 3. Figures exclude members who took a leave break but subsequently left the service. 4. Figures exclude members who took any form of paid maternity or parental leave in the 18 months before the first
date of leave.
Figure 12: Percentage of career breaks taken by women and men, by service, 2013–14
Women24.2%
Women11.4%
Women25.8%
Men75.8%
Men88.6%
Men74.2%
0% 10% 20% 30% 40% 50% 60% 70% 80% 90% 100%
Air Force
Army
Navy
Figure 12 charts the proportion of career breaks taken by women and men, by service. In the Navy and the Air Force, approximately one-quarter of those taking career breaks were women, which was higher than the proportion of women in those services (18.6 per cent and 18.2 per cent, respectively). In the Army, 11.4 per cent of those taking career breaks were women, which was almost the same as the proportion of women in the Army (11.8 per cent), indicating that Army women are evenly represented among Army members taking career breaks. As might be expected, members at very junior and very senior ranks are less likely to take career breaks.
Compared with figures for 2012–13, there was a small reduction in the number of Army members taking career breaks.

Page 29 of 54
Gender pay audit
A key indicator of gender equity in Australia, in various industries and in each organisation, is gender pay equity as measured by the gender pay gap. The gap is the percentage difference between women’s average salary and men’s average salary. This metric is of interest at the national level and is one of the gender equity indicators that private companies in Australia must report in accordance with the Workplace Gender Equality Act 2012. While Defence is not compelled to report under that Act, a gender pay gap analysis is useful in assessing gender equity.
The gender pay gap does not refer to the difference in pay between a man and a woman carrying out the same work with the same experience and qualifications. Under Defence’s remuneration system, men and women are paid the same in the same circumstances. A gender pay gap does not necessarily indicate gender bias or an undervaluation of traditionally female roles, but can reflect legitimate differences in pay due to different work undertaken. These differences are influenced by structural contributors, such as women occupying less well-remunerated occupations and ranks, which Defence is assiduously addressing through the implementation of the Broderick review recommendations.
This section presents outcomes of a gender pay audit, which includes an analysis of the overall Defence gender pay gap, calculated in the same way that the Australian national pay gap is calculated and guided by how private companies examine gender pay gaps to satisfy Workplace Gender Equality Agency reporting requirements. This method involves first calculating the average salary of all permanent and continuous full-time service ADF women, and then the average salary of all permanent and continuous full-time service ADF men. The average female salary is subtracted from the average male salary. This difference is then divided by the average male salary, resulting in the percentage difference (the pay gap). Gender pay gaps have also been calculated for each rank in each service. Defence is also developing a data storage and reporting mechanism that will facilitate future gender pay gap analyses by occupational group, enabling greater granularity in the gender pay audit.
Figure 13: ADF gender pay gap, Australian national pay gap and public administration and safety industry pay gap
17.1%
7.3%5.3%
0%
10%
20%
30%
40%
50%
60%
70%
80%
90%
100%
ADF Pay Gap Australian National Pay Gap Public Administration and Safety IndustryPay Gap
Source: ADF pay—Defence HR system; Australian and industry pay —ABS (2014), Average weekly earnings, Australia, November 2013, cat. no 6302.0.

Page 30 of 54
Figure 13 shows the ADF gender pay gap alongside the Australian national pay gap and the pay gap in the most relevant industry, which is public administration and safety. The gender pay gap is the difference between the average male salary and the average female salary, expressed as a proportion of the average male salary. The average ADF woman is paid 5.3 per cent less than the average ADF man. The ADF gender pay gap is due to ADF women being disproportionately represented in lower ranks and in occupational groups that are in the lower pay grades. The gap is also influenced by women’s lower average length of service and their lower average seniority at rank. Defence is addressing each of these factors by increasing overall female participation and by facilitating longer careers for women by providing adequate support (for example, by supporting flexible work and flexible career pathways).
The ADF compares favourably with the Australian national benchmark and with the public administration and safety industry benchmark, which show gender pay gaps of 17.1 per cent and 7.3 per cent, respectively.
Table 18 shows the outcome of the gender pay audit by rank for the ADF workforce at 30 June 2014.
Table 18: Gender pay gap in ADF—comparisons of average actual salary by service and rank, 30 June 2014[1][2][3][4][5]
Navy Officers Army Officers Air Force Officers
Rank % Salary
Difference Rank % Salary
Difference Rank % Salary
Difference
Rear Admiral (O08) -20.51% Major General (O08) 3.89% Air Commodore (O07) -5.54%Commodore (O07) -28.54% Brigadier (O07) -0.89% Group Captain (O06) 2.90%Captain (O06) 0.62% Colonel (O06) -0.89% Wing Commander (O05) 3.90%Commander (O05) 3.13% Lieutenant Colonel (O05) 0.83% Squadron Leader (O04) 5.60%Lieutenant Commander (O04) 3.22% Major (O04) 1.96% Flight Lieutenant (O03) 9.86%Lieutenant (O03) 3.53% Captain (O03) 2.13% Flying Officer (O02) 4.05%Sub Lieutenant (O02) 2.82% Lieutenant (O02) 2.62% Pilot Officer (O01) 1.08%Acting Sub Lieutenant (O01) 5.73% Officer Cadet (O00) 1.11% Officer Cadet (O00) 0.09%Midshipman (O00) 2.26%
Navy Other Ranks Army Other Ranks Air Force Other Ranks
Rank % Salary
Difference Rank % Salary
Difference Rank % Salary
Difference
Warrant Officer (E09) 5.02% Warrant Officer Class 1 (E09) 4.58% Warrant Officer (E09) 5.72%Chief Petty Officer (E08) 5.26% Warrant Officer Class 2 (E08) 4.85% Flight Sergeant (E08) 6.54%Petty Officer (E06) 4.66% Sergeant (E06) 4.47% Sergeant (E06) 5.27%Leading Seaman (E05) 4.00% Corporal (E05) 5.07% Non-Commissioned Officer Cadet (E51) 0.89%Able Seaman (E03) 3.36% Lance Corporal (E04) 4.61% Corporal (E05) 7.32%Seaman (E02) 0.83% Private Proficient (E03) 3.84% Leading Aircraftman/Woman (E03) 4.26%Seaman* (E01) 0.21% Private (E02) 1.94% Aircraftman/Woman (E02) 1.33%Recruit (E00) 0.00% Private Trainee (E01) 0.72% Aircraftman/Woman Trainee (E01) 1.04%
Recruit (E00) 0.00% Aircraftman/Woman Recruit (E00) 0.00%
Source: Defence HR system. Notes 1. Positive numbers indicate that average salary is higher for men; negative numbers indicate that average salary is
higher for women. This was changed for this report to reflect the standard calculation method according to the Workplace Gender Equality Agency guidelines.
2. Based on average actual salaries. 3. Excludes allowances. 4. Based on permanent and continuous full-time service ADF members. 5. Calculated from the average salary of men at rank, minus the average salary of women at rank. The difference is
expressed as a percentage of the average salary of men at rank.

Page 31 of 54
Figure 14: Average gender pay gap at each officer rank, by service, 30 June 2014
2.3%5.7%
3.5%
-20.5%
0.8%
-0.9%
3.9%5.6% 3.1%2.8%
0.6%
3.2%
-28.5%
-0.9%
2.0%2.1%2.6%1.1%
-5.5%
0.1%4.0%
9.9%2.9%3.9%
1.1%
-50%
-40%
-30%
-20%
-10%
0%
10%
20%
30%
40%
50%
Officer Cadet(E) (O00)
SecondLieutenant (E)
(O01)
Lieutenant (E)(O02)
Captain (E)(O03)
Major (E) (O04) LieutenantColonel (E)
(O05)
Colonel (E)(O06)
Brigadier (E)(O07)
Major General (E) (O08)
Navy
Army
Air Force
Figure 14 shows the percentage difference between the average salaries of male and female ADF officers. The largest differences are in women’s favour, at Navy’s Commodore and Rear Admiral ranks (equivalent to Brigadier and Major General, respectively). Differences at these levels should be interpreted with caution, due to the small numbers; for example, there is only one Navy woman at the O08 rank. Women’s representation in specialist roles (for example, health) accounts for the higher average salary at O07 and O08 ranks. The smaller but more consistent differences are in men’s favour at less senior officer ranks. Most of the differences are less than five per cent and reflect women’s lower representation in the most highly remunerated occupation groups. The Army’s gender pay gap tends to be lower at most officer ranks, as Army officers’ pay grades are based more on rank than occupation.
Figure 15: Average gender pay gap at each other rank, by service, 30 June 2014
1.9%4.6%
3.4%0.2%5.0%5.1%
0.0%
5.3%4.7%0.8% 4.6%4.8%4.5%
5.1%3.8%0.0%
0.7%
5.7%6.5%
0.0%
1.0%7.3% 5.3%
4.3%1.3%
-50%
-40%
-30%
-20%
-10%
0%
10%
20%
30%
40%
50%
Recruit (E) (E00) Private Trainee (E)(E01)
Private (E) (E02) Private Proficient(E) (E03)
Lance Corporal (E)(E04)
Corporal (E) (E05) Sergeant (E) (E06) Warrant Off icerClass 2 (E) (E08)
Warrant OfficerClass 1 (E) (E09)
Navy
Army
Air Force
Figure 15 shows the percentage differences between the average salaries of female and male ADF members at the other ranks at the end of 2013–14. There were small gender pay gaps: average male salaries were slightly higher than average female salaries. There was no difference in men’s and women’s pay among recruits and a very small gap for junior ranks. Small gaps begin to appear in the more senior NCO ranks, as differences in occupations and seniority levels begin to affect pay averages.

Page 32 of 54
There are several possible contributing factors to consider in interpreting some small pay gaps in Defence. Defence is aware that gender bias and gender-based undervaluation can cause a gender pay gap. This was noted in Ian Watson’s analysis4, which found that between 65 per cent and 90 per cent of the gender pay gap among Australian managers could not be explained by any legitimate variable, and that a major part of the earnings gap is ‘simply due to women managers being female’. Other research5 suggests that men’s concentration in higher-paid occupations is due to higher work value being ascribed to those occupations simply because they are occupied by men. In fact, as more women enter an occupation, the average salary decreases.
Defence is aware of the potential for these biases and historical gender-based undervaluation, and therefore has a robust process to ensure that pay is determined fairly and equitably. The ADF determines work value and subsequent remuneration proposals based primarily on capability delivery. Where there is a direct or similar civilian (non-military) occupation, market relativities may contribute to remuneration determinations. One example of this is in Defence’s technical trades, where there are measurable market influences and relativity for trades such as vehicle mechanics. In contrast, many trades do not have a market equal, including some in the Army's combat arms (for example, infantry sergeant or tank commander). Such trades must be grown from within the ADF. In this context, direct contributors to ADF capability (military combat outputs) may be ascribed a higher work value.
The process of ascribing pay grades to trades is most often initiated by the industrial relations cells of the individual services. Proposals are then developed and proofed through a Defence committee process, and an endorsed proposal is submitted to the independent Defence Force Remuneration Tribunal. The tribunal makes a determination on the Defence salary and/or salary-related allowance. This process provides several points at which trade pay grade considerations can be reviewed for fairness and equity.
Because these processes reduce the likelihood of gender bias or discrimination, it is apparent that the small gender pay gaps in Defence are due to more structural issues, such as women being concentrated in less highly remunerated occupations, and men being represented more among higher ranks and often having greater seniority. Defence recognises these issues and has a multifaceted strategy to address them through the implementation of the Broderick review’s recommendations. To increase the proportion of women in non-traditional roles, Defence has enhanced recruiting targets, has established tailored mentoring and networking support for women in these roles, and is removing gender restrictions on combat roles. To increase the proportion of women in more senior ranks, the organisation ensures that women are well-represented in promotional gateways, further education and leadership development programs.
Defence also acknowledges the importance of indirect factors in women’s participation in non-traditional roles and in senior positions, including by offering flexible working arrangements and more flexible career pathways.
4 Watson, I. (2010). ‘Decomposing the gender pay gap in the Australian managerial labour market’, Australian Journal of Labour Economics, 13(1). 5 Olsen, W., & Walby, S. (2004) Modelling gender pay gaps, working paper series no. 17, Equal Opportunities Commission, Manchester.
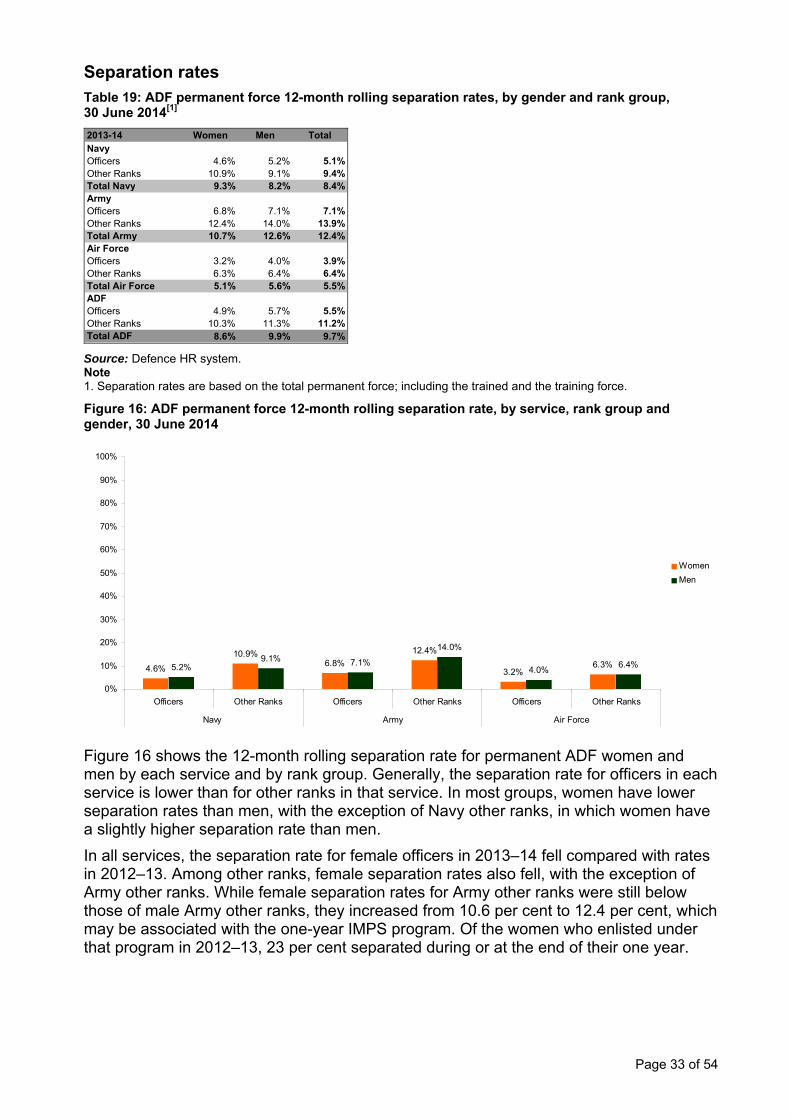
Page 33 of 54
Separation rates Table 19: ADF permanent force 12-month rolling separation rates, by gender and rank group, 30 June 2014[1]
2013-14 Women Men TotalNavy Officers 4.6% 5.2% 5.1%Other Ranks 10.9% 9.1% 9.4%Total Navy 9.3% 8.2% 8.4%ArmyOfficers 6.8% 7.1% 7.1%Other Ranks 12.4% 14.0% 13.9%Total Army 10.7% 12.6% 12.4%Air ForceOfficers 3.2% 4.0% 3.9%Other Ranks 6.3% 6.4% 6.4%Total Air Force 5.1% 5.6% 5.5%ADFOfficers 4.9% 5.7% 5.5%Other Ranks 10.3% 11.3% 11.2%Total ADF 8.6% 9.9% 9.7% Source: Defence HR system. Note 1. Separation rates are based on the total permanent force; including the trained and the training force.
Figure 16: ADF permanent force 12-month rolling separation rate, by service, rank group and gender, 30 June 2014
4.6%
10.9%6.8%
12.4%
3.2%6.3%5.2%
9.1% 7.1%
14.0%
4.0%6.4%
0%
10%
20%
30%
40%
50%
60%
70%
80%
90%
100%
Officers Other Ranks Officers Other Ranks Officers Other Ranks
Navy Army Air Force
Women
Men
Figure 16 shows the 12-month rolling separation rate for permanent ADF women and men by each service and by rank group. Generally, the separation rate for officers in each service is lower than for other ranks in that service. In most groups, women have lower separation rates than men, with the exception of Navy other ranks, in which women have a slightly higher separation rate than men.
In all services, the separation rate for female officers in 2013–14 fell compared with rates in 2012–13. Among other ranks, female separation rates also fell, with the exception of Army other ranks. While female separation rates for Army other ranks were still below those of male Army other ranks, they increased from 10.6 per cent to 12.4 per cent, which may be associated with the one-year IMPS program. Of the women who enlisted under that program in 2012–13, 23 per cent separated during or at the end of their one year.

Page 34 of 54
Women’s experience
Attitudes and perceptions
The experiences of women as they join and work in Defence help to form their perceptions and attitudes, which then affect their decision to remain in the ADF and their degree of engagement with the organisation. This section explores women’s perceptions of and attitudes to many issues compared with those of men. In particular, some items selected are ‘outcome measures’, which have been determined to be the most representative of people’s experience of an organisation and the most salient when they are deciding whether they want to continue in Defence. Survey responses for 2013–14 are disaggregated by service and gender and are compared to survey responses in 2012–13.

Page 35 of 54
Table 20: YourSay surveys (October 2013 and February 2014)—responses on ADF men’s and women’s experiences[1][2][3][4][5][6]
YourSay SurveyPercentage Agree/ Strongly Agree Women Men Women Men Women Men Women MenMy job gives me a feeling of personal accomplishment 67.5% 71.8% 70.5% 67.1% 69.6% 70.3% 69.3% 69.2%
My job gives me opportunities to utilise my skills and training 65.8% 72.4% 67.9% 68.3% 74.8% 71.3% 69.6% 70.2%
I am satisfied with the recognition I receive for doing a good job 49.2% 51.4% 55.4% 46.2% 56.3% 46.8% 53.8% 47.6%
The people in my work group are honest, open and transparent in their dealings 64.4% 73.1% 64.6% 65.2% 65.3% 68.4% 64.8% 68.1%
My supervisor encourages me 78.3% 76.4% 75.8% 70.6% 74.6% 74.8% 76.1% 73.3%
I have a good supervisor ▲78.6% 79.1% 74.9% 73.1% ▲76.1% 76.1% 76.4% 75.4%
Communication between Defence senior leaders and other employees is effective ▲45.8% 41.5% 45.0% 36.7% ▲45.6% 36.9% 45.4% 37.9%
My workplace provides access to effective learning and development opportunities 62.4% 62.9% 67.7% 56.9% 63.9% 57.2% 64.8% 58.5%
Employees in the Navy/Army/Air Force/Department of Defence feel they are valued for their contribution
35.8% ▲42.2% 44.3% 42.3% ▲44.2% 42.2% 41.8% 42.2%
When someone praises the accomplishments of the Navy/Army/Air Force/ Department of Defence, it feels like a personal compliment to me
45.7% 48.0% 49.2% 42.2% 44.2% 39.2% 46.5% 42.7%
I am actively looking at leaving Defence/ (Service) ▼24.5% 26.7% 20.9% 26.7% 17.4% 21.3% 20.8% 25.1%
I like the job I do in my current position 65.5% 69.5% 64.6% 64.8% 65.8% 66.0% 65.3% 66.3%
Overall, I am satisfied with my job 62.5% 66.9% 65.2% 61.1% 63.7% 63.3% 63.9% 63.2%
I am proud to tell others that I am a member of Defence 80.8% 82.5% 81.5% 79.3% 85.3% 83.1% 82.6% 81.2%
I feel a strong sense of belonging to Defence 67.9% 71.4% 72.5% 67.7% 70.2% 66.6% 70.3% 68.3%
How would you rate your current individual level of morale? (% high/very high) 36.7% 44.1% 42.3% 41.0% 39.6% 38.3% 39.8% 40.9%
I could easily find employment outside of Defence 60.2% 66.8% 60.1% 62.9% 55.9% 55.9% 58.7% 61.7%
I believe Defence will benefit from Pathway to Change 48.6% 47.1% ▲38.3% 28.8% ▲53.0% 47.4% ▲46.3% 38.8%
I have seen evidence of Pathway to Change being used in Defence 42.6% 40.5% ▲35.2% 31.4% ▲50.6% 49.2% ▲42.6% 39.0%
I have seen evidence of Pathway to Change being used in my work area 36.6% 36.9% ▲30.0% 26.7% ▲42.6% 44.5% ▲36.2% 34.5%
Navy Army Air Force Total ADF
Source: YourSay surveys, October 2013 and February 2014. Notes 1. Data includes responses from ADF personnel. 2. Cells highlighted in green indicate that 2013–14 responses were significantly more positive than for 2012–13. 3. Cells highlighted in red indicate that the 2013–14 responses were significantly less positive than for 2012–13. 4. An upward-pointing arrow indicates that responses were significantly higher in 2013–14 compared with 2012–13 (but may be positive or negative, depending on the wording of the
question). 5. A downward-pointing arrow indicates that responses were significantly lower in 2013–14 compared with 2012–13 (but may be positive or negative, depending on the wording of the
question). 6. Differences are based on statistical significance (p < .05) and measure of association (Cramer’s V > 0.1).

Page 36 of 54
Figure 17: Percentages of ADF women and men agreeing or strongly agreeing with YourSay items about job satisfaction, 2013–14
47.6%
63.2%
68.1%
58.5%
66.3%
69.2%
70.2%
53.8%
63.9%
64.8%
64.8%
65.3%
69.3%
69.6%
0% 10% 20% 30% 40% 50% 60% 70% 80% 90% 100%
I am satisfied with the recognition I receive for doing agood job
Overall, I am satisfied with my job
The people in my work group are honest, open andtransparent in their dealings
My workplace provides access to effective learning anddevelopment opportunities
I like the job I do in my current position
My job gives me a feeling of personal accomplishment
My job gives me opportunities to utilise my skills andtraining
Women
Men
Figure 17 charts the responses of women and men in the ADF to questions about their satisfaction with their jobs, or aspects of their jobs. Overall, the responses were positive: over half of respondents were satisfied with most of the aspects covered. The aspect of the job that people were least satisfied with was recognition, although women were more positive than men about it. There were some modest differences in responses between women and men. Women in the Army and the Air Force were more positive than their male counterparts about access to learning and development and about recognition. While women and men in the Navy had positive attitudes about opportunities to use skills and training, and the honesty and transparency of their colleagues, men in the Navy were slightly more positive than women. Attitudes to job aspects charted in this figure did not differ between 2012–13 and 2013–14.

Page 37 of 54
Figure 18: Percentages of ADF women and men agreeing or strongly agreeing with YourSay items about morale and intention to leave, 2013–14
25.1%
40.9%
61.7%
20.8%
39.8%
58.7%
0% 10% 20% 30% 40% 50% 60% 70% 80% 90% 100%
I am actively looking atleaving Defence/ (Service)
How would you rate yourcurrent individual level of
morale? (% high/very high)
I could easily findemployment outside of
Defence
Women
Men
Outcome measures, such as morale and intention to leave, are key indicators of men’s and women’s experiences in the ADF (Figure 18). In 2013–14, over half of ADF women and men were confident about their ability to find work outside Defence, although Navy men were more confident than Navy women. Navy men also reported higher morale than other demographic groups. While only two-fifths of ADF members reported high or very high morale, a further 35 per cent described their morale as ‘moderate’, rather than low or very low. One-quarter of ADF men and one-fifth of ADF women were considering leaving Defence; this difference appears to be driven mostly by the figures for the Army, where 26.7 per cent of men are considering leaving, compared to 20.9 per cent of women. This corresponds to the separation rates presented in Table 19, which shows that men were more likely than women to leave the ADF. While there were some fluctuations in responses from 2012–13 to 2013–14, most changes were not statistically significant, which means that changes were due to random fluctuations and did not reflect a true change in the attitudes of ADF members. The only exception to this was that Navy women were less likely to be considering leaving compared to 2012–13, which was a positive outcome.
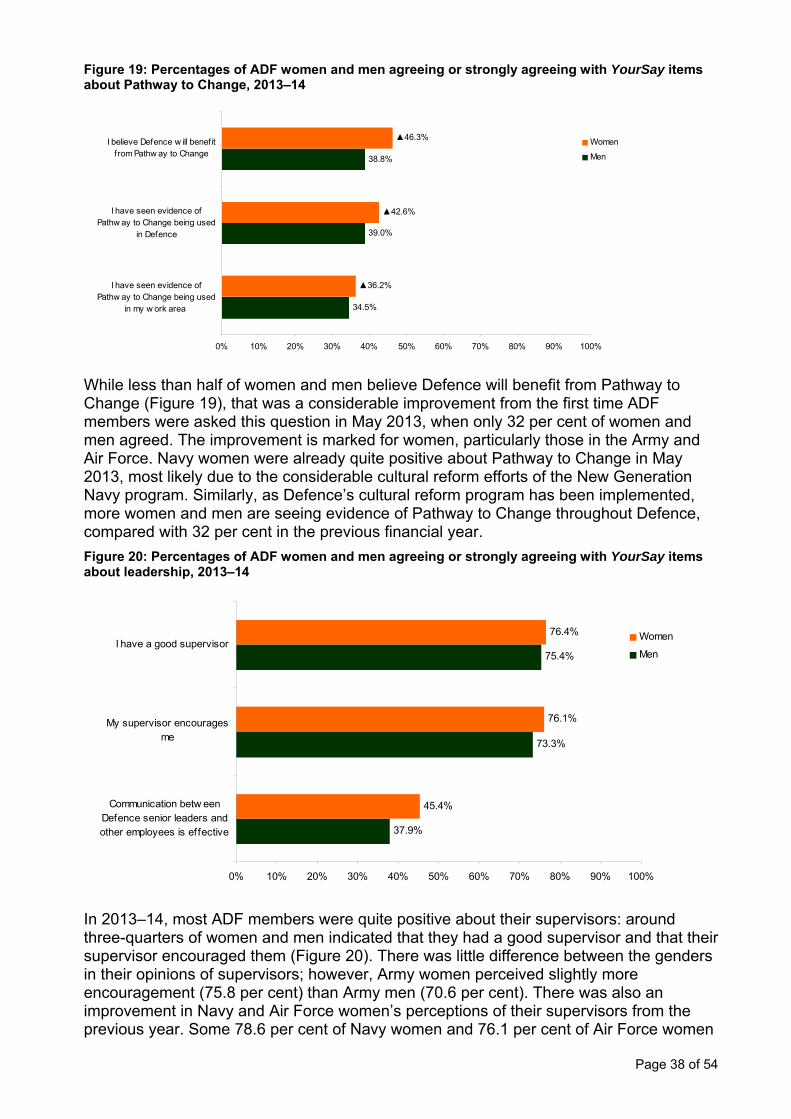
Page 38 of 54
Figure 19: Percentages of ADF women and men agreeing or strongly agreeing with YourSay items about Pathway to Change, 2013–14
34.5%
39.0%
38.8%
▲36.2%
▲42.6%
▲46.3%
0% 10% 20% 30% 40% 50% 60% 70% 80% 90% 100%
I have seen evidence ofPathw ay to Change being used
in my w ork area
I have seen evidence ofPathw ay to Change being used
in Defence
I believe Defence w ill benefitfrom Pathw ay to Change
Women
Men
While less than half of women and men believe Defence will benefit from Pathway to Change (Figure 19), that was a considerable improvement from the first time ADF members were asked this question in May 2013, when only 32 per cent of women and men agreed. The improvement is marked for women, particularly those in the Army and Air Force. Navy women were already quite positive about Pathway to Change in May 2013, most likely due to the considerable cultural reform efforts of the New Generation Navy program. Similarly, as Defence’s cultural reform program has been implemented, more women and men are seeing evidence of Pathway to Change throughout Defence, compared with 32 per cent in the previous financial year.
Figure 20: Percentages of ADF women and men agreeing or strongly agreeing with YourSay items about leadership, 2013–14
37.9%
73.3%
75.4%
45.4%
76.1%
76.4%
0% 10% 20% 30% 40% 50% 60% 70% 80% 90% 100%
Communication betw eenDefence senior leaders andother employees is effective
My supervisor encouragesme
I have a good supervisorWomen
Men
In 2013–14, most ADF members were quite positive about their supervisors: around three-quarters of women and men indicated that they had a good supervisor and that their supervisor encouraged them (Figure 20). There was little difference between the genders in their opinions of supervisors; however, Army women perceived slightly more encouragement (75.8 per cent) than Army men (70.6 per cent). There was also an improvement in Navy and Air Force women’s perceptions of their supervisors from the previous year. Some 78.6 per cent of Navy women and 76.1 per cent of Air Force women

Page 39 of 54
agreed that they had a good supervisor, compared to 69.3 per cent and 69.2 per cent, respectively, in 2012–13.
Perceptions about communication between senior leaders and other employees were less positive: less than half of women and men agreed or strongly agreed that it was effective. Further analysis indicates that most of the remainder did not disagree with this statement. Over 30 per cent of women and men responded neutrally to the item, indicating that they did not perceive communication to be ineffective but that they had no strong opinion about it. This was perhaps to be expected in a large organisation with many levels of hierarchy throughout various Branches, Groups and Divisions. Nevertheless, Defence has been targeting this as an area of attention, and progress is becoming evident. There was a notable increase in the proportion of Navy women (45.8 per cent) and Air Force women (45.6 per cent) who agreed that communication with senior leaders was effective, compared with 36.7 per cent and 34.5 per cent, respectively, in the previous year.
Figure 21: Percentages of ADF women and men agreeing or strongly agreeing with YourSay items about identification with Defence, 2013–14
42.2%
42.7%
68.3%
81.2%
41.8%
46.5%
70.3%
82.6%
0% 10% 20% 30% 40% 50% 60% 70% 80% 90% 100%
Employees in the Navy/Army/Air Force/Department of Defencefeel they are valued for their contribution
When someone praises the accomplishments of theNavy/Army/Air Force/ Department of Defence, it feels like a
personal compliment to me
I feel a strong sense of belonging to Defence
I am proud to tell others that I am a member of Defence Women
Men
Figure 21 shows the extent to which women and men feel that they are a part of Defence—a concept known as ‘affective commitment’, which has been found to be very important in people’s engagement in their jobs. There are a wide range of attitudes to items in this group, with a high level of feelings of belonging and pride in being a member of the ADF, but less positive attitudes towards praise and feeling valued. Further analysis shows that quite a high proportion (approximately one-third) of respondents gave ‘neutral’ responses to the praise and feeling valued items, indicating that most people simply did not feel strongly about these questions, rather than having negative feelings. Women and men are equally proud to tell others that they are in Defence, and feel an equally strong sense of belonging. Army and Air Force women are more likely than their male counterparts to feel that praise for their service is a personal compliment, while Navy men are somewhat more likely than Navy women to feel that they are valued for their contribution. The only item that changed significantly from 2012–13 to 2013–14 was the item regarding feeling valued for contributions, about which both Navy men and Air Force women were more positive than they were in the previous year.

Page 40 of 54
Table 21: 2013 YourSay Leaving Defence—top 10 reasons for ADF members leaving Defence[1]
Rank Total ADF Women Men 1 To make a career change
while still young enough1 Lack of control over life 1 To make a career change
while still young enough
2 Lack of control over life 2 To make a career change while still young enough
2 Better career prospects in civilian life
3 Better career prospects in civilian life
3 Desire to live in a particular location
3 Lack of control over life
4 Lack of job satisfaction 4 Lack of job satisfaction 4 Lack of job satisfaction
5 Desire to live in a particular location
5 Better career prospects in civilian life
5 Desire to live in a particular location
6 Impact of job demands on family / personal life
6 Desire to stay in one place
6 Impact of job demands on family / personal life
7 Limited opportunities in my present category / trade / mustering or primary qualification
7 Limited opportunities in my present category / trade / mustering or primary qualification
7 Limited opportunities in my present category / trade / mustering or primary qualification
8 General dissatisfaction with service life
8 A desire for more challenging work
8 General dissatisfaction with service life
9 Desire to stay in one place 9 Desire for less separation from family
9 Desire to stay in one place
10 Low morale in my work environment
10 General dissatisfaction with service life
10 Low morale in my work environment
Source: YourSay Leaving Defence Survey 2013 (formerly ADF Exit Survey). Note
1. Data includes responses from ADF members who were discharged in calendar year 2013.
As outlined in the YourSay Leaving Defence gender comparison analysis6, the following themes were evident in both women’s and men’s reasons for leaving:
leaving Defence while young enough to explore other prospects
a lack of control over life
a general dissatisfaction with their job and service life.
However, women were more likely than men to indicate that issues involving their immediate supervisor and work led them to leave the ADF, while men were more motivated by issues at a broader level, such as Defence senior leadership and a belief that their service could no longer help them meet their goals. Women were more likely than men to provide the following reasons for leaving:
a desire for more challenging work
poor leadership by immediate supervisor
lack of recognition or credit for work done
the nature of work in future postings
desire to return to their home location
desire to pursue further education that is not available through or relevant to Defence.
Conversely, men were more likely than women to indicate the following as factors in their decision to leave:
impact of job demands on family or personal life
6 YourSay Leaving Defence, Reasons for Leaving 2013 Gender Comparison, Directorate of Strategic People Research, Department of Defence.

Page 41 of 54
lack of confidence in senior Defence leadership
their goals within the service were satisfied
little financial reward for what would be considered overtime in the civilian community
underuse or non-use of training and skills.
Compared to ADF women who exited in previous years, women who left in 2013 were more likely to indicate that civilian career prospects, poor leadership from an immediate supervisor or a desire to return to their home location led to their decision to leave the ADF. Men leaving the ADF in 2013 were more likely than in previous years to have been influenced by low morale at work, lack of confidence in senior leadership and having already satisfied their goals in the service.
Mentoring, networking and sponsorship
There are many well-established mentoring initiatives in Defence for ADF women and men. To support them, Defence has developed a strategic approach to mentoring through its Mentoring Framework. The framework aims to ensure the support required for the successful implementation of Defence mentoring initiatives through four key elements:
planning and communication
education, awareness and training
mentoring resources
evaluation and continuous improvement processes.
There are also a number of formal networks in place to support female ADF members: the Navy’s Women’s Network, the Regional Army People Forum (previously known as the Army Women’s Networking Forum), and the Air Force’s Women’s Integrated Networking Groups (WINGS) program and Women’s Forums. While these networks target specific service personnel, there are also broader networks for Defence women in leadership roles, including the Women’s Speaker Series program. The program invites guest speakers to address Defence’s senior APS and ADF women on their personal experiences and insights on leadership. This provides a range of successful role models for senior women to engage with as an interim measure until there is greater gender balance at senior levels within Defence.
Currently, sponsorship pertains to the leadership development and education sponsorship programs through which Defence supports its staff.
This section outlines the mentoring, networking and sponsorship programs that are available to women in the ADF. This is included to address recommendation 3 section A of the Broderick’s phase 2 report, regarding access to mentoring and sponsorship.
Navy
Navy Women’s Mentoring Program
In 2010, the Navy implemented the Navy Women’s Mentoring Program, a personal and professional self-development program completed over a four-month period. Called ‘My Mentor’, the program is produced by Emberin Pty Ltd (Ms Maureen Frank). To date, nearly 200 women have participated in the program, and 38 women are currently completing the 2014 program. The program helps women achieve their career potential while providing positive and useful tools to counter the gender imbalance in the workforce.
Navy Women’s Networking Forum

Page 42 of 54
The Navy Women’s Networking Forum has held events in Canberra and Sydney for the past two years. Now using a regionally based model, the first regional Women’s Networking Forum was held at HMAS Albatross for all service women and APS personnel working in the Shoalhaven region. This inaugural event was very successful; it was attended by more than 50 women and provided a successful foundation template for future events to be held in other locations. Forums are planned for Canberra (HMAS Harman) and Sydney (HMAS Sydney and HMAS Penguin).
Navy Women’s Leadership Program
Sponsored by Workplace Training Advisory Australia and Women and Leadership Australia since 2009, the Navy’s Women’s Leadership Program has provided opportunities for approximately 120 Navy women to participate in leadership development programs, conferences and seminars around Australia each year. The program is designed to enhance female leadership in the Navy and can be used to counter any negative cultural elements through empowering and supporting future leaders. The 2013–14 program has 18 positions in leadership conferences around Australia and more than 100 opportunities for women to participate in short (one-day and half-day) seminars. Additionally, between four and six places will be made available for women in the Great Leaders are Made (GLAM) program run by Avril Henry Pty Ltd and two positions in the Australian Management Colloquium.
Army
Army Women’s Networking Forum
In 2007 the Army began conducting the Army Women’s Networking Forum. The intent of the forum was to bring together female personnel in each region to allow them to hear from policy and career management subject matter experts about topics specific to service life as a female in the Australian Army. Over time, it became apparent that the topics discussed at the forums were relevant to all personnel, regardless of gender. The original Army Women’s Networking Forum evolved into the Regional Army People Forum, which continues to provide a workforce engagement activity with Army personnel that allows them to hear from policy and career management experts, but more importantly allows them to discuss work-related issues that are then used to inform future policy development. In 2013–14, three sessions were run, involving around 2,400 people.
The original Army Women’s Networking Forum is now under revision following its evolution to the Regional Army People Forum. Once implemented, the revised Army Women’s Networking Forum will provide a regional approach to networking. The networking program will form the foundation for female soldiers and officers to establish mentoring relationships within their regions. Female personnel in each region will be encouraged to meet monthly to discuss either a predetermined topic for which Army Headquarters is seeking feedback, or a topic of local interest. Some of the meetings will involve guest speakers; others will be discussion based and will be moderated by a facilitator. Funding for the Army Women’s Networking Forum is covered under the Chief of Army’s priority taskings.
Army Outplacement Program
The Army targets women for participation in the Army Outplacement Program. Under this program, each year up to six talented senior NCOs have the opportunity to pursue external-to-Army career outplacements of up to six months duration in renowned, diverse and inclusive government, emergency services and industry environments. The program’s aim is to promote talent management and retention, and to drive behavioural change in the Army, thereby enhancing workplace diversity and inclusivity. It also provides an opportunity to reinforce the Army as an employer of choice, while providing

Page 43 of 54
invaluable exposure to alternative styles of leadership, management and ways of doing business.
Chief Executive Women’s Leadership Program
The Army engages the Chief Executive Women’s Leadership Program and selects participants for the program on an annual basis. The program brings together women in senior leadership positions across a range of industries and sectors, and aims to enhance participants’ leadership potential in future employment. In 2014, the Army sponsored six women to participate in the program.
Great Leaders are Made (GLAM) program
Great Leaders are Made is another talent management program targeted at developing women, particularly in a male-dominated environment. The Army’s Career Management section sponsored four women in 2013 and another six in 2014; however, other areas throughout Defence have recognised the value of this program and have funded further participation, bringing the total to eight in 2014.
Air Force
Women’s Integrated Networking Group
The Women’s Integrated Networking Group (WINGs) is a facilitated networking program designed specifically to meet the needs of Air Force women. The program offers the chance to hear about women and their careers from invited guest speakers from within Defence and external organisations, with a dedicated theme each session. There is also the opportunity for women to discuss issues affecting them in the workplace while building valuable networks. The program began in Williamtown, but has now become established in other Air Force bases. Table 22 shows the approximate frequency of WINGs meetings and the average number of participants per session at each base.
Table 22: Women’s Integrated Networking Group program
Location FrequencyParticipants per Session
Amberley Every 3 months 22
Darwin Approx. 8 times per year 14
East Sale Every 5 to 6 weeks 14
Edinburgh Monthly 15-20
Pearce 5 times per year 14
Richmond Approx. every 6 weeks 15-20
Williams Every 3 months 5-7
Wagga Every 8 weeks 20-25Williamtown Every 6 weeks 20 Source: Director General Personnel—Air Force.
In addition to regular WINGS sessions, coordinators ran base-wide events over 2013–14. They included a Q&A forum with Defence senior leadership in Canberra that attracted 120 women, a session with Sex Discrimination Commissioner Elizabeth Broderick in Richmond, which had approximately 100 participants, and a session with the theme ‘Mythbusting: women in the ADF’ in Williamtown, which attracted around 200 participants (both women and men).
WINGs Technical Network (TECHNET)
A side network of the WINGs program has been established to address the needs of the increasing number of women in non-traditional employment roles, with a particular focus on technical trades and aircrew. Known as TECHNET, it focuses on the unique and sometimes difficult career and workplace challenges of women in these roles. Table 23
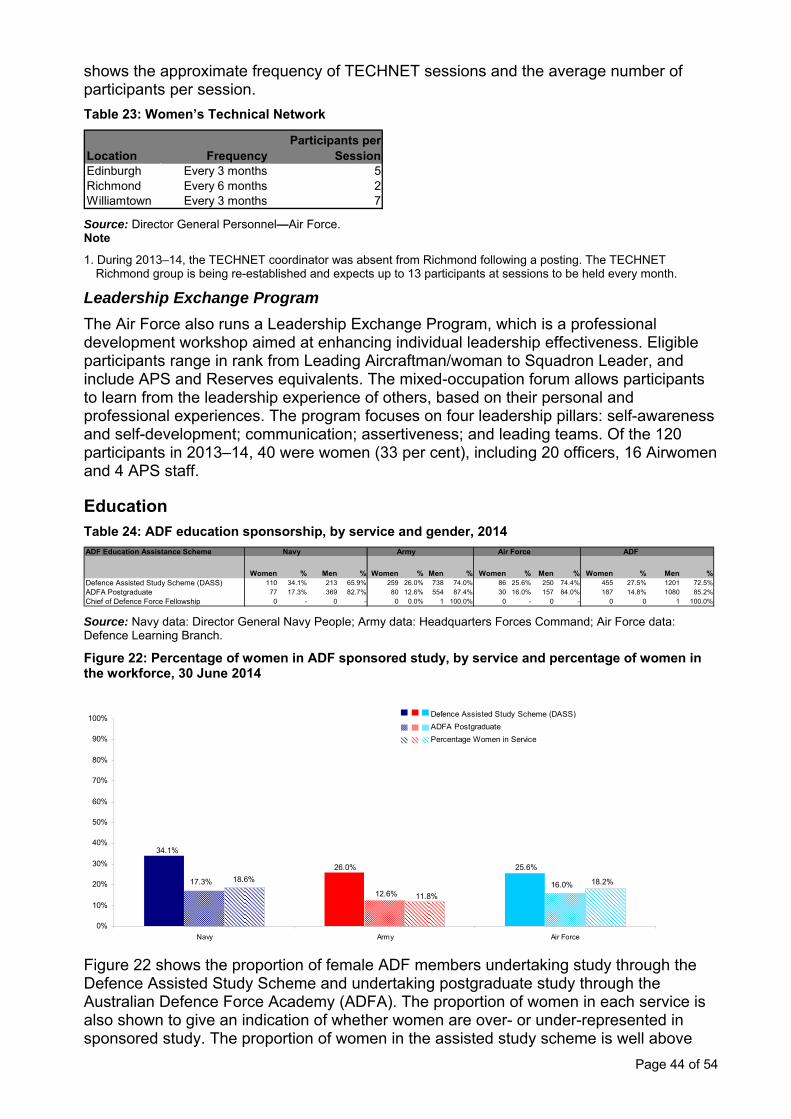
Page 44 of 54
shows the approximate frequency of TECHNET sessions and the average number of participants per session.
Table 23: Women’s Technical Network
Location FrequencyParticipants per
SessionEdinburgh Every 3 months 5Richmond Every 6 months 2Williamtown Every 3 months 7
Source: Director General Personnel—Air Force. Note
1. During 2013–14, the TECHNET coordinator was absent from Richmond following a posting. The TECHNET Richmond group is being re-established and expects up to 13 participants at sessions to be held every month.
Leadership Exchange Program
The Air Force also runs a Leadership Exchange Program, which is a professional development workshop aimed at enhancing individual leadership effectiveness. Eligible participants range in rank from Leading Aircraftman/woman to Squadron Leader, and include APS and Reserves equivalents. The mixed-occupation forum allows participants to learn from the leadership experience of others, based on their personal and professional experiences. The program focuses on four leadership pillars: self-awareness and self-development; communication; assertiveness; and leading teams. Of the 120 participants in 2013–14, 40 were women (33 per cent), including 20 officers, 16 Airwomen and 4 APS staff.
Education Table 24: ADF education sponsorship, by service and gender, 2014 ADF Education Assistance Scheme
Women % Men % Women % Men % Women % Men % Women % Men %Defence Assisted Study Scheme (DASS) 110 34.1% 213 65.9% 259 26.0% 738 74.0% 86 25.6% 250 74.4% 455 27.5% 1201 72.5%
ADFA Postgraduate 77 17.3% 369 82.7% 80 12.6% 554 87.4% 30 16.0% 157 84.0% 187 14.8% 1080 85.2%
Chief of Defence Force Fellowship 0 - 0 - 0 0.0% 1 100.0% 0 - 0 - 0 0 1 100.0%
ADFAir ForceNavy Army
Source: Navy data: Director General Navy People; Army data: Headquarters Forces Command; Air Force data: Defence Learning Branch.
Figure 22: Percentage of women in ADF sponsored study, by service and percentage of women in the workforce, 30 June 2014
34.1%
25.6%26.0%
17.3% 16.0%12.6%
18.2%
11.8%
18.6%
0%
10%
20%
30%
40%
50%
60%
70%
80%
90%
100%
Navy Army Air Force
Defence Assisted Study Scheme (DASS)
ADFA Postgraduate
Percentage Women in Service
Figure 22 shows the proportion of female ADF members undertaking study through the Defence Assisted Study Scheme and undertaking postgraduate study through the Australian Defence Force Academy (ADFA). The proportion of women in each service is also shown to give an indication of whether women are over- or under-represented in sponsored study. The proportion of women in the assisted study scheme is well above

Page 45 of 54
the proportion of women in the workforce for all services, indicating that women are over-represented. The proportion of women undertaking ADFA postgraduate study is approximately the same as the proportion of women in the workforce for each service. Lower female participation in ADFA postgraduate study is influenced by the nature of ADFA postgraduate courses, which focus on engineering, information technology and science— fields predominantly filled by men.
Access to flexible working arrangements
Access to flexible work is crucial to a member’s ability to continue working and thriving in Defence, allowing them to fulfil their work responsibilities while fulfilling family or other commitments. This extends not only to parents, but to all Defence men and women who have responsibilities beyond the workplace. Flexible work availability for men is just as important, as enabling couples to share family responsibilities reduces the disproportionate career impact on women. This section presents attitudinal data on flexible work practices, followed by some indicative figures on these practices, including ADF members on part-time leave without pay. While formal monitoring and reporting mechanisms for flexible work are not yet fully mature, each of the services has interim reporting solutions. That data is presented towards the end of this section.
In addition to the services’ programs to encourage and monitor a range of flexible working arrangements, Defence has developed Suakin, a whole-of-Defence Total Workforce Employment Model designed to contribute to capability by giving Defence the strategic flexibility to manage the workforce. While Defence has supported access to flexible employment arrangements, Suakin aims to move those arrangements from individual and localised agreements to a more enduring solution. This will entail offering casual, part-time and full-time work options, allowing Defence to draw on both the permanent and Reserve workforce components more flexibly, with much more mobility between them.
Table 25 outlines attitudes to flexible work, and tables 26 to 29 provide details of formalised Flexible Work Arrangements (FWAs) for each of the Services. This information is presented in support of the Broderick review’s phase 2, recommendation 3, section C, ‘Access to flexible work’.
Table 25: YourSay surveys (October 2013 and February 2014)—responses on flexible work, by service and gender[1][2][3][4][5][6]
YourSay SurveyWomen Men Women Men Women Men Women Men
My CO / Branch Manager actively supports work-life balance and flexible work arrangements (% Agree/Strongly Agree)
62.2% 56.6% 64.9% 53.3% 73.8% 62.0% 67.1% 56.8%
My supervisor is flexible when I have personal demands to attend to (% Agree/Strongly Agree)
81.6% 81.9% 80.2% 79.4% ▲86.4% 86.5% 82.7% 82.1%
If I accessed flexible working arrangements (such as working part time) my career progression would be negatively impacted (% Agree/Strongly Agree)
43.8% 41.2% 47.7% 48.1% 33.8% 40.4% 41.9% 44.1%
Are flexible working arrangements available in your area (e.g. part-time work, home-based work)? (% Yes)
▲52.2% 38.6% 56.9% ▲36.0% 64.5% 43.3% 58.0% 38.8%
How often do you personally take advantage of documented (or formal) flexible work arrangements? (% Sometimes - Always)
▲31.9% 21.9% 22.9% 16.1% 32.5% 18.1% 28.8% 18.1%
How often do you personally take advantage of informal flexible work arrangements (such as leaving work early?) (% Sometimes - Always)
▲72.9% 61.1% 66.5% 57.0% ▲69.2% 63.4% ▲69.3% 59.9%
Navy Total ADFAir ForceArmy
Source: YourSay Survey, October 2013 and February 2014. Notes 1. Data includes responses from ADF personnel. 2. Cells highlighted in green indicate that 2013–14 responses were significantly more positive than in 2012–13. 3. Cells highlighted in red indicate that 2013–14 responses were significantly less positive than in 2012–13. 4. An upward-pointing arrow indicates that responses were significantly higher in 2013–14 than in 2012–13 (but may be
positive or negative, depending on the wording of the question).

Page 46 of 54
5. A downward-pointing arrow indicates that responses were significantly lower in 2013–14 than in 2012–13 (but may be positive or negative, depending on the wording of the question).
6. Differences are based on statistical significance (p < .05) and measure of association (Cramer’s V > 0.1).
Figure 23: Percentages of ADF women and men responding positively to YourSay items about flexible work, 2013–14
18.1%
44.1%
38.8%
56.8%
59.9%
82.1%
28.8%
41.9%
58.0%
67.1%
▲69.3%
82.7%
0% 10% 20% 30% 40% 50% 60% 70% 80% 90% 100%
How often do you personally take advantage ofdocumented (or formal) flexible work arrangements? (%
Sometimes - Always)
If I accessed flexible working arrangements (such asworking part time) my career progression would be
negatively impacted (% Agree/Strongly Agree)
Are flexible working arrangements available in your area(e.g. part-time work, home-based work)? (% Yes)
My CO / Branch Manager actively supports work-lifebalance and flexible work arrangements (% Agree/Strongly
Agree)
How often do you personally take advantage of informalflexible work arrangements (such as leaving work early?)
(% Sometimes - Always)
My supervisor is flexible when I have personal demands toattend to (% Agree/Strongly Agree)
Women
Men
Figure 23 shows responses to various survey questions about flexible work. Women and men equally felt that they had some flexibility in ad hoc absences to attend to personal demands. However, this was the only item in which there was no gender difference. Air Force men were more likely than Air Force women to feel that their career would be affected if they accessed flexible work. For all remaining items, in each service, women were more positive than men. This was true for actual use of flexible work, and in perceptions of how available flexible work is.
There were some changes in attitudes from 2012–13 to 2013–14, each of them an improvement. Navy women had improvements in several areas in 2013–14; they were more likely to perceive their ability to take flexible work, and subsequently more likely to use both informal and formal FWAs. Air Force women were more likely to perceive their supervisor as more flexible with work in response to ad hoc absences, and more likely to take advantage of informal FWAs. Encouragingly, men also showed some positive changes; for example, in 2013–14, Army men were more likely to state that FWAs were available in their area than they were in 2012–13.
Formalised Flexible Work Arrangements Navy
Until now, the Navy did not have a baseline understanding of the number of Navy people with approved FWA, as many arrangements were informal, based on trust and output and therefore not documented.
In order to establish a baseline for future measurement and to enable the Navy to report on its progress towards meeting the agreed FWA growth target of two per cent by

Page 47 of 54
December 2014, the Navy conducted a once-off data collection exercise to seek information from commands and establishments on the numbers of Navy people engaged in enduring (30 days or longer) formal FWAs. This represents a total of 703 Navy members, which equates to 9.3 per cent of Navy trained force members who are not currently posted to sea positions (at 30 June 2014, the total Navy trained force was 11,020, of whom 3,483 were posted to sea positions and 7,537 were posted ashore).
Table 26 shows the breakdown of the types of FWAs involved. This represents a total of 703 Navy members, which equates to 9.3 per cent of Navy trained force members who are not currently posted to sea positions (at 30 June 2014, the total Navy trained force was 11,020, of whom 3,483 were posted to sea positions and 7,537 were posted ashore).
Table 26: Navy shore-based members engaged in enduring Flexible Work Arrangements, by type, 2013–14
2013-14 FWA Occurrences Flexible Work Type as % of Total Flexible Work
Flexible Work Type % WomenAlternate Location Work 7%
Variable Work Hours 54%
Home Located Work 15%
Remote Overseas Work 1%
Part Time Leave Without Pay
11%
Workplace Release for Study
12%
Total 100% Source: Director General–Navy People.
Table 27: Navy shore-based members engaged in enduring Flexible Work Arrangements, by gender, 2013–14
2013-14 FWA Occurrences Percentage of Total Flexible Work Occurrences
Flexible Work Type %Male 55%Female 45%
Total 100% Source: Director General–Navy People.
With the exception of ships alongside for extended periods, data was not collected from sea-going units, and does not include personnel in training.
In 2013–14, 922 Navy people were involved in flexi-crewing, which is another form of FWA in the Navy. If this figure were included in the actual FWA achievement for the Navy, the percentage would be even greater. The Navy is well placed to continue to exceed the agreed FWA target through:
the implementation of the New-Generation Navy ‘Enhancing Capability through Flexibility’ project recommendations
a planned communications and education campaign about what constitutes flexibility and how to access it
the formalisation of reporting through the changes to PMKeyS reporting against this target.

Page 48 of 54
Army
Table 28: Flexible Work Arrangement Occurrences in the Army, 2013–14
2013-14 FWA Occurrences
Flexible Work Type Women Men % Women Women Men % WomenAlternate Location Work 1 3 25.0% 3 3 50.0%
Variable Work Hours 35 58 37.6% 2 5 28.6%
Home Located Work 2 8 20.0% 2 0 100.0%
Remote Overseas Work 2 1 66.7% 4 1 80.0%
Part Time Leave Without Pay
117 30 79.6% 105 33 76.1%
Other Ranks Officers
Source: Director General personnel—Army.
Data presented in Table 28 reflects formal FWAs only. The Army is working to develop a methodology for collecting data on informal FWAs.
The Army created a Flexible Work and Retention (FWR) cell within the Directorate of Soldier Career Management—Army (DSCM-A) in August 2013 to provide a single repository of information on FWAs. Since its inception, the FWR cell has been providing advice and information to career advisers, the chain of command and members on FWAs and assisting the Army with ideas and initiatives supporting FWA within units.
The figures in Table 28 are conservative and do not reflect the true extent of FWAs in the Army. The information gathered for this report is based on formal FWA applications that have been submitted to Career Management—Army (CM-A) indicating that a member was on an approved FWA during 2013–14. Throughout the year, CM-A maintaining a spreadsheet of all FWAs forwarded to it. Although MILPERMAN Part 7, chapter 6 requires that completed AE 406s are to be submitted for statistical purposes to CM-A, this form was not introduced until 18 March 2014. Throughout the period, the FWR cell has provided assistance to members in units to facilitate individual FWA requests.
There was a steady increase in the number of FWAs submitted over 2013–14, particularly for men who took the opportunity to secure an FWA. The FWR cell is establishing a job share group through ForceNet to enable Army personnel to locate other interested members considering part-time leave without pay and find a suitable job-share partner to negotiate and enter into a job-share FWA. The FWR cell is also investigating establishing a group on ForceNet that can provide information on FWAs to those on maternity and parental leave. The FWR cell will continue to promote FWAs throughout the Army and educate the chain of command on the requirement to forward all FWA requests through to the cell.

Page 49 of 54
Air Force
Table 29: Flexible Work Arrangement occurrences in the Air Force, 2013–14
2013-14 FWA Occurrences
Flexible Work Type Women Men % Women Women Men % WomenAlternate Location Work 8 6 57.1% 5 9 35.7%
Variable Work Hours 73 122 37.4% 39 64 37.9%
Home Located Work 18 12 60.0% 27 30 47.4%
Remote Overseas Work 3 3 50.0% 5 6 45.5%
Part Time Leave Without Pay
75 16 82.4% 60 19 75.9%
Other Ranks Officers
Source: Director General Personnel–Air Force.
Table 29 shows the take-up of FWAs in the Air Force by FWA type, rank group and gender. Among the other ranks, the proportion of women and men who undertook alternate location work and remote overseas work were approximately even in 2013–14, while more women undertook home-located work and part-time leave without pay. More men than women took advantage of variable work hours. Among officers, men comprised the majority of members who undertook most types of FWAs, with the exception of part-time leave without pay, while women comprised three-quarters (75.9 per cent) of the officers who took this type of FWA.
Broderick review’s phase 2 report, recommendations 6, 9 and 13
Recommendation 6: promotional gateways
One factor in the rate at which women are promoted is the formal preparation they receive. Participation in leadership development opportunities such as staff college and command appointments increases eligibility for promotion, and in some cases is a prerequisite. It is therefore important to ensure that women are able to participate in these opportunities. This section looks at the proportion of women engaging in such opportunities, compared with the proportion of women in the competitive pool, as defined by the Services’ Personnel Agencies. It addresses Broderick review’s phase 2, recommendation 6, which includes reporting annually against targets for participation in these gateways.
Table 30: Navy officer staff college attendance and command appointments, 2013–14[1]
2013-14
Total (Women and Men)
Women % Women Total Places/ Appointments
Women % Women
Australian Command and Staff College
60 13 21.7% 25 6 24.0%
Centre for Defence and Strategic Studies
40 10 25.0% 5 2 40.0%
Command Appointments 218 14 6.4% 65 13 20.0%
Proportion of Women in Competitive Pool
Representation of Women Achieved
Source: Director General—Navy People. Note 1. Figures are for the Permanent Naval Forces only.
Table 30 shows the proportion of women in the competitive pool for attendance at the Australian Command and Staff College (21.7 per cent) and the proportion of women who were attending the course in 2013–14 (24.0 per cent). The proportion of women attending the course was slightly higher than those in the pool from which they were selected,

Page 50 of 54
indicating that Navy women were well represented in the course. Likewise, the proportion of women attending the Centre for Defence and Strategic Studies and appointed to command was higher than in the pool from which they were selected.
Table 31: Navy other ranks promotional gateway to Petty Officer (Navy Sergeant equivalent), 2013–14
2013-14
Total (Women and Men)
Women % Women Total Places/ Appointments
Women % Women
Petty Officer Promotion Course
748 155 20.7% 191 25 13.1%
Proportion of Women in Competitive Pool
Representation of Women Achieved
Source: Director General—Navy People. Note 1. Figures are for the Permanent Naval Forces only.
Table 31 shows the proportion of women in the competitive pool for the Petty Officer promotion course (21.8 per cent) in 2013–14 and the proportion of women attending the course (21.4 per cent). The proportion of women attending the course was almost identical to the proportion of women in the competitive pool, indicating that Navy women were well represented in the course.
Table 32: Army officer staff college attendance and command appointments, 2013–14[1][2][3]
2013-14
Total (Women and Men)
Women % Women Total Places/ Appointments
Women % Women
Australian Command and Staff College
163 22 13.5% 71 7 9.9%
Centre for Defence and Strategic Studies
31 2 6.5% 10 2 20.0%
Command Appointments 168 38 22.6% 32 5 15.6%
Proportion of Women in Competitive Pool
Representation of Women Achieved
Source: Director General Personnel—Army. Notes 1. Figures are for the Australian Regular Army only. 2. Completion of the Centre for Defence and Strategic Studies is normally a prerequisite for promotion to Brigadier on
the command and leadership pathway. 3. Command appointments figures represent selections made for commanding officers in 2013 for command in 2014.
Outcomes shown in Table 32 indicate an increase in women in the competitive pool for the key developmental milestones of Australian Command and Staff College (ACSC) and command. While numbers for the Centre for Defence and Strategic Studies remained constant, this was a factor in the small cohorts that have passed through the ACSC and command milestones. The increases in female officers competing for and attending ACSC will, over time, create larger competitive pools for unit command and CDSS. It is expected that these numbers will trend upwards in the future, particularly in the medium term, with increased female participation rates.
Table 33: Army other ranks promotional gateways to rank of Sergeant, 2013–14[1][2]
2013-14
Total (Women and Men)
Women % Women Total Places/ Appointments
Women % Women
Subject 1 for Sergeant
3,470 500 14.4% 395 50 12.7%
Proportion of Women in Competitive Pool Representation of Women Achieved
Source: Director General Personnel—Army. Note 1. Subject 1 for Sergeant is a promotion course that is a prerequisite for promotion to Sergeant for all Army trades. In
addition, each trade has one or more additional trade-specific promotion training requirements. 2. Figures are for the Australian Regular Army only.
The competitive pool is inclusive of all Corporals (male and female) in the Army (Table 33). Those selected have completed prerequisite courses for consideration of attendance

Page 51 of 54
on the Subject 1 Sergeant Course. Female participation is based on merit selection. The Directorate of Soldier Career Management—Army does not have target allocations for female participation on subject courses or promotion. There is only minor variance in this area annually. The directorate works to achieve the directed training requirement set by Headquarters Forces Command each year.
Considerations for course or promotion are merit based and gender neutral, enabling all soldiers, including the most talented soldiers, to balance progressive and rewarding careers through a fair and transparent procedure. In addition, the proportion of women presented to the Sergeant Promotion Advisory Committee for career management cycle 15 was 13.8 per cent, so this was a highly competitive cohort.
Table 34: Air Force officer staff college attendance and command appointments, 2013–14[1][2][3][4][5]
2013-14
Total (Women and Men)
Women % Women Total Places/ Appointments
Women % Women
Command and Staff College -Total
845[1] 153 18.1%
Command and Staff College -Applicants
95[2] 18 18.9% 31 7 22.6%
Centre for Defence and Strategic Studies
138[3] 17 12.3% 5 0 0.0%
Command AppointmentsGroup Captain (O06) 91[4] 15 16.5% 21 1 4.8%
Wing Commander (O05) 512 72 14.1% 35 6 17.1%
Proportion of Women in Competitive Pool Representation of Women Achieved
Source: Director General Personnel—Air Force. Notes 1. Squadron Leaders with greater than two years seniority who have not completed CSC. 2. Applicants for Command and Staff College commencing in calendar year 2014. 3. Group Captains who have not completed Centre for Defence and Strategic Studies courses. 4. Group Captains less those who have already held an O06 command position (repeat command tours most unlikely). 5. Figures are for the Permanent Air Force only.
Successful completion of the Command and Staff College (CSC) course (Australian and overseas equivalent) is not a prerequisite for promotion to Wing Commander or for selection to command. Nevertheless, the achievement of this qualification favourably influences promotion and command selection.
Importantly, the Air Force has been progressively removing unnecessary barriers to promotion since 2007. Highly talented officers who may have missed out on selection to attend the CSC can still expect to be identified for promotion and command. This is evidenced by the command selections for January 2015, in which 35 officers were selected, six of whom were women, and 17 of whom had not completed CSC.
Subsequent promotion to Group Captain is influenced primarily by performance in a command role, rather than completion of CSC.
While no women were selected to attend CDSS commencing in 2013–14, three were selected to attend CDSS or an overseas equivalent commencing in 2014–15.
Table 35: Air Force other ranks promotional gateways to rank of Sergeant, 2013–14[1][2]
2013-14
Total (Women and Men)
Women % Women Total Places/ Appointments
Women % Women
Members meeting promotion conditions including Professional Military Education and Training
1,152 151 13.1% 206 39 18.9%
Proportion of Women in Competitive Pool
Representation of Women Achieved
Source: Director General Personnel—Air Force. Note

Page 52 of 54
1. Merit-based selective promotion from Corporal to Sergeant—excludes members subject to time promotion. 2. Figures are for the Permanent Air Force only.
The percentage of women presented to the Sergeant Promotion Board in 2013–14 was unchanged from 2012–13. However, the percentage of women identified for promotion in 2013–14 was significantly higher than the percentage of women considered for promotion and also represented a significant increase compared to men identified for promotion (a 5.2 per cent increase).
Female promotions to Sergeant reflect broader Air Force promotion statistics. For promotions to ranks up to and including Wing Commander, a greater proportion of women were identified for promotion than were eligible for consideration for promotion.
This was not dissimilar to results in recent years and is likely to have been a product of the positive steps taken to remove promotion barriers and reduce the potential impact of unconscious bias on promotion board outcomes. An example of this has been the deliberate inclusion of females on promotion boards since about 2003 and the recent introduction of unconscious bias awareness training for all promotion board participants. Recent attention has also been placed on recognising the importance of varied career paths and reduced emphasis on the occurrence of career breaks.
Recommendation 9: recruitment growth targets
In order to create substantial progress in the recruitment of women, each service identified and committed to a growth target for the number of women to be recruited into the service. This section outlines each service’s targets and their progress against them. This reporting addresses Broderick review’s phase 2, recommendation 9, which requires Defence to report annually against these targets. Further detail on flexible work is provided in the ‘Access to flexible work arrangements’ of this report.
Navy
The Navy has set a target of increasing the participation of women to 25 per cent by 2023. To achieve this, the Navy set recruitment goals for 2013–14, which were to recruit an additional 60 female officers and 270 female sailors. As shown in Table 5, the Navy recruited 35 female officers and 271 female sailors, which is a considerable increase from the previous year, in which 35 female officers and 186 female sailors were recruited. Female sailor recruiting goals for 2014–15 are set at approximately 27 per cent (299), which provides a potential growth of 58 on the previous year. All targets (sailor and officer) are open to females; consequently there is no upper limit on female recruitment.
Achievement against Navy recruiting targets is reported in tables 5 to 7.
Army
The Army has set a target for increasing the participation of women to 15 per cent 2023. To achieve its long-term target, it set a short-term goal of increasing the representation of women to 12 per cent by 1 July 2014. At 1 July 2014, it had achieved a representation rate of 11.8 per cent in the Australian Regular Army. A further 70 women would have been needed to achieve the target (assuming that the number of men remained constant). The Chief of Army has set a further goal of 13 per cent by 1 July 2015. The Army has extended the 10 female recruiting positions at Defence Force Recruiting for an additional 12 months (until January 2016) and continues to offer special measure recruitment mechanisms to facilitate the achievement of the 13 per cent goal. The Chief of Army is currently considering recruiting targets to enable the achievement of 13 per cent.
Achievement against Army recruiting initiatives to increase the representation of women is reported in Table 8, and overall recruiting achievement figures are reported in tables 5 to 7.

Page 53 of 54
Air Force
The Air Force is seeking to increase female representation to 25 per cent by 2023. To achieve this target, it has developed a non-linear growth path for the number of women to be recruited. This path consists of planned growth of no more than 0.5 per cent (a net increase of 70 women each year) for the first two years from 2013–14, followed by an increase of 1 per cent annually until 2022, at which point it is expected that the target of 25 per cent will have been reached.
In support of this growth path, the Air Force has implemented, or is implementing, a number of recruitment and retention initiatives, including:
specific female recruiting targets
recruit to area (where desired)
a ‘Women in the Air Force’ marketing campaign
embedding a specialist women’s recruitment team in Defence Force Recruiting
reducing the initial minimum period of service for a number of workforces
introducing a graduate pilot scheme for women
changing direct entry female pilot return of service obligations
running experiential camps for girls (technical and aircrew focused programs).
Female representation in the Air Force increased from 17.5 per cent at 30 June 2013 to 18.2 per cent at 30 June 2014, reflecting satisfactory progress against the growth target.
Achievement against Air Force recruiting initiatives to increase the representation of women is reported in Table 9, and overall recruiting achievement is reported in tables 5 to 7.
Recommendation 13: flexible work arrangement targets
Defence aims to increase access to FWAs to allow ADF members to balance competing work, family and other commitments. This flexibility is expected to enhance capability, so Defence is providing organisational support to facilitate greater access to FWAs. To that end, Service Chiefs have set flexible work arrangement targets of two per cent of the trained workforce. This section reports on Defence’s FWA targets and progress against them. It addresses Broderick review’s phase 2, recommendation 13, which includes reporting progress against flexible work targets.
Navy
The number of Navy people on FWAs is 703, which is 9.3 per cent of the Navy’s predominantly non-seagoing trained force.
Army
Table 36: Army officer women and men on Flexible Work Arrangements, 2012–14
2013-14 No. on Flexible Work Arrangement
No. in Total Trained Workforce
% of Trained Workforce on
FWAWomen 82 798 10.3%
Men 37 4535 0.8%
Total 119 5333 2.2% Source: Director General personnel—Army.

Page 54 of 54
Table 37: Army other ranks women and men on Flexible Work Arrangements, 2013–14
2013-14 No. on Flexible Work Arrangement
No. in Total Trained Workforce
% of Trained Workforce on
FWAWomen 115 1987 5.8%
Men 79 17344 0.5%
Total 194 19331 1.0% Source: Director General Personnel—Army.
Tables 36 and 37 show the numbers of Army women and men who have accessed formal FWAs for officers and other ranks, respectively. These figures sum to a total of 313 Army members on FWAs. Out of a trained force of 24,664 for the Army, this equates to 1.3 per cent on FWAs. However, these figures are conservative and are based on formal FWA applications, which may be under-reported because the FWA application form was published only in March 2014. Attitudinal data shown in Table 25 indicates that the true extent of formal FWAs may be much higher.
Air Force
Table 38: Air Force officer women and men on Flexible Work Arrangements, 2013–14
2013-14 No. on Flexible Work Arrangement
No. in Total Trained Workforce
% of Trained Workforce on
FWAWomen 103 947 10.9%
Men 97 3801 2.6%
Total 200 4748 4.2% Source: Director General Personnel—Air Force.
Table 39: Air Force other ranks women and men on Flexible Work Arrangements, 2013–14
2013-14 No. on Flexible Work Arrangement
No. in Total Trained Workforce
% of Trained Workforce on
FWAWomen 160 1545 10.4%
Men 147 7823 1.9%
Total 307 9368 3.3% Source: Director General Personnel—Air Force.
The data shows that 507 Air Force members (formally reported and recorded in the Defence HR system and via legacy manual reporting systems) accessed flexible work in 2013–14. This constituted 3.6 per cent of the 14,116 members of the trained force and exceeded the initial FWA target of 2 per cent. Continued focus and further initiatives are expected to further improve these results in 2014–15. Anecdotal evidence suggests a considerably higher take-up of FWAs through informal arrangements.