work climate survey addendum - minnesota state … · this report was created in response to...
TRANSCRIPT

ORGANIZATIONAL EFFECTIVENESS RESEARCH GROUP
Work Climate Survey Addendum
A Report to the Great Place to Work Taskforce
Craig Talmage, Associate Consultant Organizational Effectiveness Research Group
332 Wiecking Minnesota State University
1

Contents Executive Summary ............................................................................................................. 3
Demographic Differences ..................................................................................................... 4
Bargaining Unit Differences ........................................................................................... 4
Divisional Differences ..................................................................................................... 7
Academic Affairs Differences ........................................................................................ 11
Appendix A – Significant Differences across Bargaining Units ............................................. 18
Appendix B – Charts of Significant Bargaining Unit Differences .......................................... 21
Appendix C – Significant Differences across Divisions ......................................................... 27
Appendix D – Charts of Significant Differences across Divisions ......................................... 29
2

Executive Summary This report was created in response to questions from the Great Place to Work Task Force after the presentation of the Work Climate Survey results in January 2010. The task force asked for results to be presented in order to elucidate differences between faculty and staff persons as well as divisional differences.
This report presents differences between four bargaining units and all other units. Answers to questions of faculty and staff differences can be found in this section of this report. Bargaining units differed significantly on five subscale categories. These differences are presented and charted in this report.
This report presents differences in opinion between various divisions at MSU. Divisions that had more than 20 employees respond were included in the comparisons. Those who indicated that they had worked for multiple departments were not included in the comparisons. These five divisions compared significantly differed across five subscale categories.
This report presents differences between academic affairs units and colleges at MSU. Colleges and units that had more than 20 employees respond were included in the comparisons. Eight groups eligible for comparison significantly differed across all nine subscale categories.
The appendices in this report contain significant differences and charts of group differences across individual items. Further analyses may be provided upon request.
3

Demographic Differences
Bargaining Unit Differences
The dataset was split into five groups to compare bargaining units. The largest bargaining units were IFO (n = 359), followed by AFSCME (n = 165), MSUAASF (n = 103), and MAPE (n = 55). Those who identified other bargaining units (n = 51) were placed into another group for comparison.
These five groups significantly differed across five subscale categories and seventeen individual items. Differences between specific bargaining units are provided in the table below. Appendix A and B provides a list and charts of items that significantly differed across bargaining units.
Table 1.A. Bargaining Unit Differences
Scale Bargaining Unit Mean Standard DeviationLearning, Growth, and Achievement AFSCME 12.987 2.336 F(4, 695) = 2.712, p < .05 IFO 13.389 2.439 No individual significant differences MAPE 12.712 2.508
MSUAASF 13.710 2.212 Other 13.702 1.977 Total 13.314 2.373
Feedback and Recognition AFSCME 15.260 2.565 F(4, 642) = 5.792, p < .001 IFO 14.207 2.849 Significant differences between AFSCME and IFO MAPE 14.875 2.614 Significant differences between IFO and Other MSUAASF 14.337 3.005
Other 15.640 2.164 Total 14.624 2.789
Interpersonal Relationships AFSCME 13.537 2.345 F(4, 587) = 3.242, p < .05 IFO 14.431 2.686 Significant differences between AFSCME and IFO MAPE 14.111 2.328 Significant differences between AFSCME and MSUAASF MSUAASF 14.604 2.679
Other 14.500 2.368 Total 14.255 2.593
Client Relationship AFSCME 9.553 1.457 F(4, 684) = 7.056, p < .001 IFO 10.141 1.448 Significant differences between AFSCME and IFO MAPE 10.078 1.454 Significant differences between AFSCME and MSUAASF MSUAASF 10.453 1.412
Other 9.961 1.183 Total 10.030 1.453
Overload AFSCME 11.770 2.817 F(4, 650) = 15.895, p < .001 IFO 13.902 3.017 Significant differences between AFSCME and IFO MAPE 11.846 2.600 Significant differences between AFSCME and MSUAASF MSUAASF 13.232 3.219 Significant differences between IFO and MAPE Other 12.816 2.386 Significant differences between MAPE and MSUAASF
Total 13.075 3.062 Significant differences between IFO and Other
4

Chart 1.A. Bargaining Unit Frequencies
165
7 17
359
554 21 2
10348
050
100150200250300350400
Chart 2.A. Learning Growth and Achievement
12.987 13.38912.712
13.710 13.702 13.314
0.000
2.000
4.000
6.000
8.000
10.000
12.000
14.000
16.000
AFSCME IFO MAPE MSUAASF Other Overall
Chart 3.A. Feedback and Recognition
15.26014.207 14.875 14.337
15.64014.624
0.000
2.000
4.000
6.000
8.000
10.000
12.000
14.000
16.000
18.000
AFSCME IFO MAPE MSUAASF Other Overall
5

Chart 4.A. Interpersonal Relationships
13.53714.431 14.111 14.604 14.500 14.255
0.000
2.000
4.000
6.000
8.000
10.000
12.000
14.000
16.000
AFSCME IFO MAPE MSUAASF Other Overall
Chart 5.A. Client Relationship
9.55310.141 10.078 10.453 9.961 10.030
0.000
2.000
4.000
6.000
8.000
10.000
12.000
AFSCME IFO MAPE MSUAASF Other Overall
Chart 6.A. Role Overload
11.770
13.902
11.84613.232 12.816 13.075
0.000
2.000
4.000
6.000
8.000
10.000
12.000
14.000
16.000
AFSCME IFO MAPE MSUAASF Other Overall
6

Divisional Differences
The dataset was filtered to compare divisions with more than twenty respondents. Five divisions were compared. The largest division was academic affairs (n = 443), followed by Student Affairs (n = 79), followed by Finance and Administration (n = 59), followed by Information and Technology Services (n = 36), and University Advancement (n = 25). Persons who indicated they worked for multiple departments were removed from comparisons.
These five groups significantly differed across five subscale categories and fourteen individual items. Differences between specific divisions are provided in the table below. Appendix C and D provides a list and charts of items that significantly differed across divisions.
Table 1.A. One‐Way ANOVA Comparison of Divisions
Scale Division Mean Standard Deviation
Learning, Growth, and Achievement Academic Affairs 13.506 2.355 F(4, 609) = 2.064, p < .1 Finance and Administration 13.143 2.153No individual significant differences Information Technology 12.500 2.5264 = Strongly Disagree, 8 = Disagree, Student Affairs 13.000 2.58212 = Agree,16 = Strongly Agree University Advancement 13.375 2.499
Overall 13.347 2.391Interpersonal Relationships Academic Affairs 14.453 2.558F(4, 514) = 2.806, p < .05 Finance and Administration 13.787 2.528No individual significant differences Information Technology 13.375 2.3525 = Strongly Disagree, 10 = Disagree Student Affairs 14.657 2.81515 = Agree, 20 = Strongly Agree University Advancement 13.409 2.239
Overall 14.308 2.584Accountability/Responsibility Academic Affairs 9.651 1.694F(4, 596) = 2.153, p < .1 Finance and Administration 9.509 1.764Significant differences between Academic Affairs and Information Technology Information Technology 8.794 1.684 3 = Strongly Disagree, 6 = Disagree, Student Affairs 9.392 2.0229 = Agree, 12 = Strongly agree University Advancement 9.333 2.078
Overall 9.542 1.769Trust Academic Affairs 14.323 2.945F(4, 553) = 2.360, p < .1 Finance and Administration 13.774 2.833No individual significant differences Information Technology 12.867 3.026 5 = Strongly Disagree, 10 = Disagree, Student Affairs 14.096 2.92115 = Agree, 20 = Strongly Agree University Advancement 13.375 3.360
Overall 14.122 2.968Overload Academic Affairs 13.579 3.104F(4, 564) = 5.602, p < .001 Finance and Administration 12.145 2.978Significant differences between Academic Affairs and Finance and Administration Information Technology 12.059 2.436 Significant differences between Academic Affairs and Information Technology Student Affairs 12.636 2.951 Significant differences between Academic Affairs and Student Affairs University Advancement 12.200 3.403 5 = Strongly Disagree, 10 = Disagree, 15 = Agree, 20 = Strongly Agree Overall 13.162 3.099
7
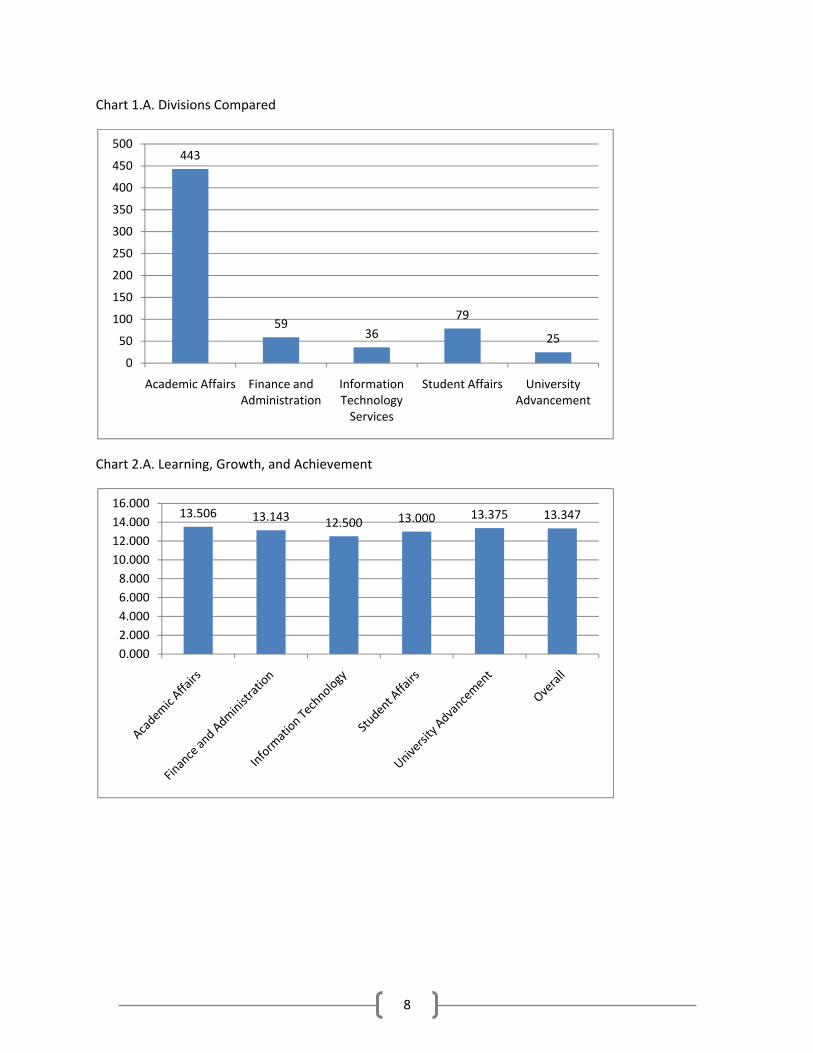
Chart 1.A. Divisions Compared
443
5936
79
25
0
50
100
150
200
250
300
350
400
450
500
Academic Affairs Finance and Administration
Information Technology Services
Student Affairs University Advancement
Chart 2.A. Learning, Growth, and Achievement
13.506 13.143 12.500 13.000 13.375 13.347
0.0002.0004.0006.0008.000
10.00012.00014.00016.000
8

Chart 3.A. Interpersonal Relationships
14.453 13.787 13.37514.657
13.409 14.308
0.0002.0004.0006.0008.000
10.00012.00014.00016.000
Chart 4.A. Accountability/Responsibility
9.651 9.5098.794 9.392 9.333 9.542
0.000
2.000
4.000
6.000
8.000
10.000
12.000
9

Chart 5.A. Trust
14.323 13.774 12.86714.096 13.375 14.122
0.0002.0004.0006.0008.000
10.00012.00014.00016.000
Chart 6.A. Overload
13.57912.145 12.059 12.636 12.200
13.162
0.0002.0004.0006.0008.000
10.00012.00014.00016.000
10

Academic Affairs Differences
The dataset was filtered to compare academic affairs units and colleges with more than twenty respondents. Eight colleges were compared. The largest college was academic Science, Engineering, and Technology (n = 83), followed by Social and Behavioral Sciences (n = 78), followed by Arts and Humanities (n = 73), followed by Allied Health and Nursing (n = 72), followed by Education (n = 54), followed by Library Services (n = 35), followed by Office of Academic Affairs (n = 29), and Business (n = 26).
These eight groups significantly differed across all nine subscale categories. Differences between specific divisions are provided in the table below.
Table 1.A. Academic Affairs Unit and College Differences
Scales College Mean Std. DeviationLearning, Growth, and Achievement Allied Health and Nursing 13.423 2.477F(7, 420) = 3.984, p < .001 Arts and Humanities 14.100 2.1954 = Strongly Disagree, 8 = Disagree Business 13.958 2.03212 = Agree, 14 = Strongly Agree Education 14.115 2.246
Science, Engineering, and Technology 12.573 2.299Social and Behavioral Sciences 12.928 2.481Library Services 13.875 2.028Office of Academic Affairs 13.679 2.278Overall 13.456 2.359
Feedback and Recognition Allied Health and Nursing 14.763 3.109F(7, 380) = 6.551, p < .001 Arts and Humanities 15.857 2.3205 = Strongly Disagree, 10 = Disagree Business 14.450 2.13915 = Agree, 20 = Strongly Agree Education 14.767 3.077
Science, Engineering, and Technology 13.462 2.582Social and Behavioral Sciences 13.703 2.741Library Services 16.088 2.466Office of Academic Affairs 14.778 2.636Overall 14.606 2.820
Interpersonal Relationships Allied Health and Nursing 14.238 2.662F(7, 349) = 2.708, p < .05 Arts and Humanities 15.373 2.4705 = Strongly Disagree, 10 = Disagree Business 14.333 2.14215 = Agree, 20 = Strongly Agree Education 14.714 2.907
Science, Engineering, and Technology 13.721 2.050Social and Behavioral Sciences 14.230 2.895Library Services 14.522 2.609Office of Academic Affairs 13.826 2.146Overall 14.378 2.573
Accountability/Responsibility Allied Health and Nursing 9.671 1.901F(7, 406) = 2.346, p < .05 Arts and Humanities 10.175 1.5083 = Strongly Disagree, 6 = Disagree Business 9.375 1.2459 = Agree, 12 = Strongly Agree Education 9.979 1.744
Science, Engineering, and Technology 9.198 1.382Social and Behavioral Sciences 9.354 1.996Library Services 9.514 1.669Office of Academic Affairs 9.464 1.856Overall 9.597 1.713
11

Job Itself Allied Health and Nursing 13.214 1.895F(7, 423) = 3.211, p < .01 Arts and Humanities 13.444 1.5825 = Strongly Disagree, 10 = Disagree Business 13.240 1.64015 = Agree, 20 = Strongly Agree Education 13.327 1.725
Science, Engineering, and Technology 12.354 1.828Social and Behavioral Sciences 12.583 1.882Library Services 12.938 1.831Office of Academic Affairs 12.690 1.911Overall 12.942 1.826
Client Relationship Allied Health and Nursing 10.338 1.352F(7, 412) = 2.985, p < .01 Arts and Humanities 10.441 1.4903 = Strongly Disagree, 6 = Disagree Business 9.591 1.5939 = Agree, 12 = Strongly Agree Education 10.481 1.180
Science, Engineering, and Technology 9.645 1.430Social and Behavioral Sciences 10.027 1.443Library Services 10.000 1.693Office of Academic Affairs 10.259 1.228Overall 10.124 1.442
Trust Allied Health and Nursing 13.969 3.366F(7, 377) = 4.739, p < .001 Arts and Humanities 15.667 2.2505 = Strongly Disagree, 10 = Disagree Business 14.455 2.13215 = Agree, 20 = Strongly Agree Education 14.894 3.178
Science, Engineering, and Technology 13.110 2.654Social and Behavioral Sciences 13.758 3.082Library Services 14.345 2.729Office of Academic Affairs 14.520 2.201Overall 14.255 2.915
Innovation Allied Health and Nursing 9.265 1.858F(7, 404) = 3.634, p < .001 Arts and Humanities 9.779 1.4023 = Strongly Disagree, 6 = Disagree Business 9.333 1.2379 = Agree, 12 = Strongly Agree Education 9.510 1.861
Science, Engineering, and Technology 8.684 1.573Social and Behavioral Sciences 8.843 1.847Library Services 9.727 1.464Office of Academic Affairs 9.519 1.282Overall 9.252 1.683
Overload Allied Health and Nursing 13.712 3.163F(7, 376) = 1.742, p < .1 Arts and Humanities 13.172 2.9685 = Strongly Disagree, 10 = Disagree Business 12.905 3.04815 = Agree, 20 = Strongly Agree Education 13.698 2.980
Science, Engineering, and Technology 14.244 3.280Social and Behavioral Sciences 13.846 3.304Library Services 12.375 2.446Office of Academic Affairs 12.929 3.196
Overall 13.547 3.128
12

Chart 1.A. Learning, Growth, and Achievement
13.423 14.100 13.958 14.11512.573 12.928
13.875 13.679 13.456
0.000
2.000
4.000
6.000
8.000
10.000
12.000
14.000
16.000
Chart 2.A. Feedback and Recognition
14.76315.857
14.450 14.76713.462 13.703
16.08814.778 14.606
0.0002.0004.0006.0008.000
10.00012.00014.00016.00018.000
13

Chart 3.A. Interpersonal Relationships
14.23815.373
14.333 14.71413.721 14.230 14.522 13.826 14.378
0.0002.0004.0006.0008.000
10.00012.00014.00016.00018.000
Chart 4.A. Accountability/Responsibility
9.671 10.1759.375
9.9799.198 9.354 9.514 9.464 9.597
0.000
2.000
4.000
6.000
8.000
10.000
12.000
14

Chart 5.A. Job Itself
13.214 13.444 13.240 13.32712.354 12.583 12.938 12.690 12.942
0.000
2.000
4.000
6.000
8.000
10.000
12.000
14.000
16.000
Chart 6.A. Client Relationship
10.338 10.4419.591
10.4819.645 10.027 10.000 10.259 10.124
0.000
2.000
4.000
6.000
8.000
10.000
12.000
15

Chart 7.A. Trust
13.96915.667
14.455 14.89413.110 13.758 14.345 14.520 14.255
0.0002.0004.0006.0008.000
10.00012.00014.00016.00018.000
Chart 8.A. Innovation
9.265 9.779 9.333 9.5108.684 8.843
9.727 9.519 9.252
0.000
2.000
4.000
6.000
8.000
10.000
12.000
16

Chart 9.A. Overload
13.712 13.172 12.90513.698 14.244 13.846
12.375 12.929 13.547
0.000
2.000
4.000
6.000
8.000
10.000
12.000
14.000
16.000
17

Appendix A – Significant Differences across Bargaining Units Items
Bargaining Unit Mean
Standard Deviation
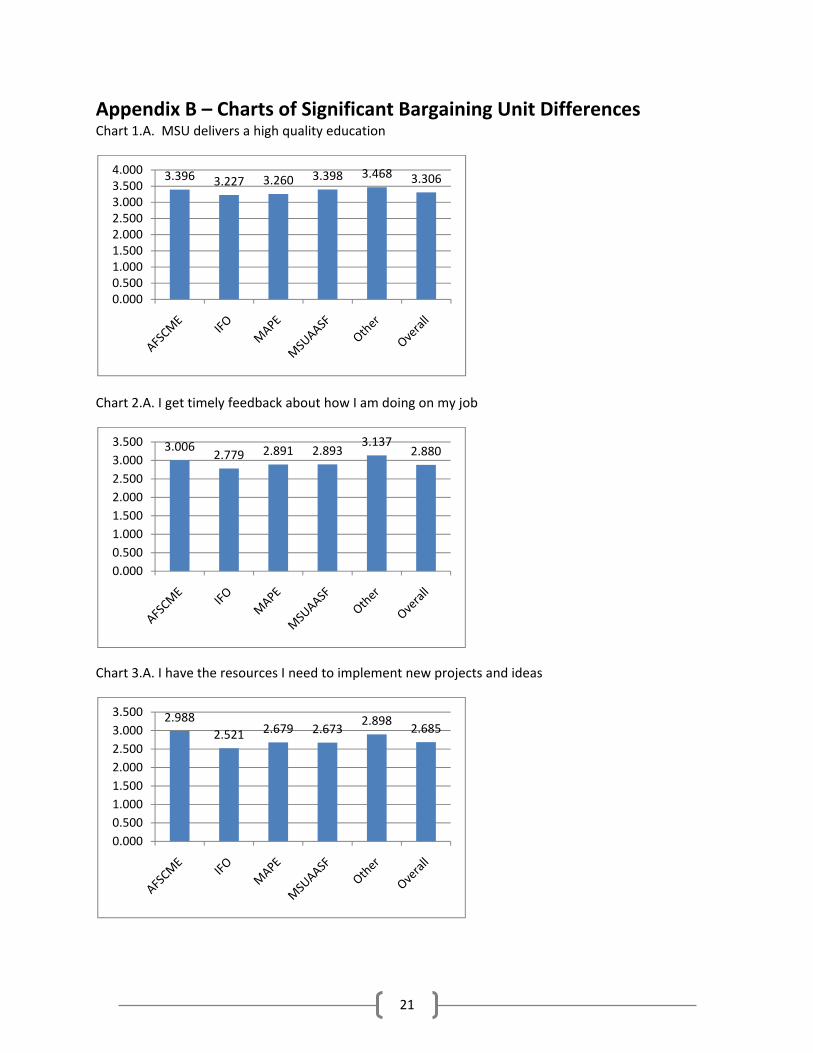
MSU delivers a high quality education AFSCME 3.396 0.565 F(4, 697) = 3.444, p < .01 IFO 3.227 0.715
MAPE 3.260 0.600 MSUAASF 3.398 0.513 Other 3.468 0.546 Overall 3.306 0.644
I get timely feedback about how I am doing on my job AFSCME 3.006 0.823 F(4, 719) = 3.396, p < .01 IFO 2.779 0.861
MAPE 2.891 0.786 MSUAASF 2.893 0.873 Other 3.137 0.722 Overall 2.880 0.845
I have the resources I need to implement new projects or ideas AFSCME 2.988 0.764 F(4, 715) = 8.894, p < .001 IFO 2.521 0.903
MAPE 2.679 0.956 MSUAASF 2.673 0.884 Other 2.898 0.743 Overall 2.685 0.884
My work has a positive effect on peoples' lives AFSCME 3.374 0.609 F(4, 718) = 9.224, p < .001 IFO 3.621 0.514
MAPE 3.426 0.633 MSUAASF 3.733 0.508 Other 3.549 0.503 Overall 3.562 0.557
My work is recognized by others AFSCME 3.122 0.644 F(4, 725) = 3.001, p < .05 IFO 2.992 0.748
MAPE 3.182 0.669 MSUAASF 3.019 0.779 Other 3.294 0.540 Overall 3.060 0.716
I have the resources I need to do my job well AFSCME 3.135 0.671 F(4, 723) = 8.041, p < .001 IFO 2.742 0.802
MAPE 2.891 0.809 MSUAASF 2.796 0.867 Other 3.039 0.662 Overall 2.870 0.791
AFSCME 2.616 0.802
18

I am overloaded with work
F(4, 707) = 7.602, p < .001 IFO 3.040 0.884 MAPE 2.717 0.863 MSUAASF 2.970 0.842 Other 2.824 0.817 Overall 2.896 0.870
I feel I have too much responsibility at work AFSCME 2.194 0.678 F(4, 712) = 2.984, p < .05 IFO 2.389 0.823
MAPE 2.151 0.662 MSUAASF 2.307 0.718 Other 2.157 0.674 Overall 2.300 0.761
I do not have enough time to complete my tasks at work AFSCME 2.413 0.796 F(4, 715) = 8.161, p < .001 IFO 2.832 0.882
MAPE 2.436 0.811 MSUAASF 2.716 0.825 Other 2.706 0.729 Overall 2.683 0.857
I often eat lunch at my desk AFSCME 2.468 0.949 F(4, 689) = 23.688, p < .001 IFO 3.283 0.878
MAPE 2.604 0.947 MSUAASF 2.980 0.980 Other 2.960 0.880 Overall 2.978 0.973
I get an annual performance evaluation AFSCME 2.957 0.728 F(4, 680) = 3.251, p < .05 IFO 2.798 0.935
MAPE 3.058 0.826 MSUAASF 2.660 0.879 Other 3.000 0.800 Overall 2.850 0.870
My department is inclusive of all people and ideas AFSCME 2.714 0.747 F(4, 704) = 3.259, p < .05 IFO 2.963 0.830
MAPE 2.764 0.793 MSUAASF 2.971 0.884 Other 2.979 0.668 Overall 2.896 0.813
I am encouraged to think creatively and raise new ideas AFSCME 2.853 0.764 F(4, 714) = 3.300, p < .05 IFO 3.037 0.778
MAPE 3.000 0.727 MSUAASF 3.088 0.822 Other 3.255 0.771 Overall 3.015 0.782
AFSCME 2.914 0.708
19

I am continuously learning interesting things
F(4, 717) = 10.758, p < .001 IFO 3.327 0.660 MAPE 3.091 0.800 MSUAASF 3.196 0.645 Other 3.271 0.644 Overall 3.194 0.698
The University administrators do what is best for MSU AFSCME 2.639 0.701 F(4, 688) = 2.639, p < .05 IFO 2.667 0.813
MAPE 2.551 0.709 MSUAASF 2.762 0.789 Other 2.980 0.595 Overall 2.688 0.768
I find my job repetitive in ways I do not enjoy AFSCME 2.098 0.711 F(4, 711) = 2.599, p < .05 IFO 1.908 0.775
MAPE 2.058 0.669 MSUAASF 1.861 0.693 Other 1.920 0.634 Overall 1.957 0.736
I can identify a specific person who directly benefits from my work. AFSCME 3.191 0.595 F(4, 709) = 2.496, p < .001 IFO 3.433 0.634
MAPE 3.407 0.599 MSUAASF 3.561 0.557 Other 3.353 0.522
Overall 3.388 0.615
20
Appendix B – Charts of Significant Bargaining Unit Differences Chart 1.A. MSU delivers a high quality education
3.396 3.227 3.260 3.398 3.468 3.306
0.0000.5001.0001.5002.0002.5003.0003.5004.000
Chart 2.A. I get timely feedback about how I am doing on my job
3.0062.779 2.891 2.893
3.1372.880
0.0000.5001.0001.5002.0002.5003.0003.500
Chart 3.A. I have the resources I need to implement new projects and ideas
2.9882.521 2.679 2.673
2.8982.685
0.0000.5001.0001.5002.0002.5003.0003.500
21
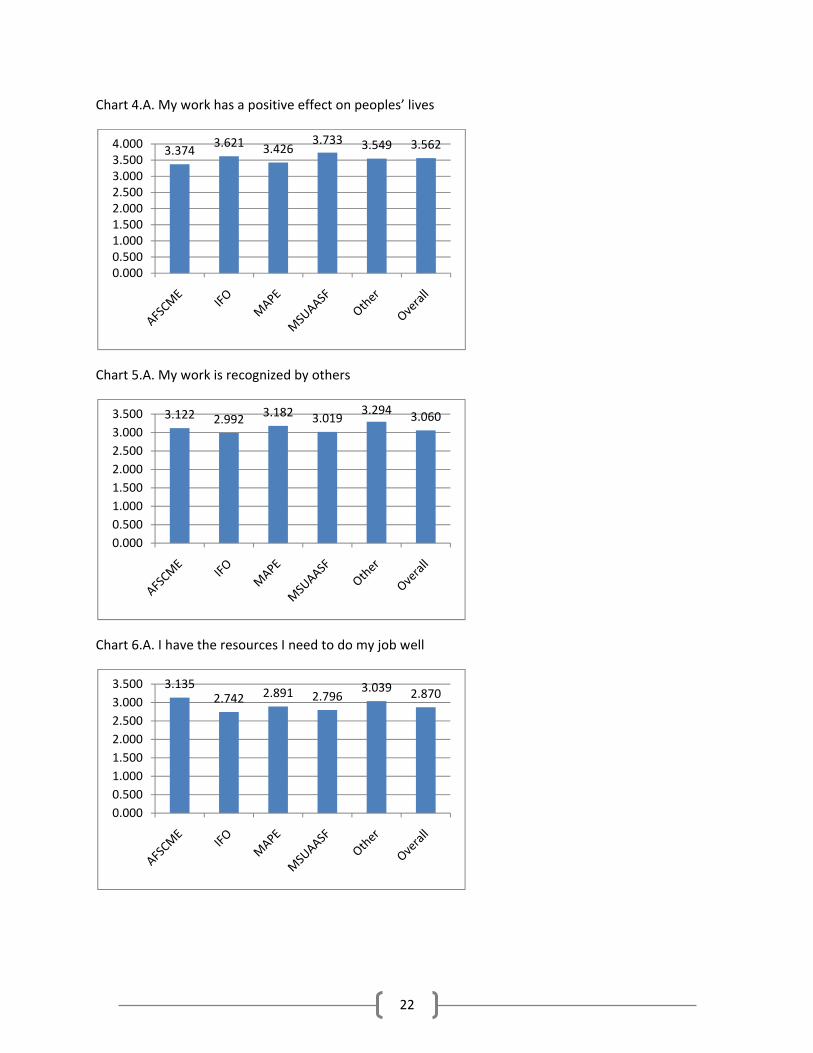
Chart 4.A. My work has a positive effect on peoples’ lives
3.3743.621 3.426
3.733 3.549 3.562
0.0000.5001.0001.5002.0002.5003.0003.5004.000
Chart 5.A. My work is recognized by others
3.122 2.992 3.182 3.0193.294 3.060
0.0000.5001.0001.5002.0002.5003.0003.500
Chart 6.A. I have the resources I need to do my job well
3.1352.742 2.891 2.796
3.039 2.870
0.0000.5001.0001.5002.0002.5003.0003.500
22
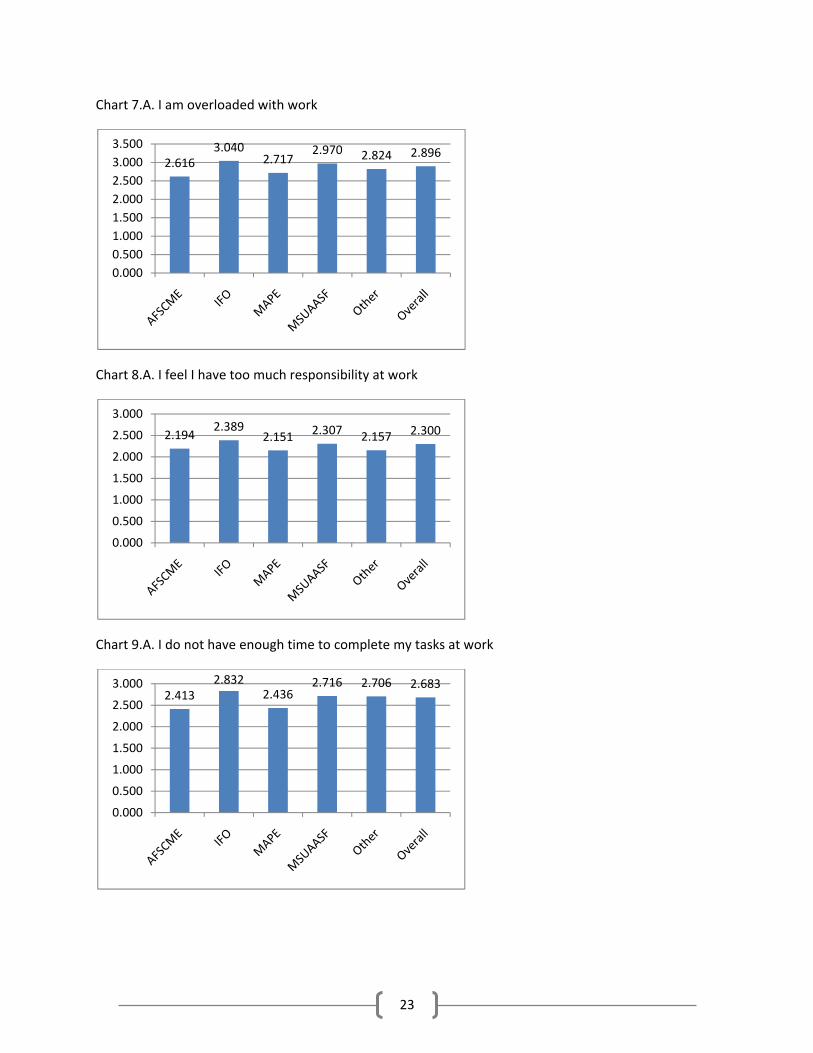
Chart 7.A. I am overloaded with work
2.6163.040
2.7172.970 2.824 2.896
0.0000.5001.0001.5002.0002.5003.0003.500
Chart 8.A. I feel I have too much responsibility at work
2.1942.389
2.151 2.307 2.157 2.300
0.000
0.500
1.000
1.500
2.000
2.500
3.000
Chart 9.A. I do not have enough time to complete my tasks at work
2.4132.832
2.4362.716 2.706 2.683
0.000
0.500
1.000
1.500
2.000
2.500
3.000
23

Chart 10.A. I often eat lunch at my desk
2.468
3.283
2.6042.980 2.960 2.978
0.0000.5001.0001.5002.0002.5003.0003.500
Chart 11.A. I get an annual performance evaluation
2.957 2.7983.058
2.6603.000 2.850
0.0000.5001.0001.5002.0002.5003.0003.500
Chart 12.A. My department is inclusive of all people and ideas
2.7142.963 2.764 2.971 2.979 2.896
0.0000.5001.0001.5002.0002.5003.0003.500
24
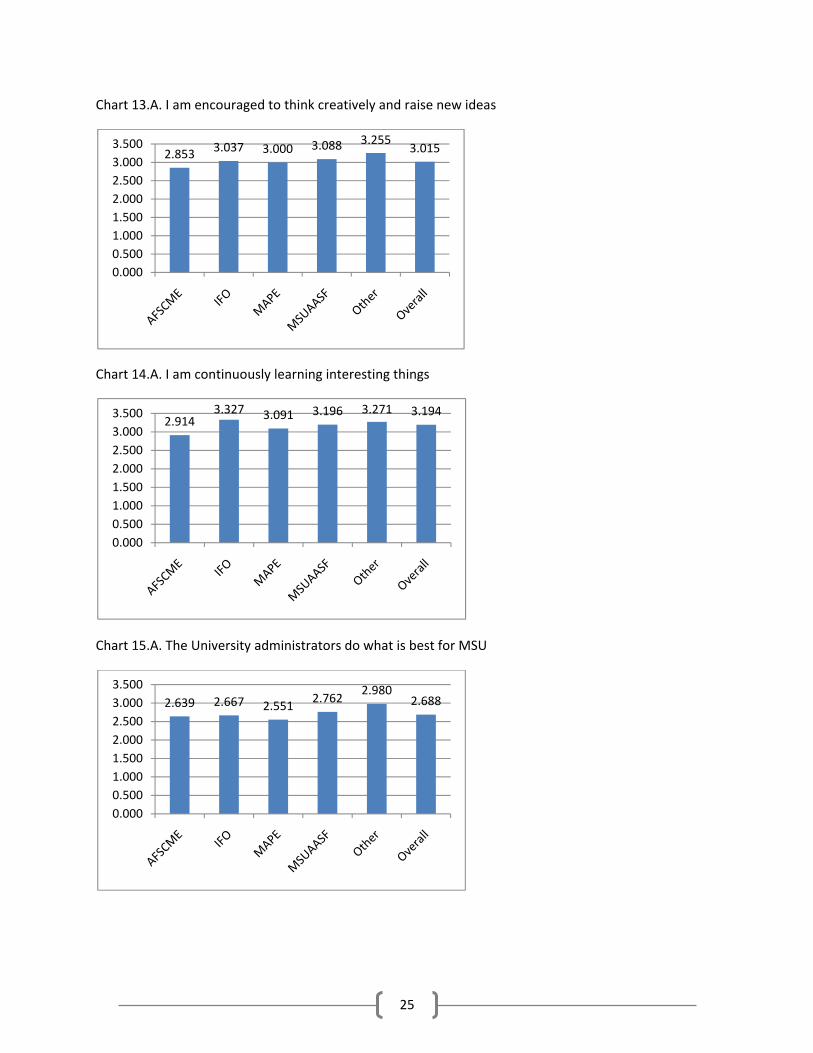
Chart 13.A. I am encouraged to think creatively and raise new ideas
2.853 3.037 3.000 3.088 3.2553.015
0.0000.5001.0001.5002.0002.5003.0003.500
Chart 14.A. I am continuously learning interesting things
2.9143.327 3.091 3.196 3.271 3.194
0.0000.5001.0001.5002.0002.5003.0003.500
Chart 15.A. The University administrators do what is best for MSU
2.639 2.667 2.5512.762
2.9802.688
0.0000.5001.0001.5002.0002.5003.0003.500
25

Chart 16.A. I find my job repetitive in ways I do not enjoy
2.0981.908
2.0581.861 1.920 1.957
0.000
0.500
1.000
1.500
2.000
2.500
Chart 17.A. I can identify a specific person who benefits from my work
3.191 3.433 3.407 3.561 3.353 3.388
0.0000.5001.0001.5002.0002.5003.0003.5004.000
26

Appendix C – Significant Differences across Divisions
Item Division Mean Std.
Deviation I have the resources I need to implement new projects or ideas Academic Affairs 2.671 0.893
F(4, 625) = 2.444, p < .05 Finance and Administration 2.862 0.661 Information Technology 2.514 0.981Student Affairs 2.870 0.908University Advancement 2.400 0.816Overall 2.694 0.883
I have the support of my immediate supervisor Academic Affairs 3.431 0.785
F(4, 630) = 2.305, p < .1 Finance and Administration 3.322 0.797 Information Technology 3.143 0.845Student Affairs 3.397 0.858University Advancement 3.042 1.042Overall 3.386 0.812
I have opportunities and resources to pursue personal and professional growth Academic Affairs 3.117 0.838
F(4, 627) = 2.615, p < .05 Finance and Administration 3.034 0.772 Information Technology 2.686 0.932Student Affairs 3.000 0.847University Advancement 2.880 0.971Overall 3.062 0.849
My input counts with my supervisors Academic Affairs 3.217 0.760
F(4, 626) = 3.158, p < .05 Finance and Administration 3.288 0.744 Information Technology 2.833 0.941Student Affairs 3.051 0.904University Advancement 2.958 0.999Overall 3.171 0.804
People I work with are held accountable for their actions Academic Affairs 2.533 0.872
F(4, 613) = 2.098, p < .1 Finance and Administration 2.526 0.758 Information Technology 2.114 0.832Student Affairs 2.584 0.817University Advancement 2.480 0.963Overall 2.513 0.860
I know what is expected of me by my supervisors Academic Affairs 3.160 0.691
F(4, 630) = 2.616, p < .05 Finance and Administration 3.169 0.673 Information Technology 2.833 0.845Student Affairs 3.244 0.724University Advancement 3.333 0.565Overall 3.159 0.703
I often eat lunch at my desk Academic Affairs 3.160 0.915
F(4, 597) = 10.083, p < .001 Finance and Administration 2.466 1.047 Information Technology 2.629 0.973Student Affairs 2.797 0.952
27

University Advancement 2.800 1.118Overall 3.000 0.974
I get an annual performance evaluation Academic Affairs 2.853 0.893
F(4, 585) = 2.122, p < .1 Finance and Administration 2.732 0.820 Information Technology 2.800 0.994Student Affairs 2.622 0.855University Advancement 3.160 0.850Overall 2.822 0.890
My department is inclusive of all people and ideas Academic Affairs 2.981 0.791
F(4, 613) = 6.383, p < .001 Finance and Administration 2.722 0.738 Information Technology 2.429 0.739Student Affairs 2.962 0.844University Advancement 2.520 0.918Overall 2.906 0.810
I am continuously learning interesting things Academic Affairs 3.276 0.666
F(4, 629) = 2.971, p < .05 Finance and Administration 3.053 0.718 Information Technology 3.056 0.860Student Affairs 3.076 0.694University Advancement 3.208 0.658Overall 3.216 0.690
People in my department follow through with their commitments Academic Affairs 2.923 0.679
F(4, 618) = 2.720, p < .05 Finance and Administration 2.737 0.720 Information Technology 2.583 0.692Student Affairs 2.872 0.745University Advancement 2.800 0.764Overall 2.875 0.699
My supervisor looks out for the best interests of his/her employees Academic Affairs 3.165 0.821
F(4, 616) = 4.286, p < .01 Finance and Administration 2.864 0.840 Information Technology 2.771 0.942Student Affairs 3.089 0.865University Advancement 2.720 1.137Overall 3.087 0.859
I have input on decisions that affect me Academic Affairs 3.030 0.729
F(4, 627) = 3.579, p < .01 Finance and Administration 2.914 0.708 Information Technology 2.571 0.739Student Affairs 3.038 0.808University Advancement 2.840 0.850Overall 2.987 0.749
There are opportunities in my department to celebrate Academic Affairs 3.014 0.724
F(4, 614) = 2.958, p < .05 Finance and Administration 2.825 0.759 Information Technology 2.853 0.744Student Affairs 3.160 0.736University Advancement 2.720 0.891
Overall 2.994 0.742
28

Appendix D – Charts of Significant Differences across Divisions Chart 1.A. I have the resources I need to implement new projects or ideas
2.671 2.8622.514
2.8702.400
2.694
0.0000.5001.0001.5002.0002.5003.0003.500
Chart 2.A. I have the support of my immediate supervisor
3.431 3.322 3.143 3.3973.042
3.386
0.0000.5001.0001.5002.0002.5003.0003.5004.000
Chart 3.A. I have the opportunities and resources to pursue personal and professional growth
3.117 3.0342.686
3.000 2.880 3.062
0.0000.5001.0001.5002.0002.5003.0003.500
29

Chart 4.A. My input counts with my supervisors
3.217 3.2882.833 3.051 2.958 3.171
0.0000.5001.0001.5002.0002.5003.0003.500
Chart 5.A. People I work with are held accountable for their actions
2.533 2.5262.114
2.584 2.480 2.513
0.0000.5001.0001.5002.0002.5003.000
Chart 6.A. I know what is expected of me by my supervisors
3.160 3.1692.833
3.244 3.333 3.159
0.0000.5001.0001.5002.0002.5003.0003.500
30

Chart 7.A. I often eat lunch at my desk
3.160
2.466 2.629 2.797 2.800 3.000
0.0000.5001.0001.5002.0002.5003.0003.500
Chart 8.A. I get an annual performance evaluation
2.852 2.732 2.800 2.6223.160
2.822
0.0000.5001.0001.5002.0002.5003.0003.500
Chart 9.A. My department is inclusive of all people and ideas
2.981 2.7222.429
2.9622.520
2.906
0.0000.5001.0001.5002.0002.5003.0003.500
31

Chart 10.A. I am continuously learning new things
3.276 3.053 3.056 3.076 3.208 3.216
0.0000.5001.0001.5002.0002.5003.0003.500
Chart 11.A. People in my department follow through with their commitments
2.923 2.737 2.5832.872 2.800 2.875
0.0000.5001.0001.5002.0002.5003.0003.500
Chart 12.A. My supervisor looks out for the best interests of his/her employees
3.1652.864 2.771
3.0892.720
3.087
0.0000.5001.0001.5002.0002.5003.0003.500
32
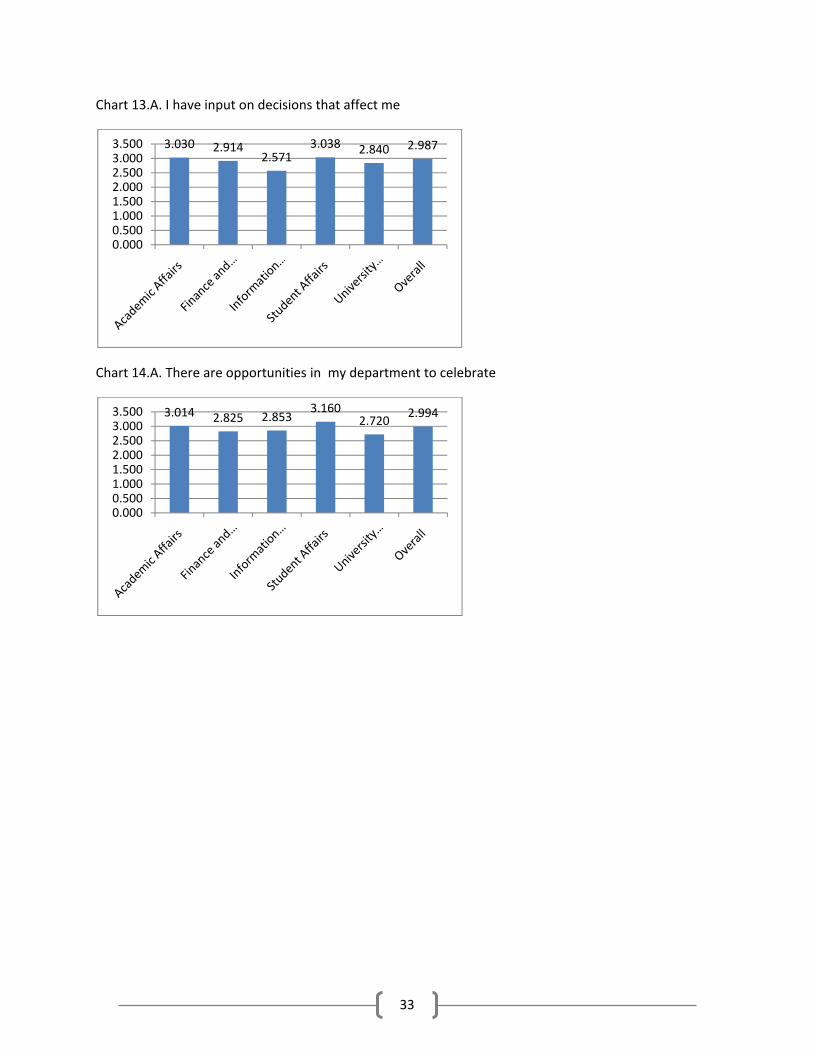
Chart 13.A. I have input on decisions that affect me
3.030 2.9142.571
3.038 2.840 2.987
0.0000.5001.0001.5002.0002.5003.0003.500
Chart 14.A. There are opportunities in my department to celebrate
3.014 2.825 2.8533.160
2.7202.994
0.0000.5001.0001.5002.0002.5003.0003.500
33