work-hardening mechanism in high-nitrogen austenitic
TRANSCRIPT
Work-Hardening Mechanism in High-Nitrogen Austenitic Stainless Steel+1
Takuro Masumura1,+2, Yuki Seto2,+3, Toshihiro Tsuchiyama1,3 and Ken Kimura4
1Research Center for Steel, Kyushu University, Fukuoka 819-0395, Japan2Graduate School of Engineering, Kyushu University, Fukuoka 819-0395, Japan3Department of Materials Science and Engineering, Kyushu University, Fukuoka 819-0395, Japan4Titanium & Stainless Steel Research Lab., Steel Research Laboratories, NIPPON STEEL CORPORATION, Chiba 293-8511, Japan
The remarkably high work-hardening rate in high-nitrogen austenitic stainless steels is generally believed to be due to the promotion ofdislocation accumulation by nitrogen addition. However, analysis of dislocation accumulation behavior by the modified Williamson-Hall/Warren-Averbach method reveals that no difference to the increment of the dislocation density during deformation exists between austeniticsteels with and without nitrogen. Since cross slipping is markedly suppressed in high-nitrogen steels, the moving dislocations are back-stressedby the planar dislocation arrays. This induces the deformation resistance and the high work-hardening rate.[doi:10.2320/matertrans.H-M2020804]
(Received November 1, 2019; Accepted January 21, 2020; Published March 25, 2020)
Keywords: austenitic stainless steel, dislocation density, planar dislocation array, nitrogen, mWH/WA method
1. Introduction
Nitrogen (N), one of the alloying elements for steel, isused with the aim of improving the material’s corrosionresistance,1) austenitic stability,25) and its mechanicalstrength. In austenitic stainless steel with low yield stress,N is recognized as an effective alloying element for solidsolution strengthening69) and increasing the work-hardeningrate.913) However, the mechanism for this strengthening byN has been unclear. Though some researchers have explainedthat I-S (interstitial-substitutional) pairs or short-range order(SRO),1416) which consisted of substitutional elements, suchas Cr and Mo, and the interstitial element, N, could cause thehigh yield stress in high-N austenites, no one has confirmedtheir atomic arrangement and structure.
The work-hardening behavior has been discussed in termsof the unique dislocation arrangement developed in high-Naustenitic steel. In high-N steels, it is well known thatdislocations are aligned on the same slip plane, because crossslipping is remarkably suppressed.10,12,17) Such a dislocationstructure is called a planar dislocation array. The reason whyplanar dislocation array develops is not clear but is generallyexplained by the presence of SRO. The SRO is thought toeffectively behave as a barrier to dislocation movement, butonce the SRO is cut by dislocation passage, subsequentdislocation can easily move and is concentrated on thespecific slip system, which results in the planar dislocationarrangement.18) Kubota et al.10) observed the Lomer-Cottrellsessile dislocation formed by crossing of planar dislocationsand suggested that increases of the sessile dislocations duringdeformation increases the work-hardening rate because thesessile dislocation act as the barrier to dislocation movement.In addition, suppression of the cross slipping and formation ofthe sessile dislocations is considered effective for promotion
of dislocation accumulation, and thus dislocation density indeformed high-N austenites is expected to be high.1012)
However, no prior research has quantitatively evaluateddislocation density of high-N austenitic steel. This is becauseit was difficult to estimate dislocation density in austeniticstainless steels. Direct observation using TEM is one of themethods capable of measuring dislocation density, but it isextremely difficult to identify each dislocation and to countthem all in a strained austenite where dislocation density canbe over 1015m¹2. Therefore, the Williamson-Hall (WH)method,19) which estimates the dislocation density from thefull-width at half-maximum (FWHM) and diffraction angleof X-ray diffraction (XRD) peaks, has often been applied.Micro strain (¾) obtained by the WH method can be easilyconverted to dislocation density: for example, μ = 9.3 ©(¾/b)2 in ferritic steels20) (μ: dislocation density [m¹2], b:magnitude of the Burgers vector [m]). This method isapplicable only when there are some diffraction planes withlow elastic anisotropy, such as in ferritic steels. However, itis difficult to evaluate dislocation density when the elasticmodulus of each diffraction plane is significantly different,such as in austenitic stainless steel with FCC structure,because ¾ cannot be calculated accurately. On the otherhand, the modified Williamson-Hall/Warren-Averbach(mWH/WA) method21) was recently proposed, including acontrast factor (the correction parameter for the elasticanisotropy in each diffraction plane). This method enablesthe exact evaluation of the dislocation density for metallicmaterials with large elastic anisotropy, like austeniticstainless steels. Although the mWH/WA method is morecomplicated than the WH method, the mWH/WA method isvery useful to discuss the relationship between dislocationstructure and the dislocation strengthening mechanism inmetallic materials because it can quantitatively evaluate notonly dislocation density but also dislocation characterizationand arrangement. In addition, a direct observation ofdislocation distribution and stress field generated bydislocation using SEM, TEM and the EBSD-Wilkinsonmethod22,23) would also informative to understand the work-hardening mechanism in high-N austenitic stainless steels.
+1This Paper was Originally Published in Japanese in J. Jpn. Soc. HeatTreat. 59 (2019) 222229. In this article, we have used the expressions of‘High-N steel’ and ‘Low-N steel’ instead of ‘High N steel’ and ‘Low Nsteel’ in the original Japanese article.
+2Corresponding author, E-mail: [email protected]+3Graduate Student, Kyushu University
Materials Transactions, Vol. 61, No. 4 (2020) pp. 678 to 684©2020 The Japan Society for Heat Treatment

In this study, appropriately 0.5mass% N was added tostable austenitic stainless steel, type 316L, by solutionnitriding method, and the dislocation density and arrange-ment in the deformed specimens were quantitativelyevaluated by the mWH/WA method. In addition, EBSD-Wilkinson measurements revealed the relationship betweendislocation structure and local strain in austenite grains. Wethen discussed the effect of N on work-hardening behaviorin austenitic stainless steels.
2. Experimental Procedure
Commercially available stable austenitic stainless steel,type 316L (Fe17.6Cr12.3Ni1.19Mn0.55Si2.08Mo0.012C0.04N [mass%] alloy), was used in this study. Theplate specimens were cut with 2mm thickness and subjectedto the following two types of heat treatments. Somespecimens were solution-treated at 1473K in an Aratmosphere of 0.1MPa for 20 h, followed by water cooling(low-N steel). Solution-nitriding8) was applied to otherspecimens at 1473K in an N2 atmosphere of 0.1MPa for20 h, followed by water cooling (high-N steel). The chemicalcomposition of Ar gas was Ar > 99.999%, O2 < 2 ppm,N2 < 10 ppm, CO < 0.5 ppm, CO2 < 0.5 ppm, CH4 < 0.5ppm and H2O < 5 ppm, and that of N2 gas is N2 >99.999%, O2 < 2 ppm, CO < 1 ppm, CO2 < 1 ppm, CH4 <1 ppm and H2O < 5 ppm. These gases were purified by a gascolumn (GC-RX, Nikka Seiko, O2 < 0.002 ppm) and a drycolumn (DC-SXC, Nikka Seiko). The average N concen-tration in high-N steel measured with a Nitrogen/OxygenCombustion Analyzer (EMGA-620W, HORIBA) was 0.45mass% N, which is similar to an equilibrium concentration(0.49mass% N8)) predicted by a thermodynamics calculation.To confirm the uniform N solution in plate specimen, thehardness distribution from the sample surface to the insideis presented in Fig. 1. In high-N steel, the hardness wasremarkably increased by solid solution strengthening of Nand was almost the same value everywhere, which means thatN has uniformly distributed in the specimen.
Tensile testing was conducted at ambient temperature atan initial strain rate of 1 © 10¹3 s¹1, for the plate specimenswith gauge dimensions of 25 © 10 © 2mm (length ©
width © thickness). In some samples, tensile testing wasinterrupted at several strains within uniform deformationrange. The microstructures of the specimens were observedby field-emission scanning electron microscopy (FE-SEM: SIGMA500, Zeiss) and transmission electron mi-croscopy (TEM: JEM-2100HC (at The UltramicroscopyResearch Center, Kyushu University), JEOL). As for SEMobservations, electron-channeling contrast imaging (ECCI)was carried out by using a backscattered-electron detectoroperating at an accelerating voltage 20 kV and a workingdistance of 4.5mm. The crystallographic orientation wasmapped by means of the electron backscatter diffraction(EBSD) method using an FE-SEM. Operated at anaccelerating voltage 20 kV with a step size of 1.5 µm, thedata obtained by EBSD were analyzed using softwareprograms for automatic crystal orientation mapping (OIManalysis, TSL). Additionally, microscopic distribution ofthe elastic strain was visualized by the EBSD/Wilkinsonmethod.22,23) In-situ observation during tensile testing withinthe SEM was performed for smaller plate specimens withgauge dimensions of 10 © 2 © 1mm (length © width ©thickness). The obtained EBSD patterns were analyzed usingdedicated software (Cross Court 3.0) for mapping the elasticstrain. (The measurement conditions were an acceleratingvoltage 20 kV, a step size of 1 µm, 1©1 pixel binning, and100ms exposure.) The reference point for the strain analysiswas obtained from the solution-treated specimen withoutdistortion.
X-ray line profile analysis was performed to examinedislocation density and dislocation characterization. Thetensile-tested specimens with different strain were polishedwith sand paper and then electropolished in an acid mixture(H3PO4:CrO3 = 2:1) by more than 50 µm, in order toeliminate the effect of strained layers by grinding.24) TheX-ray diffraction measurements, with a Cu-K¡1 radiationsource (wavelength: 0.15418 nm), were carried out at 40 kVand 40mA. The rotation speed of the detector was 0.8°/min.Since obtained X-ray line profiles include the instrumentalfunction, the effect was corrected based on Voigt profileanalysis,25) using the standard materials with quite lowdislocation density (type 316L solution-treated at 1473K for3 h, followed by furnace cooling).
The mWH method21) proposed by Ungár et al. is definedas follows:
�K ¼ 0:9
Dþ
ffiffiffiffiffiffiffiffiffiffiffiffiffiffiffiffi³A2b2μ
2
rK
ffiffiffiffiC
pþOðK2CÞ (2.1)
where K = 2 sin ª/ and ¦K = 2¢ cos ª/ (: wavelength ofX-ray, ª: diffraction angle [rad.] and ¢: FWHM of diffractionpeak [rad]). In addition, D, A, O and C denote the crystallitesize, a parameter depending on the effective outer cutoffradius of dislocation, higher-order term of K
ffiffiffiffiC
p, and the
average contrast factor, respectively. The above equation,including C, considers the elastic anisotropy in a WH plot. C,obtained by the mWH method, is used in the mWA methodto estimate the dislocation density. The equations for themWA method are defined as follows:21)
lnAðLÞ ¼� lnASðLÞ � YðLÞðK2CÞ þQðK4C2Þ (2.2)
High-N steel
0 0.5 1.0 1.5 2.0Distance from the surface, d / mm
0
50
200
Vic
kers
har
dnes
s / H
V
250
150
100
Surface SurfaceCenter
Low-N steel
Fig. 1 Distribution of Vickers hardness in the thickness direction of high-and low-N steel plate specimens.
Work-Hardening Mechanism in High-Nitrogen Austenitic Stainless Steel 679
YðLÞ ¼ μ³b2
2L2 ln
Re
L
� �(2.3)
where L, A(L), AS(L), Re and Q represent the Fourier variable,the real part of the Fourier coefficient, the size Fouriercoefficient, the effective outer cutoff radius of dislocation,and a coefficient for the higher-order term of K2C,respectively. The detailed analysis procedure is described inthe references.21,2628) As a result, dislocation density μ andRe in eq. (2.3) can be calculated by the mWH/WA method.
3. Results and Discussion
3.1 Effect of nitrogen on mechanical properties anddeformation microstructure
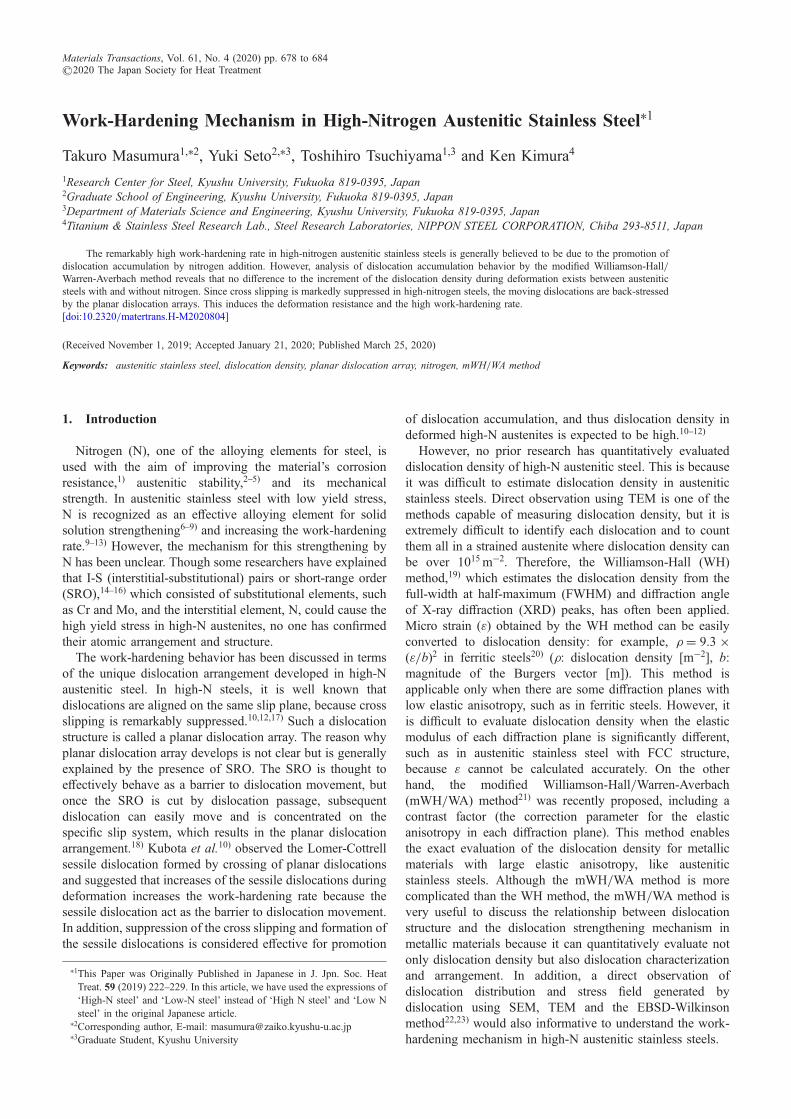
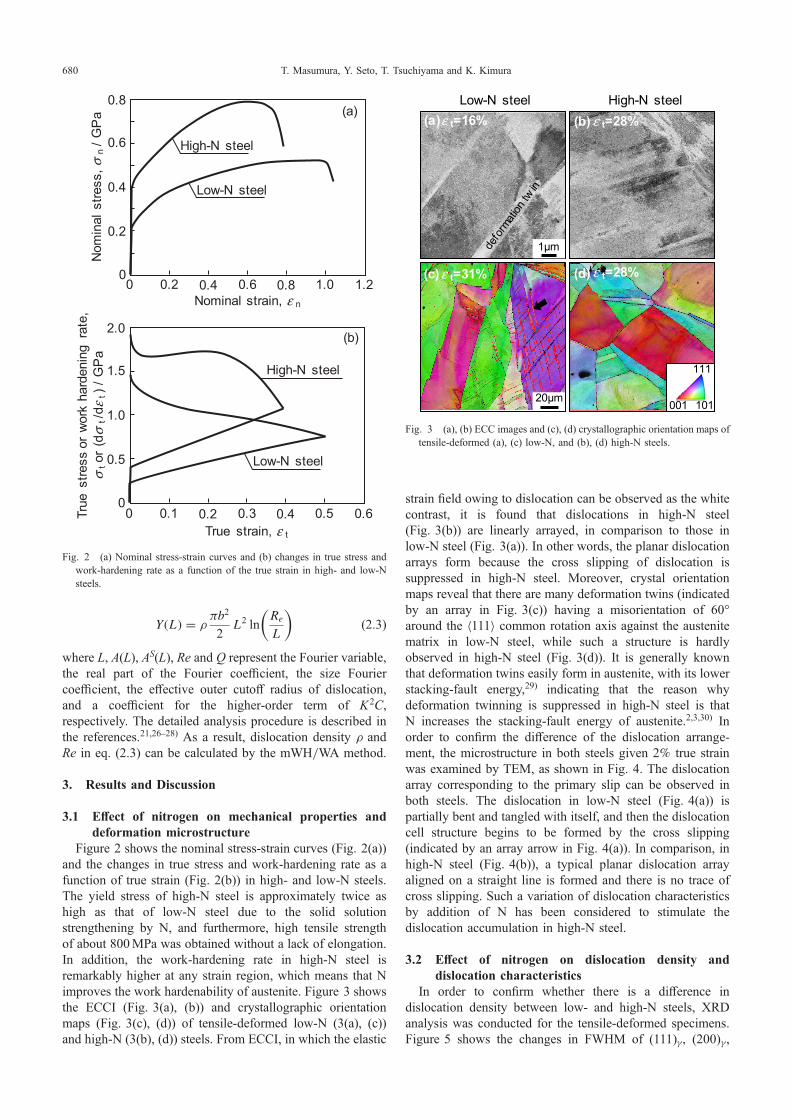
Figure 2 shows the nominal stress-strain curves (Fig. 2(a))and the changes in true stress and work-hardening rate as afunction of true strain (Fig. 2(b)) in high- and low-N steels.The yield stress of high-N steel is approximately twice ashigh as that of low-N steel due to the solid solutionstrengthening by N, and furthermore, high tensile strengthof about 800MPa was obtained without a lack of elongation.In addition, the work-hardening rate in high-N steel isremarkably higher at any strain region, which means that Nimproves the work hardenability of austenite. Figure 3 showsthe ECCI (Fig. 3(a), (b)) and crystallographic orientationmaps (Fig. 3(c), (d)) of tensile-deformed low-N (3(a), (c))and high-N (3(b), (d)) steels. From ECCI, in which the elastic
strain field owing to dislocation can be observed as the whitecontrast, it is found that dislocations in high-N steel(Fig. 3(b)) are linearly arrayed, in comparison to those inlow-N steel (Fig. 3(a)). In other words, the planar dislocationarrays form because the cross slipping of dislocation issuppressed in high-N steel. Moreover, crystal orientationmaps reveal that there are many deformation twins (indicatedby an array in Fig. 3(c)) having a misorientation of 60°around the ©111ª common rotation axis against the austenitematrix in low-N steel, while such a structure is hardlyobserved in high-N steel (Fig. 3(d)). It is generally knownthat deformation twins easily form in austenite, with its lowerstacking-fault energy,29) indicating that the reason whydeformation twinning is suppressed in high-N steel is thatN increases the stacking-fault energy of austenite.2,3,30) Inorder to confirm the difference of the dislocation arrange-ment, the microstructure in both steels given 2% true strainwas examined by TEM, as shown in Fig. 4. The dislocationarray corresponding to the primary slip can be observed inboth steels. The dislocation in low-N steel (Fig. 4(a)) ispartially bent and tangled with itself, and then the dislocationcell structure begins to be formed by the cross slipping(indicated by an array arrow in Fig. 4(a)). In comparison, inhigh-N steel (Fig. 4(b)), a typical planar dislocation arrayaligned on a straight line is formed and there is no trace ofcross slipping. Such a variation of dislocation characteristicsby addition of N has been considered to stimulate thedislocation accumulation in high-N steel.
3.2 Effect of nitrogen on dislocation density anddislocation characteristics
In order to confirm whether there is a difference indislocation density between low- and high-N steels, XRDanalysis was conducted for the tensile-deformed specimens.Figure 5 shows the changes in FWHM of (111)£ , (200)£ ,
High-N steel
0 0.2 0.6 1.0 1.2Nominal strain, ε n
0
0.2
0.6
Nom
inal
stre
ss, σ
n/G
Pa
0.8
0.4 Low-N steel
0.4 0.8
(a)
0 0.1 0.3 0.5 0.6True strain, ε t
0
0.5
1.5
True
stre
ss o
r w
ork
hard
enin
g ra
te,
σ tor
(d σ
t /d
ε t )
/ G
Pa
2.0
1.0
High-N steel
Low-N steel
0.2 0.4
(b)
Fig. 2 (a) Nominal stress-strain curves and (b) changes in true stress andwork-hardening rate as a function of the true strain in high- and low-Nsteels.
ε t=16%(a)
1μm
20μm
Low-N steel High-N steel
111
001 101
(b) ε t=28%
ε t=31%(c) ε t=28%(d)
Fig. 3 (a), (b) ECC images and (c), (d) crystallographic orientation maps oftensile-deformed (a), (c) low-N, and (b), (d) high-N steels.
T. Masumura, Y. Seto, T. Tsuchiyama and K. Kimura680
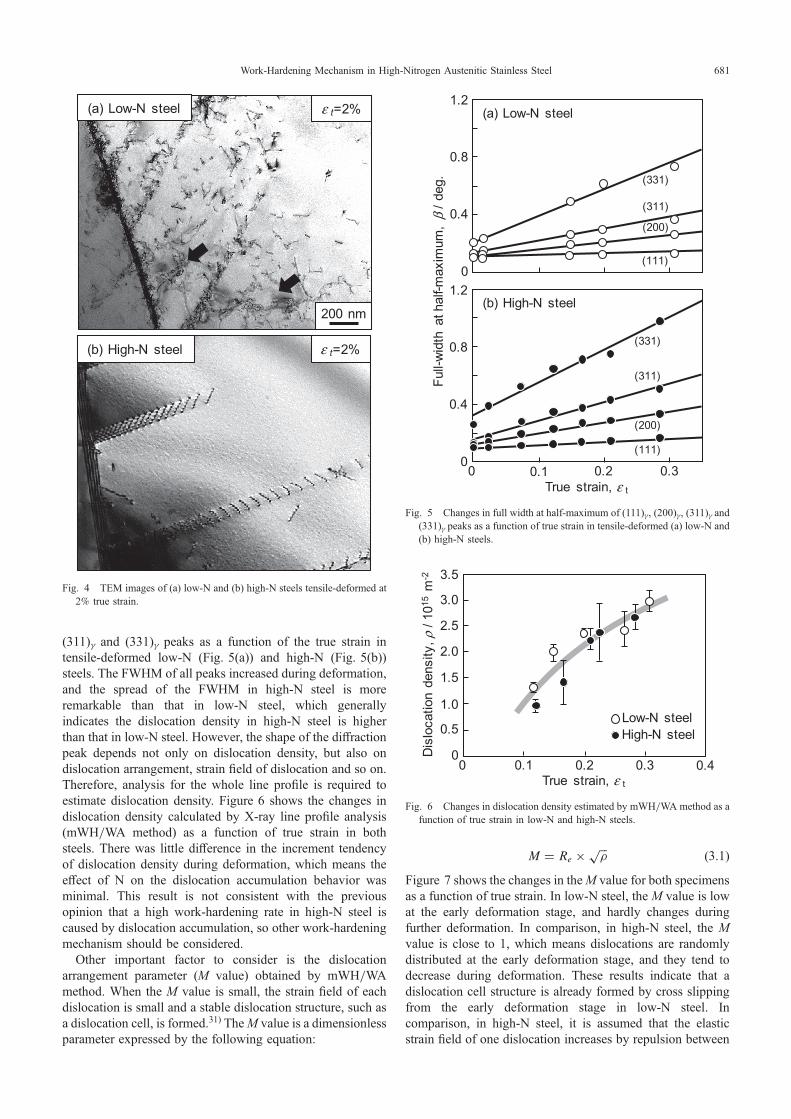
(311)£ and (331)£ peaks as a function of the true strain intensile-deformed low-N (Fig. 5(a)) and high-N (Fig. 5(b))steels. The FWHM of all peaks increased during deformation,and the spread of the FWHM in high-N steel is moreremarkable than that in low-N steel, which generallyindicates the dislocation density in high-N steel is higherthan that in low-N steel. However, the shape of the diffractionpeak depends not only on dislocation density, but also ondislocation arrangement, strain field of dislocation and so on.Therefore, analysis for the whole line profile is required toestimate dislocation density. Figure 6 shows the changes indislocation density calculated by X-ray line profile analysis(mWH/WA method) as a function of true strain in bothsteels. There was little difference in the increment tendencyof dislocation density during deformation, which means theeffect of N on the dislocation accumulation behavior wasminimal. This result is not consistent with the previousopinion that a high work-hardening rate in high-N steel iscaused by dislocation accumulation, so other work-hardeningmechanism should be considered.
Other important factor to consider is the dislocationarrangement parameter (M value) obtained by mWH/WAmethod. When the M value is small, the strain field of eachdislocation is small and a stable dislocation structure, such asa dislocation cell, is formed.31) TheM value is a dimensionlessparameter expressed by the following equation:
M ¼ Re �ffiffiffiμ
p(3.1)
Figure 7 shows the changes in theM value for both specimensas a function of true strain. In low-N steel, the M value is lowat the early deformation stage, and hardly changes duringfurther deformation. In comparison, in high-N steel, the Mvalue is close to 1, which means dislocations are randomlydistributed at the early deformation stage, and they tend todecrease during deformation. These results indicate that adislocation cell structure is already formed by cross slippingfrom the early deformation stage in low-N steel. Incomparison, in high-N steel, it is assumed that the elasticstrain field of one dislocation increases by repulsion between
ε t=2%(b) High-N steel
200 nm
ε t=2%(a) Low-N steel
Fig. 4 TEM images of (a) low-N and (b) high-N steels tensile-deformed at2% true strain.
(111)0
0.4
0.8
Full-
wid
th a
t hal
f-max
imum
, β
/ deg
.
1.2(a) Low-N steel
0 0.2 0.3True strain, ε t
0.1
(b) High-N steel
0
0.4
0.8
1.2
(111)
(200)
(200)
(311)
(311)
(331)
(331)
Fig. 5 Changes in full width at half-maximum of (111)£, (200)£ , (311)£ and(331)£ peaks as a function of true strain in tensile-deformed (a) low-N and(b) high-N steels.
0 0.1 0.2 0.3 0.40
1.0
2.5
Dis
loca
tion
dens
ity, ρ
/ 101
5m
-2 3.5
2.0
0.5
True strain, ε t
1.5
3.0
High-N steel Low-N steel
Fig. 6 Changes in dislocation density estimated by mWH/WA method as afunction of true strain in low-N and high-N steels.
Work-Hardening Mechanism in High-Nitrogen Austenitic Stainless Steel 681

dislocations because planar dislocations are localized on thesame slip plane. The above results reveal that the largeFWHM in high-N steel is not due to the higher dislocationdensity, but arises from the difference in dislocation arrange-ment and strain field of dislocation.
3.3 Work-hardening mechanism in high-nitrogen auste-nitic steel
When discussing the work-hardening mechanism ofmetallic materials, the Bailey-Hirsch relationship,32) whichstates that the flow stress is proportional to the square root ofdislocation density, is often used. However, in this study, theaddition of N does not promote dislocation accumulation,which clearly indicates the work-hardening behavior inhigh-N steel cannot be discussed by only considering thedislocation density. Furthermore, the Bailey-Hirsch relation-ship is inadequate for the discussion of work-hardeningbehavior in specimens where dislocations are distributed likein high-N steel, because this relation has been establishedbased on the forest dislocation model3335) that dislocationsexist uniformly. Therefore, we discuss the work-hardeningbehavior on high-N steel based on the long-range stress fieldtheory, which is another dislocation strengthening theory.
The planar dislocation in high-N steel forms due to theconcentration of dislocation movement on the same slipsystem, and the movement of the leading dislocation isstopped by obstacles such as a grain boundary or Lomer-Cottrell sessile dislocations, resulting in a pile-up ofsubsequent dislocations on the same slip plane. Figure 8presents a schematic illustration showing a pile-up ofdislocations in low-N and high-N steels.
Dislocations on the same slip plane (on the arrow inFig. 8) repel each other because they have the same Burgersvector. The repulsive force f between the two edgedislocations is expressed by the following equation:36)
f ¼ Gb2
2³ð1� ¯Þ �1
X(3.2)
where ¯, G and X represent Poisson’s ratio, the shear modulusand the distance between two dislocations, respectively.
When another dislocation approaches from the dislocationsource to the pile-up dislocation array, the dislocation issubjected to a back stress in the opposite direction from thestress field formed by the dislocation array, which is a long-range stress field. It can be quantitatively expressed asfollowing equation (3.3), by considering that the back stressdue to n pile-up dislocations and the external force ¸ arebalanced.
Gb2
2³ð1� ¯ÞXn�1
i¼1
1
Xi �Xn
¼ ¸b (3.3)
The above equation means that the external force ¸ requiredfor balancing increases with the increasing number ofdislocations (n) on the same slip plane. In order to continuethe plastic deformation, it is necessary to introduce (n + 1),the new dislocation, so that the necessary external force ¸
increases accordingly. The increase in external stresscorresponds to the work-hardening. In low-N steel wherecross slipping easily occurs, stress relaxation can occur byreducing the number of pile-up dislocations, whereas in high-N steel where cross slipping is rare, the number of pile-updislocations on the same slip plane significantly increaseswith deformation, resulting in high work-hardening.
If the long-range stress field actually occurs due to the pile-up of dislocations, a large shear stress should occur at aregion closer to the grain boundary affected by pile-updislocations. In order to verify the long-range stress field, weattempted to observe it by elastic strain analysis in the localregion using the EBSD-Wilkinson method. In this study,changes in the distribution of elastic strain were investigatedby in-situ observation for the same austenite grain understress in the specimens before tensile testing, just afteryielding, and tensile-strained at 5%. Figure 9 shows thecrystallographic orientation maps in low-N (Fig. 9(a)) and
0 0.1 0.2 0.3 0.4True strain, ε t
0
0.4
1.0
Dis
loca
tion
arra
ngem
ent
para
met
er, M
1.2
0.8
0.6
0.2
High-N steel
Low-N steel
Randomly distributed dislocations
Fig. 7 Changes in dislocation arrangement parameter as a function of truestrain in low-N and high-N steels.
External force τ
External force τ
n+1
Dislocation source
n+1
1 2 3
1 2 3G.B.
(a)cross slip
1 2 3 n+1
n+1
4 5
1 2 3 4 5G.B.
External force τ
External force τ
(b)
Fig. 8 Schematic illustration showing dislocation pile-up in (a) low-N and(b) high-N steels.
T. Masumura, Y. Seto, T. Tsuchiyama and K. Kimura682

high-N (Fig. 9(b)) steels before tensile testing. In these maps,the crystal orientation with respect to the tensile direction isshown. The elastic strain analysis was performed on thegrains surrounded by the black lines with the same tensiledirection ©457ª. Figures 9(b)(d) and 9(f )(h) show theelastic strain maps (E11: elastic strain against the tensiledirection) in low-N (Fig. 9(b)(d)) and high-N (Fig. 9(f )(h)) steels before testing (9(b), (f )), just after yielding (9(c),(g)), and strained at ¾t = 5% (9(d), (h)). In both specimens,the elastic strain field in the grains increases with increasingtensile strain. Comparisons between both specimens revealthat there is little effect of N on the distribution of the elasticstrain before tensile testing or just after yielding. However,the specimens tensile strained at 5% where work-hardeninghas occurred, high elastic strain is generated in the high-Nsteel. As an example of the strain distribution, Fig. 10presents the changes in elastic strain E11 along the dotted lineshown in Fig. 9(d) and 9(h) as a function of distance fromthe grain boundary triple junction, where a large strain
concentration was observed in both specimens strained at5%. In low-N steel, the elastic strain gradually increases asthe distance from the grain boundary decreases, whereas inhigh-N steel, the elastic strain is globally high. This isthought to be because the flow stress applied in high-N steelis about twice that in low-N steel. On the other hand,focusing on the gradient of the elastic strain, the gradient isalmost same between both specimens in the region 10 µm ormore away from the grain boundary, while the elastic strainrapidly increases within 10 µm from the grain boundary inhigh-N steel. That is, the stress concentration was caused bythe pile-up of many dislocations near the grain boundary inhigh-N steel, indicating the existence of the long-range stressfield that gives large back stress to subsequent dislocations.In conclusion, the increase in deformation resistance due tothe long-range stress field is the main factor contributing tothe large work-hardening of high-N steel.
In this study, quantitative discussions related to the work-hardening rate are still insufficient, so future research shouldaim to quantitatively evaluate the planar dislocation structureand develop the theoretical understanding of the work-hardening rate. For this purpose, microstructural analyses,such as line profile analysis, high-resolution SEM, and TEMare expected to play an important role. We should discusswork-hardening while comprehensively considering not onlydislocation density but also dislocation arrangement, thedifference in properties among grains,37) and the ratio of edgeand screw dislocations.
4. Conclusions
For type 316L steel, a large amount of N was added bythe solution nitriding method in order to study the work-hardening mechanism in high-N austenitic stainless steel.This was carried out by examining the dislocation densityand distribution by the modified Williamson-Hall/Warren-Averbach method and the local elastic strain mapped by the
20μm
20μm
(b) (c) (d)
(f) (g)
Tensile Direction(//E11)
Elastic strain, E11
0.010-0.010 0 0.005-0.005
(h)
Orientation map Before testing Just after yielding ε t=5%
Fig. 9 Crystallographic orientation maps in (a) low-N and (e) high-N steels, and elastic strain (E11) maps in (b)(d) low-N and (f )(h)high-N steels, (b), (f ) before testing, (c), (g) just after yielding, and (d), (h) strained at ¾t = 5%.
0 10 20 30Distance from grain boundary triple junction, d / μm
0
0.002Ela
stic
stra
in, E
11
0.010
0.008
0.006
0.004
High-N steel
Low-N steel
ε t=5%
Fig. 10 Changes in elastic strain E11 as a function of distance from grainboundary triple junction along the dot line shown in Fig. 9(d) and 9(h).
Work-Hardening Mechanism in High-Nitrogen Austenitic Stainless Steel 683

EBSD-Wilkinson method for low-N and high-N steels. Theobtained results are summarized as follows:(1) The mechanical properties of high-N steel (0.45mass%
N) are characterized by high yield stress due to the solidsolution strengthening of N and high tensile strengthdue to the increased work-hardening rate. As for themicrostructure, planar dislocation arrays formed bysuppressing the cross slipping of dislocations aredeveloped in high-N steel.
(2) Dislocation accumulation behavior during tensiledeformation in high-N steel is identical to that in low-N steel. Therefore, the high work-hardening rate inhigh-N steel cannot be explained by the stimulation ofdislocation accumulation, so the work-hardeningmechanism should be closely related to the develop-ment of the planar dislocation array.
(3) In low-N steel, the dislocation arrangement parameter,M, is low from an initial stage of deformation andhardly changes by further deformation, correspondingto the well-developed dislocation cell structure formedby easily causing cross slipping of dislocations. On theother hand, M in high-N steel is higher, which meansthe elastic strain field of dislocation tends to be large.This corresponds to the large repulsive force betweendislocations due to the planar dislocation arrays wheredislocations are localized on the same slip plane.
(4) In high-N steel, a large elastic strain gradient isgenerated at the vicinity of grain boundaries by tensiledeformation. This suggests that long-range stress fieldsarise from planar dislocation causing stress concen-trations at grain boundaries and simultaneously givesa large back stress to the following dislocations. Theback stress enhances the deformation resistance of thematerials, leading to the increase of the work-hardeningrate in high-N steel.
Acknowledgements
This work was supported by JSPS KAKENHI GrantNumber JP18K14016. We would like to thank Prof. SigeoSato (Ibaraki University), Prof. Emeritus Setsuo Takaki andDr. Daichi Akama (Kyushu University) for their advice onX-ray line profile analysis.
REFERENCES
1) S. Azuma, H. Miyuki and T. Kudo: ISIJ Int. 36 (1996) 793798.2) T. Masumura, T. Tsuchiyama, S. Takaki, T. Koyano and K. Adachi: Scr.
Mater. 154 (2018) 811.
3) T. Masumura, N. Nakada, T. Tsuchiyama, S. Takaki, T. Koyano and K.Adachi: Acta Mater. 84 (2015) 330338.
4) G.H. Eichelman and F.C. Hull: Trans. Am. Soc. Met. 45 (1953) 77104.
5) K. Nohara, H. Ono and N. Ohashi: Tetsu-to-Hagané 63 (1977) 772782.
6) K.J. Irvine, D.T. Llewellyn and F.B. Pickering: J. Iron Steel Inst. 199(1961) 153175.
7) T. Tsuchiyama and S. Takaki: Denki-seiko 77 (2006) 163169.8) T. Tsuchiyama, H. Ito, K. Kataoka and S. Takaki: Metall. Mater. Trans.
A 34 (2003) 25912599.9) K. Tsuboi, T. Tsuchiyama, S. Takaki and S. Tsutsumi: ISIJ Int. 52
(2012) 18721878.10) S. Kubota, Y. Xia and Y. Tomota: ISIJ Int. 38 (1998) 474481.11) M. Yoshitake, T. Tsuchiyama and S. Takaki: Tetsu-to-Hagané 98 (2012)
223228.12) M. Ojima, Y. Adachi, Y. Tomota, K. Ikeda, T. Kamiyama and Y.
Katada: Mater. Sci. Eng. A 527 (2009) 1624.13) K. Ikeda, Y. Tomota, J. Suzuki, A. Moriai and T. Kamiyama: Tetsu-to-
Hagané 91 (2005) 822827.14) A.L. Sozinov and V.G. Gavriljuk: Scr. Mater. 41 (1999) 679683.15) M. Murayama, K. Hono, H. Hirukawa, T. Ohmura and S. Matsuoka:
Scr. Mater. 41 (1999) 467473.16) M. Grujicic, X.W. Zhou and W.S. Owen: Mater. Sci. Eng. A 169 (1993)
103110.17) I. Karaman, H. Sehitoglu, H.J. Maier and Y.I. Chumlyakov: Acta
Mater. 49 (2001) 39193933.18) X.W. Zhou and M. Grujicic: Calphad 20 (1996) 257272.19) G.K. Williamson and W.H. Hall: Acta Metall. 1 (1953) 2231.20) D. Akama, T. Tsuchiyama and S. Takaki: J. Soc. Mater. Sci. Jpn. 66
(2017) 522527.21) T. Ungár and A. Borbély: Appl. Phys. Lett. 69 (1996) 31733175.22) A.J. Wilkinson: Ultramicroscopy 62 (1996) 237247.23) A.J. Wilkinson, G. Meaden and D.J. Dingley: Ultramicroscopy 106
(2006) 307313.24) F. Jiang, K. Hirata, T. Masumura, T. Tsuchiyama and S. Takaki: ISIJ
Int. 58 (2018) 376378.25) T.H.D. Keijser, J.I. Langford, E.J. Mittemeijer and A.B.P. Vogels:
J. Appl. Cryst. 15 (1982) 308314.26) S. Sato, K. Wagatsuma, M. Ishikuro, E.-P. Kwon, H. Tashiro and S.
Suzuki: ISIJ Int. 53 (2013) 673679.27) S. Takaki, T. Masumura, F. Jiang and T. Tsuchiyama: Tetsu-to-Hagané
104 (2018) 683688.28) T. Masumura, S. Takaki and T. Tsuchiyama: Tetsu-to-Hagané 104
(2018) 717719.29) L. Remy and A. Pineau: Mater. Sci. Eng. 28 (1977) 99107.30) M. Ojima, Y. Adachi, Y. Tomota, Y. Katada, Y. Kaneko, K. Kuroda and
H. Saka: Steel Res. Int. 80 (2009) 477481.31) M. Wilkens: Phys. Status Solidi A 2 (1970) 359370.32) J.E. Bailey and P.B. Hirsch: Philos. Mag. 5 (1960) 485497.33) G. Saada: Acta Metall. 8 (1960) 841847.34) F.R.N. Nabarro, Z.S. Basinski and D.B. Holt: Adv. Phys. 13 (1964)
193323.35) P.B. Hirsch and T.E. Mitchell: Can. J. Phys. 45 (1967) 663706.36) M. Kato: Introduction to the theory of dislocations, (Shokabo, Tokyo,
1999) p. 73.37) Y. Tomota, M. Ojima, S. Harjo, W. Gong, S. Sato and T. Ungár: Mater.
Sci. Eng. A 743 (2019) 3239.
T. Masumura, Y. Seto, T. Tsuchiyama and K. Kimura684