work package 1. progress report - world agroforestry centre
TRANSCRIPT
Work Package 1. Progress report
Catherine Muthuri, John Nyaga and Philip Smethurst
7th November 2019, Steering committee meeting Nairobi, Kenya

Objective
To enhance knowledge of the impact of tree cover
change on crop productivity, water,
nutrients and livelihoods
1.1 Expand the networks of farmer trials across a range of contexts and establish a long term trial in Uganda
1.2 Collect targeted data on tree-crop interactions and tree products and services from the existing long-term, on-station and farmer
trials and develop suitability maps for different sites and contexts
1.3 Develop the capacity of the APSIM X AF model and other linked models for use on a wider range of tree species and cropping
practices.
1.4 Conduct scenario modelling using the enhanced APSIM X AF model and other linked models to inform national agroforestry
scaling
Activities

Region Type of participatory trials Total
farmersTotal trials
Trails
monitored in
ODK
EEFRI / semi-
aridFruit tree trial 182 260 61
MPT planting 380 383 37
OARI/ sub
humidFruit tree and MPT trial 131 287
WVE / Tigray
Fruit tree and MPT trial 70 68
Apple root stock distribution 22 22
MPT with RWH structures 63 133
Fruit tree trial (Guava, Coffee,
and Cazmir )75 75
PhD Student
TigrayFruit tree and MPT trial 20 31
Total 943 1259 98
Participatory Trials Types – Ethiopia Impacts How important do you think products from these trees will be to meeting your household food demand?

Participatory Trials Types – Rwanda Impacts
Types of participatory
trials
Gishwati BugeseraTrials
monitored
using ODKTrials Farmers Trials Farmers
Biomass incorporation 56 232 129 337 187Soil Conservation 114 368 9 23 7Stakes for climbing
beans 81 425 127 129 185Fruits for nutrition and
income (Total) 161 218 630 718 275Tree tomato 138 378 472 531 236Avocado 23 58 77 87 15Mango - 57 65 18Papaya - 24 35 10Total 412 1461 895 1207 658

Type of participatory trial
Mbale Manafwa Bududa Trials monitored
using ODKNo. of trials No. of
farmers
No. of trials No. of
farmers
No. trials No. of
farmersTrees on farm 95 28 85 26 78 35 -Boundary planting 48 35 62 25 73 55 -Woodlots 32 20 21 16 33 28 -Fruit orchards 20 25 14 26 30 15 -Integrated 9 9 24 18 19 31 -
On farm tree management 204 117 206 111 233 164 220
Fodder bank and hedgerows 24 16 18 10 29 13 10
Soil and water conservation 16 16 16 21 12 16 15Riverbank stabilization 22 8 15 6 18 15 10Total 266 157 255 148 292 208 255
Participatory Trials Types – Uganda Impacts

Online data collection progress in Ethiopia, Uganda and Rwanda
Number Name Purpose/objectiveMonitoring using ODK
Ethiopia Rwanda Uganda
1 Farmer profiling/ registration
To profile all farmers hosting participatory
trials. This will allow the project to obtain
contextual variables among the farmers.
214 (943) 176 (1307) 656 (513)
2 Participatory_trial To record and monitor participatory trials. 99 (1259) 658 (1068) 255 (813)
3 RRC_Nursery_Tree_DistributionTo record tree distribution at RRC, numbers
and recipients’ information88 1052 2538
4 RRC_Performance_Checklist
To record the performance of RRC in terms
of visitors, ownership, training, available
resources, satellite nurseries, challenges,
opportunities, and threats.
4 11 3
5 Seedling_Survival_and_Performance
To monitor the survival and performance
of tree seedlings supplied by the project in
the farms.
0 166 554
How did you hear about this RRC? Number of tree species distributed/provided?

No. Activity Outputs/
Milestones
Progress Year 3
Month 10
1.1 Expand the networks of
farmer trials across a range
of contexts and establish a
long term trial in Uganda.
1.1.1 Networks of farmer trials
established: Ethiopia (1500); Rwanda
(1200) Uganda (800)
Rwanda-1307
Ethiopia- 1259
Uganda - 813
Yr1 M12 - Yr
4.
1.1.2a Establishment of LTT Uganda
1.1.2. b) Management trials
established in existing LTTs in Rwanda
and Ethiopia and later Uganda
Done. Monitoring in
progress
Yr1 M6
E&R Yr1 M12
U- MTR
1.2 Collect targeted data on
tree-crop interactions and
tree products and services
from the
1.2.1 Databases developed on crop
productivity and tree products and
services under different agroforestry
practices from the farmers trials
A robust ODK
database was
developed for
Ethiopia, Rwanda
and Uganda. This
process is ongoing,
and the database will
continue to develop
/ enlarge as more
data from the trials is
collected.
Yr1 M10- Yr 4
M6.
Milestone table and summary of progress
No. Activity Outputs/
Milestones
Progress to date.
1.1 Collect targeted
data on tree-crop
interactions and
tree products and
services from the
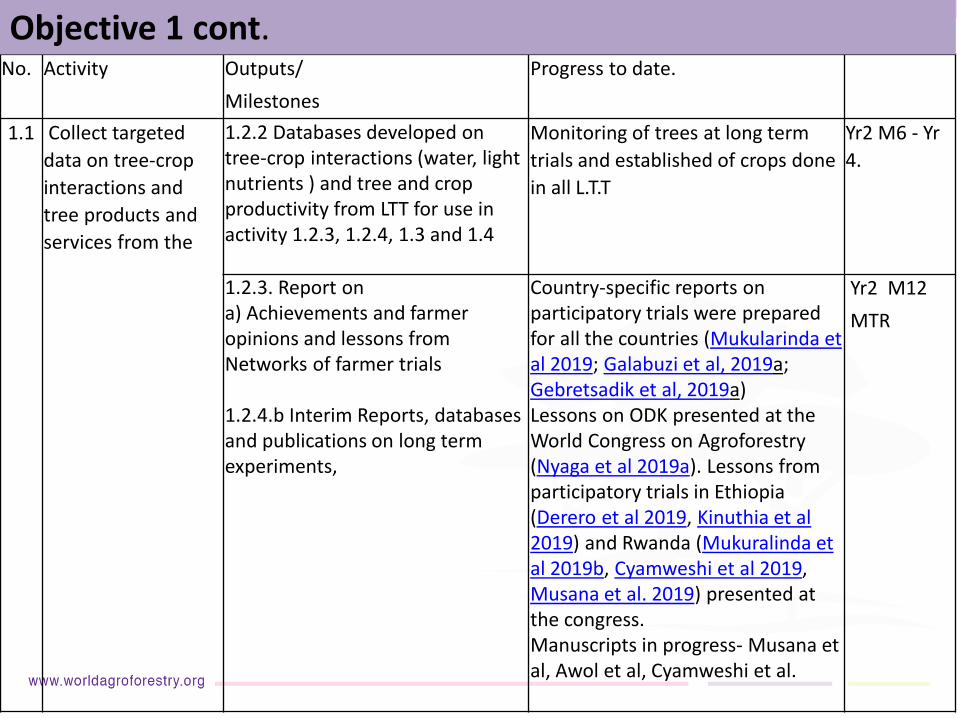
1.2.2 Databases developed ontree-crop interactions (water, lightnutrients ) and tree and cropproductivity from LTT for use inactivity 1.2.3, 1.2.4, 1.3 and 1.4
Monitoring of trees at long term
trials and established of crops done
in all L.T.T
Yr2 M6 - Yr
4.
1.2.3. Report ona) Achievements and farmeropinions and lessons fromNetworks of farmer trials
1.2.4.b Interim Reports, databases and publications on long termexperiments,
Country-specific reports on participatory trials were prepared for all the countries (Mukularinda et al 2019; Galabuzi et al, 2019a; Gebretsadik et al, 2019a)Lessons on ODK presented at the World Congress on Agroforestry (Nyaga et al 2019a). Lessons from participatory trials in Ethiopia (Derero et al 2019, Kinuthia et al 2019) and Rwanda (Mukuralinda et al 2019b, Cyamweshi et al 2019, Musana et al. 2019) presented at the congress. Manuscripts in progress- Musana et al, Awol et al, Cyamweshi et al.
Yr2 M12
MTR
Objective 1 cont.

• Profiling farmers needs to be finalized to allow analysis of trials performances through option by context approach
• Ensuring T4FS phase 1 trials are also captured and tracking of secondary beneficiaries captured.
• Data collection, documentation and analysis needs to be time especially on participatory trials.
• A plan on write shop to allow drafting of manuscript using the already existing data. Start linking farmer profile data with participatory trials performance data.
Key issues/ outstanding deliverables

Long- term trials

ST4FS Steering Committee: Objective 1 - CSIRO
CSIRO (AUSTRALIA) & ICRAF (EAST AFRICA)
Philip J. Smethurst, Neil Huth, Tenge Ngoga, Athanase Mukuralinda, Fergus Sinclair, and Catherine Muthuri
November 2019

Met and Soil Inputs for Maize Simulations for Rwanda 0.05o Grid• Source data is at 0.25o, leading to blocked appearance for the 0.05o grid. Finer scale source data might be possible later.
• The service sometimes leads to a few cells of missing data. Repeat requests are sometimes successful.
• Highest rainfall and soil C in parts of the west and lowest in parts of the east.
• Soils data need to be compared to national survey results and evaluated for local use, as ISRIC soil modelling and interpolationprobably leads to continental scale smoothing that might lead to with-in country biases in the data. Time of sampling, total soil depth and > 2 mm soil (gravel and rocks) also need consideration. Despite concerns, current data appear useful to some degree– see later slides.

Maize Simulations for Rwanda 0.05o Grid• 794 locations, 34 years, 2 crops/year• N depletion occurring with low N inputs• Observed yields in the project at Tamira (Musana et al.) and Karama (Ngoga et al.) are in the range
simulated after 34 years
0
100
200
300
400
500
600
700
800
2/18/1982 10/28/1995 7/6/2009 3/15/2023
Mai
ze Y
ield
(g/
m2
/har
vest
)
TamiraAPSIMGrid
KaramaAPSIMGrid
TamiraObserved
KaramaObserved
5 kg/ha N at sowing0 kg/ha N at sowing 200 kg/ha N at sowing
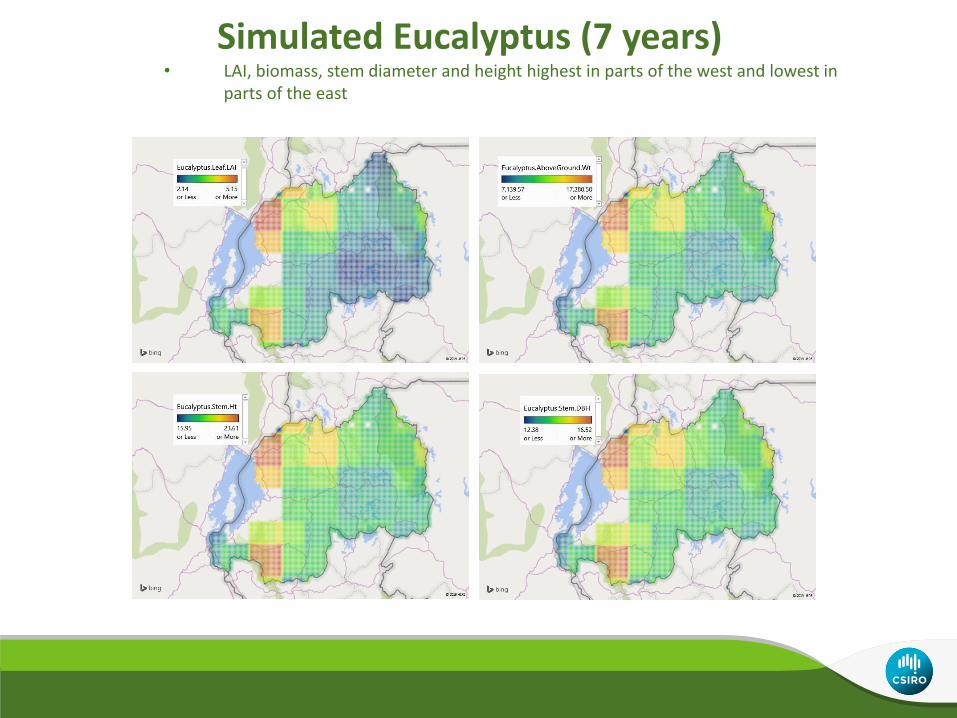
Simulated Eucalyptus (7 years)• LAI, biomass, stem diameter and height highest in parts of the west and lowest in
parts of the east
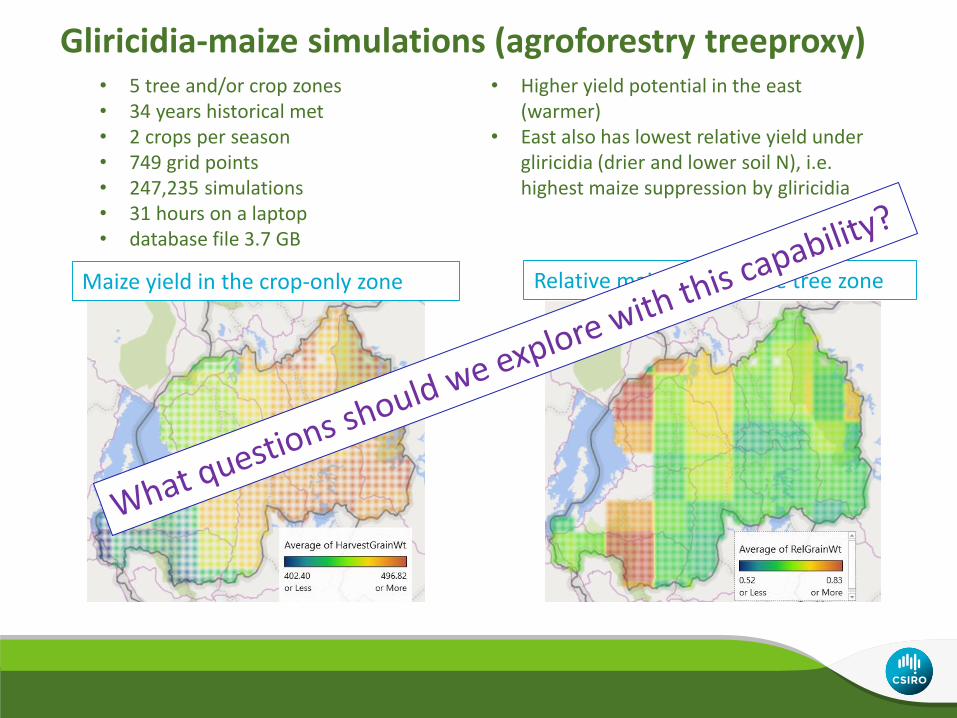
• 5 tree and/or crop zones• 34 years historical met• 2 crops per season• 749 grid points• 247,235 simulations• 31 hours on a laptop• database file 3.7 GB
• Higher yield potential in the east (warmer)
• East also has lowest relative yield under gliricidia (drier and lower soil N), i.e. highest maize suppression by gliricidia
Maize yield in the crop-only zone Relative maize yield in the tree zone
Gliricidia-maize simulations (agroforestry treeproxy)

0
100
200
300
400
500
600
700
0 100 200 300 400 500 600 700 800
Growing Season Rainfall (mm)
Bugesera, Rwanda
Maize Flowering
Maize Population
Tree Row Spacing
Tree Water Use
Mai
ze G
rain
Yie
ld (
g m
-2)
• Experimental results in dry years may not be representative of most other years
• We underestimate the value of leguminous trees if we don’t maximise Maize agronomy
• Competition from trees more likely to be via impacts on crop establishment
• The main drivers are things that farmers can manage
• Modern analytical techniques allow us to look past the complexity to see just the things that we need to see.
• Looking for trends in the things that
matter tells us what we probably should be looking into next.
• See Huth et al. WCA presentationhttps://agroforestry2019.cirad.fr/FichiersComplementaires/webconf/5_39_HUTH%20Neil/index.html
Gliricidia-Maize (active tree model) - Yield Sensitivity

• Maize yield was suppressed up to 1.5 m away from 20-month-old coppiced gliricidia
• Stake production per gliricidia tree was 50% less in the sole-tree treatment
• Stake length (tree height) was 2.5 m on 36-month-old coppice, which increased to 5 m by 48 months without further cutting, with an expected increase in the width of the competition zone.
Gliricidia-maize Experiment, Rwanda (Ngoga et al.)
y = -0.0112x2 + 0.1803x + 0.2819
R² = 0.7034
0.4
0.6
0.8
1
2 4 6 8 10
Rela
tive Y
ield
Spacing (m)
0
2
4
6
8
10
d13/108 d13/36 d13/72 ST
Num
ber
of
sta
kes p
er
tree
Tree density and sole tree
trt
Average of skes1 Average of skes2
aabab
b
a
b
ab
a
0
1
2
3
4
5
6
ht36_m ht48_m
Tre
e h
eig
ht
(m)
Months after planting (36 and 48)
a
b

Overview of Modelling Aims and Progress• Add/complete active tree models:
– Gliricidia, Grevillea, Faidherbia, Alnus, Cordia and Eucalyptus
• Add/complete crop models
– potato, teff, bush beans, climbing beans (maize and wheat already available)
• Conduct regional projections and virtual experiments
• Link plot-scale (APSIM) outputs with farm- and landscape-scale models (SIMILE, Polyscape)
• Use APSIM in context-sensitive participatory design
• Use models to inform policy and practice dialogues - World Vision
• Conduct soil and plant measurement workshop
• Training and student supervision

CSIRO Land and WaterPhilip Smethurst
t +61 3 6237 5653
e [email protected] www.csiro.au
Thank you
Acknowledgements
Rwandan Agricultural Board Tenge
ACIAR Athanase
CSIRO Damascene
ICRAF
CIMMYT