workers’ memorial day — occupational traumatic … and mortality weekly report. mmwr / april 24,...
TRANSCRIPT
Continuing Education examination available at http://www.cdc.gov/mmwr/cme/conted_info.html#weekly.
U.S. Department of Health and Human ServicesCenters for Disease Control and Prevention
Morbidity and Mortality Weekly ReportWeekly / Vol. 64 / No. 15 April 24, 2015
INSIDE411 Work-Related Asthma Cluster at a Syntactic Foam
Manufacturing Facility — Massachusetts 2008–2013415 Tracking Progress Toward Polio Eradication —
Worldwide, 2013–2014421 Optimal Serum and Red Blood Cell Folate
Concentrations in Women of Reproductive Age for Prevention of Neural Tube Defects: World Health Organization Guidelines
424 Announcements427 QuickStats
Workers’ Memorial Day — April 28, 2015
Workers’ Memorial Day, observed each year on April 28, recognizes workers who died or who have experienced exposures to hazards at work. In 2013, a total of 4,405 U.S. workers died from work-related injuries (1); in 2007, according to the latest estimate available, 53,445 deaths could be attributed to work-related illness (2).
In 2013, approximately 3 million injuries and illnesses to private industry workers and 746,000 to state and local government workers were reported by employers (3). In the same year, an estimated 2.8 million work-related injuries were treated in emergency departments, result-ing in 140,000 hospitalizations (National Institute for Occupational Safety and Health, unpublished data, 2014).
Although certain national surveillance systems (4) record new cases of selected nonfatal work-related illnesses, the overall incidence of such illness is not well documented. This issue of MMWR includes a report on work-related asthma, one of many under-recognized work-related ill-nesses, in addition to a report on occupational traumatic injuries among health care workers. In 2007, the cost of work-related fatalities, injuries, and illnesses in the United States was estimated at $250 billion (2). CDC is working to better describe the overall societal burden of occupational fatalities, injuries, and illnesses; additional information is available at http://www.cdc.gov/niosh/programs/econ/risks.html.
References1. Bureau of Labor Statistics. National Census of Fatal Occupational
Injuries in 2013 (preliminary results). Table 2. Washington, DC: US Department of Labor, Bureau of Labor Statistics; 2014. Available at http://www.bls.gov/news.release/pdf/cfoi.pdf.
2. Leigh JP. Economic burden of occupational injury and illness in the United States. Milbank Q 2011;89:728–72.
3. Bureau of Labor Statistics. Employer-reported workplace injuries and illnesses in 2013. Table 2. Washington, DC: US Department of Labor, Bureau of Labor Statistics; 2014. Available at http://www.bls.gov/news.release/pdf/osh.pdf.
4. Workplace safety and health topics. Surveillance. Atlanta, GA: US Department of Health and Human Services, CDC; 2014. Available at http://www.cdc.gov/niosh/topics/surveillance/default.html.
Occupational Traumatic Injuries Among Workers in Health Care
Facilities — United States, 2012–2014
Ahmed E. Gomaa, MD1, Loren C. Tapp, MD1, Sara E. Luckhaupt, MD1, Kelly Vanoli1, Raymond Francis Sarmiento, MD1,2, William M. Raudabaugh1, Susan Nowlin1, Susan M. Sprigg,
MPH1 (Author affiliations at end of text)
In 2013, one in five reported nonfatal occupational injuries occurred among workers in the health care and social assistance industry, the highest number of such injuries reported for all private industries (1). In 2011, U.S. health care personnel expe-rienced seven times the national rate of musculoskeletal disorders compared with all other private sector workers (2). To reduce the number of preventable injuries among health care personnel, CDC’s National Institute for Occupational Safety and Health (NIOSH), with collaborating partners, created the Occupational Health Safety Network (OHSN) to collect detailed injury data to help target prevention efforts. OHSN, a free, voluntary surveil-lance system for health care facilities, enables prompt and secure tracking of occupational injuries by type, occupation, location, and risk factors. This report describes OHSN and reports on current findings for three types of injuries. A total of 112 U.S.
Morbidity and Mortality Weekly Report
406 MMWR / April 24, 2015 / Vol. 64 / No. 15
The MMWR series of publications is published by the Center for Surveillance, Epidemiology, and Laboratory Services, Centers for Disease Control and Prevention (CDC), U.S. Department of Health and Human Services, Atlanta, GA 30329-4027.Suggested citation: [Author names; first three, then et al., if more than six.] [Report title]. MMWR Morb Mortal Wkly Rep 2015;64:[inclusive page numbers].
Centers for Disease Control and PreventionThomas R. Frieden, MD, MPH, Director
Harold W. Jaffe, MD, MA, Associate Director for Science Joanne Cono, MD, ScM, Director, Office of Science Quality
Chesley L. Richards, MD, MPH, Deputy Director for Public Health Scientific ServicesMichael F. Iademarco, MD, MPH, Director, Center for Surveillance, Epidemiology, and Laboratory Services
MMWR Editorial and Production Staff (Weekly)Sonja A. Rasmussen, MD, MS, Editor-in-Chief
Charlotte K. Kent, PhD, MPH, Executive Editor Teresa F. Rutledge, Managing Editor
Douglas W. Weatherwax, Lead Technical Writer-EditorTeresa M. Hood, MS, Jude C. Rutledge, Writer-Editors
Martha F. Boyd, Lead Visual Information SpecialistMaureen A. Leahy, Julia C. Martinroe,
Stephen R. Spriggs, Visual Information SpecialistsQuang M. Doan, MBA, Phyllis H. King,
Terraye M. Starr, Information Technology Specialists
MMWR Editorial BoardWilliam L. Roper, MD, MPH, Chapel Hill, NC, Chairman
Matthew L. Boulton, MD, MPH, Ann Arbor, MIVirginia A. Caine, MD, Indianapolis, IN
Jonathan E. Fielding, MD, MPH, MBA, Los Angeles, CADavid W. Fleming, MD, Seattle, WA
William E. Halperin, MD, DrPH, MPH, Newark, NJ
King K. Holmes, MD, PhD, Seattle, WATimothy F. Jones, MD, Nashville, TNRima F. Khabbaz, MD, Atlanta, GA
Patricia Quinlisk, MD, MPH, Des Moines, IAPatrick L. Remington, MD, MPH, Madison, WI
William Schaffner, MD, Nashville, TN
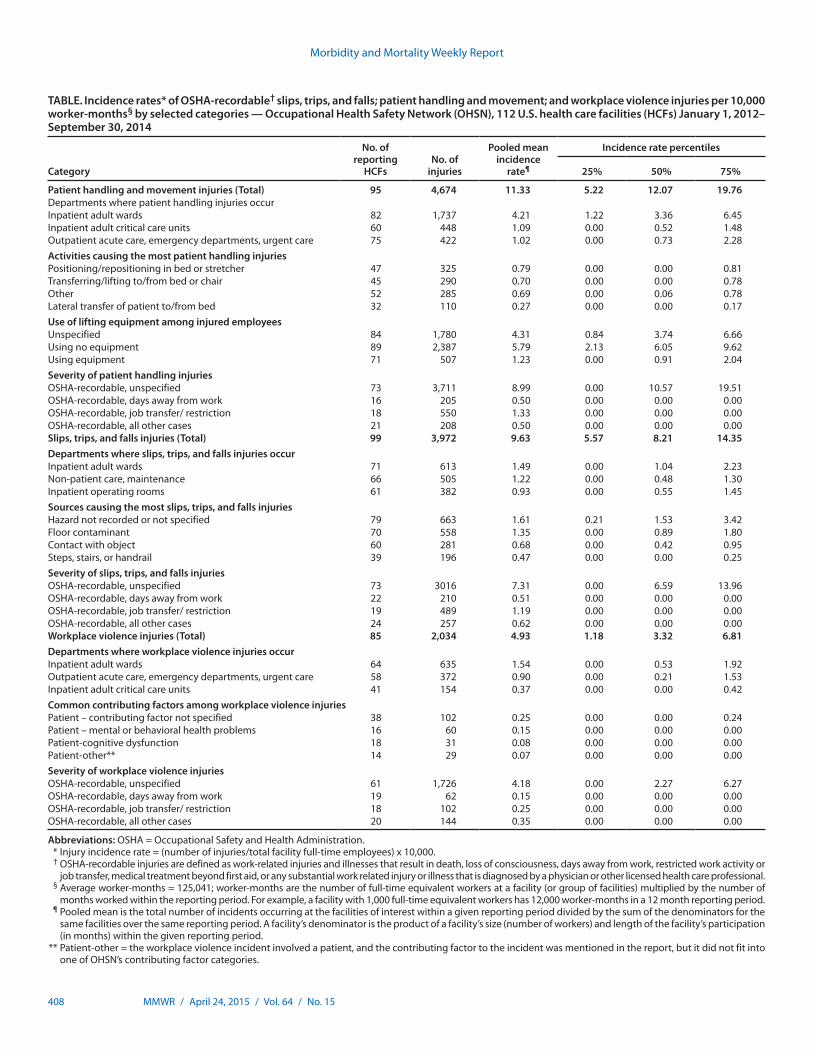
facilities reported 10,680 OSHA-recordable* patient handling and movement (4,674 injuries); slips, trips, and falls (3,972 inju-ries); and workplace violence (2,034 injuries) injuries occurring from January 1, 2012–September 30, 2014. Incidence rates for patient handling; slips, trips, and falls; and workplace violence were 11.3, 9.6, and 4.9 incidents per 10,000 worker-months,† respectively. Nurse assistants and nurses had the highest injury rates of all occupations examined. Focused interventions could mitigate some injuries. Data analyzed through OHSN identify where resources, such as lifting equipment and training, can be directed to potentially reduce patient handling injuries. Using OHSN can guide institutional and national interventions to protect health care personnel from common, disabling, prevent-able injuries.
OHSN is a web-based data portal that accepts health care facilities’ existing OSHA-recordable and non-recordable health care personnel injury data. De-identified injury data are converted to standard OHSN data elements designed
to characterize first, the occupation of the injured worker; second, the type, severity, cause and location of the injury; and finally, information useful in determining how the injury could be prevented. Standardization of data across all facilities allows comparison within and across facilities; comparison groups can be selected by OHSN participants (e.g., hospitals of comparable size or in the same geographic region). New data submissions are available to OHSN participants within a week, and they can analyze new and historical injury data and produce outputs in the form of graphs and tables at any time. The NIOSH OHSN topic page provides information on 1) data terminology, transmission, and security; 2) examples of output graphs and tables; and 3) intervention resources (3).
OHSN received data on injuries occurring from January 1, 2012–September 30, 2014, from 112 U.S. health care facilities. Pooled mean incidence rates§ and percentiles were calculated for three types of OSHA-recordable injuries: 1) falls, including slipping or tripping without a fall; 2) patient handling (e.g., handling, pushing, pulling, or lifting patients); and 3) work-place violence (i.e., violent acts directed at health care person-nel). For each of the three injury types, the same denominator was used for all sub-analyses within an injury type, because more specific denominators were not available.
* OSHA-recordable injuries are defined as work-related injuries and illnesses that result in at least one of the following: death, loss of consciousness, days away from work, restricted work activity or job transfer, medical treatment beyond first aid, or a diagnosis by a physician or other licensed health care professional.
† Worker-months are defined as the number of full-time equivalent workers at a facility (or group of facilities) multiplied by the number of months worked within the reporting period. For example, a facility with a stable workforce of 1,000 full-time workers has 12,000 worker-months in a 12 month reporting period. If this same facility reported data for only 8 months, then they would have 8,000 worker-months. The total number of facility full-time employees is derived from the annual American Hospital Association survey and confirmed or modified by participating facilities to OHSN.
§ A pooled mean is the total number of incidents occurring at all the facilities of interest within a given reporting period divided by the sum of the denominators for the same facilities over the same reporting period. A facility’s denominator is the product of a facility’s size (number of workers) and length of the facility’s participation (in months) within the given reporting period.
Morbidity and Mortality Weekly Report
MMWR / April 24, 2015 / Vol. 64 / No. 15 407
The 112 participating facilities were located in 19 states, with 52% located in the Midwest. By size, 46% had bed numbers of less than 200 and by type, 95% were general medical and surgical facilities. The participating facilities had a total of 162,535 full-time employees and reported a total of 13,798 slips, trips, and falls; patient handling; and workplace violence injuries; of this total, 10,680 (77.4%) were OSHA-recordable injuries. Overall incidence rates of OSHA-recordable injuries (average worker-months = 125,041) per 10,000 worker-months for patient handling; slips, trips and falls; and work-place violence were 11.3, 9.6, and 4.9, respectively (Table). Most injuries occurred in two groups of workers, those aged 30–44 years (35%) and those aged 45–64 years (44%). Nurses (38%) and nursing assistants (19%) accounted for 57% of identified OSHA-recordable injuries. Between 70%–90% of OSHA-recordable patient handling; slips, trips, and falls; and workplace violence injuries occurred among female employees.
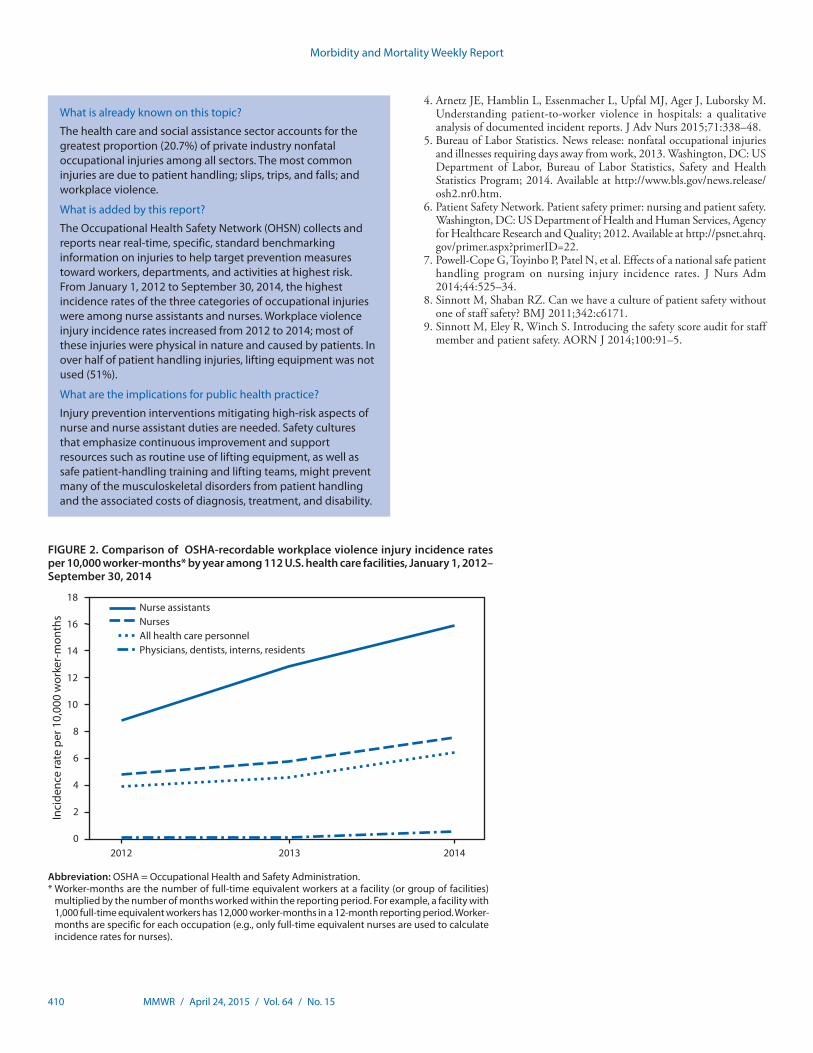
Nurse assistants were more likely to sustain injuries than workers in other job categories; this occupation had more than twice the injury rate of nurses for patient handling and workplace violence injuries (Figure 1). Injury rates for slips, trips, and falls were highest among nonpatient care staff (e.g., maintenance and security staff ), nursing assistants, and nurses. Between 2012 and 2014, workplace violence injury rates increased for all job classifications and nearly doubled for nurse assistants and nurses (Figure 2). Patient handling and workplace violence injury rates were highest in inpatient adult wards; these rates were also elevated in outpatient emer-gency departments, urgent care, and acute care centers and adult critical care departments. Rates of falls were highest in inpatient adult wards, nonpatient care maintenance areas, and operating rooms (Table).
Of all patient handling injury reports, 62% included data on the use of lifting equipment; 82% of the injuries occurred when lifting equipment was not used (Table). Of all slips, trips and falls injury reports, 65% had data on fall type; 89% were falls on the same level, 9% were falls to a lower level (e.g., down stairs, ramps, etc.) and 2% were slips and trips without falling. Of all workplace violence injury reports, 49% specified type of assault (physical, verbal, or destruction of property); 99% were physical assaults. Descriptions of who perpetrated the assaults were included in 13% of workplace violence injury reports; 95% were committed by patients which is in agreement with previous study findings (4).
Discussion
This report examines patient handling; slips, trips, and falls; and workplace violence injuries, which make up a substantial portion of all occupational injuries in the health care sector,
as reported by the national Bureau of Labor Statistics findings for workers in all sectors (5). Overall, for the 112 OHSN participating facilities, rates of patient handling and workplace violence injuries were highest among nurse assistants and nurses; rates of slips, trips, and falls were high for these jobs and also for nonpatient care staff. In contrast, physicians, dentists, interns, and residents have low injury rates. These data indicate that interventions should first focus on prevention of injuries to nurse assistants and nurses from patient handling; slips, trips, and falls; and workplace violence. Patient handling and workplace violence injuries reported to OHSN were clustered in locations providing direct patient care, while slips, trips, and fall injuries occurred in both patient and non-patient areas. Analysis of detailed, facility-level data could identify the higher risk occupations and locations of each facility and assist in customizing prevention measures.
Other studies found that musculoskeletal disorders are increasing among health care personnel (2). Nursing staff are exposed to several musculoskeletal disorder risk factors: 1) caring for overweight/obese and acutely ill patients; 2) high patient-to-nurse ratios; 3) long shifts; and 4) current efforts to mobilize patients almost immediately after medical interven-tions (6). Prevention measures might concentrate on mitigat-ing the high-risk aspects of these jobs. Similar to findings from other studies, OHSN data indicate that interventions (e.g., the use of lifting equipment) could potentially reduce patient-handling injuries, particularly for activities involving positioning, transferring, or lifting a patient (7). Additionally, to prevent patient-handling injuries, health care institutions might establish a safety culture emphasizing continuous improvement and also provide resources such as training in safe patient handling and access to lifting teams and lifting equipment. On the basis of OHSN findings, the major causes of slip, trip, and fall injuries are floor contaminants and contact with objects; however, the variability in types of these injuries indicates that each facility should use facility-specific data to guide prevention measures. The OHSN topic page provides links to helpful resources on safe patient handling methods and prevention of falls among health care personnel, including a comprehensive falls hazards checklist (3).
In 2013, Bureau of Labor Statistics found rates of injuries and illnesses resulting from workplace violence increased for the second year in a row to 16.2 cases per 10,000 full-time workers in the health care and social assistance sector (5). Data reported to OHSN revealed the same trend. The OHSN topic page provides links to workplace violence prevention resources, including an online course to help hospital staff with identifying patients at risk for committing violent acts (those with mental illness, behavioral disorders, and cognitive
Morbidity and Mortality Weekly Report
408 MMWR / April 24, 2015 / Vol. 64 / No. 15
TABLE. Incidence rates* of OSHA-recordable† slips, trips, and falls; patient handling and movement; and workplace violence injuries per 10,000 worker-months§ by selected categories — Occupational Health Safety Network (OHSN), 112 U.S. health care facilities (HCFs) January 1, 2012–September 30, 2014
Category
No. of reporting
HCFsNo. of
injuries
Pooled mean incidence
rate¶
Incidence rate percentiles
25% 50% 75%
Patient handling and movement injuries (Total) 95 4,674 11.33 5.22 12.07 19.76Departments where patient handling injuries occurInpatient adult wards 82 1,737 4.21 1.22 3.36 6.45Inpatient adult critical care units 60 448 1.09 0.00 0.52 1.48Outpatient acute care, emergency departments, urgent care 75 422 1.02 0.00 0.73 2.28Activities causing the most patient handling injuriesPositioning/repositioning in bed or stretcher 47 325 0.79 0.00 0.00 0.81Transferring/lifting to/from bed or chair 45 290 0.70 0.00 0.00 0.78Other 52 285 0.69 0.00 0.06 0.78Lateral transfer of patient to/from bed 32 110 0.27 0.00 0.00 0.17Use of lifting equipment among injured employeesUnspecified 84 1,780 4.31 0.84 3.74 6.66Using no equipment 89 2,387 5.79 2.13 6.05 9.62Using equipment 71 507 1.23 0.00 0.91 2.04Severity of patient handling injuriesOSHA-recordable, unspecified 73 3,711 8.99 0.00 10.57 19.51OSHA-recordable, days away from work 16 205 0.50 0.00 0.00 0.00OSHA-recordable, job transfer/ restriction 18 550 1.33 0.00 0.00 0.00OSHA-recordable, all other cases 21 208 0.50 0.00 0.00 0.00Slips, trips, and falls injuries (Total) 99 3,972 9.63 5.57 8.21 14.35Departments where slips, trips, and falls injuries occurInpatient adult wards 71 613 1.49 0.00 1.04 2.23Non-patient care, maintenance 66 505 1.22 0.00 0.48 1.30Inpatient operating rooms 61 382 0.93 0.00 0.55 1.45Sources causing the most slips, trips, and falls injuriesHazard not recorded or not specified 79 663 1.61 0.21 1.53 3.42Floor contaminant 70 558 1.35 0.00 0.89 1.80Contact with object 60 281 0.68 0.00 0.42 0.95Steps, stairs, or handrail 39 196 0.47 0.00 0.00 0.25Severity of slips, trips, and falls injuriesOSHA-recordable, unspecified 73 3016 7.31 0.00 6.59 13.96OSHA-recordable, days away from work 22 210 0.51 0.00 0.00 0.00OSHA-recordable, job transfer/ restriction 19 489 1.19 0.00 0.00 0.00OSHA-recordable, all other cases 24 257 0.62 0.00 0.00 0.00Workplace violence injuries (Total) 85 2,034 4.93 1.18 3.32 6.81Departments where workplace violence injuries occurInpatient adult wards 64 635 1.54 0.00 0.53 1.92Outpatient acute care, emergency departments, urgent care 58 372 0.90 0.00 0.21 1.53Inpatient adult critical care units 41 154 0.37 0.00 0.00 0.42Common contributing factors among workplace violence injuriesPatient – contributing factor not specified 38 102 0.25 0.00 0.00 0.24Patient – mental or behavioral health problems 16 60 0.15 0.00 0.00 0.00Patient-cognitive dysfunction 18 31 0.08 0.00 0.00 0.00Patient-other** 14 29 0.07 0.00 0.00 0.00Severity of workplace violence injuriesOSHA-recordable, unspecified 61 1,726 4.18 0.00 2.27 6.27OSHA-recordable, days away from work 19 62 0.15 0.00 0.00 0.00OSHA-recordable, job transfer/ restriction 18 102 0.25 0.00 0.00 0.00OSHA-recordable, all other cases 20 144 0.35 0.00 0.00 0.00
Abbreviations: OSHA = Occupational Safety and Health Administration. * Injury incidence rate = (number of injuries/total facility full-time employees) x 10,000. † OSHA-recordable injuries are defined as work-related injuries and illnesses that result in death, loss of consciousness, days away from work, restricted work activity or
job transfer, medical treatment beyond first aid, or any substantial work related injury or illness that is diagnosed by a physician or other licensed health care professional. § Average worker-months = 125,041; worker-months are the number of full-time equivalent workers at a facility (or group of facilities) multiplied by the number of
months worked within the reporting period. For example, a facility with 1,000 full-time equivalent workers has 12,000 worker-months in a 12 month reporting period. ¶ Pooled mean is the total number of incidents occurring at the facilities of interest within a given reporting period divided by the sum of the denominators for the
same facilities over the same reporting period. A facility’s denominator is the product of a facility’s size (number of workers) and length of the facility’s participation (in months) within the given reporting period.
** Patient-other = the workplace violence incident involved a patient, and the contributing factor to the incident was mentioned in the report, but it did not fit into one of OHSN’s contributing factor categories.

Morbidity and Mortality Weekly Report
MMWR / April 24, 2015 / Vol. 64 / No. 15 409
dysfunction) as well as ways to moderate and prevent violent patient behavior (3).
The findings in this report are subject to at least four limita-tions. First, in 2012–2014, only 112 U.S. health care facilities from 19 states participated, and the data in this report might not be very representative of the thousands of health care facili-ties in the United States. Second, a considerable proportion of OHSN injury data regarding risk factors are categorized as unspecified, which could limit OHSN’s ability to identify causality and prevention needs. Third, possible participation, reporting, and recording biases might exist. Voluntary par-ticipation might skew participation to best-practice facilities and some facilities might not report all injury data, leading to underestimation of injury rates. Not all facilities collect detailed data requested by OHSN, such as specific activities which lead to patient-handling injuries or why a patient or coworker com-mits violence against health care personnel. Thus, missing data might bias the results. As participating facilities submit more complete information on worker injuries, the large amount of unspecified data might likely diminish. NIOSH personnel can assist facilities with improving data completeness and quality.
OHSN offers a variety of tools for NIOSH and health care institutions to work toward a common goal of employee safety and health by reducing all types of injuries among health care personnel. OHSN enables health care facilities to track injuries; collect and analyze detailed standard injury data to direct resources toward employees, depart-ments, and situations most at risk; compare their own injury rates with groups of their choosing; access prevention resources; facili-tate implementation of timely prevention measures; and monitor intervention impact. Emphasizing worker safety promotes and strengthens patient safety (8), which contrib-utes to improved patient care and reduced costs (9). Future improvements to OHSN include plans to develop a module to sys-tematically collect detailed information on occupational injuries from needles, scalpels, and other sharp objects, and blood and body fluid exposures among health care personnel to assist in creating prevention strategies for those hazards. Targeting prevention strate-gies can protect health care personnel from prevalent, disabling injuries and help in managing resources.
Acknowledgments
Occupational Health Safety Network health care facilities participants; Geoff Calvert; Mary Metz.
1Division of Surveillance, Hazard Evaluations and Field Studies, National Institute for Occupational Safety and Health; 2Public Health Informatics Fellowship Program, Division of Scientific Education and Professional Development, Center for Surveillance, Epidemiology and Laboratory Services, CDC (Corresponding author: Ahmed Gomaa, [email protected], 513-841-4337).
References1. Bureau of Labor Statistics. 2013 Survey of occupational injuries and
illnesses: nonfatal (OSHA recordable) injuries, industry incidence rates and counts. Washington, DC: US Department of Labor, Bureau of Labor Statistics, Safety and Health Statistics Program; 2014. Available at www.bls.gov/iif/oshwc/osh/os/osch0052.pdf.
2. Occupational Safety and Health Administration. Safety and health topics: healthcare. Washington, DC: US Department of Labor, Occupational Safety and Health Administration. Available at https://www.osha.gov/SLTC/healthcarefacilities/index.html.
3. CDC. NIOSH Occupational Health Safety Network. Cincinnati, OH: US Department of Health and Human Services, CDC, National Institute for Occupational Safety and Health; 2015. Available at http://www.cdc.gov/niosh/topics/ohsn/.
FIGURE 1. Comparison of OSHA-recordable* injury incidence rates† per 10,000 worker-months§ by occupation groups among 112 U.S. health care facilities, January 1, 2012–September 30, 2014
0 5 10 15 20 25 30 35 40
Workplaceviolence
Slips, trips, falls
Patienthandling and
movement
Incidence rate per 10,000 worker-months
Nurse assistants
Nurses
All health care personnel¶
Physicians, dentists, interns and residents
Abbreviations: OSHA = Occupational Safety and Health Administration.*OSHA-recordable injuries are defined as work-related injuries and illnesses that result in at least one
of the following: death, loss of consciousness, days away from work, restricted work activity or job transfer, medical treatment beyond first aid, or a diagnosis by a physician or other licensed health care professional.
† Injury incidence rate = (number of injuries/total facility full-time employees) x 10,000.§ Worker-months are the number of full-time equivalent workers at a facility (or group of facilities)
multiplied by the number of months worked within the reporting period. For example, a facility with 1,000 full-time equivalent workers has 12,000 worker-months in a 12 month reporting period. Worker-months are specific for each occupation (e.g., only full-time equivalent nurses are used to calculate incidence rates for nurses).
¶ Nonpatient care staff is included in all health care personnel.
Morbidity and Mortality Weekly Report
410 MMWR / April 24, 2015 / Vol. 64 / No. 15
4. Arnetz JE, Hamblin L, Essenmacher L, Upfal MJ, Ager J, Luborsky M. Understanding patient-to-worker violence in hospitals: a qualitative analysis of documented incident reports. J Adv Nurs 2015;71:338–48.
5. Bureau of Labor Statistics. News release: nonfatal occupational injuries and illnesses requiring days away from work, 2013. Washington, DC: US Department of Labor, Bureau of Labor Statistics, Safety and Health Statistics Program; 2014. Available at http://www.bls.gov/news.release/osh2.nr0.htm.
6. Patient Safety Network. Patient safety primer: nursing and patient safety. Washington, DC: US Department of Health and Human Services, Agency for Healthcare Research and Quality; 2012. Available at http://psnet.ahrq.gov/primer.aspx?primerID=22.
7. Powell-Cope G, Toyinbo P, Patel N, et al. Effects of a national safe patient handling program on nursing injury incidence rates. J Nurs Adm 2014;44:525–34.
8. Sinnott M, Shaban RZ. Can we have a culture of patient safety without one of staff safety? BMJ 2011;342:c6171.
9. Sinnott M, Eley R, Winch S. Introducing the safety score audit for staff member and patient safety. AORN J 2014;100:91–5.
What is already known on this topic?
The health care and social assistance sector accounts for the greatest proportion (20.7%) of private industry nonfatal occupational injuries among all sectors. The most common injuries are due to patient handling; slips, trips, and falls; and workplace violence.
What is added by this report?
The Occupational Health Safety Network (OHSN) collects and reports near real-time, specific, standard benchmarking information on injuries to help target prevention measures toward workers, departments, and activities at highest risk. From January 1, 2012 to September 30, 2014, the highest incidence rates of the three categories of occupational injuries were among nurse assistants and nurses. Workplace violence injury incidence rates increased from 2012 to 2014; most of these injuries were physical in nature and caused by patients. In over half of patient handling injuries, lifting equipment was not used (51%).
What are the implications for public health practice?
Injury prevention interventions mitigating high-risk aspects of nurse and nurse assistant duties are needed. Safety cultures that emphasize continuous improvement and support resources such as routine use of lifting equipment, as well as safe patient-handling training and lifting teams, might prevent many of the musculoskeletal disorders from patient handling and the associated costs of diagnosis, treatment, and disability.
FIGURE 2. Comparison of OSHA-recordable workplace violence injury incidence rates per 10,000 worker-months* by year among 112 U.S. health care facilities, January 1, 2012–September 30, 2014
0
2
4
6
8
10
12
14
16
18
2012 2013 2014
Inci
denc
e ra
te p
er 1
0,00
0 w
orke
r-m
onth
s
Nurse assistantsNursesAll health care personnelPhysicians, dentists, interns, residents
Abbreviation: OSHA = Occupational Health and Safety Administration.* Worker-months are the number of full-time equivalent workers at a facility (or group of facilities)
multiplied by the number of months worked within the reporting period. For example, a facility with 1,000 full-time equivalent workers has 12,000 worker-months in a 12-month reporting period. Worker-months are specific for each occupation (e.g., only full-time equivalent nurses are used to calculate incidence rates for nurses).
Morbidity and Mortality Weekly Report
MMWR / April 24, 2015 / Vol. 64 / No. 15 411
Work-related asthma is asthma that is caused or exacer-bated by exposure to specific substances in the workplace (1). Approximately 10%–16% of adult-onset asthma cases are attributable to occupational factors, and estimates of asthma exacerbated by work range from 13% to 58% (1–3). During 2008–2012, the Massachusetts Department of Public Health received nine reports of work-related asthma among workers at a facility that manufactured syntactic foam used for flotation in the offshore oil and gas industry. These reports and a request from facility employees led to a CDC health hazard evaluation during 2012–2013 in which CDC reviewed records, toured the facility, and administered a questionnaire to current employees. Investigators found that workers’ risk for asthma increased substantially after hire, possibly because of known asthma triggers (i.e., asthmagens) used in production. The company has since initiated efforts to reduce employee exposures to these substances. This cluster of work-related asthma was identified through CDC-funded, state-based surveillance and demonstrates complementary state and federal investigations.
Case ReportIn March 2007, a man aged 53 years with no history of
smoking or respiratory disease other than seasonal allergies began employment as an electrician at the syntactic foam manufacturer described in this report. He installed and repaired machines and wiring above machines throughout the facility. These machines processed epoxy resins, curing agents, and other materials, releasing vapors and dust. He occasionally wore a cartridge respirator. In September 2008, he experienced nasal congestion, dyspnea, wheeze, and a nonproductive cough. Despite treatment for allergies and bronchitis, the respiratory symptoms progressed. After 6 weeks, he received a diagnosis of asthmatic bronchitis and began taking an inhaled steroid and a bronchodilator. The symptoms improved but did not resolve. He noted that he felt worse after several hours at work and better when he was away from work.
Over the next 4 months, the man went to the emergency department on several occasions for dyspnea, wheezing, and chest discomfort. In February 2009, suspecting a workplace chemical as the cause of the symptoms, his pulmonologist recommended he take a medical leave of absence for asthma.
His symptoms improved. During June–August 2009, he had no exacerbations requiring emergency department visits.
In September 2009, he returned to work with restrictions in place to help prevent exposure to epoxy resins and curing agents. He wore a respirator and avoided the building that used epoxy resins and curing agents. After 3 days, he began experiencing dyspnea and chest tightness. He continued work-ing, and over the next 15 months, he went to the emergency department four times for acute asthma exacerbations. In November 2010, he left his job because of his work-related symptoms. Since leaving, his respiratory symptoms have greatly improved. He still complains of dyspnea when breathing cold air; otherwise, his activities of daily living are not limited. He uses his asthma inhaler 2–3 times per year, representing a large reduction in his inhaler dependence.
Workplace InvestigationIn 2012, a CDC health hazard evaluation was requested by
employees of a facility that manufactured syntactic foam used for flotation in the offshore oil and gas industry. In addition, the Massachusetts Department of Public Health recognized a cluster of work-related asthma in their state-based surveillance. During 2008–2012, the department had received nine reports of work-related asthma among workers at the same facility. These cases were reported by six different physicians through the state’s work-related asthma surveillance program, which is supported by CDC. CDC investigators toured the facility to learn about the work processes and conditions and interviewed some production managers, safety managers, and current and former employees. CDC reviewed safety data sheets, injury logs, and medical records and interviewed physicians about illness and exposures among the workers. Known chemical asthmagens were used in the production processes at the facility. In August 2013, all current employees were invited to participate in an interviewer-administered, interpreter-assisted health and work history questionnaire. Using data from the questionnaire, the incidence densities of self-reported adult-onset asthma diagnosed by a physician before and after hire were estimated using birth date, hire date, and diagnosis date. Asthma incidence density before hire was calculated by adding the number of adult-onset asthma diagnoses that occurred before hire and dividing by the sum of participants’ years at risk
Work-Related Asthma Cluster at a Syntactic Foam Manufacturing Facility — Massachusetts 2008–2013
Megan Casey, MPH1,2, Marcia L. Stanton2, Kristin J. Cummings, MD2, Elise Pechter, MPH3, Kathleen Fitzsimmons, MPH3, Ryan F. LeBouf, PhD2, Christine R. Schuler, PhD4, Kathleen Kreiss, MD2 (Author affiliations at the end of text)

Morbidity and Mortality Weekly Report
412 MMWR / April 24, 2015 / Vol. 64 / No. 15
before hire. Asthma incidence density after hire was calculated by adding the number of adult-onset asthma diagnoses that occurred after hire and dividing by the sum of participants’ time at risk after hire. An incidence ratio was calculated using Poisson regression. Asthma-like symptoms were defined as a response of “yes” to any of the following questions (4):
1. “Are you currently taking any medicine (including inhalers, aerosols or tablets) for asthma?”
2. “Have you had wheezing or whistling in your chest at any time in the last 12 months?”
3. “Have you woken up with a feeling of tightness in your chest at any time in the last 12 months?”
4. “Have you been woken by an attack of shortness of breath at any time in the last 12 months?”
Symptoms that improved when the employees were away from work, either on their days off or when they were on vaca-tion, were considered work related.
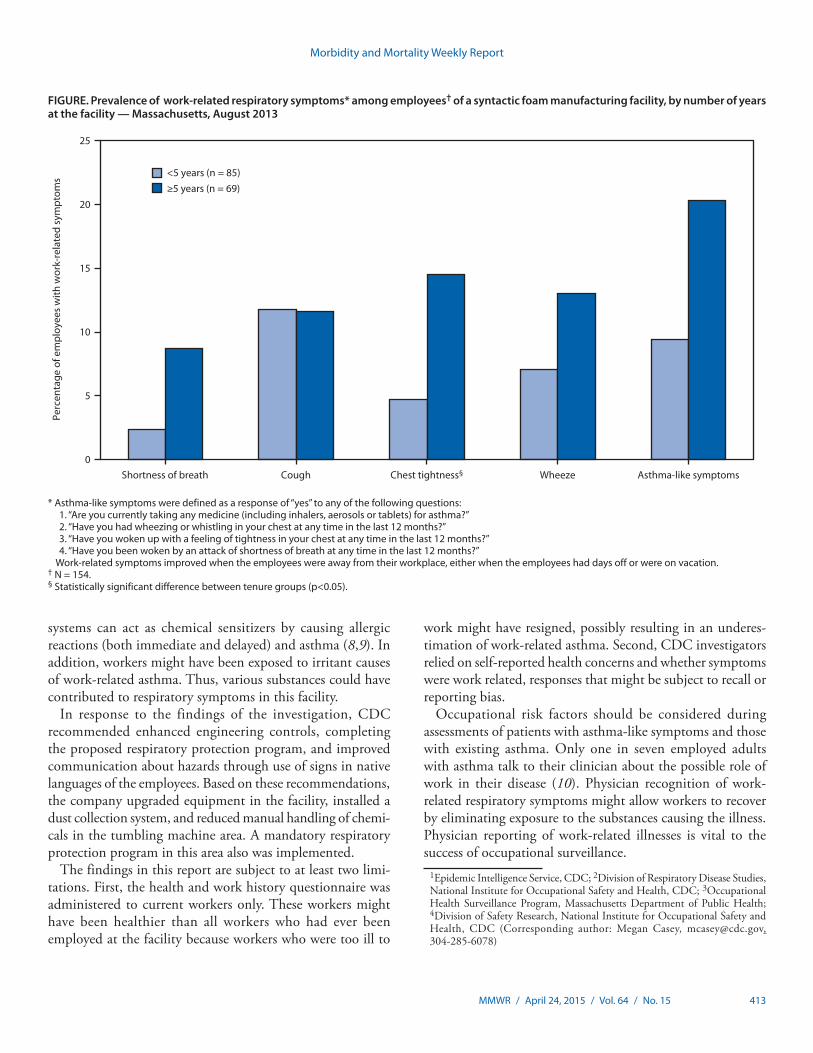
A total of 154 (93%) current employees completed the questionnaire. Respondents were primarily men (97%) and foreign born (69%), with a median age of 40 years (range: 21–69 years) and median work tenure at the facility of 5 years (range: <1–21 years). Most worked in production or production support (92%), and the remainder worked in administrative positions. Nine percent (14 of 154) reported receiving a diagnosis of asthma from a physician, and 5% (7 of 154) reported current asthma (Table). Eight of the 14 persons had onset as an adult (i.e., age >18 years), and six of the eight reported receiving a diagnosis of asthma after hire. Available data suggested these six cases had not been previously reported to the Massachusetts Department of Public Health. Adult-onset asthma incidence was 12 times higher (95% confidence interval: 2.3–57.5; p = 0.003) after hire (n = 6; 8.3 cases/1,000 person-years) than before hire (n = 2; 0.7 cases/1000 person-years). Thirty-six (23%) of all respondents reported asthma-like symptoms, the majority (61%) of which had a work-related pattern (Table). Asthma-like symptoms were reported more frequently by those with longer tenure (Figure). Among the 140 respondents without asthma diagnosed by a physician, 27 (19%), or one in five, reported asthma-like symptoms, and 16 (11%) had symptoms that were work related.
Discussion
This report highlights several important features of work-related asthma, including 1) the temporal relationship between work and symptoms facilitating diagnosis and 2) the frequently ineffective measure of exposure reduction in contrast to the effective measure of complete exposure cessation (6,7). Early identification of affected workers is important because total removal from continued exposure can result in a resolution of asthma symptoms. For example, in one study of workers
exposed to an epoxy resin containing methyltetrahydrophthalic anhydride (MTHPA), sensitized workers (i.e., with specific serum immunoglobulin E antibodies to MTHPA) who per-manently left their place of employment experienced reduced bronchial reactivity and became symptom-free, whereas work-ers who stayed experienced no such improvement, despite a tenfold reduction in workplace exposures (8).
The cluster of work-related asthma cases in this report was identified through state-based surveillance funded by CDC. Since 1987, CDC has funded a limited number of state health departments to develop programs for state-based and condition-specific occupational disease and injury surveillance. Diagnosed cases of work-related asthma can act as sentinel events to trigger a public health investigation and intervention (5).
This workplace investigation identified probable additional asthma cases diagnosed by physicians and revealed additional asthma-like symptoms that could represent undiagnosed asthma among coworkers. Although a specific cause was not identified, many potential causes of asthma existed in the facility. Amines and anhydrides found in epoxy resin
TABLE. Self-reported respiratory symptoms and asthma diagnoses among current workers* at a syntactic foam manufacturer — Massachusetts, August 2013
Symptom or asthma diagnosis
Overall Work related†
No. (%) No. (%)
Symptom (in last 12 months)Shortness of breath 13 (8) 8 (5)Cough 38 (25) 18 (12)Wheeze 23 (15) 15 (10)Chest tightness 20 (13) 14 (9)Burning throat 21 (14) 17 (11)Asthma attack 5 (3) 2 (1)Asthma-like symptoms§ 36 (23) 22 (14)Asthma diagnosis (ever)¶ 14 (9) — —Adult onset** 8 (5) — —After hire** 6 (4) — —
* N = 154. † Work-related symptoms were defined as symptoms that improved when the
employees were away from their workplace, either when the employees had days off or were on vacation.
§ Asthma-like symptoms were defined as a response of “yes” to any of the following questions (Source: Grassi M, Rezzani C, Biino G, Marinoni A. Asthma-like symptoms assessment through ECRHS screening questionnaire scoring. J Clin Epidemiol 2003;56:238–47):1. “Are you currently taking any medicine (including inhalers, aerosols or
tablets) for asthma?” 2. “Have you had wheezing or whistling in your chest at any time in the last
12 months?”3. “Have you woken up with a feeling of tightness in your chest at any time
in the last 12 months?”4. “Have you been woken by an attack of shortness of breath at any time in
the last 12 months?” ¶ Respondents who ever received a diagnosis of asthma responded “yes” to
the question: “Has a physician ever told you that you have asthma?” Adult-onset asthma cases were diagnosed among persons aged >18 years.
** Categories of adult-onset and after hire are not mutually exclusive. Some respondents might be reflected in both categories.
Morbidity and Mortality Weekly Report
MMWR / April 24, 2015 / Vol. 64 / No. 15 413
systems can act as chemical sensitizers by causing allergic reactions (both immediate and delayed) and asthma (8,9). In addition, workers might have been exposed to irritant causes of work-related asthma. Thus, various substances could have contributed to respiratory symptoms in this facility.
In response to the findings of the investigation, CDC recommended enhanced engineering controls, completing the proposed respiratory protection program, and improved communication about hazards through use of signs in native languages of the employees. Based on these recommendations, the company upgraded equipment in the facility, installed a dust collection system, and reduced manual handling of chemi-cals in the tumbling machine area. A mandatory respiratory protection program in this area also was implemented.
The findings in this report are subject to at least two limi-tations. First, the health and work history questionnaire was administered to current workers only. These workers might have been healthier than all workers who had ever been employed at the facility because workers who were too ill to
work might have resigned, possibly resulting in an underes-timation of work-related asthma. Second, CDC investigators relied on self-reported health concerns and whether symptoms were work related, responses that might be subject to recall or reporting bias.
Occupational risk factors should be considered during assessments of patients with asthma-like symptoms and those with existing asthma. Only one in seven employed adults with asthma talk to their clinician about the possible role of work in their disease (10). Physician recognition of work-related respiratory symptoms might allow workers to recover by eliminating exposure to the substances causing the illness. Physician reporting of work-related illnesses is vital to the success of occupational surveillance. 1Epidemic Intelligence Service, CDC; 2Division of Respiratory Disease Studies,
National Institute for Occupational Safety and Health, CDC; 3Occupational Health Surveillance Program, Massachusetts Department of Public Health; 4Division of Safety Research, National Institute for Occupational Safety and Health, CDC (Corresponding author: Megan Casey, [email protected], 304-285-6078)
FIGURE. Prevalence of work-related respiratory symptoms* among employees† of a syntactic foam manufacturing facility, by number of years at the facility — Massachusetts, August 2013
0
5
10
15
20
25
Shortness of breath Cough Chest tightness§ Wheeze Asthma-like symptoms
Perc
enta
ge o
f em
ploy
ees
with
wor
k-re
late
d sy
mpt
oms <5 years (n = 85)
≥5 years (n = 69)
* Asthma-like symptoms were defined as a response of “yes” to any of the following questions: 1. “Are you currently taking any medicine (including inhalers, aerosols or tablets) for asthma?” 2. “Have you had wheezing or whistling in your chest at any time in the last 12 months?” 3. “Have you woken up with a feeling of tightness in your chest at any time in the last 12 months?” 4. “Have you been woken by an attack of shortness of breath at any time in the last 12 months?”
Work-related symptoms improved when the employees were away from their workplace, either when the employees had days off or were on vacation.† N = 154. § Statistically significant difference between tenure groups (p<0.05).
Morbidity and Mortality Weekly Report
414 MMWR / April 24, 2015 / Vol. 64 / No. 15
Acknowledgments
Occupational Health Surveillance Program, Massachusetts Department of Public Health; Rachel L. Bailey, DO, Kathleen Fedan, Division of Respiratory Disease Studies, National Institute for Occupational Safety and Health, CDC.
References 1. Tarlo SM, Balmes J, Balkissoon R, et al. Diagnosis and management of
work-related asthma: American College of Chest Physicians consensus statement. Chest 2008;134(Suppl):1S–41S.
2. Henneberger PK, Redlich CA, Callahan DB, et al; ATS Ad Hoc Committee on Work-Exacerbated Asthma. An official American Thoracic Society statement: work-exacerbated asthma. Am J Respir Crit Care Med 2011;184:368–78.
3. Torén K, Blanc PD. Asthma caused by occupational exposures is common—a systematic analysis of estimates of the population-attributable fraction. BMC Pulm Med 2009;9:7.
4. Grassi M, Rezzani C, Biino G, Marinoni A. Asthma-like symptoms assessment through ECRHS screening questionnaire scoring. J Clin Epidemiol 2003;56:238–47.
5. Reed PL, Rosenman K, Gardiner J, Reeves M, Reilly MJ. Evaluating the Michigan SENSOR Surveillance Program for work-related asthma. Am J Ind Med 2007;50:646–56.
6. Vandenplas O, Dressel H, Wilken D, et al. Management of occupational asthma: cessation or reduction of exposure? A systematic review of available evidence. Eur Respir J 2011;38:804–11.
7. Baur X, Sigsgaard T, Aasen TB, et al; ERS Task Force on the Management of Work-Related Asthma. Guidelines for the management of work-related asthma. Eur Respir J 2012;39:529–45.
8. Nielsen J, Welinder H, Horstmann V, Skerfving S. Allergy to methyltetrahydrophthalic anhydride in epoxy resin workers. Br J Ind Med 1992;49:769–75.
9. Fawcett IW, Newman Taylor AJ, Pepys J. Asthma due to inhaled chemical agents—epoxy resin systems containing phthalic acid anhydride, trimellitic acid anhydride and triethylene tetramine. Clin Allergy 1977;7:1–14.
10. Mazurek JM, Storey E. Physician-patient communication regarding asthma and work. Am J Prev Med 2012;43:72–5.
What is already known about this topic?
Work-related asthma is common but is underrecognized and underreported by clinicians. Early diagnosis of work-related asthma and subsequent cessation of exposure to substances that cause asthma can lead to resolution of asthma symptoms among workers with existing asthma and can prevent future cases.
What is added by this report?
This cluster of work-related asthma was identified by CDC-funded, state-based surveillance. A CDC investigation identified additional asthma cases diagnosed by physicians and revealed additional asthma-like symptoms that could represent undiag-nosed asthma among coworkers. Adult-onset asthma incidence was 12 times higher after hire than before hire.
What are the implications for public health practice?
Diagnosed cases of work-related asthma can be sentinel events that trigger public health investigations and interventions. Occupational risk factors should be considered among patients with asthma-like symptoms and those with existing asthma. Sentinel occupational health surveillance can be an important tool for identifying emerging work-related risks.
Morbidity and Mortality Weekly Report
MMWR / April 24, 2015 / Vol. 64 / No. 15 415
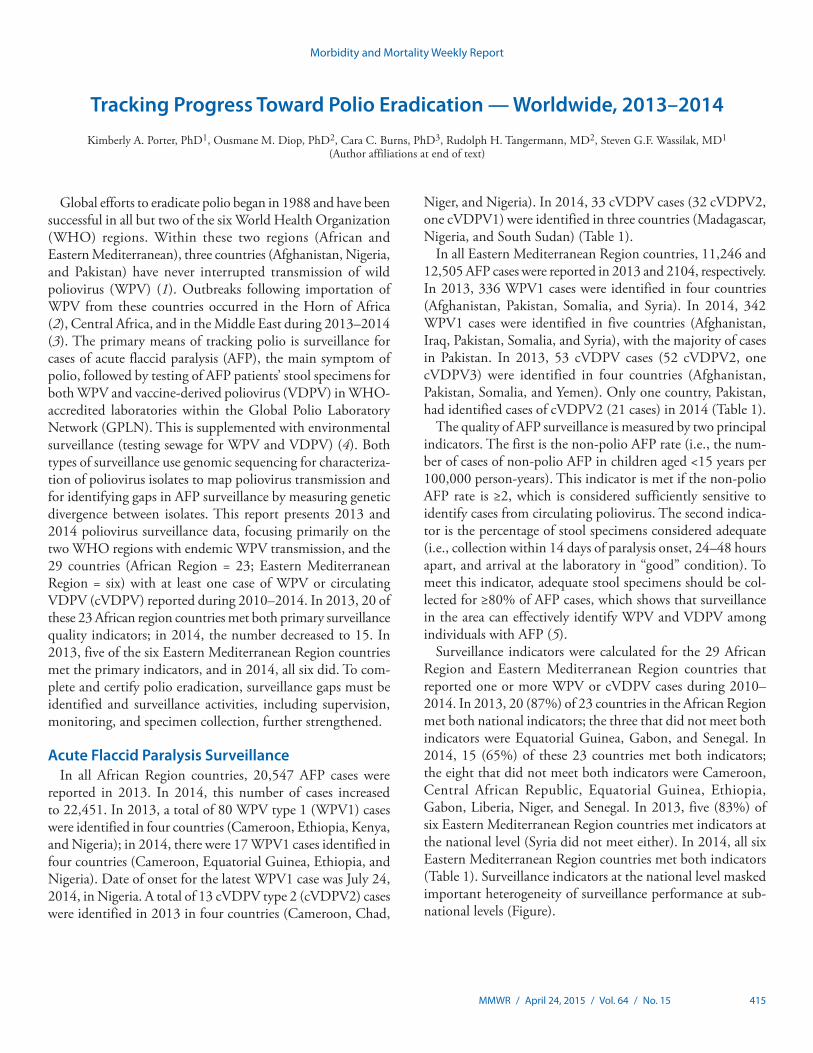
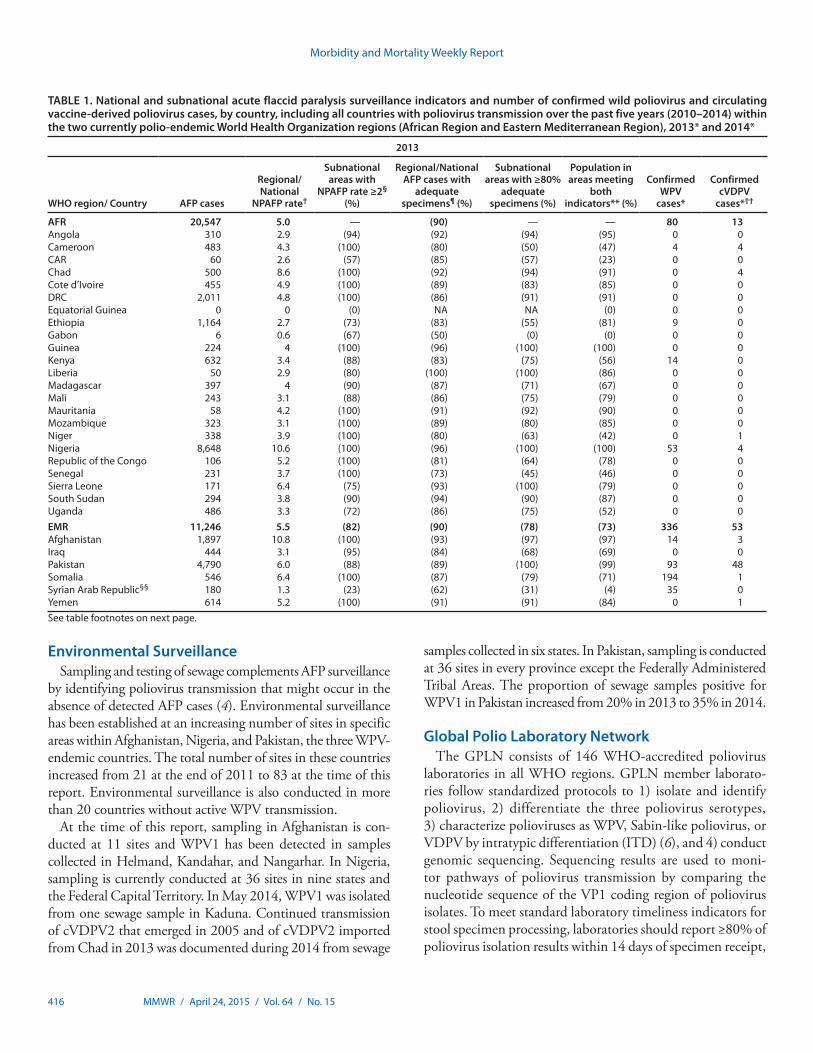
Global efforts to eradicate polio began in 1988 and have been successful in all but two of the six World Health Organization (WHO) regions. Within these two regions (African and Eastern Mediterranean), three countries (Afghanistan, Nigeria, and Pakistan) have never interrupted transmission of wild poliovirus (WPV) (1). Outbreaks following importation of WPV from these countries occurred in the Horn of Africa (2), Central Africa, and in the Middle East during 2013–2014 (3). The primary means of tracking polio is surveillance for cases of acute flaccid paralysis (AFP), the main symptom of polio, followed by testing of AFP patients’ stool specimens for both WPV and vaccine-derived poliovirus (VDPV) in WHO-accredited laboratories within the Global Polio Laboratory Network (GPLN). This is supplemented with environmental surveillance (testing sewage for WPV and VDPV) (4). Both types of surveillance use genomic sequencing for characteriza-tion of poliovirus isolates to map poliovirus transmission and for identifying gaps in AFP surveillance by measuring genetic divergence between isolates. This report presents 2013 and 2014 poliovirus surveillance data, focusing primarily on the two WHO regions with endemic WPV transmission, and the 29 countries (African Region = 23; Eastern Mediterranean Region = six) with at least one case of WPV or circulating VDPV (cVDPV) reported during 2010–2014. In 2013, 20 of these 23 African region countries met both primary surveillance quality indicators; in 2014, the number decreased to 15. In 2013, five of the six Eastern Mediterranean Region countries met the primary indicators, and in 2014, all six did. To com-plete and certify polio eradication, surveillance gaps must be identified and surveillance activities, including supervision, monitoring, and specimen collection, further strengthened.
Acute Flaccid Paralysis SurveillanceIn all African Region countries, 20,547 AFP cases were
reported in 2013. In 2014, this number of cases increased to 22,451. In 2013, a total of 80 WPV type 1 (WPV1) cases were identified in four countries (Cameroon, Ethiopia, Kenya, and Nigeria); in 2014, there were 17 WPV1 cases identified in four countries (Cameroon, Equatorial Guinea, Ethiopia, and Nigeria). Date of onset for the latest WPV1 case was July 24, 2014, in Nigeria. A total of 13 cVDPV type 2 (cVDPV2) cases were identified in 2013 in four countries (Cameroon, Chad,
Niger, and Nigeria). In 2014, 33 cVDPV cases (32 cVDPV2, one cVDPV1) were identified in three countries (Madagascar, Nigeria, and South Sudan) (Table 1).
In all Eastern Mediterranean Region countries, 11,246 and 12,505 AFP cases were reported in 2013 and 2104, respectively. In 2013, 336 WPV1 cases were identified in four countries (Afghanistan, Pakistan, Somalia, and Syria). In 2014, 342 WPV1 cases were identified in five countries (Afghanistan, Iraq, Pakistan, Somalia, and Syria), with the majority of cases in Pakistan. In 2013, 53 cVDPV cases (52 cVDPV2, one cVDPV3) were identified in four countries (Afghanistan, Pakistan, Somalia, and Yemen). Only one country, Pakistan, had identified cases of cVDPV2 (21 cases) in 2014 (Table 1).
The quality of AFP surveillance is measured by two principal indicators. The first is the non-polio AFP rate (i.e., the num-ber of cases of non-polio AFP in children aged <15 years per 100,000 person-years). This indicator is met if the non-polio AFP rate is ≥2, which is considered sufficiently sensitive to identify cases from circulating poliovirus. The second indica-tor is the percentage of stool specimens considered adequate (i.e., collection within 14 days of paralysis onset, 24–48 hours apart, and arrival at the laboratory in “good” condition). To meet this indicator, adequate stool specimens should be col-lected for ≥80% of AFP cases, which shows that surveillance in the area can effectively identify WPV and VDPV among individuals with AFP (5).
Surveillance indicators were calculated for the 29 African Region and Eastern Mediterranean Region countries that reported one or more WPV or cVDPV cases during 2010–2014. In 2013, 20 (87%) of 23 countries in the African Region met both national indicators; the three that did not meet both indicators were Equatorial Guinea, Gabon, and Senegal. In 2014, 15 (65%) of these 23 countries met both indicators; the eight that did not meet both indicators were Cameroon, Central African Republic, Equatorial Guinea, Ethiopia, Gabon, Liberia, Niger, and Senegal. In 2013, five (83%) of six Eastern Mediterranean Region countries met indicators at the national level (Syria did not meet either). In 2014, all six Eastern Mediterranean Region countries met both indicators (Table 1). Surveillance indicators at the national level masked important heterogeneity of surveillance performance at sub-national levels (Figure).
Tracking Progress Toward Polio Eradication — Worldwide, 2013–2014Kimberly A. Porter, PhD1, Ousmane M. Diop, PhD2, Cara C. Burns, PhD3, Rudolph H. Tangermann, MD2, Steven G.F. Wassilak, MD1
(Author affiliations at end of text)
Morbidity and Mortality Weekly Report
416 MMWR / April 24, 2015 / Vol. 64 / No. 15
Environmental SurveillanceSampling and testing of sewage complements AFP surveillance
by identifying poliovirus transmission that might occur in the absence of detected AFP cases (4). Environmental surveillance has been established at an increasing number of sites in specific areas within Afghanistan, Nigeria, and Pakistan, the three WPV-endemic countries. The total number of sites in these countries increased from 21 at the end of 2011 to 83 at the time of this report. Environmental surveillance is also conducted in more than 20 countries without active WPV transmission.
At the time of this report, sampling in Afghanistan is con-ducted at 11 sites and WPV1 has been detected in samples collected in Helmand, Kandahar, and Nangarhar. In Nigeria, sampling is currently conducted at 36 sites in nine states and the Federal Capital Territory. In May 2014, WPV1 was isolated from one sewage sample in Kaduna. Continued transmission of cVDPV2 that emerged in 2005 and of cVDPV2 imported from Chad in 2013 was documented during 2014 from sewage
samples collected in six states. In Pakistan, sampling is conducted at 36 sites in every province except the Federally Administered Tribal Areas. The proportion of sewage samples positive for WPV1 in Pakistan increased from 20% in 2013 to 35% in 2014.
Global Polio Laboratory NetworkThe GPLN consists of 146 WHO-accredited poliovirus
laboratories in all WHO regions. GPLN member laborato-ries follow standardized protocols to 1) isolate and identify poliovirus, 2) differentiate the three poliovirus serotypes, 3) characterize polioviruses as WPV, Sabin-like poliovirus, or VDPV by intratypic differentiation (ITD) (6), and 4) conduct genomic sequencing. Sequencing results are used to moni-tor pathways of poliovirus transmission by comparing the nucleotide sequence of the VP1 coding region of poliovirus isolates. To meet standard laboratory timeliness indicators for stool specimen processing, laboratories should report ≥80% of poliovirus isolation results within 14 days of specimen receipt,
See table footnotes on next page.
TABLE 1. National and subnational acute flaccid paralysis surveillance indicators and number of confirmed wild poliovirus and circulating vaccine-derived poliovirus cases, by country, including all countries with poliovirus transmission over the past five years (2010–2014) within the two currently polio-endemic World Health Organization regions (African Region and Eastern Mediterranean Region), 2013* and 2014*
2013
WHO region/ Country AFP cases
Regional/ National
NPAFP rate†
Subnational areas with
NPAFP rate ≥2§ (%)
Regional/National AFP cases with
adequate specimens¶ (%)
Subnational areas with ≥80%
adequate specimens (%)
Population in areas meeting
both indicators** (%)
Confirmed WPV
cases*
Confirmed cVDPV
cases*††
AFR 20,547 5.0 — (90) — — 80 13Angola 310 2.9 (94) (92) (94) (95) 0 0Cameroon 483 4.3 (100) (80) (50) (47) 4 4CAR 60 2.6 (57) (85) (57) (23) 0 0Chad 500 8.6 (100) (92) (94) (91) 0 4Cote d’Ivoire 455 4.9 (100) (89) (83) (85) 0 0DRC 2,011 4.8 (100) (86) (91) (91) 0 0Equatorial Guinea 0 0 (0) NA NA (0) 0 0Ethiopia 1,164 2.7 (73) (83) (55) (81) 9 0Gabon 6 0.6 (67) (50) (0) (0) 0 0Guinea 224 4 (100) (96) (100) (100) 0 0Kenya 632 3.4 (88) (83) (75) (56) 14 0Liberia 50 2.9 (80) (100) (100) (86) 0 0Madagascar 397 4 (90) (87) (71) (67) 0 0Mali 243 3.1 (88) (86) (75) (79) 0 0Mauritania 58 4.2 (100) (91) (92) (90) 0 0Mozambique 323 3.1 (100) (89) (80) (85) 0 0Niger 338 3.9 (100) (80) (63) (42) 0 1Nigeria 8,648 10.6 (100) (96) (100) (100) 53 4Republic of the Congo 106 5.2 (100) (81) (64) (78) 0 0Senegal 231 3.7 (100) (73) (45) (46) 0 0Sierra Leone 171 6.4 (75) (93) (100) (79) 0 0South Sudan 294 3.8 (90) (94) (90) (87) 0 0Uganda 486 3.3 (72) (86) (75) (52) 0 0EMR 11,246 5.5 (82) (90) (78) (73) 336 53Afghanistan 1,897 10.8 (100) (93) (97) (97) 14 3Iraq 444 3.1 (95) (84) (68) (69) 0 0Pakistan 4,790 6.0 (88) (89) (100) (99) 93 48Somalia 546 6.4 (100) (87) (79) (71) 194 1Syrian Arab Republic§§ 180 1.3 (23) (62) (31) (4) 35 0Yemen 614 5.2 (100) (91) (91) (84) 0 1
Morbidity and Mortality Weekly Report
MMWR / April 24, 2015 / Vol. 64 / No. 15 417
≥80% of ITD results within 7 days of isolate receipt, and ≥80% of sequencing results within 7 days of identifying isolate intra-type. The standard programmatic indicator combining field and laboratory performance is to report ITD results for ≥80% of isolates within 60 days of paralysis onset of AFP cases. This indicator takes into account the entire interval from paralysis onset to specimen testing (the Eastern Mediterranean Region uses a 45-day timeframe). The accuracy and quality of testing
at GPLN member laboratories is monitored through an annual accreditation program of onsite reviews and proficiency testing.
During 2013–2014, GPLN laboratories met timeliness indicators for poliovirus isolation in five of six WHO regions in each year and reporting indicators for receipt-to-ITD results in five of six regions in 2013 and all regions in 2014 (Table 2). The overall timeliness indicator for onset-to-ITD results was met in all regions in both years. The GPLN tested 197,658 stool specimens in 2013 and 204,078 stool specimens in 2014.
TABLE 1. (Continued) National and subnational acute flaccid paralysis surveillance indicators and number of confirmed wild poliovirus and circulating vaccine-derived poliovirus cases, by country, including all countries with poliovirus transmission over the past five years (2010–2014) within the two currently polio-endemic World Health Organization regions (African Region and Eastern Mediterranean Region), 2013* and 2014*
2014
WHO region/ Country AFP cases
Regional/ National
NPAFP rate†
Subnational areas with
NPAFP rate ≥2§ (%)
Regional/National AFP cases with
adequate specimens¶ (%)
Subnational areas with ≥80%
adequate specimens (%)
Population in areas meeting
both indicators** (%)
Confirmed WPV
cases*
Confirmed cVDPV
cases*††
AFR 22,451 5.5 — (89) — — 17 33Angola 321 3.1 (100) (93) (94) (97) 0 0Cameroon 845 8.2 (100) (72) (20) (26) 5 0CAR 89 4.2 (71) (78) (71) (50) 0 0Chad 394 7 (100) (85) (72) (73) 0 0Cote d’Ivoire 395 4.1 (94) (86) (61) (73) 0 0DRC 1,829 4.6 (100) (82) (82) (76) 0 0Equatorial Guinea 32 7.8 (100) (16) (0) (0) 5 0Ethiopia 1,198 2.9 (82) (76) (27) (27) 1 0Gabon 42 4.8 (78) (31) (10) (0) 0 0Guinea 146 2.6 (75) (88) (89) (52) 0 0Kenya 724 4.3 (100) (88) (100) (100) 0 0Liberia 23 1.2 (58) (96) (92) (21) 0 0Madagascar 421 4.2 (91) (84) (55) (65) 0 1Mali 236 3 (100) (89) (75) (92) 0 0Mauritania 53 3.8 (92) (81) (62) (45) 0 0Mozambique 317 3 (90) (87) (70) (77) 0 0Niger 249 2.9 (75) (71) (13) (14) 0 0Nigeria 10,507 12.9 (100) (97) (100) (100) 6 30Republic of the Congo 114 5.0 (100) (87) (75) (91) 0 0Senegal 190 3.3 (82) (76) (36) (48) 0 0Sierra Leone 71 2.7 (75) (96) (100) (79) 0 0South Sudan 322 4.2 (70) (88) (80) (64) 0 2Uganda 576 3.8 (80) (81) (58) (46) 0 0EMR 12,505 6.1 — (91) — — 342 21Afghanistan 2,420 13.7 (100) (92) (97) (99) 28 0Iraq 591 4.1 (89) (89) (79) (74) 2 0Pakistan 5,327 6.5 (88) (88) (100) (99) 306 21Somalia 420 8 (100) (97) (95) (99) 5 0Syria§§ 305 3.1 (93) (82) (71) (58) 1 0Yemen 578 4.9 (100) (95) (100) (100) 0 0
Abbreviations: — = not calculated, AFP = acute flaccid paralysis; AFR = African Region; CAR = Central African Republic; cVDPV = circulating vaccine-derived poliovirus; DRC = Democratic Republic of the Congo; EMR = Eastern Mediterranean Region; NA = stool specimens not collected; NPAFP = non-polio AFP; WHO = World Health Organization; WPV = wild poliovirus. * Data as of March 27, 2015. † Per 100,000 persons aged <15 years. § For all subnational areas regardless of population size. ¶ Standard WHO target is adequate stool specimen collection from ≤80 of AFP cases, in which two specimens are collected ≥24 hours (in this data set this is a treated
as ≥1 calendar day) apart, and within 14 days of paralysis onset, and arrive in good condition (received on ice or frozen ice packs, and without leakage or desiccation) in a WHO-accredited laboratory.
** For all subnational areas regardless of population size. The two indicators are 1) National NPAFP rates of ≥2 and 2) ≥80% of AFP cases with adequate specimens (see footnote 4).
†† cVDPV is associated with two or more cases of AFP. Note, however, that the Madagascar event in 2014 occurred in one AFP case and three contacts. §§ The NPAFP rate for Syria is artificially low because of displaced populations and the lack of official data from areas not under government control.

Morbidity and Mortality Weekly Report
418 MMWR / April 24, 2015 / Vol. 64 / No. 15
In 2013, 416 WPV isolates were detected from AFP case samples compared with 359 WPV isolates detected in 2014. In addition, cVDPV was detected from 66 AFP case samples in 2013, compared with 54 cVDPV isolates detected in 2014 (data as of February 25, 2015).
In 2013, the only WPV1 genotypes isolated were WEAF-B1 and SOAS genotypes. In 2013, WEAF-B1 WPVs were detected in five countries (Cameroon, Ethiopia, Kenya, Nigeria, and Somalia). In 2014, WEAF-B1 WPVs were detected in five countries (Cameroon, Equatorial Guinea, Ethiopia, Nigeria, and Somalia). In Ethiopia, Kenya, Nigeria, and Somalia, only one WPV1 cluster* was detected among AFP cases, whereas WPV1 belonging to a different cluster was detected
in Cameroon and Equatorial-Guinea. The SOAS genotype of WPV1 has circulated intensively in Afghanistan and Pakistan and has also been detected in Iraq and Syria. WPV1 isolates of the same cluster found in Iraq and Syria were most closely linked to a WPV1 isolate detected in an environmental sample from Pakistan. This virus was also detected in environmental samples from Egypt and Israel (5).
When genomic sequencing of an isolate shows ≥1.5% nucleotide divergence in the VP1-coding region from previ-ously identified poliovirus isolates (an “orphan”) this highlights prolonged undetected circulation and gaps in AFP surveil-lance. Sequence analysis indicates that, as in 2013, WPV1 and cVDPV cases were likely being missed by AFP surveil-lance in 2014. In 2014, orphan WPV1 isolates were detected in ten of 306 WPV1 cases reported from Pakistan, five of 28
FIGURE. Combined performance indicators for the quality of acute flaccid paralysis (AFP) surveillance* in subnational areas (states and provinces) of 29 countries that were polio-affected during 2010–2014 — World Health Organization African and Eastern Mediterranean regions, 2014†
Afghanistan
Algeria
Botswana
Benin
Burundi
Chad
SriLanka
Congo DemocraticRepublic ofthe Congo
Cameroon
CentralAfrican
Republic
Djibouti
Eritrea
Ethiopia
Gambia
Gabon
Ghana
Greece
Guinea
India
Iran (IslamicRepublic of)
Côted'Ivoire
Iraq
Jordan
Kenya
Liberia
Libya
Madagascar
Malawi
Mali
Morocco
Mauritania
Malta
Oman
Maldives
Mozambique
Niger
Nigeria
NepalPakistan
Portugal
Guinea-Bissau
Rwanda
Senegal
Equatorial Guinea
SierraLeone
Somalia
p
Syrian ArabRepublic
Tajikistan
Togo
Tunisia
Turkey Turkmenistan
UnitedRepublic of
Tanzania
Uganda
BurkinaFaso
WesternSahara
Zambia
Zimbabwe
SaudiArabia
emen
Namibia
Egypt
Sudan
SouthSudan
SouthAfrica
Angola
0 1,400 2,800700Kilometers
Provinces or states withpopulation <100,000
NPAFP rate ≥2 andspecimen adequacy <80%OR NPAFP rate <2 andspecimen adequacy ≥80%
NPAFP rate§ ≥2 andspecimen adequacy ≥80%
NPAFP rate <2 andspecimen adequacy <80%
Not applicable
Y
Abbreviation: NPAFP = nonpolio AFP.* The Global Polio Eradication Initiative has set the following targets for countries with current or recent wild poliovirus transmission and their states/provinces:
1) NPAFP detection rate of ≥2 cases per 100,000 persons aged <15 years, and 2) adequate stool specimen collection from ≥80% of AFP cases, with specimen adequacy defined as two specimens collected ≥24 hours apart, both within 14 days of paralysis onset, shipped on ice or frozen packs, and arriving in good condition at a World Health Organization–accredited laboratory.
† Data are for AFP cases with onset during 2014, reported as of March 27, 2015.§ Per 100,000 persons aged <15 years.
* Genetic clusters consist of WPV isolates with >95% VP1 nucleotide identity.

Morbidity and Mortality Weekly Report
MMWR / April 24, 2015 / Vol. 64 / No. 15 419
WPV1 cases reported in Afghanistan, one of six WPV1 cases reported from Nigeria, and one of five WPV1 cases reported from Cameroon. During 2014, orphan cVDPV viruses were also detected in Nigeria and Pakistan.
Discussion
WPV has not been detected in a person with AFP in an African Region or Eastern Mediterranean Region country on the African continent since August 2014 and no sewage sample has tested positive for WPV on the African continent in the countries and areas conducting environmental surveillance in almost 1 year. Although this is an encouraging finding, unde-tected circulation of individual WPV strains for more than a year has been recently documented in African Region and Eastern Mediterranean Region countries. If AFP surveillance is suboptimal, ongoing poliovirus circulation might not be detected. Certification of wild poliovirus-free status requires at least 3 years of timely and sensitive surveillance (7).
Health systems in the countries most affected by the Ebola outbreak in West Africa (Guinea, Liberia, and Sierra Leone) have been disrupted (8). Although no polio cases have been identified in affected countries, decreases in the national non-polio AFP rates have been noted. As health systems recovery plans are developed, an emphasis on ensuring high quality AFP surveillance, as well as immunization services, will be important.
The primary AFP surveillance quality indicators continued to be met in Afghanistan, Nigeria, and Pakistan in 2014.
However, orphan WPV1 and cVDPV2 viruses continue to be identified by genomic sequence analysis in these endemic countries and were also identified in Cameroon, indicating gaps in AFP surveillance. All AFP cases must be identified and reported, and specimens from patients with AFP must be collected and transported appropriately. Environmental surveillance will continue to be an important supplement to AFP surveillance.
The primary surveillance quality indicators do not fully cap-ture any security-related issues, nor the issues associated with mobile and difficult to access populations or other factors that affect surveillance performance. High AFP rates do not neces-sarily imply sensitive surveillance; anecdotally, visits to some countries have revealed that even in areas meeting surveillance performance indicators, a proportion of the reported AFP cases are unlikely to be true AFP cases. Conversely, evidence from hospital records suggests that some true AFP cases are not being reported. Supervision and monitoring of AFP surveillance may help ensure that all true AFP cases are identified, reported, and investigated appropriately.
As polio case counts decrease, sensitive AFP surveillance becomes increasingly critical. The risk of WPV and cVDPV importation, and cVDPV emergence exists even in countries in polio-free regions. To promptly identify and respond to all cases of polio, surveillance performance must be assessed and quality must be maintained globally.
TABLE 2. Number of poliovirus isolates from stool specimens of persons with acute flaccid paralysis and timing of results, by World Health Organization region, 2013* and 2014*
2013 2014
WHO RegionNo. of
specimens
No. of poliovirus isolatesPoliovirus isolation
results on time¶ (%)
ITD results
within 7 days**
(%)
ITD results
within 60 days††
(%)No. of
specimens
No. of poliovirus isolatesPoliovirus isolation
results on time¶ (%)
ITD results
within 7 days**
(%)
ITD results
within 60 days††
(%)Wild Sabin† cVDPV§ Wild Sabin† cVDPV§
African 42,316 598 2,861 12 (92) (88) (84) 45,856 83 4038 37 (92) (86) (92)Americas 1,672 0 33 0 (80) (95) (91) 1,675 0 39 0 (83) (100) (94)Eastern
Mediterranean20,783 125 626 53 (99) (98) (97) 23,552 329 809 27 (98) (95) (97)
European 3,404 0 37 0 (99) (93) (86) 3.224 0 26 2 (99) — (82)South-East Asia 116,179 0 3,274 0 (98) (91) (98) 115,539 0 2785 3 (97) (90) (98)Western Pacific 13,304 0 241 0 (65) (100) (99) 13,852 0 352 11 (78) (96) (81)Total§§ 197,658 723 7,072 65 (89) (94) (93) 203,698 412 8,049 80 (91) (93) (91)
Abbreviations: cVDPV = circulating vaccine-derived poliovirus, ITD = intratypic differentiation. * Data as of February 25, 2015. † Either concordant Sabin-like results in ITD test and VDPV screening, or <1% VP1 sequence difference compared with Sabin vaccine virus (<0.6% for type 2). § For poliovirus types 1 and 3, 10 or more VP1 nucleotide differences from the respective PV; for PV type 2, six or more VP1 nucleotide differences from Sabin type 2 PV. ¶ Results reported within 14 days for laboratories in the following WHO regions: African, Americas, Eastern Mediterranean, and South-East Asia, and Western Pacific.
Results reported within 28 days for the European Region. ** Results of ITD reported within 7 days of receipt of specimen. As EURO performance can be underestimated because of data entry issues, it has been excluded
from analysis. †† Results reported within 60 days of paralysis onset for all WHO regions except Eastern Mediterranean region, which reported within 45 days of paralysis onset. §§ For last two indicators, total represents the mean of regions’ performance (in %).
Morbidity and Mortality Weekly Report
420 MMWR / April 24, 2015 / Vol. 64 / No. 15
Acknowledgments
Geospatial Research, Analysis, and Services Program, CDC; Humayun Asghar; Evgeniy Gavrilin; Beth Henderson; Nicksy Gumede-Moeletsi; Ajay Goel; Varja Grabovac; Gloria Rey-Benito; Prasanna Yergolkar; World Health Organization Global Polio Laboratory Network laboratories.
What is already known on this topic?
Surveillance is a cornerstone of polio eradication efforts. Acute flaccid paralysis (AFP) surveillance is supplemented by environ-mental surveillance (i.e., the collection of sewage samples for poliovirus testing) in a growing number of countries to identify poliovirus circulation that might occur in the absence of detected AFP cases. The Global Polio Laboratory Network facilitates laboratory identification of polioviruses and provides genomic analysis to help track the spread of both wild and vaccine-derived polioviruses.
What is added by this report?
A smaller proportion of World Health Organization African Region countries that had a case of polio since 2010 met the two primary surveillance performance indicators, the non-polio AFP rate and the percentage of stool specimens considered adequate, in 2014 compared with 2013. Surveillance gaps existed at subnational levels. In Ebola-affected countries, polio surveillance quality appears to have decreased.
What are the implications for public health practice?
As polio case counts continue to decrease, sensitive and timely surveillance performance becomes even more critical. Gaps in surveillance quality, especially at the subnational level, must be identified and resolved through well supervised active surveil-lance, strong passive surveillance, and supplemental environ-mental and virologic surveillance. As long as polioviruses continue to circulate in any country, all countries remain at risk.
1Global Immunization Division, CDC; 2Polio Eradication Department, World Health Organization, Geneva, Switzerland; 3Division of Viral Diseases, CDC (Corresponding author: Kimberly Porter, [email protected], 404-435-0232)
References1. Global Polio Eradication Initiative. Infected countries. Geneva,
Switzerland: Global Polio Eradication Initiative. Available at http://www.polioeradication.org/Infectedcountries.aspx.
2. Walker AT, Sodha S, Warren WC, et al. Forewarning of poliovirus outbreaks in the Horn of Africa: an assessment of acute flaccid paralysis surveillance and routine immunization systems in Kenya. J Infect Dis 2014;210(Suppl 1):S85–90.
3. Moturi EK, Porter KA, Wassilak SGF, et al.. Progress toward polio eradication—Worldwide, 2013-2014. MMWR Morb Mortal Wkly Rep 2014;63:468–72.
4. Asghar H, Diop OM, Weldegebriel G, et al. Environmental surveillance for polioviruses in the Global Polio Eradication Initiative. J Infect Dis 2014;210(Suppl 1):S294–303.
5. Levitt A, Diop OM, Tangermann RH, et al. Surveillance systems to track progress toward global polio eradication — worldwide, 2012-2013. MMWR Morb Mortal Wkly Rep 2014;63:356–61.
6. Kilpatrick DR, Yang CF, Ching K, et al. Rapid group-, serotype-, and vaccine strain-specific identification of poliovirus isolates by real-time reverse transcription-PCR using degenerate primers and probes containing deoxyinosine residues. J Clin Microbiol 2009;47:1939–41.
7. World Health Organization. Report of the 1st meeting of the Global Commission for the Certification of the Eradication of Poliomyelitis. Geneva: World Health Organization;1995. Available at http://apps.who.int/iris/handle/10665/59821.
8. Kieny MP, Dovlo D. Beyond Ebola: a new agenda for resilient health systems. Lancet 2015;385:91–2.
Morbidity and Mortality Weekly Report
MMWR / April 24, 2015 / Vol. 64 / No. 15 421
Neural tube defects (NTDs) such as spina bifida, anenceph-aly, and encephalocele are serious birth defects of the brain and spine that occur during the first month of pregnancy when the neural tube fails to close completely. Randomized controlled trials and observational studies have shown that adequate daily consumption of folic acid before and during early pregnancy considerably reduces the risk for NTDs (1). The U.S. Public Health Service recommends that women capable of becoming pregnant consume 400 µg of folic acid daily for NTD prevention (2). Furthermore, fortification of staple foods (e.g., wheat flour) with folic acid has decreased folate-sensitive NTD prevalence in multiple settings (1) and is a highly cost-effective intervention (3).
Worldwide, approximately 300,000 newborns with NTDs are born per year (4). However, these estimates are based on modeled data because most countries lack complete, accurate, and timely surveillance systems for birth defects. Although this surveillance can be time consuming and resource inten-sive, it is a critical component for obtaining accurate data and raising awareness among policymakers about the need for prevention initiatives.
Population surveys that assess blood folate insufficiency (i.e., concentrations that increase the risk for having an NTD-affected pregnancy) provide complementary informa-tion for examining NTD risk in populations and can provide data relatively quickly. Cutoffs for defining folate deficiency initially were based on concentrations at which macrocytic anemia was likely to appear; they were more recently revised using homocysteine concentrations as the metabolic indicator.* However, no cutoffs to define blood folate insufficiency in women of reproductive age for NTD prevention were available. This prompted the World Health Organization (WHO) to develop guidelines on the optimal blood folate concentrations in women of reproductive age for NTD prevention.
Development Methods for the WHO GuidelinesWHO developed the evidence-based folate concentra-
tion guidelines using the WHO Handbook for Guideline
Development (5) and using the Grading of Recommendations Assessment, Development, and Evaluation (GRADE) method as appropriate. The process for development of the WHO folate concentration guideline is described in detail in the guideline (6). WHO collaborated with CDC to host a meet-ing in Atlanta, Georgia, in August 2012. International experts helped identify priority questions and approaches that could be used to establish optimal blood folate concentrations for NTD prevention. In September 2013, WHO convened a guideline development group in Geneva, Switzerland, to pres-ent the evidence that addressed those questions and to discuss and reach an agreement on the proposed recommendations.
In developing the guideline, evidence was evaluated regard-ing the 1) genetic, biologic, and sociodemographic determi-nants of blood folate concentrations in women of reproductive age; 2) threshold concentration of blood folate associated with lowest NTD risk; 3) response of blood folate concentrations to nutrition interventions; and 4) performance of laboratory assays for blood folate assessment. Systematic reviews, meta-analyses, and narrative reviews were considered along with available additional information.
Two studies examined the association between red blood cell (RBC) folate concentrations during pregnancy and NTD risk. The first study, a nested case-control study conducted in an Irish population, found higher RBC folate concentrations in early pregnancy to be associated with a lower NTD risk (7). The second study used Bayesian statistical techniques to consider NTD and RBC folate concentration data from two large population-based cohorts from China to model the association between RBC folate concentration and NTD prevalence (8). A comparison of the modeled Chinese data with the Irish data from the existing case-control study revealed remarkable agreement of the dose response between the two different populations. Predicted NTD risks from the model were consistent with observed data on NTD prevalence and RBC folate concentrations in the United States (8), supporting the validity of predicting NTD risk in populations with known population-level RBC folate concentrations.
Optimal Serum and Red Blood Cell Folate Concentrations in Women of Reproductive Age for Prevention of Neural Tube Defects: World Health
Organization GuidelinesAmy M. Cordero, MPA1, Krista S. Crider, PhD1, Lisa M. Rogers, PhD2, Michael J. Cannon, PhD1, R.J. Berry, MD1 (Author affiliations at end of text)
* Available at http://apps.who.int/iris/bitstream/10665/75584/1/WHO_NMH_NHD_EPG_12.1_eng.pdf.
Morbidity and Mortality Weekly Report
422 MMWR / April 24, 2015 / Vol. 64 / No. 15
WHO Recommendations1. At the population level, RBC folate concentrations
should be >400 ng/mL (906 nmol/L) in women of reproductive age to achieve the greatest reduction of NTDs (strong recommendation, low-quality evidence†).
2. The RBC folate threshold of >400 ng/mL (906 nmol/L) can be used as an indicator of folate insufficiency in women of reproductive age (strong recommendation, low-quality evidence). Because low folate concentrations cannot explain all cases of NTDs, this threshold cannot predict the individual risk for having a NTD-affected pregnancy and thus is only useful at the population level.
3. No serum folate threshold is recommended for prevention of NTDs in women of reproductive age at the population level (strong recommendation, low-quality evidence). Countries interested in using this indicator might consider first establishing the relationship between both serum and RBC folate concentrations and use the threshold value for RBC folate concentration to establish the corresponding threshold in serum.
4. Microbiological assay is recommended as the most reliable choice to obtain comparable results for RBC folate concentration across countries (strong recommendation, moderate-quality evidence§).
Adoption and Implementation of the GuidelinesCountries could undertake five major activities when imple-
menting the WHO guidelines: 1) assess the RBC folate status among women of reproductive age; 2) based on population status, determine the need for interventions, such as fortifica-tion of staple foods with folic acid or periconceptional folic acid supplementation, and how to best reach populations at risk for insufficient folate concentrations; 3) implement
interventions; 4) reassess population RBC folate status (at least 6–12 months after the intervention); and 5) make adjustments to the prevention program as necessary. Applying the guidelines is not necessarily a sequential process following the preceding order. For example, countries that are considering fortifying staple foods with folic acid (or countries with existing fortifica-tion policies) could proceed with those interventions and not wait to assess RBC folate concentrations because the public health benefit of this intervention is clearly established. In such circumstances, a country might choose to measure RBC folate status after fortification implementation to determine the proportion of the population meeting or exceeding the WHO-recommended RBC folate cutoff concentration and identify populations at increased risk for NTDs because of insufficient concentrations. Furthermore, although the guide-lines provide an important tool to assist with NTD prevention interventions, birth defects surveillance continues to be critical for monitoring the prevalence of birth defects because not all NTDs are folate sensitive.¶
Guideline Use at the Country Level: a U.S. Example
In the United States, women consume folic acid from three sources: enriched cereal grain products (i.e., fortified foods), ready-to-eat cereals, and supplements. In 1996 (with full implementation scheduled for 1998), the U.S. Food and Drug Administration required that manufacturers add 140 µg folic acid per 100 g of grain product labeled as enriched and allowed (but did not require) the addition of up to 400 µg folic acid per serving to ready-to-eat cereals. Multiple studies have shown that in the United States, NTD prevalence decreased and population blood folate concentrations increased after fortification. Recent estimates show that NTD prevalence (anencephaly and spina bifida) decreased from 10.7 per 10,000 live births in 1995–1996 (before fortification) to 7.0 per 10,000 in 2009–2011 (after fortification) and that each year approximately 1,326 (95% confidence interval: 1,122–1,531) fewer infants were born with anencephaly or spina bifida (9).
A study of the RBC folate concentrations in the U.S. popula-tion demonstrates how the WHO guidelines could be used at the country level. Data from the 2007–2012 National Health and Nutrition Examination Survey were assessed to determine the prevalence of insufficient RBC folate concentrations among U.S. women of childbearing age, in which insufficient
† The WHO guideline development group defines a strong recommendation as one for which the benefits of adherence outweigh the risk, and policymakers can adapt the recommendation as policy in most settings. Using the GRADE method, the quality of the evidence was determined to be low because of the number and type of studies available. Additional details on recommendation strength and quality of evidence are available in the guidelines. (Source: World Health Organization. Guideline. Optimal serum and red blood cell folate concentrations in women of reproductive age for prevention of neural tube defects. Geneva, Switzerland: World Health Organization; 2015. Available at http://www.who.int/nutrition/publications/guidelines/optimalserum_rbc_womenrep_tubedefects/en.)
§ Using the GRADE method, moderate-quality evidence indicates moderate confidence in the effect estimate and that although the true effect is likely to be close to the estimate of the effect, the possibility exists that it is substantially different. Additional details on recommendation strength and quality of evidence are available in the guidelines. (Source: World Health Organization. Guideline. Optimal serum and red blood cell folate concentrations in women of reproductive age for prevention of neural tube defects. Geneva, Switzerland: World Health Organization; 2015. Available at http://www.who.int/nutrition/publications/guidelines/optimalserum_rbc_womenrep_tubedefects/en.)
¶ For countries interested in establishing or strengthening a birth defects surveillance program, CDC, WHO, and the International Clearinghouse for Birth Defects Surveillance and Research have developed a surveillance tool kit primarily for use in low- and middle-resource settings (available at http://www.who.int/nutrition/publications/birthdefects_manual/en and http://www.who.int/nutrition/publications/birthdefects_atlas/en).
Morbidity and Mortality Weekly Report
MMWR / April 24, 2015 / Vol. 64 / No. 15 423
(i.e., suboptimal) is defined as concentrations below the WHO established cutoff (i.e., 400 ng/mL or 906 nmol/L) for preven-tion of NTDs (10). The study found that 22.8% of women have RBC folate concentrations below this cutoff. The preva-lence differed by socioeconomic variables, folic acid source, race/ethnicity, and other factors. Therefore, when assessing blood folate status, monitoring the full distribution, and not just considering the mean, is important because NTD risk increases dramatically at lower blood folate concentrations. This approach can identify populations at increased risk for insufficient concentrations and allow for determination of appropriate nutritional interventions based on blood folate status and nutritional patterns of the target population to reach those most in need. 1National Center on Birth Defects and Developmental Disabilities, CDC;
2Department of Nutrition for Health and Development, World Health Organization (Corresponding author: Amy M. Cordero, [email protected], 404-498-3896)
References 1. Blencowe H, Cousens S, Modell B, Lawn J. Folic acid to reduce neonatal
mortality from neural tube disorders. Int J Epidemiol 2010;39(Suppl 1): i110–21.
2. US Preventive Services Task Force. Folic acid for the prevention of neural tube defects: U.S. Preventive Services Task Force recommendation statement. Ann Intern Med 2009;150:626–31.
3. Yi Y, Lindemann M, Colligs A, Snowball C. Economic burden of neural tube defects and impact of prevention with folic acid: a literature review. Eur J Pediatr 2011;170:1391–400.
4. Christianson A, Modell B, Howson C. March of Dimes global report on birth defects: the hidden toll of dying and disabled children. White Plains, NY; 2006. Available at http://www.marchofdimes.org/materials/global-report-on-birth-defects-the-hidden-toll-of-dying-and-disabled-children-executive-summary.pdf.
5. World Health Organization. WHO handbook for guideline development, 2nd ed. Geneva, Switzerland: World Health Organization; 2014.
6. World Health Organization. Guideline. Optimal serum and red blood cell folate concentrations in women of reproductive age for prevention of neural tube defects. Geneva, Switzerland: World Health Organization; 2015. Available at http://www.who.int/nutrition/publications/guidelines/optimalserum_rbc_womenrep_tubedefects/en.
7. Daly LE, Kirke PN, Molloy A, Weir DG, Scott JM. Folate levels and neural tube defects. Implications for prevention. JAMA 1995;274:1698–702.
8. Crider KS, Devine O, Hao L, et al. Population red blood cell folate concentrations for prevention of neural tube defects: Bayesian model. BMJ 2014;349:g4554.
9. Williams J, Mai CT, Mulinare J, et al. Updated estimates of neural tube defects prevented by mandatory folic acid fortification—United States, 1995–2011. MMWR Morb Mortal Wkly Rep 2015;64:1–5.
10. Tinker SC, Hamner HC, Qi YP, Crider KS. U.S. women of childbearing age who are at possible increased risk of a neural tube defect-affected pregnancy due to suboptimal red blood cell folate concentrations, National Health and Nutrition Examination Survey 2007–2012. Birth Defects Res A Clin Mol Teratol. April 17, 2015; Epub ahead of print.
Morbidity and Mortality Weekly Report
424 MMWR / April 24, 2015 / Vol. 64 / No. 15
National Campaign to Prevent Falls in Construction — United States, 2015
In 2013 and 2014, construction employment began to recover from the 2007–2009 economic downturn. In 2014, construction employment grew to 9.8 million workers from 8.9 million workers in 2012 (1). In 2013, there were 796 fatal work-related injuries in the private construction sector, accounting for the highest number of fatal work injuries of any industry sector (2,3). Falls on construction sites are the leading cause of death in the industry (36% of deaths in 2012) (4). Many construction occupations require working at height and climbing ladders or scaffolds on a daily basis; the falls occur mostly from roofs, scaffolds, and ladders (5). However, deaths and injuries from falls in construction are a preventable public health problem.
CDC’s National Institute for Occupational Safety and Health (NIOSH) continues its work with construction sector stakeholders through a government-labor-management partnership, representing state and federal government agencies, professional organizations, trade associations, labor organizations and private industry who worked together to develop a national campaign aimed at construction contractors, onsite supervisors and workers.
During May 4–15, the federal Occupational Safety and Health Administration (OSHA) and stakeholders including
NIOSH, will host a National Safety Stand-Down to Prevent Falls in Construction (additional information available at http://www.osha.gov/StopFallsStandDown). The stand-down will be a voluntary opportunity for construction-related employers to speak directly to employees about fall hazards and to reinforce the importance of fall prevention requirements. It is part of a national information and media construction falls prevention campaign. In 2014, almost 5,000 local stand-downs were reported to OSHA, with participation in all 50 states. Broad engagement and promotion across the United States is encouraged, including by state agencies and public health practitioners.
References1. US Bureau of Labor Statistics, 2003–2014. Current population survey.
Calculations by the CPWR Data Center. Available at http://www.cpwr.com/publications/cpwr-data-briefs.
2. Economic news release. National Census of Fatal Occupational Injuries in 2013 (preliminary results). Census of Fatal Occupational Injuries Summary, 2013. Available at http://www.bls.gov/news.release/cfoi.nr0.htm. Accessed March 24, 2015.
3. US Bureau of Labor Statistics. Revisions to the 2010 Census of Fatal Occupational Injuries Counts. Available at http://www.bls.gov/iif/oshwc/cfoi/cfoi_revised10.pdf.
4. US Bureau of Labor Statistics, US Department of Labor. BLS revised 2012 workplace fatality data. Available at https://www.osha.gov/oshstats/commonstats.html.
5. US Bureau of Labor Statistics, US Department of Labor. 2010 Current Population Survey. Calculations by CPWR Data Center.
Announcement
Morbidity and Mortality Weekly Report
MMWR / April 24, 2015 / Vol. 64 / No. 15 425
Air Quality Awareness Week — April 27–May 1, 2015CDC is collaborating with the U.S. Environmental
Protection Agency (EPA) to urge persons to learn how air quality affects health during Air Quality Awareness Week, April 27–May 1, 2015.
Although outdoor air quality has improved since the 1990s, many challenges remain. Ground-level ozone, the primary component of smog, and particle pollution are just two of the many factors that decrease air quality and might affect health. Particle pollution can cause eye, lung, and throat irritation and can cause a heart attack among persons with heart disease (1). Ozone exposure can worsen symptoms of asthma, bronchitis, or emphysema and can cause coughing and pain when taking a deep breath, lung and throat irritation, and wheezing and trouble breathing during exercise or outdoor activities (2).
EPA’s Air Quality Index (AQI) (3) predicts the level of pollu-tion in the air each day and provides advice on healthy physical activity. The AQI is available on the internet, on many local TV weather forecasts, or as free e-mail tools and apps (4). The AQI includes information about the five major air pollutants in the United States that are regulated by EPA, including ozone and particle pollution.
Join experts from CDC, EPA, the National Oceanic and Atmospheric Administration, and the National Park Service on Thursday, April 30, at 1:00 pm Eastern for a TwitterChat about air quality, physical activity, and health. Use the hashtag #AirQualityChat in chat messages to join the conversation.
Additional air quality and health information is available at http://www.cdc.gov/air/default.htm and http://www.epa.gov/airnow/airaware.
References1. CDC. Particle pollution. Atlanta, GA: US Department of Health and
Human Services, CDC; 2014. Available at http://www.cdc.gov/air/particulate_matter.html.
2. CDC. Ozone and your health. Atlanta, GA: US Department of Health and Human Services, CDC; 2014. Available at http://www.cdc.gov/air/ozone.html.
3. Environmental Protection Agency. AirNow. Air quality index. Washington, DC: Environmental Protection Agency. Available at http://www.airnow.gov.
4. Environmental Protection Agency. AirNow. Air quality notifications. Washington, DC: Environmental Protection Agency. Available at http://www.enviroflash.info.
Announcements
World Malaria Day — April 25, 2015World Malaria Day is commemorated on April 25, the date
in 2000 when 44 African leaders met in Abuja, Nigeria, and committed their countries to reducing malaria-related deaths. During 2000–2013, the scale-up of effective malaria preven-tion and control interventions saved an estimated 4.2 million lives, with 92% of those being children aged <5 years, and decreased malaria mortality by 30% globally and 34% in sub-Saharan Africa (1). In spite of these accomplishments, an estimated 198 million cases of malaria occurred globally in 2013, resulting in an estimated 584,000 deaths (1).
In recent years, there have been increases in resistance to mosquito insecticides and treatment drugs and changes in malaria epidemiology as a result of scaled-up interventions. Thus, new approaches are needed to sustain progress in malaria control and to move beyond control to malaria elimination. The theme of World Malaria Day 2015 is Invest in the Future: Defeat Malaria.
CDC supports global malaria control efforts through the President’s Malaria Initiative, a U.S. government interagency initiative to reduce malaria incidence and mortality in 19 countries in sub-Saharan Africa and in the Greater Mekong Subregion in Asia. This effort has helped deliver millions of insecticide-treated mosquito nets, antimalarial drugs, and rapid diagnostic test kits to ensure that persons at risk for malaria will have access to lifesaving prevention and treatment. CDC also conducts multidisciplinary strategic and applied research globally to increase knowledge about malaria and develop safe, effective interventions that can lead to the elimination and eventual eradication of malaria worldwide.
Through a grant to the CDC Foundation from the Bill and Melinda Gates Foundation, CDC is also leading a consortium of malaria partners, known as the Haiti Malaria Elimination Consortium, aiming to eliminate indigenous cases of malaria on the island of Hispaniola by 2020. Additional information regarding CD’s malaria activities is available at http://www.cdc.gov/malaria.
Reference1. World Health Organization. World malaria report 2014. Geneva,
Switzerland: World Health Organization; 2014. Available at http://www.who.int/malaria/publications/world_malaria_report_2014/en/.
Morbidity and Mortality Weekly Report
426 MMWR / April 24, 2015 / Vol. 64 / No. 15
Errata
Vol. 64, No. 14In the report, “Tobacco Use Among Middle and High School
Students — United States, 2011–2014,” errors occurred in the third and fourth footnotes to Figure 1 on page 383. Those footnotes should read as follows:
§ Nonlinear increase (p<0.05).¶ Linear decrease (p<0.05).

Morbidity and Mortality Weekly Report
MMWR / April 24, 2015 / Vol. 64 / No. 15 427
* During the household interview, respondents were asked, “In the past 30 days, have you used or taken medication for which a prescription is needed?” Those who answered affirmatively were asked to give their prescription medication containers to the interviewer, who then recorded the exact product name from the container’s label. Opioid analgesics are commonly prescribed for treating pain caused by surgery, injury, or health conditions such as cancer. Common opioid analgesics include hydrocodone, oxycodone, and methadone.
† Poverty level was based on the family income to poverty ratio, which is the ratio of family income to the poverty threshold after accounting for inflation and family size. A ratio of 1.00 was considered representative of a poverty level at 100% of the federal poverty guideline.
§ 95% confidence interval.
During 2007–2012, use of opioid analgesics in the United States decreased with increasing income; 8.9% of adults aged ≥20 years who had family incomes <200% of the federal poverty threshold used an opioid analgesic in the preceding 30 days, compared with 7.1% of those with incomes 200%–399% of the poverty threshold and 4.9% of those with incomes ≥400% of the poverty threshold. The relationship between income and opioid use was observed for both men and women. Within each of the family income categories, there were no significant differences in opioid analgesic use between men and women.
Source: Frenk SM, Porter KS, Paulozzi LJ. Prescription opioid analgesic use among adults: United States, 1999–2012. NCHS data brief no. 189; 2015. Available at http://www.cdc.gov/nchs/data/databriefs/db189.htm.
Reported by: Steven M. Frenk, PhD, [email protected], 301-458-4096; Kathryn S. Porter, MD, Leonard J. Paulozzi, M.D.
0
2
4
6
8
10
12<200% of federal poverty threshold≥200% to <400% of federal poverty threshold≥400% of federal poverty threshold
Perc
enta
ge
Men WomenOverall
§
QuickStats
FROM THE NATIONAL CENTER FOR HEALTH STATISTICS
Use of Prescription Opioid Analgesics* in the Preceding 30 Days Among Adults Aged ≥20 Years, by Poverty Level† and Sex — National Health and
Nutrition Examination Survey, United States, 2007–2012
ISSN: 0149-2195
The Morbidity and Mortality Weekly Report (MMWR) Series is prepared by the Centers for Disease Control and Prevention (CDC) and is available free of charge in electronic format. To receive an electronic copy each week, visit MMWR’s free subscription page at http://www.cdc.gov/mmwr/mmwrsubscribe.html. Paper copy subscriptions are available through the Superintendent of Documents, U.S. Government Printing Office, Washington, DC 20402; telephone 202-512-1800.
Readers who have difficulty accessing this PDF file may access the HTML file at http://www.cdc.gov/mmwr/index2015.html. Address all inquiries about the MMWR Series, including material to be considered for publication, to Executive Editor, MMWR Series, Mailstop E-90, CDC, 1600 Clifton Rd., N.E., Atlanta, GA 30329-4027 or to [email protected].
All material in the MMWR Series is in the public domain and may be used and reprinted without permission; citation as to source, however, is appreciated.
Use of trade names and commercial sources is for identification only and does not imply endorsement by the U.S. Department of Health and Human Services.
References to non-CDC sites on the Internet are provided as a service to MMWR readers and do not constitute or imply endorsement of these organizations or their programs by CDC or the U.S. Department of Health and Human Services. CDC is not responsible for the content of these sites. URL addresses listed in MMWR were current as of the date of publication.
Morbidity and Mortality Weekly Report