workflow and activity modeling for monitoring surgical ... · workflow and activity modeling for...
TRANSCRIPT

HAL Id: tel-01748567https://tel.archives-ouvertes.fr/tel-01748567v2
Submitted on 27 May 2010
HAL is a multi-disciplinary open accessarchive for the deposit and dissemination of sci-entific research documents, whether they are pub-lished or not. The documents may come fromteaching and research institutions in France orabroad, or from public or private research centers.
L’archive ouverte pluridisciplinaire HAL, estdestinée au dépôt et à la diffusion de documentsscientifiques de niveau recherche, publiés ou non,émanant des établissements d’enseignement et derecherche français ou étrangers, des laboratoirespublics ou privés.
Workflow and Activity Modeling for MonitoringSurgical Procedures
Nicolas Padoy
To cite this version:Nicolas Padoy. Workflow and Activity Modeling for Monitoring Surgical Procedures. Human-Computer Interaction [cs.HC]. Université Henri Poincaré - Nancy 1; Technische Universität München,2010. English. <NNT : 2010NAN10025>. <tel-01748567v2>

Workflow and Activity Modeling for
Monitoring Surgical Procedures
Nicolas Padoy
Dissertation

Technische Universität München, Fakultät für InformatikChair for Computer-Aided Medical Procedures & Augmented Reality
&Université Henri Poincaré, Nancy 1, UFR STMIA
Ecole doctorale IAEM Lorraine, Département de formation doctorale en informatiqueLaboratoire Lorrain de Recherche en Informatique et ses Applications
Workflow and Activity Modeling for MonitoringSurgical Procedures
THÈSE
déposée le 24 août 2009 à l’Université Henri Poincaré etprésentée et soutenue publiquement à Munich le 14 Avril 2010
par
Nicolas Padoypour l’obtention conjointe par cotutelle du grade de docteur de la Technische UniversitätMünchen et de l’Université Henri Poincaré, dans la spécialité informatique.
Président : Darius Burschka Professeur, Technische Universität München
Rapporteurs : Gregory Hager Professeur, Johns Hopkins UniversityJocelyne Troccaz Directeur de recherche, CNRS, Grenoble
Examinateurs : Nassir Navab Professeur, Technische Universität MünchenMarie-Odile Berger Chargé de recherche, INRIA, NancyHeinz U. Lemke Professeur, Technische Universität BerlinAdam Cichon Professeur, Université Henri Poincaré


Technische Universität München, Fakultät für InformatikChair for Computer-Aided Medical Procedures & Augmented Reality
&Université Henri Poincaré, Nancy 1, UFR STMIA
Ecole doctorale IAEM Lorraine, Département de formation doctorale en informatiqueLaboratoire Lorrain de Recherche en Informatique et ses Applications
Workflow and Activity Modeling for MonitoringSurgical Procedures
Nicolas Padoy
Vollständiger Abdruck der von der Fakultät für Informatik der Technischen UniversitätMünchen und von der Ecole doctorale IAEM Lorraine, Département de formationdoctorale en informatique de l’Université Henri Poincaré zur Erlangung desakademischen Grades eines
Doktors der Naturwissenschaften (Dr. rer. nat.)
genehmigten Dissertation.
Vorsitzender : Prof. Dr. Darius Burschka Technische Universität München
Prüfer : Prof. Gregory Hager, PhD Johns Hopkins UniversityDr. Jocelyne Troccaz CNRS, Grenoble
Examinator : Prof. Dr. Nassir Navab Technische Universität MünchenDr. Marie-Odile Berger INRIA, NancyProf. Dr. Heinz U. Lemke Technische Universität BerlinProf. Dr. Adam Cichon Université Henri Poincaré
Die Dissertation wurde am 24. August 2009 bei der Université Henri Poincaré eingereichtund am 14. April 2010 in München öffentlich verteidigt.


Abstract
The department of surgery is the core unit of the patient care system within a hospital.Due to continuous technical and medical developments, such departments are equippedwith increasingly high-tech surgery rooms. This provides higher benefits for patient treat-ment, but also increases the complexity of the procedures’ workflow. This also inducesthe presence of multiple electronic systems providing rich and various information aboutthe surgical processes.
The focus of this work is the development of statistical methods that permit the mod-eling and monitoring of surgical processes, based on signals available in the surgery room.These methods combine low-level signals with high-level information, and can be used todetect events and trigger pre-defined actions. A main application is the development ofcontext-aware surgery rooms, providing adaptive user interfaces, better synchronizationwithin the surgery department and automatic documentation.
We introduce and formalize the problem of recognizing phases within a workflow,using a representation of interventions in terms of multidimensional time-series formed bysynchronized signals acquired over time. We then propose methods for the modeling, off-line segmentation and on-line recognition of surgical phases. The main method, a variantof hidden Markov models augmented by phase probability variables, is demonstrated ontwo medical applications. The first one is the monitoring of endoscopic interventions, usingcholecystectomy as illustrative surgery. Phases are recognized using signals indicating toolusage and recorded from real procedures. The second application is the monitoring of ageneric surgery room workflow. In this case, phase recognition is performed by using4D information from surgeries performed in a mock-up operating room in presence of amulti-view reconstruction system.
Keywords:
Surgical Workflow, Surgical Activity Analysis, Context Aware Operating Rooms, HiddenMarkov Models, Cholecystectomy, Recognition from Multi-view Reconstruction


Résumé
Le bloc opératoire est au coeur des soins délivrés dans l’hôpital. Suite à de nombreuxdéveloppements techniques et médicaux, il devient équipé de salles opératoires haute-ment technologiques. Bien que ces changements soient bénéfiques pour le traitement despatients, ils accroissent la complexité du déroulement des opérations. Ils impliquent éga-lement la présence de nombreux systèmes électroniques fournissant de l’information richeet variée sur les processus chirurgicaux.
Ce travail s’intéresse au développement de méthodes statistiques permettant de modé-liser le déroulement des processus chirurgicaux et d’en reconnaitre les étapes, en utilisantdes signaux présents dans le bloc opératoire. Ces méthodes combinent des signaux debas niveau avec de l’information de haut niveau et permettent à la fois de détecter desévénements et de déclencher des actions pré-définies. L’une des applications principalesest la conception de salles opératoires sensibles au contexte, fournissant des interfaces uti-lisateurs réactives, permettant une meilleure synchronisation au sein du bloc opératoireet produisant une documentation automatisée.
Nous introduisons et formalisons le problème consistant à reconnaitre les phases réali-sées au sein d’un processus chirurgical, en utilisant une représentation des chirurgies parune suite temporelle et multi-dimensionnelle de signaux synchronisés. Nous proposons en-suite des méthodes pour la modélisation, la segmentation hors-ligne et la reconnaissanceen-ligne des phases chirurgicales. La méthode principale, une variante de modèle de Mar-kov caché étendue par des variables de probabilités de phases, est démontrée sur deuxapplications médicales. La première concerne les interventions endoscopiques, la cholé-cystectomie étant prise en exemple. Les phases endoscopiques sont reconnues en utilisantdes signaux indiquant l’utilisation des instruments et enregistrés lors de chirurgies réelles.La deuxième application concerne la reconnaissance des activités génériques d’une salleopératoire. Dans ce cas, la reconnaissance utilise de l’information 4D provenant de chi-rurgies réalisées dans une maquette de salle opératoire et observée par un système dereconstruction multi-vues.
Mots Clés:
Déroulement des Processus Chirurgicaux, Analyse des Activités Chirurgicales, Sallesd’Opération Réactives au Contexte, Modèles de Markov Cachés, Cholécystectomie,Reconnaissance à partir de Reconstruction Multi-vues


À Raymond, Marie-Antoinetteet Marie-Thérèse.


Acknowledgments
First of all, I would like to thank Gregory Hager and Jocelyne Troccaz for taking thetime to review my manuscript. I would also like to thank Darius Burschka, Adam Cichonand Heinz Lemke for accepting to be members of my thesis committee.I am very much indebted to my adviser Nassir Navab, who established an extremely funand motivating research environment. I have very much appreciated his support, hisnumerous advices and the opportunities he gave me to discover the diverse aspects of thelife of a researcher. I am also grateful to my second adviser, Marie-Odile Berger, for hercontinuous supervision and care during this joint PhD thesis. Additionally, I owe manythanks to Erwan Kerrien for his precious advices throughout the thesis and his carefulproof-reading.
This work would not have been possible without the collaborative interest of ourmedical partners. I would like to acknowledge the support of Hubertus Feussner, fromKlinikum rechts der Isar, and the support of Sandro Heining, from Klinikum Innenstadt.Many thanks also to Armin Schneider, to nurse Franceska and to the anonymous medicalstaff who helped us in various ways during the data acquisitions.
I have had many exciting discussions related to the topics of this thesis with two ofmy former master students and colleagues: Tobias Blum and Ahmad Ahmadi. Manythanks to them for the nice ’workflow moments’ shared together, for the support in theOR and for the proof-reading. I additionally thank Diana Mateus and Daniel Weinlandfor the long and fruitful discussions concerning my research with the 4D reconstructiondata. I also would like to acknowledge Alexander Ladikos, who introduced me to themulti-camera reconstruction system. For further interesting discussions on my researchdirections, I am thankful to Pierre Jannin. During my thesis, I have had the chance tosupervise several students: Tobias, Ahmad, Michael, Nitesh, Uli, Daniel, Kaveh, Yury,Tolga and Kateryna. I enjoyed working with them. Many thanks also to Isabelle and toMartina, for having taken such good care of the administrative issues both in Magrit andin CAMP, and to Martin Horn, for being much more than a system administrator.
Without my friends and colleagues from Munich, Nancy and elsewhere, my PhD timewould surely not have been so rich and exciting! I owe a lot of gratitude to them fororganizing and joining many interesting and fun activities which distracted me from thecaptivating dissertation work. I will keep unforgettable memories of the shared evenings,of the relaxing Biergärten, of the improtheater sessions, of the soccer and volley-ball gamesim Englischen Garten, of the hiking and skiing trips in the Bavarian/Austrian Alps andof the joint vacations. This balancing of the work as well as the close friendships havebeen invaluable.
I especially want to thank Pierre Georgel for great fun, many coffee break discussions,his music discoveries and so much more. The couch, books and music of Michael Aronhave been of great help during my stays in Nancy. Merci Michael. I am indebted to Troels

and Natacha Frimor: they have constantly supported me in diverse ways, especially withdelicious cakes! I also warmly thank Olivier Pauly for great moments spent outside theuniversity and the interesting research that we were able to accomplish together in thelast year. For motivating discussions and many nice events he has organized, sometimesin unexpected places, I am thankful to Jörg Traub.Also, for very nice moments, I would like to thank: Adrien, Ajitha, Andreas H., An-dreas K., Anne-Caro, Anne-Claire, Axel, Ben, Céline, Chris, Darko, Elena, Gilles, Hauke,Helmuth, Irène, Jérémie, Jose, Latifa, Macarena, M’baki, Mahssa, Marco, Martin G.,Mathieu, Nicolas N., Nicolas P., Patience, Sarah, Selen, Selim, Stefanie D., Stefanie L.,Sonia I., Sébastien H., Sébastien G., Stanka, Tarik, Thomas, Tobias S., Virginie, Wolf-gang, Yannick and all the members of Magrit and CAMP.
Finally, I thank all the members of my family for their care, patience and encourage-ments during my thesis.

Comment vivre sans inconnu devant soi ?
René Char


Contents
Abstract vii
Acknowledgements xiii
Contents xvii
List of Figures xxiii
List of Tables xxvii
I Introduction, Motivation and Related Work 1
1 Introduction 3
1.1 The Operating Room of the Future . . . . . . . . . . . . . . . . . . . . . . 41.1.1 Image-guided Surgery . . . . . . . . . . . . . . . . . . . . . . . . . . 41.1.2 Surgical Robotics . . . . . . . . . . . . . . . . . . . . . . . . . . . . 51.1.3 Digital Operating Room . . . . . . . . . . . . . . . . . . . . . . . . 71.1.4 Workflow Optimization . . . . . . . . . . . . . . . . . . . . . . . . . 7
1.2 Signal-based Surgical Workflow Analysis . . . . . . . . . . . . . . . . . . . 81.2.1 Sensor-enriched Operating Rooms . . . . . . . . . . . . . . . . . . . 81.2.2 Surgical Workflows . . . . . . . . . . . . . . . . . . . . . . . . . . . 91.2.3 Potential Applications . . . . . . . . . . . . . . . . . . . . . . . . . 9
1.2.3.1 Situational Awareness . . . . . . . . . . . . . . . . . . . . 91.2.3.2 Surgical Data Mining . . . . . . . . . . . . . . . . . . . . 101.2.3.3 Databases Analysis and Training . . . . . . . . . . . . . . 10
1.2.4 Definitions Related to the Problem . . . . . . . . . . . . . . . . . . 111.3 Contributions . . . . . . . . . . . . . . . . . . . . . . . . . . . . . . . . . . 111.4 Outline . . . . . . . . . . . . . . . . . . . . . . . . . . . . . . . . . . . . . . 12
xvii
Contents
2 Related Work in Surgical Workflow Analysis 15
2.1 Human Activity Recognition . . . . . . . . . . . . . . . . . . . . . . . . . . 162.1.1 Vision based . . . . . . . . . . . . . . . . . . . . . . . . . . . . . . . 162.1.2 Wearable-sensor based . . . . . . . . . . . . . . . . . . . . . . . . . 17
2.2 Surgical Activity Recognition . . . . . . . . . . . . . . . . . . . . . . . . . 182.2.1 Recognition in the Operating Room . . . . . . . . . . . . . . . . . . 182.2.2 Recognition in Endoscopy . . . . . . . . . . . . . . . . . . . . . . . 202.2.3 Surgical Skills Evaluation . . . . . . . . . . . . . . . . . . . . . . . 22
2.3 Formal Modeling of Surgical Workflows . . . . . . . . . . . . . . . . . . . . 232.4 Thesis Positioning . . . . . . . . . . . . . . . . . . . . . . . . . . . . . . . . 24
3 Applications and Setups 27
3.1 Laparoscopic Cholecystectomy . . . . . . . . . . . . . . . . . . . . . . . . . 273.1.1 Description . . . . . . . . . . . . . . . . . . . . . . . . . . . . . . . 27
3.1.1.1 Clinical Indication . . . . . . . . . . . . . . . . . . . . . . 273.1.1.2 Brief History . . . . . . . . . . . . . . . . . . . . . . . . . 283.1.1.3 Procedure . . . . . . . . . . . . . . . . . . . . . . . . . . . 283.1.1.4 Personnel . . . . . . . . . . . . . . . . . . . . . . . . . . . 293.1.1.5 Relevance of the Procedure for Workflow Analysis . . . . . 30
3.1.2 Representation . . . . . . . . . . . . . . . . . . . . . . . . . . . . . 303.1.2.1 Tool Usage . . . . . . . . . . . . . . . . . . . . . . . . . . 303.1.2.2 Other Signals of Interest . . . . . . . . . . . . . . . . . . . 303.1.2.3 Phases . . . . . . . . . . . . . . . . . . . . . . . . . . . . . 31
3.1.3 Data Acquisition . . . . . . . . . . . . . . . . . . . . . . . . . . . . 313.1.3.1 Approach . . . . . . . . . . . . . . . . . . . . . . . . . . . 313.1.3.2 Trocar Camera . . . . . . . . . . . . . . . . . . . . . . . . 34
3.2 Surgery Monitoring with a Multi-camera System . . . . . . . . . . . . . . . 353.2.1 Description . . . . . . . . . . . . . . . . . . . . . . . . . . . . . . . 35
3.2.1.1 Motivation for a Multi-camera System . . . . . . . . . . . 353.2.1.2 System Setup . . . . . . . . . . . . . . . . . . . . . . . . . 36
3.2.2 Data Representation and Acquisition . . . . . . . . . . . . . . . . . 383.2.2.1 Visual Hulls . . . . . . . . . . . . . . . . . . . . . . . . . . 383.2.2.2 Scenario and Acquisitions . . . . . . . . . . . . . . . . . . 38
3.3 Conclusion . . . . . . . . . . . . . . . . . . . . . . . . . . . . . . . . . . . . 38
II Methods for Monitoring in the Surgery Room 41
4 Synchronization and Segmentation of Endoscopic Surgeries 43
4.1 Objectives . . . . . . . . . . . . . . . . . . . . . . . . . . . . . . . . . . . . 434.1.1 Synchronization . . . . . . . . . . . . . . . . . . . . . . . . . . . . . 434.1.2 Segmentation . . . . . . . . . . . . . . . . . . . . . . . . . . . . . . 44
4.2 Dynamic Time Warping Averaging . . . . . . . . . . . . . . . . . . . . . . 454.2.1 Dynamic Time Warping . . . . . . . . . . . . . . . . . . . . . . . . 454.2.2 Related Work on Dynamic Time Warping . . . . . . . . . . . . . . 46
xviii

Contents
4.2.3 Averaging . . . . . . . . . . . . . . . . . . . . . . . . . . . . . . . . 464.3 Segmentation . . . . . . . . . . . . . . . . . . . . . . . . . . . . . . . . . . 48
4.3.1 Different Approaches for Model Construction . . . . . . . . . . . . . 494.3.1.1 Manual Annotation . . . . . . . . . . . . . . . . . . . . . . 494.3.1.2 Pre-annotation . . . . . . . . . . . . . . . . . . . . . . . . 494.3.1.3 Post-annotation . . . . . . . . . . . . . . . . . . . . . . . . 49
4.3.2 Off-line Segmentation . . . . . . . . . . . . . . . . . . . . . . . . . . 504.3.3 Evaluation . . . . . . . . . . . . . . . . . . . . . . . . . . . . . . . . 50
4.3.3.1 Measures . . . . . . . . . . . . . . . . . . . . . . . . . . . 504.3.3.2 Results . . . . . . . . . . . . . . . . . . . . . . . . . . . . 51
4.3.4 Adaptive DTW . . . . . . . . . . . . . . . . . . . . . . . . . . . . . 514.3.4.1 Discriminative Weighting . . . . . . . . . . . . . . . . . . 544.3.4.2 Segmentation with ADTW . . . . . . . . . . . . . . . . . 554.3.4.3 Evaluation . . . . . . . . . . . . . . . . . . . . . . . . . . 56
4.4 Applications . . . . . . . . . . . . . . . . . . . . . . . . . . . . . . . . . . . 564.4.1 Synchronous Visual Replay . . . . . . . . . . . . . . . . . . . . . . 564.4.2 Training . . . . . . . . . . . . . . . . . . . . . . . . . . . . . . . . . 564.4.3 Reporting . . . . . . . . . . . . . . . . . . . . . . . . . . . . . . . . 57
4.5 Conclusion . . . . . . . . . . . . . . . . . . . . . . . . . . . . . . . . . . . . 57
5 Hidden Markov Models 59
5.1 Hidden Markov Models . . . . . . . . . . . . . . . . . . . . . . . . . . . . . 595.1.1 Markov Chains . . . . . . . . . . . . . . . . . . . . . . . . . . . . . 595.1.2 Hidden Markov Models . . . . . . . . . . . . . . . . . . . . . . . . . 60
5.1.2.1 Forward-Backward Algorithm . . . . . . . . . . . . . . . . 615.1.2.2 Viterbi Path . . . . . . . . . . . . . . . . . . . . . . . . . 625.1.2.3 Baum-Welch Algorithm . . . . . . . . . . . . . . . . . . . 625.1.2.4 Continuous Observation Distributions . . . . . . . . . . . 635.1.2.5 Parameter Learning . . . . . . . . . . . . . . . . . . . . . 63
5.2 Dynamic Bayesian Networks . . . . . . . . . . . . . . . . . . . . . . . . . . 645.3 Conclusion . . . . . . . . . . . . . . . . . . . . . . . . . . . . . . . . . . . . 65
6 Monitoring Endoscopic Surgeries 67
6.1 Objectives . . . . . . . . . . . . . . . . . . . . . . . . . . . . . . . . . . . . 676.2 Annotated Workflow-HMMs . . . . . . . . . . . . . . . . . . . . . . . . . . 68
6.2.1 HMM Initialization Methods . . . . . . . . . . . . . . . . . . . . . . 696.2.1.1 Fully-connected HMMs . . . . . . . . . . . . . . . . . . . . 696.2.1.2 Sequential HMMs . . . . . . . . . . . . . . . . . . . . . . . 696.2.1.3 Model Merging . . . . . . . . . . . . . . . . . . . . . . . . 70
6.2.2 AWHMMs Construction Approaches . . . . . . . . . . . . . . . . . 716.2.2.1 Manual Model Annotation . . . . . . . . . . . . . . . . . . 716.2.2.2 Pre-annotation . . . . . . . . . . . . . . . . . . . . . . . . 716.2.2.3 Post-annotation . . . . . . . . . . . . . . . . . . . . . . . . 716.2.2.4 Training and Phase Probabilities . . . . . . . . . . . . . . 72
6.2.3 Observation Distributions . . . . . . . . . . . . . . . . . . . . . . . 73
xix

Contents
6.2.4 Model Construction Speed-up . . . . . . . . . . . . . . . . . . . . . 746.2.5 Discussion . . . . . . . . . . . . . . . . . . . . . . . . . . . . . . . . 74
6.3 Off-line Segmentation and On-line Recognition . . . . . . . . . . . . . . . . 746.3.1 Off-line Segmentation . . . . . . . . . . . . . . . . . . . . . . . . . . 746.3.2 On-line Phase Recognition . . . . . . . . . . . . . . . . . . . . . . . 75
6.4 Evaluation . . . . . . . . . . . . . . . . . . . . . . . . . . . . . . . . . . . . 766.5 Use of Visual Signals . . . . . . . . . . . . . . . . . . . . . . . . . . . . . . 77
6.5.1 Signals . . . . . . . . . . . . . . . . . . . . . . . . . . . . . . . . . . 796.5.2 Evaluation . . . . . . . . . . . . . . . . . . . . . . . . . . . . . . . . 81
6.6 Applications . . . . . . . . . . . . . . . . . . . . . . . . . . . . . . . . . . . 826.6.1 Event Triggering . . . . . . . . . . . . . . . . . . . . . . . . . . . . 826.6.2 Remaining Time Prediction . . . . . . . . . . . . . . . . . . . . . . 826.6.3 Towards Workflow Mining . . . . . . . . . . . . . . . . . . . . . . . 83
6.7 Conclusion . . . . . . . . . . . . . . . . . . . . . . . . . . . . . . . . . . . . 85
7 Monitoring Workflows using 4D Features 87
7.1 Objectives . . . . . . . . . . . . . . . . . . . . . . . . . . . . . . . . . . . . 877.2 Observations . . . . . . . . . . . . . . . . . . . . . . . . . . . . . . . . . . . 89
7.2.1 Occupancy Features . . . . . . . . . . . . . . . . . . . . . . . . . . 897.2.2 3D Motion Features . . . . . . . . . . . . . . . . . . . . . . . . . . . 89
7.2.2.1 3D Optical Flow . . . . . . . . . . . . . . . . . . . . . . . 897.2.2.2 Motion Features . . . . . . . . . . . . . . . . . . . . . . . 90
7.3 Modeling . . . . . . . . . . . . . . . . . . . . . . . . . . . . . . . . . . . . . 927.3.1 Initialization of Model Parameters . . . . . . . . . . . . . . . . . . . 937.3.2 Training and Recognition . . . . . . . . . . . . . . . . . . . . . . . 94
7.4 Evaluation . . . . . . . . . . . . . . . . . . . . . . . . . . . . . . . . . . . . 947.4.1 General Results . . . . . . . . . . . . . . . . . . . . . . . . . . . . . 957.4.2 Partial Labeling . . . . . . . . . . . . . . . . . . . . . . . . . . . . . 957.4.3 Temporal Constraints . . . . . . . . . . . . . . . . . . . . . . . . . . 97
7.5 Conclusion . . . . . . . . . . . . . . . . . . . . . . . . . . . . . . . . . . . . 98
III Outlook and Conclusion 101
8 Conclusion 103
8.1 Summary . . . . . . . . . . . . . . . . . . . . . . . . . . . . . . . . . . . . 1038.2 Discussion and Future Work . . . . . . . . . . . . . . . . . . . . . . . . . . 104
IV Appendix 107
A Discovering a Surgical Vocabulary from Inertial Sensor Data 109
A.1 Inertial Sensors in the OR . . . . . . . . . . . . . . . . . . . . . . . . . . . 110A.2 Vocabulary Generation . . . . . . . . . . . . . . . . . . . . . . . . . . . . . 111A.3 Conclusion . . . . . . . . . . . . . . . . . . . . . . . . . . . . . . . . . . . . 111
xx

Contents
B Examples of Surgical Reports for Laparoscopic Cholecystectomy 113
C List of Abbreviations 117
D List of Recurring Mathematical Notations 119
E List of Publications 121
F Abstract of Major Publications Not Discussed in this Thesis 123
References 125
xxi

List of Figures
1.1 Example of minimally invasive techniques: navigation with endoscopy andaugmented reality. . . . . . . . . . . . . . . . . . . . . . . . . . . . . . . . 5
1.2 Operating room in Paris using the da Vinci surgical robot. The robot iscontrolled through a remote console, located on the left in the picture.Courtesy of Intuitive Surgical, Inc. . . . . . . . . . . . . . . . . . . . . . . 6
1.3 Therapy Imaging and Model Management System (TIMMS). Courtesy of[Lemke and Berliner, 2007]. . . . . . . . . . . . . . . . . . . . . . . . . . . 8
2.1 (a) Four-states HMM model for patient presence detection. (b) Decisionrules for endoscopy holder control in cholecystectomy procedure. . . . . . 20
2.2 (a) Eye gaze tracking signals during a porcine cholecystectomy. (b) Riskassessment in minimally invasive surgery. The system detects the proximityof the instrument with a risk structure. . . . . . . . . . . . . . . . . . . . 22
2.3 UML class diagram representing a surgical ontology in image-guided neu-rosurgery. Courtesy of [Jannin and Morandi, 2007]. . . . . . . . . . . . . . 24
3.1 Abdominal anatomy (left) and trocar positioning (right). . . . . . . . . . . 283.2 Signals recorded from a surgery. The numbers on the top of the figure
indicate the different phases. . . . . . . . . . . . . . . . . . . . . . . . . . . 313.3 Illustration of a laparoscopic cholecystectomy. . . . . . . . . . . . . . . . . 323.4 External views of three different operating rooms from Hospital Rechts der
Isar, Munich, where recordings have been performed. . . . . . . . . . . . . 333.5 Pictures from the trocar camera and from an instrument covered with bar-
codes. . . . . . . . . . . . . . . . . . . . . . . . . . . . . . . . . . . . . . . 343.6 Left) Zeego robot from Siemens. Right) Picture from the intervention
room at Klinikum Grosshadern, Munich, where the multi-camera systemis installed. . . . . . . . . . . . . . . . . . . . . . . . . . . . . . . . . . . . 36
3.7 External view of a potential collision between a screen and a C-arm. Cour-tesy of [Ladikos et al., 2008b]. . . . . . . . . . . . . . . . . . . . . . . . . . 37
xxiii
List of Figures
3.8 Multi-camera reconstruction system layout, describing tasks accomplishedby the clients and server. Courtesy of [Ladikos et al., 2008b]. . . . . . . . . 37
3.9 Scenario describing the surgery workflow with its alternative paths. Phaselabels are given in parentheses. . . . . . . . . . . . . . . . . . . . . . . . . 39
3.10 External view and reconstruction of a fighting scene, with indication ofthe nine camera positions. The reconstruction is viewed from the directionopposite to the camera view shown on the left. . . . . . . . . . . . . . . . . 39
3.11 Illustration of the daily OR scenario for two workflow instances on a bavar-ian patient. Images from one view and associated 3D real-time reconstruc-tions. Left) A minimally-invasive surgery. Right) An open-surgery. . . . . . 40
4.1 Overlaid signals from three surgeries, showing the signal variations andneed for non-linear time warping. Only a subset of the signals is representedfor better visualization. . . . . . . . . . . . . . . . . . . . . . . . . . . . . . 44
4.2 DTW distance matrix. The path drawn through the valley displays theoptimal synchronization between time series u and v. . . . . . . . . . . . . 47
4.3 Signals of a virtual surgery representation. . . . . . . . . . . . . . . . . . . 48
4.4 Accuracy (rate of success), average recall and average precision for AVSRwith post-annotation. Influence of number of annotated surgeries. Thehorizontal lines refer to the best result for each curve, obtained when alltraining surgeries are labeled. . . . . . . . . . . . . . . . . . . . . . . . . . 52
4.5 For each phase, average length over all surgeries overlayed with mean de-tection error per phase, in minutes. Errors are computed for AVSR withpre-annotation construction. . . . . . . . . . . . . . . . . . . . . . . . . . . 54
4.6 Instrument weights computed for the first dissection phase (phase 3) andthe first liver bed coagulation phase (phase 12) . . . . . . . . . . . . . . . 55
4.7 Simultaneous video replay of two surgeries, based on the temporal warpingpath displayed in the middle. . . . . . . . . . . . . . . . . . . . . . . . . . 57
5.1 Graphical representation of a Markov chain and of a hidden Markov model.Shaded nodes indicate observed nodes. Unshaded nodes indicate hidden(or latent) nodes. . . . . . . . . . . . . . . . . . . . . . . . . . . . . . . . . 60
5.2 Example graphical representations of hidden Markov models as dynamicBayesian networks. Shaded nodes indicate observed nodes. Unshadednodes indicate hidden (or latent) nodes. . . . . . . . . . . . . . . . . . . . . 65
6.1 Dynamic Bayesian network representation of the generic AWHMMs withaddition of a latent node. . . . . . . . . . . . . . . . . . . . . . . . . . . . 69
6.2 Two usual HMM topologies. . . . . . . . . . . . . . . . . . . . . . . . . . . 70
6.3 Model merging is performed on an exhaustive representation of the trainingsequences (here three are displayed) by merging pairs of states and updatingparameters accordingly. . . . . . . . . . . . . . . . . . . . . . . . . . . . . . 70
xxiv

List of Figures
6.4 Pre-annotation model construction: Sub-HMMs are constructed for eachphase or cluster of data and appended as displayed in this image. Startand end states used to facilitate the concatenation are not displayed in thisfigure. . . . . . . . . . . . . . . . . . . . . . . . . . . . . . . . . . . . . . . 72
6.5 Training data obtained from surgical similarity splits. Each subpart ofthe virtual surgery O corresponds to synchronized subparts of the trainingsurgeries, which are then used to construct the sub-HMM. . . . . . . . . . 75
6.6 Accuracy (rate of success), average recall and average precision forAWHMM-seq with post-annotation evaluated on-line. Influence of num-ber of annotated surgeries. The horizontal lines refer to the best result foreach curve, obtained when all training surgeries are labeled. . . . . . . . . 78
6.7 For each phase, average length over all surgeries overlaid with mean detec-tion error, in minutes. Errors are computed on-line for AWHMM-seq withpre-annotation construction. . . . . . . . . . . . . . . . . . . . . . . . . . . 80
6.8 Several challenging views taken by the endoscopic camera. . . . . . . . . . 80
6.9 Exemplary pictures for the computation of visual signals. . . . . . . . . . . 81
6.10 Excerpt from an illustrative monitoring video published in [Padoy et al., 2008],showing synchronized input data, recognition and event triggering (here amessage asking to switch on the OR lights). . . . . . . . . . . . . . . . . . 83
6.11 Average errors in remaining time prediction, per phase. . . . . . . . . . . . 83
6.12 HMM topologies obtained with the model merging approach. Node labelsindicate the main occuring actions and are derived from signal semantics. 84
7.1 Computation of 3D flow histograms within the reconstructed volume, usingregular polyhedron quantization. . . . . . . . . . . . . . . . . . . . . . . . . 90
7.2 Notations for quantization using face normals. . . . . . . . . . . . . . . . . 92
7.3 Two scenes from a surgery, with reconstruction and motion flow. . . . . . . 92
7.4 Dynamic Bayesian network representation of the AWHMMs: two-level hi-erarchy with a phase variable. . . . . . . . . . . . . . . . . . . . . . . . . . 93
7.5 Graph representing the temporal relationships between the phases of theworkflow in Figure 3.9, as extracted from annotated sequences. Colorednodes stand for labeled phases and gray nodes for inter-phases. The bottomlevels of gray nodes are not displayed for visualization purposes. . . . . . . 94
7.6 Precision and Recall of AWHMMs as a function of the percentage of an-notated sequences in the training set. On-line results before EM (none),after global EM (EM) and after global and computation of phase variables(EM+PV). Mean over all sequences using leave-one-out cross-validation. . 98
7.7 Parallel structure of CO-HMMs, where all phases are interconnectedthrough the background phase. . . . . . . . . . . . . . . . . . . . . . . . . 99
7.8 Occurring phase transitions, on-line, for AWHMMs and CO-HMMs. Whitecolor means absence of transition. The diagonal has been removed forbetter visualisation. Mean over all sequences using leave-one-out cross-validation. . . . . . . . . . . . . . . . . . . . . . . . . . . . . . . . . . . . . 100
xxv

List of Figures
A.1 (Left) Attachment of the inertial sensors with bandages. (Right) Setupduring a vertebroplasty procedure. . . . . . . . . . . . . . . . . . . . . . . 110
B.1 Surgical report of a laparoscopic cholecystectomy. . . . . . . . . . . . . . . 114B.2 Surgical report of a laparoscopic cholecystectomy. . . . . . . . . . . . . . . 115
xxvi

List of Tables
3.1 The fourteen cholecystectomy phases used in the recognition. The durationcolumn displays the mean and standard deviation of the phases durations,in seconds. These values were computed for the 16 surgeries that are usedin our experiments. The average total duration is 48.5 (±18.5) minutes. . 33
4.1 Leave-one-out cross-validation on 16 surgeries performed by 4 surgeons.Global measures with mean and standard deviation over all surgeries. (pre)indicates pre-annotation, (post) construction with post-annotation. . . . . 52
4.2 Detailed results per phase for the pre-annotation approach, with meanand standard deviation over all surgeries. The third column (Rel. Len.)indicates the average relative length of each phase with its standard deviation. 53
4.3 Leave-one-out cross-validation on 16 surgeries performed by 4 surgeons.Global measures with mean and standard deviation over all surgeries. (pre)indicates pre-annotation, (post) construction with post-annotation, (adap)construction with ADTW. . . . . . . . . . . . . . . . . . . . . . . . . . . . 56
6.1 Off-line results. Leave-one-out cross-validation on 16 surgeries per-formed by 4 surgeons. Mean and standard deviation over all surgeries.(pre) indicates pre-annotation construction, (post) construction with post-annotation. AVSR refers to the approach in Chapter 4. . . . . . . . . . . . 77
6.2 On-line results. Leave-one-out cross-validation on 16 surgeries performedby 4 surgeons. Mean and standard deviation over all surgeries. (pre) indi-cates pre-annotation construction, (post) construction with post-annotation. 78
6.3 Online results. Leave-one-out cross-validation on 16 surgeries performed by4 surgeons. Detailed results per phase for the pre-annotation construction,with mean and standard deviation over all surgeries. The third column(Rel. Len.) indicates the average relative length of each phase with stan-dard deviation. . . . . . . . . . . . . . . . . . . . . . . . . . . . . . . . . . 79
xxvii

List of Tables
6.4 Online results for AWHMMs, with mean and standard deviation overthe cross-validation tests. Comparison of evaluation measures using pre-annotation construction with and without the visual signals included duringthe experiments. . . . . . . . . . . . . . . . . . . . . . . . . . . . . . . . . 82
7.1 On-line results and off-line results for AWHMMs. Mean and standarddeviation over 22 sequences using leave-one-out cross-validation. . . . . . 95
7.2 On-line results presented per phase using AWHMMs. Mean and standarddeviation over 22 sequences using leave-one-out cross-validation. ColumnPhase indicates the phase label, as in Figure 3.9. B stands for the phasemodeling background activity. Column # shows the number of occurrencesof each phase within the dataset. . . . . . . . . . . . . . . . . . . . . . . . 96
7.3 On-line and off-line results, using occupancy features (occ) and both oc-cupancy and motion features (occ+mot). Mean over 22 sequences usingleave-one-out cross-validation. Results for motion features only are pre-sented in Table 7.1. . . . . . . . . . . . . . . . . . . . . . . . . . . . . . . . 96
7.4 Results in percent using solely labels 3, 6, 7 and 8. Mean and standarddeviation over all sequences using leave-one-out cross-validation. Compar-ison on-line and off-line, without EM (NO), with EM only (EM) and withEM followed by recomputation of phase probability variables (PV). . . . . 97
7.5 Summarized results, comparing AWHMMs (AW), CO-HMMs (CO) andMAP-HMMs (MA), on-line and off-line, using EM and computation ofphase probabilities. Mean over 22 sequences using leave-one-out cross-validation. . . . . . . . . . . . . . . . . . . . . . . . . . . . . . . . . . . . . 99
xxviii

Part I
Introduction, Motivation and
Related Work
In Chapter 1, we introduce the topic of the dissertation, namely the problem of recognizingactivities within a surgical workflow. We motivate this objective by describing how modernoperating rooms can benefit from context-aware support and how new technologies enableit. Related work in activity recognition is then presented in Chapter 2, with a particularemphasis on the medical field. Finally, chapter 3 describes in details the two applicationsaddressed in this thesis: the cholecystectomy application and the daily OR workflow.
1


CHAPTER 1
Introduction
The department of surgery is the core unit of the patient care system in a hospital.This is the place where therapeutic treatments are performed, in close collaboration withseveral other medical disciplines such as anesthesia. Surgery is continuously subject totechnological and medical innovations, illustrated by the accelerated development andintroduction of new imaging technologies, advanced surgical tools, navigation and patientmonitoring systems. The purpose of these advances is to improve patient treatment. Butat the same time, they also transform and complexify the pre-, intra- and post-operativedaily routine.
The increasing complexity of processes occurring in surgery rooms, as well as thegrowing amount of available information, raise high interest for contextual support to theOperating Room (OR) staff. Contextual support could display information in the mostsuitable way at each timestep of the surgery, relieve the personnel from performing simplebut time-consuming tasks and also assist them in the tedious ones. Context awareness inthe OR is on the verge of becoming possible with the surgery rooms being revolutionizedby taking fully advantage of Information Technologies.
Context aware support requires that events and activities occurring in the OR can beautomatically recognized, based on signals available from the different OR tools and sys-tems. The current difficulty to gather signals from the OR is a limiting factor to researchin this area. However, efforts towards the introduction of common standards should per-mit to collect signals from many systems using a unique central interface in the future.Clinicians and researchers have indeed recently stressed the crucial need for a new Op-erating Room, called Operating Room of the Future, in which assistance systems shouldin particular be fully integrated to deliver increased benefits for patients, surgical staff,hospitals and the healthcare system in general [Cleary et al., 2005, Lemke et al., 2005].
Context-awareness and recognition within the OR are at their very early stages: itis the purpose of this thesis to perform some groundwork in these directions. This isaccomplished in several steps. We first propose to model interventions in terms of mul-
3

Introduction
tidimensional time-series formed by synchronized signals acquired over time. We thenpresent machine learning approaches based on this representation to model, synchronizeand recognize phases within a surgical workflow.
We address two complementary scenarios to demonstrate the concepts: endoscopicsurgery workflow and daily operating room workflow. These two scenarios were not onlychosen because of their complementary nature: for both of them, there exist amongour medical partners interest in the application and also sustained effort to acquire therequired signals during real interventions.
1.1 The Operating Room of the Future
The Operating Room of the Future (ORF) is a concept for better operating roomsand interventional suites. The improvements are defined in terms of patient treatment,information handling, system integration and ease-of-use, system and person communi-cations, workflow, patient throughput and cost efficiency [Satava, 2003, Feussner, 2003,Berci et al., 2004, Cleary et al., 2005, Lemke et al., 2005, Sandberg et al., 2005]. In thefollowing, we briefly present several major directions for the ORF. They show how theOR is getting increasingly high-tech and digital, up to a point where almost every activityand action can be "observed" by some system signals. This will permit to stress how theinvolved technologies make context-aware systems possible and also how the staff and thesurgery department could benefit from contextual support.
1.1.1 Image-guided Surgery
Less invasiveness has been a main objective in the development of image-guided proce-dures [Peters, 2006]. Contrary to open surgery, in which significant lesions are necessarilycaused to soft tissues to obtain a direct access to the anatomical region of interest, mini-mally invasive procedures only require small incisions and are characterized by less traumafor the patient and by a faster recovery time. This is made possible by the use of specificsystems which allow indirect access to and visualization of the operation field.
A widespread technique for minimally invasive surgery is endoscopy, in which the re-gion of interest is imaged in real-time by an endoscope, a generic name for a tool consistingof a light source, an optic unit and a camera at its proximal end. It is introduced trougha small incision or a natural opening and can be rigid (e.g. laparoscope or arthroscope) orflexible (e.g. bronchioscope or colonoscope). Endoscopes can be used both for diagnosisor surgery. To control his movements, the surgeon looks indirectly at the anatomy andat the inserted tools on a video screen (see Figure 1.1(a)).
Endoscopes cannot however be used in all situations. Many pathologies remain forinstance invisible to the surgeon on simple video images. Alternative solutions targetedin image-guided surgery involve the use of other imaging techniques for intra-operativeguidance. Currently available imaging modalities include X-rays, fluoroscopy, computedtomography, magnetic resonance, positron emission tomography, nuclear probes and ul-trasound. Even though they can sometimes be used regularly during the surgery, theyusually provide only indirect visualization to the surgeon. Imaging solutions suitable for
4

1.1 The Operating Room of the Future
(a) Endoscopic surgery. The surgeon looks at the monitorfor hand-eyes coordination.
(b) Visualization of Joerg Traub’s foot withaugmented reality (courtesy of Oliver Kutterand Joerg Traub).
Figure 1.1: Example of minimally invasive techniques: navigation with endoscopy andaugmented reality.
intra-operative usage are x-rays, fluoroscopy, ultrasound and sometimes magnetic res-onance. Modalities which can only be acquired pre-operatively or sparsely during thesurgery still provide valuable information about the structures and tissues to design asurgical roadmap.
Several issues need however to be solved in order to optimally use the informationprovided by these modalities during the surgery. A key difficulty is to relate with precisionthe positions of the surgical tools in the real world (i.e. within the patient) to the differentcoordinate systems of the images. This involves challenges in different areas, such assegmentation, registration, tool tracking, compensation of patient movements and tissuedeformations [Peters, 2006, Yaniv and Cleary, 2006]. Presenting the resulting informationto the surgeon in the right way is also a challenge in itself. A promising direction isAugmented Reality (AR) (see [Sielhorst et al., 2008] for a review of medical AR), in whichguidance information is directly incorporated into the surgeon’s field of view (as shownin Figure 1.1(b)). The AR technology is particularly exciting for the development ofnew ways to provide contextual information and interaction mechanisms to the surgeon[Navab et al., 2007].
1.1.2 Surgical Robotics
The OR2020 report [Cleary et al., 2005] evokes the idea of a surgery room completelyrobotized, where patients would go through similarly to cars on industry assembly lines.This is far from being possible with the actual state-of-the-art in robotics, as the capacitiesof decision and anticipation of a surgeon are way beyond the current possibilities ofmachines. However, machines are predictable and their motion can be modeled. Thisis not the case for humans, whose behaviours are hard to quantify and are influencedby many factors such as e.g. stress, fatigue and lack of attention. Even though humanmotion can be very precise, it may also be poorly reproducible and quantified.
Robotics could therefore be complementary to human abilities. The key idea is not
5

Introduction
Figure 1.2: Operating room in Paris using the da Vinci surgical robot. The robot iscontrolled through a remote console, located on the left in the picture. Courtesy ofIntuitive Surgical, Inc.
to replace the surgeon, but to provide him/her with tools that enhance his capabilities,under his/her control. Robotic assistance is especially indicated in fine operations orminimally invasive surgery scenarios, in which the requirements create harder workingconditions, smaller areas of operation, and diminished visual and haptic perceptions.Benefits include precision, miniaturization of access and ergonomy. The developments andapplications of robotic surgery are numerous [Davies, 2000, Taylor, 2008]. Most robotsare designed for specific surgeries. We briefly mention two major application areas ofsurgical robots: the execution of planned tasks and the extension of the surgeon’s hand.In the execution of planned tasks, the robot is used to perform an autonomous taskunder surveillance of the medical team. Its planning has been decided beforehand bytaking into account pre-operative patient information. This has advantages in precisionand accuracy over a human. Example of application is the insertion of a needle basedon a target indicated in a pre-operative image. In the case of extending the surgeon’shand, robotic tools are controlled by the human through a human machine interface.This permits enhancing features such as filtering of high-frequency motion in the humanhand, preventing movements from deriving away from a pre-planned route, or performingnon-natural gestures.
Extending the surgeon’s hands offers promising surgical possibilities, such astelesurgery [Satava, 2005]. Telesurgery has been demonstrated on real operations per-formed by two commercial robots: the da Vinci robot [Guthart and Jr., 2000] (see Figure1.2) and the Zeus robot [Ghodoussi et al., 2002]. In fully robot assisted surgery room,telesurgery could even permit to conduct remote surgeries in unmanned OR. This is forexample targeted by the Traumapod project [Friedman et al., 2007], which aims to pro-vide an unmanned OR on the battlefield controlled remotely by a surgeon.
In robotic environments, rich signals for analyzing and monitoring the surgical pro-cesses are directly available from the robots [Lin et al., 2006].
6

1.1 The Operating Room of the Future
1.1.3 Digital Operating Room
Most information used and exchanged during a surgery tend to be digital. Patientinformation, operation schedules, surgical reports and image modalities are handled bycomputers. Patient monitoring systems, image guided assistance systems, electronic tools,intraoperative imaging devices and robots could have their signals digitally available.Currently however, most devices present in the OR are working independently and donot share information on a common platform. This slows down data exchanges betweenstaff, systems, departments and hospitals [Cleary et al., 2005, Lemke et al., 2005]. Thisalso prevents the design of user interfaces providing a complete overview of the OR status[Meyer et al., 2007]. Lack of standardized interfaces and concurrent developments are atthe origin of this issue.
Propositions for new standards to design an integrated and digital OR are emerg-ing [Lemke, 2007, Lemke and Vannier, 2006]. The driving idea is to extend the well-established DICOM standard designed for picture archiving and communication sys-tems (PACS) used in radiology to incorporate all components intervening in the sur-gical processes in addition to imaging modalities. The concept proposed by Lemke et al.[Lemke and Berliner, 2007] is called Therapy Imaging and Model Management System(TIMMS). TIMMS aims at modeling all data exchanges and decision processes withinthe surgery room (see Figure 1.3). It contains a communication platform and mod-ules that model and control all components of a procedure, ranging from images andsignals to the visualization devices, including the procedure’s workflow and knowledgedatabases. The system needs to be scalable, distributed and to provide interchangeableobjects. Design and experiments with an initial TIMMS framework are reported e.g. in[Mayoral et al., 2008].
The adoption of a digital OR could improve the operative efficiency during the surgery,by allowing smoother interaction, communication and decision processes. This could alsogive way to an accelerated development of telecollaboration, since all information will beavailable on-line with low transmission delays.
1.1.4 Workflow Optimization
Due to the increasing amount of information, systems and communication require-ments, optimizing the workflow is a major objective in the design of the Operating Roomof the Future [Cleary et al., 2005, Lemke et al., 2005]. This should permit an improvedand more quantifiable treatment as well as cost reduction through better scheduling withinthe surgery department and increased patient throughput. Workflow in the OR is condi-tioned by communication interfaces, spatial layout, personnel skills and teamwork abili-ties. The workflow can first be optimized off-line. This usually involves the redesign of theOR and of the personnel guidelines by experts, based on statistics of the past surgeries.Indeed, optimal integration and positioning of systems along with an optimal ordering ofpersonnel tasks can reduce setup, communication and usage delays.
Depending on situations and human factors, the surgical staff may however not alwaysbehave optimally at each time-step, e.g. with respect to tool usage and scheduling. Staffmay also be overloaded by incoming information. For this reason, workflow should also
7

Introduction
Figure 1.3: Therapy Imaging and Model Management System (TIMMS). Courtesy of[Lemke and Berliner, 2007].
be optimized on-line by providing the OR staff with context-sensitive support that relieson actual conditions within the OR. Such support can be the display of the right infor-mation at the right time, the triggering of reminders to the personnel, or the real-timetransmission of information about personnel and room availability. There is now a needfor intelligent systems that will use information from both previous surgeries and mod-els provided by experts to propose opinionated and non-opinionated guidance through-out the procedure (corresponding to the module "Kernel for Workflow and Knowledge+ Decision Management" in Figure 1.3). Off-line and on-line optimizations are natu-rally intertwined, but the on-line nature of such systems is becoming increasingly crucialwith the numerous tasks that have to be accomplished, e.g. in image guided surgery[Navab et al., 2007, Lemke and Berliner, 2007].
1.2 Signal-based Surgical Workflow Analysis
1.2.1 Sensor-enriched Operating Rooms
The trends described in the previous section suggest that the Operating Room ofthe Future will host a tremendous set of sensors and electronic devices that will provideinformation about almost all activities occurring in the OR, performed either by surgeons,
8

1.2 Signal-based Surgical Workflow Analysis
assistants or nurses. Surgical activity will be indicated by signals coming from the electricactivation of tools, from tool and staff tracking systems, robot movements, intra-operativeimaging devices, patient monitoring systems, etc. Peri-surgical activity will be perceivedby additional sensors, such as video cameras, RFID sensors and the usage of the hospitalinformation system. In addition to these real-time signals, patient specific information,including age, previous treatments and pre-operative images will be digitally accessible.When this information is available in real-time from a unique computer interface and in asynchronized manner, the preliminary requirements for the development of a fully awareoperating room will have been met. The OR will then be equipped with multiple sensorssimilarly to the Aware Home [Kidd et al., 1999], a testbed for developing context-awareassistance in the home.
1.2.2 Surgical Workflows
In most current medical procedures and applications, the sequence of surgical stepsand actions that are accomplished to perform a treatment follows a repetitive schema.This schema is usually called a workflow (see Section 1.2.4). Workflows do not onlystructure the performance of the operation, from the first incision on the patient to thelast suturing, but also the complete usage of the surgery room, from the entrance of onepatient to the next one. In regular operations, patient and surgeon specificities influencethe surgical steps in their details. But they do not alter the overall workflow.
Workflows are described in medical books, formalized by protocols and learnt by thepersonnel during medical studies and training. They are also enforced by the specializationof surgery rooms and cost efficiency requirements [Herfarth, 2003]. In other industries,for instance in production lines, formalization and optimization of workflows as well asinformation technology integration are more advanced and have shown to be a key pointfor reducing costs and improving quality. But contrary to each instance of an industrialproduct, a patient cannot be processed by a simple automate. His variability and hiscondition of human being raise additional technical and ethical issues.
1.2.3 Potential Applications
The presence of rich OR signals, combined with the constraints and repetitivity im-posed by surgical workflows, offer new possibilities for analyzing, understanding and mon-itoring workflows using machine learning approaches. Several applications are providedin the following sections.
1.2.3.1 Situational Awareness
The huge amount of available information will permit the construction of decisionsystems that can interpret the current signals based on a database of signals acquiredfrom previous interventions. Possible applications differ both in scope and coarseness oftheir monitoring as well as in the amount of expert supervision required in the systemconstruction. Some application examples are:
9

Introduction
Scheduling: The current surgery stage can be synchronized in real-time to the standardsurgery workflow. This would permit to follow visually on a workflow diagram the progressof an operation in a remote control room. Such information could be used to adapt roomand personnel scheduling within the surgery department.
Context-sensitive user-interfaces: User-interfaces that adapt to the context can per-mit to display the right information to the right OR member at the right moment. Theycould permit to trigger reminders and notifications to new surgical personnel about thenext steps that have to be performed. This could ease the preparation of instruments atthe right moment. In the long-term, this could even permit a certain degree of automation.
Documentation: Key events and their times of occurrence can be written down au-tomatically, easing the hand out of the final report by the surgeon. Together with thecomplete archiving of the data, this also provides objective material for legal matters.
Anomaly detection: Unpredicted variations from the signals with respect to the pre-vious procedures can be used to trigger warnings to the surgical staff. More trivially, thiscould be used to notify the personnel when immediate equipment maintenance or resourcereplacement (for instance oxygen bottles) are required.
1.2.3.2 Surgical Data Mining
Traditional modeling and design of workflows is based on a manual approach performedby experts. When the objective is to analyze and redraft an existing workflow, e.g. foroptimization purposes, objective and statistical information about the existing workflowsis very valuable. Experts can indeed be subject to bias, by observing the workflow as itshould be rather than how it really is [van der Aalst et al., 2003]. Set of signals, whichcan also be referred to as process logs, can be analyzed automatically to provide theirunderlying structure and statistics. This is precious information for experts, who canmore easily analyze and find out used resources, causal dependencies, sources of delaysand exceptions within the previous procedures.
In addition to their usage for the redrafting of a workflow to make it more efficient,objective inputs can be used to design benchmarks for workflow comparisons. This wouldbe very useful to evaluate the impact and benefits of the introduction of a new medicaldevice.
1.2.3.3 Databases Analysis and Training
The archiving of all signals permits several applications such as planning based onstatistical analysis and search for previous similar cases. This can be achieved by analyz-ing pre-operative images of previous patients, but also by visualizing previous surgeries,including their specific potential issues. This is also particularly valuable for training.Indeed, trainees could visualize surgeries of the same kind performed by different sur-geons, displayed in a synchronized fashion. This could permit comparison and comments
10

1.3 Contributions
by a teacher. This would also allow the trainee to compare himself objectively to moreexperienced surgeons.
1.2.4 Definitions Related to the Problem
Several terms related to recognition within workflows will be used throughout thisthesis. Terms referring to actions, their sub-parts and their compositions are not well-defined, since their distinction and coarseness are a matter of application and time-scale.We present below a usual terminology, based on a-priori semantic knowledge about theapplication domain.
An action is defined as the fundamental element in the semantic interpretation of ascene; it consists for example in picking up, handing, cutting. When several of theseactions are considered together, they form activities or behaviors [Bobick, 1997]. Withincreasing complexity and timescale, we define a phase as a semantically meaningful groupof activities occurring somewhere inside a temporal sequence of actions, i.e. a "step" ina process. Phases occur repetitively or constantly across different sequences; the orderin which they appear matters. Phases can have huge differences in durations, especiallyacross recordings. The semantic relevance which leads to considering a group of activitiesas a phase, is purely determined on the basis of domain knowledge. Finally, a set of phasesalong with their temporal relations is named a workflow.
In this thesis, the workflow analysis approaches are signal-based, i.e. the workflowis observed by a time-series of multidimensional vectors containing signals (informationunits), for instance obtained from video images and electronic systems. A multidimen-sional vector of signals at a certain time-step can be referred to as an observation. Thetime-series or sequence of observations obtained during the execution of a workflow iscalled a workflow instance or workflow exemplar.
The regular recording of a workflow within a surgery room yields a database of work-flow exemplars, illustrating the workflow and its variations, depending on patient, envi-ronment and staff differences. Machine learning approaches on this database are used toconstruct recognition systems. Recognition is said to be on-line, when it is performed foreach time step of the workflow instance, using all signals of the instance acquired up tothat particular time step. It is said to be off-line, when it is performed for each time-step, but based on all signals of the workflow instance up to the last time step. In thelatter case, the recognition can only occur after the end of the execution of the workflowinstance. Real-time recognition is by nature an on-line process.
1.3 Contributions
The analysis of surgical workflow based on real-time signals is a recent research field.To our knowledge, there is no published work presenting on-line workflow recognitionapproaches for complete surgeries. In this thesis, we introduce and formalize the problemof recognizing phases within a surgical workflow, using representations of interventions interms of multidimensional time-series formed by synchronized signals acquired over time.We represent the entire surgical workflow within a single model that is learnt from fully
11

Introduction
or partially annotated data and permits either off-line segmentation, on-line recognitionor both.
The first contribution is a surgical workflow representation, which can be used for off-line surgical phase segmentation of a sequential workflow. The approach combines high-level annotation with average surgical signals and is based on surgery synchronizationwith the dynamic time warping algorithm. The model is called annotated virtual surgeryrepresentation (AVSR) and several approaches are proposed to construct it.
The second contribution is a representation based on hidden Markov models, calledannotated workflow hidden Markov model (AWHMM), that permits both off-line segmen-tation and on-line recognition of the phases of a workflow, possibly containing alternativecourses of activities. Several approaches are proposed to construct it. Like the AVSR,the AWHMM is based on phase probability variables that retain semantic information.These variables store the annotation and permit both to prevent semantic informationfrom getting blurred during training and to conveniently construct the model under partiallabeling.
The third contribution is to provide a solution for workflow monitoring of laparoscopiccholecystectomies, based on tool usage during the procedure. Results are presented interms of recognition, modeling and remaining-time prediction, using recordings from realprocedures performed at the Hospital Rechts der Isar, Munich. We also present initialsteps towards the usage of the endoscopic video as input signal as well as a joint effortwith our medical partner to develop a trocar-camera system for real-time tool recognition.
The fourth contribution is an approach based on 4D features for recognition in a com-plex OR workflow. To recognizes the phases, we propose to use 3D-flow computed directlyon multi-view reconstruction data. The approach is evaluated on surgeries containing al-ternative workflows and performed in a mock-up OR. This application is motivated by theinstallation of a 16-camera system within an interventional room at Hospital Grosshadern,Munich.
Additionally, we present in Appendix A some early work to introduce wearable sensorsin the surgery room and to define automatically a motion vocabulary from this data foraction recognition in percutaneous vertebroplasties. The list of publications I authoredand co-authored during this thesis is available in appendix E. The abstracts of severalmajor publications that are not discussed within this thesis are available in appendix F.
1.4 Outline
We first present in Chapter 2 related work in the domains of action recognitionwithin workflows, of recognition within medical applications and of modeling of sur-gical workflows. Chapter 3 introduces the two applications addressed in this the-sis. The laparoscopic cholecystectomy procedure, the daily OR workflow scenario aswell as the setups and signal acquisition approaches are presented. Chapter 4 de-scribes methods based on dynamic time warping to synchronize surgeries, to gener-ate an annotated virtual surgery representation (AVSR) and to segment the surgicalphases of interest. Results are provided for the cholecystectomy application. Workrelated to this chapter has been published in [Padoy et al., 2007a]. In chapter 5, hid-
12

1.4 Outline
den Markov models are presented, as they are the core of the recognition methods pro-posed in the next two chapters. Chapter 6 introduces the annotated workflow HMM(AWHMM) in the context of laparoscopic procedures for modeling and performing on-line recognition. Several methods described in this chapter have been published in[Padoy et al., 2007b, Padoy et al., 2008, Blum et al., 2008a, Padoy et al., 2009]. Chap-ter 7 presents the usage of 3D reconstruction data for recognition in a daily OR sce-nario. An effective AWHMM initialization is described as well as experiments on a work-flow containing alternative paths. Work related to this chapter has been published in[Padoy et al., 2009]. Finally, conclusions of the thesis are presented in chapter 8.
Early work on defining a motion vocabulary from inertial sensor data obtained fromvertebropasty procedures is presented in Appendix A. Work related to this appendixhas been published in [Ahmadi et al., 2008, Ahmadi et al., 2009]. Major publications notdiscussed in this thesis are briefly presented in Appendix F.
13

Introduction
14

CHAPTER 2
Related Work in Surgical Workflow Analysis
Human activity recognition is a large research domain that has been actively inves-tigated in the last decade. The trend is higly motivated by the wide variety of applica-tions concerned with understanding and modeling human behaviors, such as surveillance,human-machine interaction and medical monitoring.
The surgical application left aside, extensive literature exist in the computer visionand pattern recognition communities on human activity recognition. The proposed meth-ods are principally based on the usage of video images or wearable sensors. It is howeverimportant to note that actions in daily life are less constrained and less subtle than inthe operating room. For this reason, most work address the recognition of independentactions, but do not consider the constraints of a workflow. In the operating room, recogni-tion of surgical activity is a recent field of research. Only few work have directly addressedthis application under the specific constraints and difficulties implied by the surgical en-vironment. Closely related is literature focusing on the evaluation of surgical skills inminimally invasive surgery and on the design of robotic assistants for the OR. It providesinsights both in the OR signals that can be obtained and in the methods used for theiranalysis. At a more abstract level, the increasing literature about formal modeling ofsurgical processes stresses the important role played by the surgical workflow inside theoperating room.
As the surgical workflow recognition problem is highly multi-disciplinary, we decidedto present the different related areas. We first briefly present literature addressing generalhuman activity recognition, with a focus on vision-based approaches using workflow con-straints and on approaches using wearable sensors. We then focus on recognition withinthe department of surgery and on the formal modeling of surgical processes. We brieflyposition our work with respect to the existing literature at the end of this chapter.
15
Related Work in Surgical Workflow Analysis
2.1 Human Activity Recognition
Outside the surgery room, previous works have addressed problems such as the recog-nition of human actions [Aggarwal and Cai, 1999, Yan et al., 2008]; the activity andanomaly detection in public environments, [Grimson et al., 1998, Bremond et al., 2006,Wang et al., 2007]; the modeling and identification of the primitive actions composingactivities [Moore and Essa, 2002, Shi et al., 2006]; the automatic discovery of the activi-ties [Hamid et al., 2007, Xie et al., 2004] and the recognition of events in groups such asin meetings [Oliver et al., 2004, Brdiczka et al., 2007].
These approaches rely on sensors placed within the environment or directly on theobserved persons. They differ either in the signal combinations and representations,or in the machine learning approaches used for recognition. The Aware Home project[Kidd et al., 1999] is representative of the sensors available for activity analysis. In thisproject, a house containing ubiquitous sensing was built to study everyday’s activities anddevelop context-aware services. Sensors included video cameras, RFIDs, microphones andweight floor captors. Combining wearable computers with the external sensors is also pro-posed. Currently, video is still the most widely studied support for research in activityanalysis, as cameras are non-invasive, cheap and already present in many locations.
A common underlying feature in the above-cited literature is the focus on recognizingisolated actions or activities (e.g. pick up, wave, fight, etc). In this way, they complywith most long-term applications, where relevant actions need to be detected but periodsof inactivity and uninteresting actions should be discarded. In this thesis, we addressthe activity recognition problem in the context of a workflow. In this case, activitiesfollow a well-defined structure in a long period of time and can be semantically groupedin relevant phases. The major characteristic of the phase recognition problem is thetemporal dependencies between phases and their highly varying durations.
In Section 2.1.1, we will first review the subpart of the computer vision literature inwhich constraints of the workflow are considered in some ways. We will then present,in section 2.1.2, existing work using wearable sensors. These sensors are prone to beminiaturized and may get used soon into the OR [Yang, 2006].
2.1.1 Vision based
For a recent review of general action recognition methods based on video images, werefer the reader to [Weinland, 2008]. In the following, only articles considering workflowaspects are presented.
Pinhanez and Bobick [Pinhanez and Bobick, 1997] were among the first to analyzecomplex flows of actions. In their seminal work, framing in a TV studio was proposed tobe done automatically, by triggering cameras based on the detection of events specifiedin a script. Unfortunately, their vision system was not able to detect the events and theauthors were forced to generate them manually. Although progress has been done eversince, using vision systems for recognition in complex environments remains difficult. Theproblem is usually simplified by limiting the number of actors or that of actions, using adistinctive background, restricting the activity area or discriminating the actions by theirspatial location.
16

2.1 Human Activity Recognition
[Koile et al., 2003] introduced the concept of activity zones: regions in an environmentthat are linked to specific activities. Likewise, [Nguyen et al., 2005] represented a room asa collection of cells. In both cases a tracking system was used to determine the presenceof a person in a zone or the occupation of a cell. The goal of [Nguyen et al., 2005] wasto recognize behaviors that differed in the occupied cells and in the sequence of theiroccupation. Hierarchical HMMs were used to recognize three behaviors, namely having asnack, a normal meal or a short meal. [Moore et al., 1999] used a camera installed abovea desk to track a person’s hands and objects on the table. An HMM was used to detectactions based on interactions of the hands with the objects. The use of model constraintsto recognize complex events has been suggested in works like [Xiang and Gong, 2008,Moore and Essa, 2002, Vu et al., 2003, Shi et al., 2006]. [Xiang and Gong, 2008] ad-dressed structure learning in HMMs to obtain temporal dependencies between a fewhigh-level events for video segmentation. An HMM modeled the simultaneous outputof event-classifiers to filter their wrong detections. [Moore and Essa, 2002] used stochas-tic context-free grammars to recognize separable multi-tasked activities in a card gamefrom video. Production rules were manually defined to describe all the relations betweenthe tracked events. [Shi et al., 2004, Shi et al., 2006] proposed propagation networks tomodel and detect from video the primitive actions of a task performed by a tracked person.Propagation networks are graphical models that explicitly model parallel streams of eventsand are used for classification. The detailed topology is handcrafted and trained from par-tially annotated data. [Vu et al., 2003] used a symbolic approach to recognize complexactivities in surveillance applications. For each activity, a formal scenario was providedby hand, including actors, objects and their spatio-temporal dependencies. Concerningthe computation of features to observe the scene from video data, the aforementioned lit-erature mainly relied on detection and tracking of the persons and objects. Failure of oneof these components hinders the recognition of the events. These articles imposed con-straints on the flow of events to design a better model and improve recognition results. Inmost of them, the constraints were provided manually with an handcrafted topology andannotated data. In [Nguyen et al., 2005, Xiang and Gong, 2008], the structure is learntfrom the data. To simplify the problem, the data either comes from constrained activities(e.g. an action corresponds to a spatial area) or has been pre-processed to contain highlevel semantic information. The main focus is on action classification. For this reason,on-line detection results are rarely provided. Additionally, the actions usually have similarshort durations.
2.1.2 Wearable-sensor based
Even though cameras are available in many places, not all open areas can be coveredto observe human activities. Moreover, it remains difficult to estimate accurately humanpostures and movements from videos in unconstrained environments. Wearable sensorstend to become more comfortable than some years ago with the miniaturization of theinvolved technologies, in particular of power supplies. They can thus provide additionaland complementary information on human activities.
[Bao and Intille, 2004] used two or five biaxial accelerometers worn on the body to
17

Related Work in Surgical Workflow Analysis
recognize various physical activities, such as running, brushing teeth, reading, vacuumcleaning. Features extracted with the fast Fourier transform were used by decisiontree for classification. [Huynh et al., 2007] used three biaxial accelerometers to classifya wide range of daily activities. Classification results were compared using clusteringalgorithms, support vector machines and HMMs. For the recognition of free-weight ac-tivities, [Chang et al., 2007] used two three-dimensional accelerometers, one in a gloveand one on the waist. The approach, based either on Bayesian classifiers or on HMMs,resulted in the automatic counting of repetitions. In [Kern et al., 2003], an architecturefor gathering data from multiple 3D accelerometers was presented. Physical activity wasclassified with Bayesian classifiers. [Krause et al., 2003] used an armband containing twobiaxial accelerometers and sensors of physiological data to classify daily activities usingself-organizing maps. In [Lester et al., 2006], the authors proposed to use a single bodylocation, but a rich sensor-board including among others accelerometers, a barometer, acompass and a microphone. Data was classified with HMMs after feature selection. Torecognize actions performed during an assembly task in a workshop, [Ward et al., 2006]used a combination of wearable microphones and accelerometers. The different activitieswere classified with linear discriminant analysis and HMMs. In [Subramanya et al., 2006],activities were recognized together with locations, using a GPS and a sensor board. A dy-namic Bayesian network was trained on partially annotated data to model dependenciesbetween activities and locations.
Medical applications of wearable sensors are for instance the analysis of gait[Morris and Paradiso, 2002], the monitoring of chronic patient [Patel et al., 2007,Bravo et al., 2008] and the monitoring of disease processes [Yang, 2006] .
These work show that recognition of individual activities using wearable sensors ispossible. The methods however do not take any workflow constraints into account. Sincesuch sensors are prone to be introduced in the OR [Yang, 2006], they are good candidatesfor being used for action recognition in surgical workflows.
2.2 Surgical Activity Recognition
In Section 2.2.1, we present works aiming generally at the recognition of events oractivity within the OR for various applications. Recognition focused on activities per-formed by the surgeon during a minimally invasive surgery will be presented in Section2.2.2. In Section 2.2.3, we present some work addressing the evaluation of surgical skills inendoscopy, since the acquired signals are particularly of interest for workflow recognition.
2.2.1 Recognition in the Operating Room
In [Agarwal et al., 2007], a system was presented for the automatic generation of anelectronic medical record (EMR). The system was recording information about the ad-ministration of medicines, the presence of surgical staff and the occurrence of medicallysignificant events. For the detection of medical events, physiological signals were queriedusing a rule-based knowledge system based on fuzzy logic and designed by experts. Exper-iments were carried out in a trauma scenario with four events using physiological signals
18

2.2 Surgical Activity Recognition
provided by a simulator. Detailed results were not presented, but the authors mentionedhigh recognition rates with a generally high latency. Tracking of medical supplies and ofpresence/absence of patient or staff was achieved using RFID sensors. An application ofthe system is the automatic EMR generation within an unmanned OR. The developmentof such an OR was targeted by the traumapod project for providing healthcare on thebattlefield, using telesurgery with the da Vinci robot from Intuitive Surgical and roboticassistants [Friedman et al., 2007]. In [Agarwal et al., 2007], the system offered the displayof tracking information and recognized events, elementary checks such as the presence ofthe right patient, and also convenient replay of videos recorded during the procedure.
[Meyer et al., 2007] pursued a similar objective. In collaboration with human factorsengineers, an integrated display was developed for the Operating Room of the Future atthe Massachusetts General Hospital, showing dynamic information gathered from RFIDtags and OR systems. The display adapted to the stage of the procedure, which was ob-tained from the milestone data entered by the nursing personnel. In addition to the smartdisplay of contextual information to all staff members present in the OR, a mentionedlong-term objective was the integration of decision support into the system.
Location information Locations provide useful clues about the activities. So far,RFID has been the most widely investigated technique for material and person trackingwithin the hospital. Objectives were mainly intendance and reporting, but also activityrecognition. For instance, in [Bardram, 2004], a context-aware system using RFIDs waspresented for several nursing applications including monitoring a pill container, monitoringthe patient bed and using efficiently the electronic patient record. In [Favela et al., 2007,Sanchez et al., 2008], input data containing personnel location and interactions was usedwith neural networks or hidden Markov models to classify daily activities of medicalworkers inside the hospital, such as taking care of patients or performing clinical caseassessment. The data was acquired manually from a study conducted at the hospital, butcould be obtained with RFIDs.
Within the surgery room, RFIDs have been mainly proposed to check the pres-ence of the right patient and staff and to perform inventory tasks [Nagy et al., 2006,Egan and Sandberg, 2007]. An important potential application is also the automatictracking and counting of sponges, to make sure none was left inside the patient[Macario et al., 2006, Rogers et al., 2007]. In [Houliston and Parry, 2008], a setup basedon RFIDs was proposed to record the activities in the anesthesia department. The men-tionned longer term objective was to monitor the anesthetist’s activity.
The usage of RFIDs for tracking the surgical tools would be highly beneficial, bothfor inventory matters and for recognition of surgical activities. In other environments,such as in the house, interactions between persons and objects have proven useful foractivity recognition [Wyatt, 2005]. However, the integration of RFID tags within thesmall surgical instruments is still a technical issue. [Smith et al., 2005] proposes a gloveequipped with an RFID reader. It was tested on medical volunteers [Fishkin et al., 2004]but was reported to be intrusive. Practical solutions for tool recognition in endoscopy areat the moment video-based, by using autoclavable color markers attached to the instru-ments [Ko et al., 2007, Radrich, 2008].[Tahar et al., 2008] attempted to employ the tools
19

Related Work in Surgical Workflow Analysis
(a) Courtesy of [Bhatia et al., 2007]. (b) Courtesy of [Ko et al., 2007].
Figure 2.1: (a) Four-states HMM model for patient presence detection. (b) Decision rulesfor endoscopy holder control in cholecystectomy procedure.
in open surgery as current interruptors to detect their usage, but this approach has toomany contraints to become practicable. Several kinds of minimally invasive surgeries, e.g.imaged-guided neurosurgery, need the tools to be tracked. Tool presence is then directlyavailable from the guidance systems, such as VectorVision (Brainlab 1), in which tools aretracked optically using infrared reflectant markers placed at the tip of the instruments.
Physiological signals Physiological signals reflect the patient health state. They areused to detect anomalies, by the anesthetist in the OR, but also by portable monitors indaily life for patients at risk [Bar-Or et al., 2004]. Within regular and non-crucial surg-eries, they do not provide much contextual information, especially as they contain manyartifacts. An original use of these signals was made in [Xiao et al., 2005] to automati-cally detect when the patient entered and exited the OR. The detection was achievedby processing the pulse oximetry, electrocardiogram and temperature readings, but washowever very sensitive to signal artifacts. The aim was to provide a hospital-wide systemfor passively monitoring the status of the surgery rooms [Hu et al., 2006].
Videos In [Bhatia et al., 2007], four different OR states describing the surgery roomoccupancy with respect to the patient bed presence and occupation were recognized usingexternal video information. Hue histograms of the video images were classified by supportvector machines and then filtered temporally using a four-states hidden Markov model,illustrated in Figure 2.1(a).
2.2.2 Recognition in Endoscopy
Due to the simpler and more convenient access to surgical information that endoscopicsurgeries provide, especially in terms of signal acquisitions, they are the first kind of
1. http://www.brainlab.com
20

2.2 Surgical Activity Recognition
surgeries that are addressed for recognition in the surgical domain. Additionally, theexisting acceptance and knowledge by the surgeon of the many advanced tools requiredduring the procedure simplifies the introduction of new technical systems that would bebased on surgical steps recognition.
The robotic community has an increasing interest in the recognition of surgical steps,both for automation and development of context aware robotic assistants. Targetingthe development of a robotic scrub nurse that would automatically provide the correctendoscopic instrument to the surgeon, [Miyawaki et al., 2005] analyzed movements of thesurgeon and of the nurse during a surgery to design timed-automata that model thesurgeon’s activities, the scrub nurse’s activities and the surgical steps. The conception ofthe model was done by hand, based on recorded videos and on motion tracking obtainedfrom visual markers, which was time consuming. In this initial work, the suggestion was touse the resulting model in conjunction with parametric model checking methods to controlthe path planning of the robot. In further work [Yoshimitsu et al., 2007], they presenteda vision-based system using color markers recognizing when the surgeon is requesting alaparoscopic instrument. The robot handed in the instrument, but it only worked with atiny set of instruments provided in a predefined order. This recognition was not used incombination with the model.
In [Ko et al., 2007], a task model of cholecystectomy was designed for guidance of alaparoscopic robot which was controlling the camera pose. A viewing mode was assignedto each surgical stage and transition rules between the stages were defined manually basedon the active surgical tool detected using color markers. An excerpt of the rule systemis illustrated in Figure 2.1(b). It was clearly mentioned that a surgical step cannot bealways uniquely recognized from the current surgical tool. They could not distinguishthe ambiguity and they planned to address this problem in future work. An additionalissue to consider is that quite often different surgeons use the tools in different ways orfor different purposes than what these were originally intended for [Mehta et al., 2001].A learning-based approach, as we propose, has the potential to adapt to the specifictechnique of each surgeon.
In [Lo et al., 2003], the endoscopic video was used to classify four elementary tis-sue/instrument interactions, namely idle, retraction, cauterization and suturing. Cuesincluding shape, deformation and illumination information were used within a Bayesiannetwork to perform the video frame classification. In this work, the objective was to as-sess the surgical skills and results are provided on several sub-sequences of real surgeries.Two of the four interactions, idle and cauterization obtained low classification results.Within complete surgeries, classification rates obtained by using solely video informationare expected to be worse, due to the complex and cluttered scenes.
[James et al., 2007] addressed the recognition of one surgical step of a pig cholecys-tectomy: the clipping of the cystic duct. The surgeon’s focus was tracked by an eye-gazesystem and the endoscopic video was processed to detect the presence/absence of an in-strument inside a portion of the video. These two pieces of information were combinedand used with artificial neural networks to detect the step. The signals provided by theeye-gaze tracker are illustrated in Figure 2.2(a).
In [Speidel et al., 2008], an approach for surgical risk assessment was presented and
21

Related Work in Surgical Workflow Analysis
(a) Courtesy of [James et al., 2007]. (b) Courtesy of[Speidel et al., 2008].
Figure 2.2: (a) Eye gaze tracking signals during a porcine cholecystectomy. (b) Riskassessment in minimally invasive surgery. The system detects the proximity of the instru-ment with a risk structure.
tested in an experimental setup. The authors proposed to describe high-risk surgical taskswith a logic system that models interactions between anatomical objects and surgical toolsrecognized from the endoscopic video. An augmented reality system was used to visuallynotify the surgeon about detected risk situations by highlighting risk structures (see Figure2.2(b)).
As can be seen from these works, motivation for recognition of endoscopic activitiesis high. However, methods and signals are so far specific and totally dependent on thetargeted application and respective experimental setup.
2.2.3 Surgical Skills Evaluation
Interesting signals for the analysis of surgical gestures are the positions of tools or theforces applied to them. These can be obtained indirectly by using a tracking system ordirectly using a robot which can also provide the positioning information. Up to now, suchsignals have been seldom available during regular surgeries and have been mainly usedfor evaluating and comparing surgeons performing on a simulator. The need for objectivemethods assessing the surgical dexterity has indeed increased with the introduction ofminimally invasive surgeries [Darzi et al., 1999].
In [Cao et al., 1996], endoscopic gestures were video-taped and decomposed into el-ementary subtasks (called surgemes in [Lin et al., 2006]) to manually mark explicit dif-ferences in the movements performed by expert and novice surgeons. [Rosen et al., 2006]and [Megali et al., 2006] used force and torque or kinematic information from a simulatorto build hidden Markov models representing surgical dexterity. This allowed the defini-tion of metrics for evaluating surgeons. [Leong et al., 2007] assessed surgeons’ hand-eyescoordination by comparing the trajectories of surgical instruments recovered using a Po-laris tracking system (NDI 2). Two HMMs were built to model respectively the trajectoriesperformed by experts and by novices. These were then used to classify a new trajectory
2. http://www.ndigital.com
22

2.3 Formal Modeling of Surgical Workflows
into one of the two modeled skills classes. [Lin et al., 2006] acquired signals from a daVinci robot to classify surgeons’ skill levels on a suturing task. The approach used lineardiscriminant analysis and Bayesian classification. In [Sielhorst et al., 2005], a method wasproposed to qualitatively compare the performance of a trainee using a birth simulator tothe performance of an expert. Trajectories of tracked forceps were temporally synchro-nized using dynamic time warping and displayed simultaneously within an augmentedreality system.
The literature cited above focuses on particular gestures but not on complete surgeries.However, similar signals as the ones acquired and used by these authors could be employedfor surgical workflow recognition, especially in case of robotic surgery, where such signalsare easily available without additional setups.
2.3 Formal Modeling of Surgical Workflows
Tools to formally describe surgical processes are needed for the analysis, visualiza-tion and optimization of surgical workflows. There were a few attempts to automati-cally generate workflow models from process logs, based on approaches from businessprocess modeling [van der Aalst et al., 2003]. For instance [Maruster et al., 2001] at-tempted to derive a Petri-net from data describing hospital events. Another approachfrom [Blum et al., 2008b] based on HMMs will be presented in section 6.6.3. However,limitations arised from the lack of semantics present in the process logs. For this reasonmost approaches are based on expert knowledge.
[MacKenzie et al., 2001] proposed a hierarchical decomposition of the tasks oc-curring during a laparoscopic surgery. This was obtained manually based on adataset of recorded surgeries and helped in the understanding of tasks and interac-tions for optimizing the workflow. In [Jannin et al., 2001], a model based on UnifiedMarkup Language (UML) was proposed in order to understand and optimize the us-age of imaging modalities during a neurosurgical procedure. The model was illus-trated in Figure 2.3. Using a database of instances, this model was proven to beuseful for pre-operative planning [Jannin and Morandi, 2007]. [Neumuth et al., 2006a,Burgert et al., 2006, Neumuth et al., 2006c] presented ontologies and tools to describeand record surgeries in a formal manner. The work steps and interactions occurring insurgeries could be recorded manually by assistants using a software that helps generatingstandardized descriptions, which could in turn be used for an in-depth analysis of the work-flow. Different workflow visualization methods were proposed in [Neumuth et al., 2006b].An integration of such workflow descriptions within the DICOM standard was presented in[Burgert et al., 2007, Lemke, 2007]. For querying and analyzing recorded surgical work-flows, a data warehousing approach was proposed in [Neumuth et al., 2008]. Finally,[Qi et al., 2006] proposed to build the hospital information system on a workflow modelthat describes as a dependency graph the tasks that have to be accomplished by eachdepartment.
The broadest and most widespread formalization for surgical processes is the conceptof a Therapy Imaging and Model Management System [Lemke and Berliner, 2007], illus-trated in Figure 1.3 on page 8. It was proposed to extend the Picture Archiving and
23

Related Work in Surgical Workflow Analysis
Figure 2.3: UML class diagram representing a surgical ontology in image-guided neuro-surgery. Courtesy of [Jannin and Morandi, 2007].
Communication System (PACS) concept used in radiology for the needs of surgery. Atterm, it should model all surgical processes and objects, and contain a surgical workflowmodule.
While these modelings provide interesting descriptions of the workflow, a link to realsignals still needs to be made for the models to be used in recognition systems.
2.4 Thesis Positioning
Previous sections describe several recent directions that have been taken in the lit-erature for analyzing the surgical workflow. In this thesis, we investigate a new direc-tion, which is complementary to existing work. We namely address the problem of auto-matically recognizing and classifying the surgical phases during complete operations. In[Neumuth et al., 2006a, Jannin and Morandi, 2007], detailed modelings of surgical work-flow are proposed. These models are however not related to real surgical signals. There-fore, they cannot be used for recognition. As opposed to these approaches, we proposestatistical models which directly rely on existing surgical signals and which are designedfor off-line and on-line recognition. Since they require less manual supervision, our modelsdo contain less semantic information, though.The design of such a recognition system can be regarded as the development of a "Kernelfor Workflow and Knowledge+Decision Management" module within the TIMMS conceptintroduced in [Lemke and Berliner, 2007]. In [Lin et al., 2006], the recognition of surgicalgestures is addressed. The focus is however on surgical skills evaluation. For this reason,
24

2.4 Thesis Positioning
experiments are carried out in experimental setups featuring generic surgical tasks. In-stead, we focus on the recognition of phases during the complete surgery, for the purposeof designing context aware support systems. In parallel work, [James et al., 2007] addressrecognition in cholecystectomy. The approach is however designed to recognize only asingle phase. It also requires an eye-gaze system and results are so far only presented onpig surgeries. In contrary, within our cholecystectomy application, we use generic signalsand present results based on acquisitions of real surgeries.
Another objective in this thesis is to learn how to recognize surgical activities duringcomplete surgeries, based on labeled recordings of the targeted application. As can beseen from Section 2.1, HMMs are widely used for activity recognition in the computervision community, since they conveniently deal with time-series. In our applications, theconsidered activities are constrained by a workflow. Classification without consideringthe temporal contraints of the workflow is prone to errors due to ambiguities. For thisreason, we do not train HMMs for each activitiy separately, but train a global form ofHMM, in which the activities can be tracked using additional phase probability variables.This modeling directly copes with variations in duration, takes workflow constraints intoaccounts and does not require parameters for windowing on the data during on-line pro-cessing.
We demonstrate our methods on two novel and complementary applications, eachfeaturing a different level of coarseness in the recognized semantic information. In thecholecystectomy application, we recognize the endoscopic phases, based on tool usagesignals. This is the first work presenting an on-line approach and results of phase de-tection evaluated on real and complete surgeries. The second application consists in therecognition of the phases of a generic daily OR workflow. A multi-camera system is usedto observe the scene, motivated by the constraints of the complex and occluded surgicalenvironment. This is the first work proposing 4D features, not only for recognition insurgical workflow, but also for recognition in complex reconstructed scenes containingseveral objects and persons.
Within the following chapters, additional differences to closest work as well as furtherdiscussions on their complementarity to ours are presented in more details.
25

Related Work in Surgical Workflow Analysis
26

CHAPTER 3
Applications and Setups
Two main applications are addressed in this thesis: the cholecystectomy procedureand the daily OR workflow. This chapter describes the scenarios, as well as the signalacquisitions that we performed during real operations or in a mock-up OR.
Cholecystectomy is a common procedure, consisting in the removal of the gallbladder.In most of the cases, it is performed in a minimally invasive setup using laparoscopy.Even though the methods developed in this thesis can apply to other surgeries, eitherendoscopic or open, provided that signals such as tool usage are available, this procedurewas the main medical application targeted in this work. It was at the origin of much effortto acquire data in the OR during real procedures. It is indeed convenient for recordingssince it is frequent and safe, but also suitable for demonstration as it contains a complexworkflow.
Motivated by the future possibility of gathering rich and real-time reconstruction datafrom a multi-camera system under development at one of our partner hospital, we fur-ther investigated the usage of this data for recognition of the generic daily workflow inthe OR. In addition to the different kind of signals available, a major difference to thecholecystectomy application is that the scenario is coarser and contains alternative pathsof activities.
Our clinical partners for the two applications were respectively from Hospital Rechtsder Isar and from Hospital Grosshadern, both located in Munich.
3.1 Laparoscopic Cholecystectomy
3.1.1 Description
3.1.1.1 Clinical Indication
The gallbladder is an organ located in the upper-right part of the abdomen, underthe liver, as illustrated in Figure 3.1. It stores the bile produced by the liver and releases
27

Applications and Setups
Liver
Gallbladder
StomachT1 [5mm]
T2 [5mm] T3 [5mm]
T4 [5-11mm]
Figure 3.1: Abdominal anatomy (left) and trocar positioning (right).
it into the intestine to help the digestion process. Gallstone disease, also know as thebiliary calculus disease, is the most common biliary disorder. It is caused by hard stonesappearing in the gallbladder or in the bile duct. They are formed by chemicals from thebile when their proportions get unbalanced. They provoke no symptoms in most cases,but may also cause irritation or pain. In the latter case, the common medical indicationis the removal of the gallbladder, as humans can live normally without it.
3.1.1.2 Brief History
The first open cholecystectomy is attributed to the german surgeon Carl Langenbuchand took place in Berlin in 1882 [Morgenstern, 1992, Olsen, 2006]. The first laparoscopiccholecystectomies were performed approximately one century later, independently by Dr.Erich Muhe in 1985 in Germany and by Dr. Philippe Mouret in 1987 in France. Thesuccess of laparoscopic cholecystectomies generated an unprecedented research effort to-wards minimally invasive techniques that boosted the developments of endoscopic surgery[Riskin et al., 2006]. Due to its recognized benefits, in particular faster recovery time andless pain for the patient, laparoscopy is now the standard for cholecystectomy.
Most recent developments now permit the performance of cholecystectomy withoutleaving any scar on the patient, either by using single port access through the umbili-cus [Bucher et al., 2009], transluminal access [Jacques et al., 2007] using natural openingswith NOTES (natural orifice transluminal endoscopic surgery [Bucher et al., 2009]) or theprevious two techniques simultaneously [Zornig et al., 2008].
3.1.1.3 Procedure
The following paragraph describes the details of this procedure in non-medical terms.Different variations in this procedure exist depending on patient specificities and technicalpreferences of each medical school. Complete medical descriptions are e.g. available in[Feussner et al., 1991, Dubois, 1993].
Before the beginning of the procedure, the patient first gets prepared for full-anaesthesia. He is then positioned for surgery and connected to anaesthesia system for
28

3.1 Laparoscopic Cholecystectomy
monitoring of vital signs. In the same time, patient data are displayed on the computerinterface and surgical tools are prepared in a sterile zone. The endoscopic environment,including endoscopic tower, monitors, and electric coagulation and cutting devices areconnected and placed at their respective positions. The patient abdominal area is disin-fected and the surgery is ready to start, upon arrival of the surgeon.
In laparoscopic cholecystectomy, the endoscopic procedure is performed with four tro-cars which permit the introduction of the instruments inside the abdominal area. Theirexact positions depend on patient specificities and on surgeons’ preferences, but they areusually placed in a configuration shown in Figure 3.1. The procedure starts with a firstincision at the umbilicus navel and the introduction of a needle for inflation of the ab-dominal cavity with CO2. Then, the first trocar, of size 5mm, is introduced inside thisopening, and a first inspection of the abdomen is performed with the endoscope. Uponthis inspection, the other trocars with size 5mm or 10mm are placed and inserted, oneafter each other under endoscopic visualization.
At University Hospital Rechts der Isar, this endoscopic procedure is usually performedwith two assistants and one scrub nurse, in a setup called german position: the operatingsurgeon uses trocars 2 and 3, while trocar 1 is used by an assistant to hold the liver witha metal rod in order to reveal the gallbladder. Trocar 4 is used by a second assistantholding the endoscopic camera.
The next steps, which are also the most delicate, consist in the dissection, clipping andcutting of the bile duct and of the cystic artery. Using a grasper and a dissecting device,the two vessels are revealed by dissection of neighboring tissues. Then, a clipping deviceis introduced to ligate the two vessels by using two to three clips. The two vessels are cutand the gallbladder is ready to be separated from the liver. Its dissection is performedwith an electronic cutting tool that applies high-frequency currents to the tissues, incombination with an electronic coagulation device that stops bleedings. This part of theprocedure generates smoke that may slightly obscure the vision through the endoscopiccamera.
Finally, a retraction sac is introduced through the larger umbilical incision and thegallbladder inserted into the bag using graspers. After removal of the trocar, the sac isextracted. For it to pass through the hole, first the gallstones that caused the operationare removed from it one by one. This is followed by the drainage of irrigation fluids, afinal control phase of the abdominal area, the removal of all instruments and the suturingof the incisions.
An illustration of the main phases of the surgery, in pictures, is given in Figure 3.3 onpage 32.
3.1.1.4 Personnel
At the university Hospital Rechts der Isar, six persons are usually involved in theprocedure. The nurse and the scrub nurse first prepare the room and the surgical instru-ments. Once the patient arrives in the room, he gets prepared for surgery by the assistantsand the anesthetist. After the start of the procedure, the sterile zone is occupied by thesurgeon performing the surgery, the assistant holding and controlling the camera, a secondassistant retaining the liver with a liver rod and the scrub nurse preparing and passing
29

Applications and Setups
surgical tools to the surgeon. Additionally, a nurse is present outside the sterile zone totake care of missing items, schedules, phone calls and other needs. In the anesthesia area,an anesthetist monitors patient vital signs.
3.1.1.5 Relevance of the Procedure for Workflow Analysis
The cholecystectomy is a very convenient surgery for demonstration of workflow analy-sis methods. It is indeed a common and safe procedure, for which recordings can regularlytake place. In the study [Feussner et al., 1991] conducted at our partner hospital Rechtsder Isar, it is reported that less than 3% of 178 cases have required conversion to opensurgery due to complications. Additionally, the procedure is complex, in the sense that itrequires many different surgical instruments and also many surgical steps to be performed.This surgery is also widely used in the literature related to surgical workflow analysis, forinstance in [Miyawaki et al., 2005, James et al., 2007, Ko et al., 2007].
3.1.2 Representation
All signals providing information about the surgery room, the patient state, and thestaff actions are interesting for recognition during the surgery. Unfortunately, it is notpossible yet to obtain all of them simultaneously in a synchronized fashion. For recognitionof the phases occurring during cholecystectomy, we will show in the next chapters thatthe endoscopic tool usage provides enough information.
3.1.2.1 Tool Usage
The history and combination of used tools correlate with the underlying workflow inendoscopic surgeries. For this reason, we rely on tool usage to infer the actions performedby the surgeon.
We represent an endoscopic surgery of time length T by a multidimensional time-seriesO where Ot ∈ 0, 1K :
Ot,k = 1 if and only if signal k is active at time t.
The signals represent the instruments’ usage during the laparoscopic surgery and inour case the number of recorded instruments is K = 17. Signals obtained in one of thesurgeries we have recorded are displayed in figure 3.2. Here the signals from the operatingroom are binary and recorded at a temporal resolution of one second.
3.1.2.2 Other Signals of Interest
Within the surgery room, other surgical information could provide interesting signalsrelated to the workflow of the procedure. Signals from the anesthesia devices could forinstance be of interest, especially for the detection of anomalies. The material usageentered by the nurse into the hospital information system and the state of the operatingor room lights could provide further information about the progress of the surgery. Eventhough these values are very dependent on the surgical case, the amount of water used
30

3.1 Laparoscopic Cholecystectomy
0 sec 500 sec 1000 sec 1500 sec 2000 sec
Drainage TubeRetraction SacClipping DeviceLap. ScissorsSuction & Irrig.HF coagulation
Coagulation rodDissecting deviceGrasperLiver rodOpticsTrocar 1Trocar 2Trocar 3Trocar 4Umbilical port
1 2 3 4 5 6 7 8 9 10 11 12 13 14
Figure 3.2: Signals recorded from a surgery. The numbers on the top of the figure indicatethe different phases.
for irrigation, the quantity of liquid retrieved with the suction device and the amountof CO2 give also interesting clues about the evolution within the workflow. Any otheradditional signal, binary or not, could be included into the modeling with only littlefurther modification.
3.1.2.3 Phases
From the workflow described in section 3.1.1.3, together with our partner surgeon weselected fourteen generic phases displayed in table 3.1. Even though these phases canhave high variations in duration, they can be easily and reproducibly identified within thesurgery instances by an expert. They are semantically meaningful by representing each adifferent medical objective. These phases are the ones that will be used for segmentationand detection in Chapters 4 and 6. They are displayed next to their corresponding signalsin Figure 3.2 and visually illustrated in Figure 3.3 on page 32.
3.1.3 Data Acquisition
In this section, we first describe the data acquisitions performed at Hospital Rechtsder Isar. We then present ongoing work for the automation of the acquisition process.
3.1.3.1 Approach
The first recordings were performed using two to three camcorders. One recorderwas connected to the external output of the endoscopic tower to collect the endoscopicvideo. The second camrecorder was set up in the back of the room, in order to capturethe complete scene. In some cases, we used a third camrecorder to capture a zoomedview of the surgical theater. Synchronization was performed by using a stopwatch with
31

Applications and Setups
(1) CO2 Inflation
(2) Trocar Insertion
(3) Dissection Phase 1
(4) Clipping Cutting 1
(5) Dissection Phase 2
(6) Clipping Cutting 2
(7) Gallbladder Detaching (8) Liver Bed Coagulation 1
(9) Gallbladder Packaging
(10) External Retraction
(11) External Cleaning
(12) Liver Bed Coagulation 2
(13) Trocar Retraction
(14) Abdominal Suturing
Figure 3.3: Illustration of a laparoscopic cholecystectomy.32

3.1 Laparoscopic Cholecystectomy
Phase Name Duration
1 CO2 Inflation 188 (±93)2 Trocar Insertion 186 (±40)3 Dissection Phase 1 498 (±265)4 Clipping Cutting 1 110 (±47)5 Dissection Phase 2 110 (±146)6 Clipping Cutting 2 113 (±55)7 Gallbladder Detaching 550 (±383)8 Liver Bed Coagulation 1 207 (±129)9 Gallbladder Packaging 121 (±82)10 External Retraction 342 (±341)11 External Cleaning 104 (±120)12 Liver Bed Coagulation 2 181 (±62)13 Trocar Retraction 78 (±55)14 Abdominal Suturing 114 (±99)
Table 3.1: The fourteen cholecystectomy phases used in the recognition. The durationcolumn displays the mean and standard deviation of the phases durations, in seconds.These values were computed for the 16 surgeries that are used in our experiments. Theaverage total duration is 48.5 (±18.5) minutes.
100Hz temporal resolution viewed at the beginning and at the end of the recordings byall cameras.
In the last phase of the recordings, in a joined effort with Helmuth Radrich[Radrich, 2008], we used a more sophisticated setup providing four precisely synchro-nized videos. The first two videos provided endoscopic and room view, the two secondvideos acquired direct views of the operating theater, for stereo tracking of surgical tools[Radrich, 2008]. Pictures from the surgery rooms at hospital Rechts der Isar can be seenin Figure 3.4.
The surgeries that have been recorded were performed by four different surgeons from
Figure 3.4: External views of three different operating rooms from Hospital Rechts derIsar, Munich, where recordings have been performed.
33

Applications and Setups
(a) Trocar camera (b) Instrumentwith barcodes
Figure 3.5: Pictures from the trocar camera and from an instrument covered with bar-codes.
the same medical school. Additionally, we have attended several cholecystectomy pro-cedures carried out at another hospital (Klinikum Innenstadt, Munich), but could notperform regularly recordings there. Note that the phases were the same. However, in-struments were sometimes used in different ways. Such differences should be learnt bythe recognition system given that enough training data is available.
The instrument tool usage was obtained for the experiments presented in this workby manual labeling of the videos using a dedicated software. The next section presentsan effort for real-time acquisition of these signals.
3.1.3.2 Trocar Camera
Even though the technology exists, at the moment no practical, reliable and cost-effective solution exists for identification of endoscopic tools usage at each timestep. Sev-eral companies, including Karl Storz, have been considering the integration of RFIDsinside the tools, but they do not see enough market for it at the moment.
The trocar camera is a device investigated by the team of Prof. Feussner (Institutefor Minimally Invasive Therapy and Intervention, Hospital Rechts der Isar, Munich) thatshould permit the recognition of the tools inserted in a trocar. It should be used in thefuture for logistic and workflow monitoring purposes. It consists in components similar toa flexible endoscope, as can be seen in Figure 3.5(a). A flexible tube contains two opticcables: one for transmitting a light source, one for observation with a camera. The tubecan be connected to the side of the trocar for observation of the tools inserted into it. Itsdesign has to permit the usage in the sterile operating room conditions. An additionaladvantage is that no electric cables need to be brought in proximity of the patient.
The device was manufactured by the company PolyDiagnost 1. Tool recognition isperformed using barcode detection from the video image using a software that we devel-
1. http://www.polydiagnost.com
34

3.2 Surgery Monitoring with a Multi-camera System
oped in collaboration with the company MVTech 2. Issues arise from the poor contrastand the reduced field of view of the camera, which does not capture the complete trocararea, e.g. when a trocar of size 10mm is used. We proposed to solve this issue by usingshort barcodes of type 2/5 Interleave, which do not incorporate redundancy, but fit fullyinside the video image. The camera used is a Guppy F046B from Allied Vision Tech-nologies 3, which provides a framerate of 40fps. The instrument is covered with barcodesfor reliable detection, as shown in fig. 3.5(b). In a final setup, the barcodes would beprinted on the instruments by laser. Tests in a fully controlled environment resulted ina correct detection. In animal experiment conditions, the device has shown unstability,for technical reasons. A better fixation of the tube to the trocar is required, as well as afixed emplacement for the camera, so that the image stays stable. When this is improved,further animal experiments will be carried out to test the system in real conditions, wheree.g. blood can alter the view of the instruments.
3.2 Surgery Monitoring with a Multi-camera System
The second application addressed in this thesis is the recognition of coarse daily ORactivities. This is complementary to the phase recognition problem in endoscopy, sincehere the cholecystectomy procedure would consist in one of the phases. We investigatethe usage of multi-view reconstruction data provided by a permanent system that wouldcontinuously observe the OR.
3.2.1 Description
3.2.1.1 Motivation for a Multi-camera System
The monitoring of surgical processes occuring within a surgery room requires a sensingsystem that on the one hand does not impair the workflow, and on the other hand capturesenough information about the activities. For recognition at the scale of a surgery, toolusage can be used, as in previous section. For recognition of overall daily activities, signalsthat continuously observe the OR are required. Cameras are a natural choice, since theyare cheap, widespread, non-intrusive and can be easily installed on the ceiling. Theworkflow in the OR comprises multiple, precise and complex activities usually involvingthe interaction of several people and objects. As the crowded scene implies multipleocclusions, a set of cameras is required to keep an overview of the whole activities.
Originally, the installation of the multi-camera system was launched within a researchproject at the Chair for Computer Aided Medical Procedures of Prof. Navab to moni-tor a robotic C-arm, the Zeego robot developed by Siemens (illustrated in Figure 3.6).The objective was to prevent possible collisions between the system and the staff andobjects present in the room [Ladikos et al., 2008b]. This is a way to enforce safety re-quirements, but also to potentially permit faster movements of the robots, as requiredfor better imaging results and usage of less contrast product. The solution proposed by
2. http://www.mvtec.com
3. http://www.alliedvisiontec.de
35

Applications and Setups
Figure 3.6: Left) Zeego robot from Siemens. Right) Picture from the intervention roomat Klinikum Grosshadern, Munich, where the multi-camera system is installed.
[Ladikos et al., 2008b] is to compute the occupation of the room in real-time, generatinga reconstruction volume in which potential collisions between objects can be predictedand therefore avoided, as illustrated in Figure 3.7.
We investigate in this thesis a further application of the system, namely the usage ofthe reconstructed data for activity recognition. When observing the scene with a camera,colors on clothes and tissues are similar and multiple occlusions occur as the personnelprincipally work around a small area around the patient table. For these reasons, trackingand recognition of fine-grained human actions in this specific environment are extremelydifficult and furthermore, not absolutely necessary for phase recognition. We postulatethat a global model of the scene obtained by the reconstruction is sufficient for coarserecognition since the whole activity focus is on the patient. To capture the coherence ofthis activity, we use the real-time reconstruction algorithm. This choice guarantees thatthe system will not interfere with the normal behavior of the medical staff in the OR andpermits the usage of generic low-level features to characterize the phases.
The system at the hospital is currently under development. To prove the concept, weused data that we recorded with a replicate multi-camera system present in one of ourlaboratories.
3.2.1.2 System Setup
We describe here the multi-camera system used in our laboratory to perform therecordings. Further details are available in [Ladikos et al., 2008a]. The architecture ofthe system is depicted in fig. 3.8. It consists of one server and several clients. Locally,each client handles up to four cameras and performs a partial reconstruction. Partial re-constructions are then sent over the network to the server, which handles synchronization,global reconstruction and display. All cameras are fully calibrated and mounted on theceiling to surround the room. The system is currently able to handle 16 cameras with aframerate of 30fps, yielding a reconstruction volume of size 3.7× 3.2× 2.2 meters.
36

3.2 Surgery Monitoring with a Multi-camera System
Figure 3.7: External view of a potential collision between a screen and a C-arm. Courtesyof [Ladikos et al., 2008b].
Figure 3.8: Multi-camera reconstruction system layout, describing tasks accomplished bythe clients and server. Courtesy of [Ladikos et al., 2008b].
Calibration The calibration process is performed once for a fixed camera configuration.Following a method proposed by [Svoboda et al., 2005], a point light source is moved in-side the dimmed room to easily compute point correspondences between the temporallysynchronized cameras. This permits the computation of the intrinsic and extrinsic param-eters of each camera [Hartley and Zisserman, 2004]. Registration to the room coordinatesystem is obtained by using a fixed calibration pattern, located on the floor of the room.
Reconstruction For reconstruction, a visual hull approach in voxel representation[Laurentini, 1994, Szeliski, 1993] is used to meet real-time requirements. Segmen-tation of silhouettes is performed using a robust background subtraction algorithm[Fukui et al., 2006]. Reconstruction is then obtained by testing the occupancy of eachvoxel in the reconstruction volume. This is done by backprojecting the voxel position intothe segmented silhouette image, using a GPU implementation on each client computerfor fast computation.
37
Applications and Setups
3.2.2 Data Representation and Acquisition
3.2.2.1 Visual Hulls
For our work, we consider the input to be the reconstructed volumes delivered by theexisting real-time algorithm. Additional information, such as color would be of interest.Textured reconstruction was however not available in real-time, but if needed, the textureinformation could be introduced in the framework with few changes.
Let Ω ⊂ R3 be the spatial area that can be reconstructed by the system. The output of
the reconstruction at each time step is a 3D volume containing occupation probabilities.The probabilities are thresholded to obtain the effective visual hull. In a sequence oflength T , we denote the sequence of computed visual hulls by
r1:T, r(v) : Ω→ 0, 1, (3.1)
where v denotes the position of a voxel.Examples of visual hulls reconstructed by the system can be seen in Figures 3.7, 3.10
and 3.11.
3.2.2.2 Scenario and Acquisitions
Figure 3.9 displays the scenario and phases that we have defined for this application.The scenario incorporates the main activities that occur daily in a surgery room before andafter surgery and is complementary to the cholecystectomy scenario studied previously.We consider two kinds of surgeries: endoscopy and open surgery, both requiring differentsetups. The aim is to prove the concept of using reconstructed data for recognition, untildata from the hospital system becomes available. We recorded in a mock-up OR differentinstances of the workflow, performed by actors familiar with the OR. The phases of thisworkflow are illustrated in Figure 3.11 on page 40. The scene contained simultaneouslyup to three persons, three tables and a ceiling OR light.
A nine-camera system based on three clients was used in our experiments. As werecorded the videos from all cameras in addition to the reconstructed volumes, we useda frame-rate of 15fps to spare disk space. A higher framerate was not necessary for ourrecognition objectives. The reconstruction grid resolution is 128× 128× 128 with a voxelsize of about 2.8× 2.5× 1.7 cm3.
3.3 Conclusion
In this chapter, we have introduced the two applications considered for workflow anal-ysis in this thesis: the laparoscopic cholecystectomy and the daily OR workflow. Wehave presented the setups that are used for the recordings, as well as ongoing efforts toautomatically gather signals in the OR. We have also indicated the scenarios and theobservations that are going to be used as input data for recognition in the next part.
38

3.3 Conclusion
Anesthesycontrol (2)
Patiententers OR (1)
SurgeonPreparation (4)
OpenSurgery (7)
Patientleaves OR (9)
Cleaning(10)
Suturing(8)
Minimally-invasive
Surgery (6)
PatientPreparation (3)
Idle (0)
Emergency Preparation (5)
Idle (0)
Figure 3.9: Scenario describing the surgery workflow with its alternative paths. Phaselabels are given in parentheses.
Figure 3.10: External view and reconstruction of a fighting scene, with indication of thenine camera positions. The reconstruction is viewed from the direction opposite to thecamera view shown on the left.
39

Applications and Setups
(1) Patient enters OR
(3) Patient Preparation
(4) Surgeon Preparation
(6) Minimally invasive Surgery
(8) Suturing
(9) Patient leaves OR
(10) Cleaning
(1) Patient enters OR
(3) Patient Preparation
(4) Surgeon Preparation
(7) Open Surgery
(8) Suturing
(9) Patient leaves OR
(10) Cleaning
Figure 3.11: Illustration of the daily OR scenario for two workflow instances on a bavarianpatient. Images from one view and associated 3D real-time reconstructions. Left) Aminimally-invasive surgery. Right) An open-surgery.
40

Part II
Methods for Monitoring in the
Surgery Room
In Chapter 4, we present off-line methods based on dynamic time warping synchronizationfor segmentation of the surgical phases in a sequential workflow. We compare the methodsand show results for the cholecystectomy application. In order to perform on-line phaserecognition, and also to cope with non-sequential workflows, we later use a differentmodeling based on hidden Markov models. An introduction to hidden Markov models isgiven in Chapter 5. The on-line recognition methods are presented in Chapter 6 and firstdemonstrated on the cholecystectomy application. The daily OR workflow application isaddressed in Chapter 7. Computation of 4D features is described as well as the adaptionof the method to a workflow containing alternative paths.
41


CHAPTER 4
Synchronization and Segmentation of Endoscopic Surgeries
In this chapter, we present several off-line approaches for synchronizing endoscopicsurgeries and for segmenting their phases. The instruments used during a phase varyand the presence of a particular instrument is generally not sufficient to characterize thephase. The temporal sequence of actions plays indeed a decisive role. For this reason, theproposed approaches use a temporal model of the surgery. They are based on extensionsof the dynamic time warping (DTW) algorithm and permit several applications such asthe simultaneous visual replay of surgeries and the drafting of surgical reports. We firstpresent the DTW algorithm in section 4.2.1 and describe related work. Synchronizationbetween surgeries for the creation of an virtual surgery representation is presented in sec-tion 4.2.3. In section 4.3, this representation is used to construct an annotated virtualsurgery representation, which is further employed for segmentation. Three constructionapproaches are presented, which are based on a different usage of supervised information.In section 4.3.4, an adaptive weighting method for DTW based on AdaBoost is proposed.This allows identification of the discriminative instruments and results in improved seg-mentation.
4.1 Objectives
In the following, we denote surgeries by the time-series O of their observations, asdefined in section 3.1.2.1.
4.1.1 Synchronization
A first objective is to synchronize several surgeries. Synchronization can for instance beused to display surgeries simultaneously in a visually meaningful manner. Given l surgeriesO
1, . . . ,Ol of length T 1, . . . , T l, this implies the computation of a common timeline T =
43

Synchronization and Segmentation of Endoscopic Surgeries
0 500 1000 1500 2000 2500 3000 3500 4000 4500 5000time (sec)
sign
als
OP1OP2
OP3
Figure 4.1: Overlaid signals from three surgeries, showing the signal variations and needfor non-linear time warping. Only a subset of the signals is represented for better visual-ization.
1, . . . , T of length T , and of synchronization functions indicating the mapping betweenthe timeline and each surgery O
i:
synci : T → 1, . . . , T i . (4.1)
Surgical gestures are unique, depending on patient and surgeon. For this reason, thesame surgical task can be performed differently in different cases, even when the samesurgeon is performing. For instance, clipping of a vessel can be done using from one upto three clips. This implies that there exists no ground truth synchronization betweendifferent surgeries and that "good" synchronizations are not unique. A synchronizationcan be evaluated subjectively at the semantical level, by verifying that certain kinds ofsemantic information about the surgeries match at each time step of the reference time-line, in all surgeries. Semantic information that we consider here are the surgical phases.Synchronization at the lower level, even though not unique, can for instance provide anice and smooth visualization. It is visually much better than a simple scaling betweenvalidated synchronization points. Figure 4.1 shows several signals from three surgeriessimultaneously to illustrate the need for non-linear synchronization between the surgeries.
4.1.2 Segmentation
A second objective is the accurate identification of the surgical phases of a new surgeryO of length T , based on the knowledge of previously acquired surgeries O
1, . . . ,Ol. If weassign to each phase a label p ∈ L , this involves the computation of a labeling function
44
4.2 Dynamic Time Warping Averaging
PO : 1, . . . , T → L . (4.2)
An example of labels for cholecystectomy phases is indicated in Table 3.1 on page 33.
4.2 Dynamic Time Warping Averaging
In this section, we present a method to construct the multi-dimensional signals repre-senting a virtual surgery. The surgeries in the training set are all synchronized using thedynamic time warping algorithm. This is then employed to generate a virtual surgery ona virtual timeline, preserving the average length of the surgeries and of the actions. Thisvirtual surgery can be used for off-line synchronization and segmentation of new surg-eries. It can also be used for an efficient generation of the hidden Markov models. Thepresentation addresses complete surgeries. But the method can also be applied directlyto only subparts of surgeries, such as single phases (see Section 4.3.1.2).
4.2.1 Dynamic Time Warping
The dynamic time warping (DTW) algorithm [Sakoe and Chiba, 1978] is both a time-invariant similarity measure and a method to synchronize two time series by finding anon-linear warping path. It warps each point in one time series onto at least one pointin the other time series while respecting the temporal order. This is done in a way thatminimizes the sum of the distances between all points that are warped onto each other.
Formally, let u = (u1, . . . , uTu) and v = (v1, . . . , vT v) be two time-series of length T u
and T v, and d(·, ·) be a distance. The algorithm uses dynamic programming to find thediscrete timeline 1, . . . , T and temporal warping path syncu↔v = (tu, tv) with
tu : 1, . . . , T → 1, . . . , T u (4.3)
tv : 1, . . . , T → 1, . . . , T v (4.4)
minimizingT
∑
t=1
d(utu(t), vtv(t)) (4.5)
under the warping constraints:
boundary®
(tu(1), tv(1)) = (1, 1)(tu(T ), tv(T )) = (T u, T v)
(4.6)
continuity®
|tu(t+ 1)− tu(t)| ≤ 1|tv(t+ 1)− tv(t)| ≤ 1 .
(4.7)
Different warping functions can be obtained by using variations of the continuityconstraints [Sakoe and Chiba, 1978]. The optimal solution is found using dynamic pro-gramming in O(T u × T v). A distance matrix D is computed according to the following
45

Synchronization and Segmentation of Endoscopic Surgeries
recursive formula
Di,j = d(ui, vj) +min(Di−1,j−1, Di−1,j, Di,j−1) . (4.8)
Backtracking the optimal path provides the warping, as illustrated in Figure 4.2. Thetimeline 1, . . . , T corresponds to a discretization of the optimal path through the valley.
4.2.2 Related Work on Dynamic Time Warping
The DTW algorithm originates from the speech recognition community [Juang, 1984,Sakoe and Chiba, 1978, Yaniv and Burshtein, 2003] where it was extensively used tomodel spoken words. It was further used in many different research areas to syn-chronize application-dependent time-series. It is for instance used in computer vi-sion for the modeling of actions [Darrell et al., 1996], in chemistry for the synchro-nization of batch processes [Kassidas et al., 1998] or for the mining of large databases[Keogh and Ratanamahatana, 2005].
Our purpose is to use DTW for the modeling of surgeries represented by binary signals.For a medical application, a DTW synchronization approach was proposed in our groupby [Sielhorst et al., 2005]. The movements performed by a trainee and an expert surgeonon a birth simulator were recorded with a tracking system. DTW permitted to replayand compare synchronously on an augmented reality display the superimposed movementsperformed by the two surgeons. An initial work to synchronize six endoscopic surgerieswas proposed in [Ahmadi et al., 2006]. A surgical model was created using DTW andmanually labeled to segment a new surgery. Our approach extends this work by improvingthe virtual model creation, by proposing a convenient framework for dealing with phaselabeling information, and also by presenting cross-validated results on a larger dataset.
4.2.3 Averaging
The construction of a virtual representation is based on a curve averaging method by[Wang and Gasser, 1997]. In the following, we adapt the presentation to the discrete casethat is considered in this chapter. Let the l surgeries O
1, . . . ,Ol be of length T 1, . . . , T l
and Oref of length T ref be a surgery taken as reference.
The DTW algorithm with euclidean distance is first used to synchronize the referenceOref to each training surgery O
i, yielding for i ∈ 1, . . . , l the synchronization functions
syncref↔i(y) = (tref (y), ti(y)) . (4.9)
These functions give discrete correspondences between the timelines of the reference (tref )and of the surgeries (ti).The virtual timeline is computed from the reference as the function avgtime(t):
1, . . . , T ref → [1, T ]
t → 1l
l∑
i=1
1#y: tref (y)=t
∑
y: tref (y)=tti(y) ,
(4.10)
46

4.2 Dynamic Time Warping Averaging
Figure 4.2: DTW distance matrix. The path drawn through the valley displays theoptimal synchronization between time series u and v.
where #· denotes the cardinality operator. The function avgtime takes real values, ismonotonically increasing between 0 and T = 1
l
∑li Ti and can therefore be inverted.
It is used to compute the virtual surgery representation O on the discrete timeline1, . . . , ⌊T ⌋ using linear interpolation and averaging over all surgeries. Let ta and tbbe the closest values in the range of avgtime around the integer t with t ∈ [ta, tb]. NotingIa = y : tref (y) = avg−1
time(ta) and Ib = y : tref (y) = avg−1time(tb), we then define
Ot =1
l
l∑
i=1
(t− ta)
(tb − ta)
1
#Ia
∑
y∈IaOiti(y)
+(tb − t)
(tb − ta)
1
#Ib
∑
y∈IbOiti(y). (4.11)
The virtual surgery O has a timeline whose length is the average time between all trainingsurgeries. Its signals Ot can be interpreted as the probability of instrument usage atvirtual time t. Provided an action was correctly synchronized between all surgeries, itthen appears with its average length within O.
Similarly to [Wang and Gasser, 1997], we use three steps for our virtual surgery com-putation:
1. Compute initial surgery reference
2. Compute first virtual surgery representation
3. Iterate computation using previous virtual surgery representation as reference
There are various ways to choose the initial reference. It could simply be one ofthe training surgeries. Experiments have shown the following approach to yield the bestresults. The reference is computed recursively by averaging pairwise the surgeries usingthe approach described above. In order to average the representation of two surgeriesOi and O
j, we introduce a special surgery as the reference, which we will refer to as theexhaustive surgery. This is useful in order to avoid that an activity from one surgery isreduced to zero time-span if it is synchronized to a reference in which this activity did notoccur. Consequently, the exhaustive model preserves all information from both surgeriesby merely taking the raw result of their DTW synchronization, which has the same length
47

Synchronization and Segmentation of Endoscopic Surgeries
Drainage TubeRetraction SacClipping DeviceLap. ScissorsSuction & Irrig.HF coagulation
Coagulation rodDissecting deviceGrasperLiver rodOpticsTrocar 1Trocar 2Trocar 3Trocar 4Umbilical port
HF cuting
Figure 4.3: Signals of a virtual surgery representation.
as the size of the output range, namely synci↔j(y) = (ti(y), tj(y)):
Oref_exhausty =
Oiti(y)
+ Ojtj(y)
2. (4.12)
Using this reference prevents the complete disappearance of actions that might not occurin one surgery. Moreover, when the virtual timeline is computed, Formula 4.10 ensuresthat the virtual surgery keeps the average length of training surgeries.An example of resulting virtual representation O is shown in figure 4.3.
A straightforward extension to the virtual surgery representation is the notion of surgi-cal similarity, which can be given for each observation vector in the virtual representation.Let us define
SIMt =1
K
K∑
k=1
max(Ot,k, 1−Ot,k) , (4.13)
where K is the size of the observation vectors. When SIMt is close to 1, it means that areliable synchronization point between all surgeries was found. More intuitively, it meansthat the surgical activity for this time point was unambiguous across all training surgeries.In contrary, a value close to 0.5 implies ambiguity. This will be used later to efficientlyconstruct HMMs models.
4.3 Segmentation
For segmentation purposes, we present a formalization that combines both the result-ing virtual surgery representation and the labeling information. We define an annotatedvirtual surgery representation (AVSR) as a pair
Γ = (O, ξ) , (4.14)
whereξt : 1, . . . , |L| → [0, 1] (4.15)
48

4.3 Segmentation
refer to a model annotation with phase probabilities. ξt(p) is the probability of being inphase p ∈ L at virtual timestamp t from the virtual representation O.
The results of segmentation depend on how the AVSR is constructed. The methodspresented below differ by the required amount of labeled data and by the steps in theconstruction process where the labels are used.
4.3.1 Different Approaches for Model Construction
4.3.1.1 Manual Annotation
A virtual surgery representation O is first computed out of all training surgeriesO
1, . . . ,Ol. An annotation ξt ∈ 0, 1 is then determined manually by looking at thesignals on the virtual timeline. This possibility was initially used in [Ahmadi et al., 2006].However, even though the virtual representation visually resembles a surgery, cues thatpermit a precise annotation within the recorded surgeries are not so precise within thevirtual surgery. Manual annotation has also the major drawback that it has to be per-formed each time a new surgery is included, or for each test in cross-validation experi-ments. Additionally, backprojecting the labels from the virtual representation onto theinitial surgeries it was generated from showed poor synchronization at the label bound-aries. The two methods below perform the model annotation more accurately and in anautomatic fashion.
4.3.1.2 Pre-annotation
We refer by the term pre-annotation to the fact that labeling information is usedprior to the construction of the virtual representation. This is a fully supervised frame-work, in which the DTW averaging approach is applied phase-wise. The virtual surgeryrepresentation is then constructed by the concatenation of virtual phase representationscomputed out of all training surgeries O
1, . . . ,Ol. All training surgeries are labeled sothat the phases are identified.
Let Pip be the phase from surgery O
i corresponding to label p ∈ L. The virtual phasePp is constructed following the averaging framework described in Section 4.2.3, by usingas input the l subsequences P
1p, . . . ,P
lp.
The resulting virtual surgery representation O is the concatenation of the virtualphase representations P1, . . . ,P|L|. For each time t on the resulting virtual timeline, theannotation ξt assigns the probability 1 to the phase p, given that the virtual time toriginally stemmed from the virtual phase representation p before concatenation. To theother phases, the probability 0 is assigned.
4.3.1.3 Post-annotation
A virtual surgery representation O is first computed out of all training surgeries asin Section 4.2.3. No surgery labeling information is required for this step. The anno-tation ξt is obtained by synchronizing the virtual representation to the training surg-eries O
1, . . . ,Ol that contain labeling information. For these surgeries, labeling functions
49

Synchronization and Segmentation of Endoscopic Surgeries
POi : 1, . . . , T i → L are available. The synchronization performed using DTW yields lfunctions
syncO↔Oi
(y) = (tavg(y), ti(y)) . (4.16)
The annotation is then determined from the labeling of these surgeries:
ξt(p) ∝∑
y: tavg(y)=t
l∑
i=1
δ (POi(ti(y)), p) (4.17)
with
δ(x, y) =®
1 if x = y0 if x 6= y .
(4.18)
For each virtual timestep t, ξt(·) is normalized to one.
4.3.2 Off-line Segmentation
Off-line segmentation is the process of segmenting a new surgery after the acquisitionof all signals O
testt,k . The objective is to compute the phase POtest(t) at each time step t while
knowing the complete signals Otest1 . . .O
testT test , where T test denotes the end of the surgery. If
an annotated virtual surgery representation Γ = (O, ξ) is available from training data, theprocess is the following: the time-series O
test is synchronized to the virtual representationO using DTW. This gives a synchronization function
syncOtest↔O
(y) = (ttest(y), tavg(y)).
The labels from the annotated virtual representation are then carried over to the newsurgery for each time t. Since it is possible that the time t is synchronized to differentconsecutive times of the virtual representation annotated with different most likely phases,the overall most likely annotation is used:
POtest(t) = argmaxp
∑
y: ttest(y)=tξtavg(y)(p) . (4.19)
4.3.3 Evaluation
Segmentation is evaluated by comparison to a ground truth labeling. We presentbelow evaluation measures and the obtained results.
4.3.3.1 Measures
We first use accuracy as general evaluation measure. It indicates the percentage ofcorrect detections in the complete surgery, compared to ground truth information. Assizes between phases can vary largely, wrong detections inside short phases tend to behidden within the accuracy. For this reason, we also use two measures defined per phase.Recall is the number of true positives divided by the total number of positives for thephase in the ground truth. In other words, recall is the percentage of correct detectionsinside each phase.
50

4.3 Segmentation
Precision is the sum of true positives divided by the number of true and false positives.This is complementary to recall be indicating whether parts of other phases are detectedincorrectly as the considered phase.
In order to present summarized results, we will use accuracy together with average
recall and average precision, corresponding to recall and precision averaged over allphases.
4.3.3.2 Results
We have evaluated the methods on data of 16 cholecystectomies performed by 4 dif-ferent surgeons, using the acquisitions detailed in Chapter 3. For statistical relevance,the results are computed with cross-validation using the leave-one-out approach: for eachof the 16 surgeries, the training set contains the remaining 15 ones. Displayed values arethe mean results with standard deviations over all surgeries.
Comparison of the two evaluated construction approaches, pre-annotation (Section4.3.1.2) and post-annotation (Section 4.3.1.3) is provided in Table 4.1. Both methodsyield a very good segmentation with measures above 94%. The pre-annotation method,which fully relies on supervised construction, has the best values and has also a slightlylower variance. Interestingly, only a few labeled surgeries are required to obtain suchresults with the post-annotation method. This can be observed in Figure 4.4 showing allmeasures as function of the number of labeled surgeries used for annotation. During thisexperiment, tests are averaged on randomly selected subsets of varying size. The figuresuggests that labeling only forty percent of the available surgeries is sufficient to obtaingood segmentation results for this dataset.
The detailed results per phase, using the pre-annotation method are displayed in Table4.2. All phases have measures above 90%. Lowest rates principally come from shortphases. This can be seen from the average relative length of each phase with respectto the complete surgeries. It indeed occurs that some short phases become extremelyshort in some surgeries. For instance, the second dissection phase has an average lengthof 1 minute and 49 seconds. In a few surgeries, its duration is below 15 seconds, whichcauses higher relative errors. Due to the variations of phase lengths, relative errors aremore indicative of the goodness of the segmentation than absolute errors in minutes. Inpractice, they however hide the temporal effect on the application timeline.
Figure 4.5 displays in absolute time the average length of each phase and the meanerror per phase, corresponding to the duration in minutes of incorrect detections perphase. These errors were obtained for the pre-annotation method. The maximum meanerror per phase occurs for phase 8 (liver bed coagulation 1) and is of 9 seconds. Theaverage length among all surgeries is 48 minutes.
4.3.4 Adaptive DTW
In [Ahmadi et al., 2006], a method has been proposed to weight signals iterativelyduring the virtual surgery construction. Signals that are correctly synchronized to thevirtual surgery get iteratively a higher weight. An issue with this approach, as reportedin [Ahmadi, 2005], is that instruments which should intuitively get higher weights, such
51

Synchronization and Segmentation of Endoscopic Surgeries
Accuracy (%) Average Recall (%) Average Precision (%)
AVSR (pre) 97.3 (±6.6) 97.6 (±5.6) 97.0 (±5.7)AVSR (post) 95.1 (±6.6) 95.5 (±6.0) 94.0 (±6.2)
Table 4.1: Leave-one-out cross-validation on 16 surgeries performed by 4 surgeons. Globalmeasures with mean and standard deviation over all surgeries. (pre) indicates pre-annotation, (post) construction with post-annotation.
10 20 30 40 50 60 70 80 90 10091
92
93
94
95
96
97
% annotated training surgeries
mea
sure
s (%
)
success
recall
precision
Figure 4.4: Accuracy (rate of success), average recall and average precision for AVSR withpost-annotation. Influence of number of annotated surgeries. The horizontal lines referto the best result for each curve, obtained when all training surgeries are labeled.
52

4.3 Segmentation
Phase Label Rel. Len. (%) Recall (%) Precision (%)
1 CO2 Inflation 6.5 (±3.2) 100.0 (± 0.0) 100.0 (± 0.0)2 Trocar Insertion 6.4 (±1.4) 100.0 (± 0.0) 99.3 (± 1.8)3 Dissection Phase 1 17.1 (±9.1) 99.9 (± 0.4) 100.0 (± 0.0)4 Clipping Cutting 1 3.8 (±1.6) 100.0 (± 0.0) 96.6 (± 13.2)5 Dissection Phase 2 3.7 (±5.0) 93.8 (± 24.2) 92.8 (± 24.3)6 Clipping Cutting 2 3.9 (±1.9) 92.8 (± 24.3) 90.9 (± 25.9)7 Gallbladder Detaching 18.9 (±13.1) 95.1 (± 17.6) 93.5 (± 21.2)8 Liver Bed Coagulation 1 7.1 (±4.4) 90.8 (± 20.5) 100.0 (± 0.0)9 Gallbladder Packaging 4.1 (±2.8) 99.6 (± 1.6) 97.4 (± 5.2)10 External Retraction 11.7 (±11.7) 96.7 (± 12.8) 99.5 (± 1.6)11 External Cleaning 3.6 (±4.1) 95.8 (± 12.2) 94.5 (± 21.2)12 Liver Bed Coagulation 2 6.2 (±2.1) 99.6 (± 1.0) 98.5 (± 5.3)13 Trocar Retraction 2.6 (±1.9) 99.5 (± 1.3) 98.9 (± 4.2)14 Abdominal Suturing 3.9 (±3.4) 100.0 (± 0.0) 93.5 (± 19.5)
Table 4.2: Detailed results per phase for the pre-annotation approach, with mean andstandard deviation over all surgeries. The third column (Rel. Len.) indicates the averagerelative length of each phase with its standard deviation.
as the dissecting device, effectively get lower weights than instruments deemed less infor-mative, such as a trocar. This comes from the fact that instruments whose state almostdoes not change have much higher chances to be well synchronized, and therefore toget a higher weight. An instrument which is unused and also does not change state atall, receives an infinite weight with this procedure. All other instruments which do pro-vide the contextual information will be ignored. For instance, instruments that are usedfrequently during a phase have less chances to be correctly synchronized for each use,especially as the number of uses can vary highly within different surgeries. However, suchan instrument brings interesting discriminative information for the phase it is used in.
This discussion suggests that to compute a signal weighting, the signals’ potentialto discriminate between the different phases has to be evaluated, instead of the signals’potential to be well synchronized to the virtual surgery. We propose a discriminativeweighting approach based on weights per phase [Padoy et al., 2007a].
The idea is to apply the DTW algorithm with an adaptive distance measure. Themeasure is defined from the discriminative power of each instrument with respectto the current surgical phase, estimated by AdaBoost [Freund and Schapire, 1995] us-ing the labeled training surgeries. AdaBoost has been widely used for feature selec-tion [Viola and Jones, 2004] and provides a natural way for feature weighting.
This information is then included within the DTW averaging process to create thevirtual surgery representation out of labeled training surgeries. To synchronize an unseg-mented surgery to the model, an adaptive version of DTW, called ADTW, is used. Asabove, labels from the virtual model can be carried over to an unsegmented surgery usingthis synchronization.
53
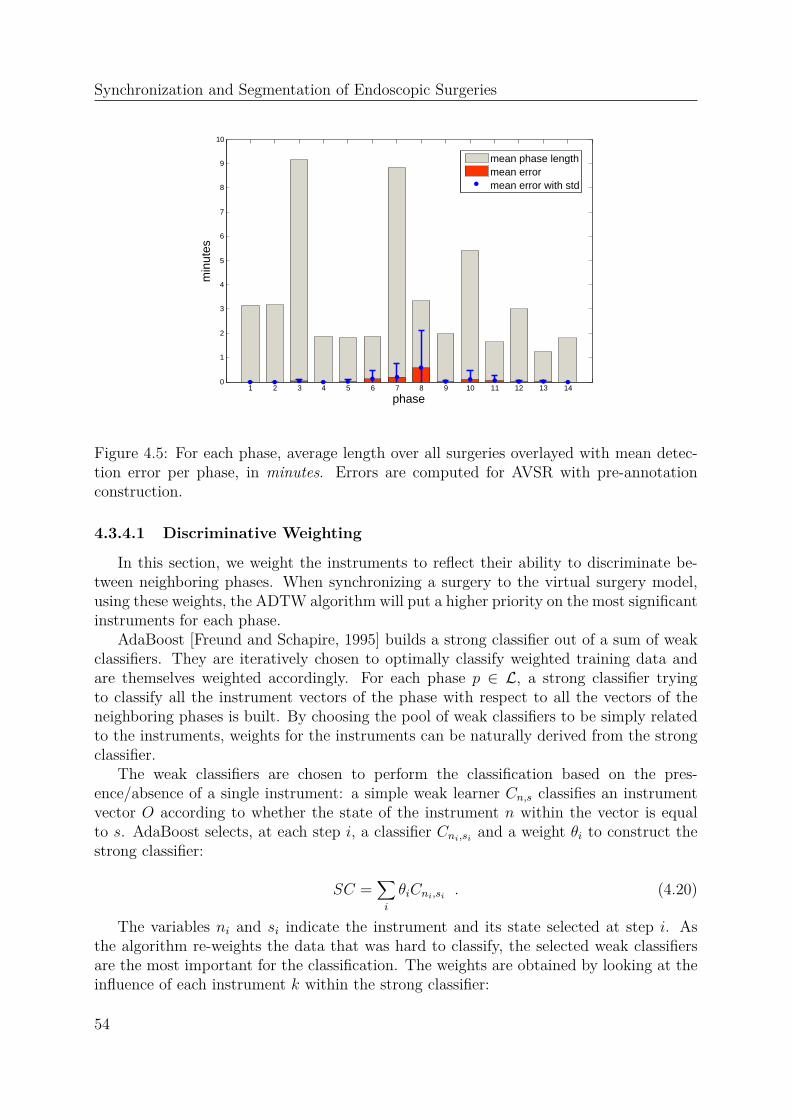
Synchronization and Segmentation of Endoscopic Surgeries
1 2 3 4 5 6 7 8 9 10 11 12 13 140
1
2
3
4
5
6
7
8
9
10
phase
min
utes
mean phase lengthmean errormean error with std
Figure 4.5: For each phase, average length over all surgeries overlayed with mean detec-tion error per phase, in minutes. Errors are computed for AVSR with pre-annotationconstruction.
4.3.4.1 Discriminative Weighting
In this section, we weight the instruments to reflect their ability to discriminate be-tween neighboring phases. When synchronizing a surgery to the virtual surgery model,using these weights, the ADTW algorithm will put a higher priority on the most significantinstruments for each phase.
AdaBoost [Freund and Schapire, 1995] builds a strong classifier out of a sum of weakclassifiers. They are iteratively chosen to optimally classify weighted training data andare themselves weighted accordingly. For each phase p ∈ L, a strong classifier tryingto classify all the instrument vectors of the phase with respect to all the vectors of theneighboring phases is built. By choosing the pool of weak classifiers to be simply relatedto the instruments, weights for the instruments can be naturally derived from the strongclassifier.
The weak classifiers are chosen to perform the classification based on the pres-ence/absence of a single instrument: a simple weak learner Cn,s classifies an instrumentvector O according to whether the state of the instrument n within the vector is equalto s. AdaBoost selects, at each step i, a classifier Cni,si and a weight θi to construct thestrong classifier:
SC =∑
i
θiCni,si . (4.20)
The variables ni and si indicate the instrument and its state selected at step i. Asthe algorithm re-weights the data that was hard to classify, the selected weak classifiersare the most important for the classification. The weights are obtained by looking at theinfluence of each instrument k within the strong classifier:
54

4.3 Segmentation
Weights within first Dissection Phase
Instruments2 4 6 8 10 12 14 16
0,05
0,1
0,15
0,2
0,25
Weights within first Liver Bed Coagulation Phase
Instruments
2 4 6 8 10 12 14 16
0,05
0,1
0,15
0,2
0,25
Optics
Liver Rod
Clipping Device
Grasper
Lap. Scissors
Dissecting PE
Coag. Rod
Trocar 3
Trocar 1Coag. Rod
Clipping Device
Figure 4.6: Instrument weights computed for the first dissection phase (phase 3) and thefirst liver bed coagulation phase (phase 12)
w(p)k =
∣
∣
∣
∣
∣
∣
∑
ni=k,si=1
θi −∑
ni=k,si=0
θi
∣
∣
∣
∣
∣
∣
. (4.21)
They are then normalized to one. As they are computed for each phase, this leadsto weights w(p)
k , for all phase p ∈ L and instrument k. Depending on the phase, theconvergence of AdaBoost requires a few to several dozens of steps. As some phases arevery short, better results are obtained by classifying the phases with respect to the twoprevious and the two next phases. Fig. 4.6 displays the computed weights for two phases.In the first dissection phase (see section 3.1.2.3), the most significant three instruments arefound to be the grasper, which has to be present, and the clipping device and laparoscopicscissors, which have to be absent. In the first liver bed coagulation phase, they are trocars1 and 3 as well as the liver rod, which all have to be in use.
4.3.4.2 Segmentation with ADTW
An annotated virtual surgery representation is first computed using the pre-annotationapproach, with the difference that for each virtual phase Pp, DTW is used with theweighted distance dp corresponding to the phase p:
dp(O1, O2) =
Ã
K∑
k=1
w(p)k (O1,k −O2,k)2 , (4.22)
where O1 and O2 are two observation vectors. We call the extension of DTW by using aphase-dependent distance dp Adaptive DTW (ADTW).
55

Synchronization and Segmentation of Endoscopic Surgeries
For segmentation, an unsegmented surgery is warped with ADTW onto the anno-tated virtual surgery representation. As in section 4.3.2, this allows carrying over theannotation.
4.3.4.3 Evaluation
The approach was used to determine the most significant instruments in a phase, asshown in Figure 4.6. Additionally, segmentation results using ADTW compared to theprevious DTW approaches are presented in Table 4.3. The three success measures arehigher and standard deviations much lower. Interestingly, all phases were detected forall surgeries during the cross-validation, while for the pre-annotation approach, for onesurgery a few very short phases were not detected.
Accuracy (%) Average Recall (%) Average Precision (%)
AVSR (pre) 97.3 (±6.6) 97.6 (±5.6) 97.0 (±5.7)AVSR (post) 95.1 (±6.6) 95.5 (±6.0) 94.0 (±6.2)AVSR (adap) 98.5 (±3.9) 99.2 (±1.5) 99.2 (±1.2)
Table 4.3: Leave-one-out cross-validation on 16 surgeries performed by 4 surgeons. Globalmeasures with mean and standard deviation over all surgeries. (pre) indicates pre-annotation, (post) construction with post-annotation, (adap) construction with ADTW.
4.4 Applications
4.4.1 Synchronous Visual Replay
Using the virtual representation computed with the method presented in section 4.2.3,a synchronization between the surgeries is available. To replay simultaneously severalsurgeries (see Figure 4.7), the surgeries are played based on the virtual timeline, using theirrespective time warping functions. When only two surgeries need to be simultaneouslydisplayed, it is visually more accurate to use the global virtual representation built fromall available surgeries than to use a DTW synchronization between these two surgeriesonly.
4.4.2 Training
The presented methods are also very interesting for training purposes. Indeed, theycould provide quantitative results on the performance of a training surgeon throughout thesurgery, which is possible and relevant when the model has been built from data recordedfrom expert surgeons. Additionally, synchronizing two surgeries to the virtual surgeryrepresentation provides an accurate synchronization between them. This can be used forevaluation and comparison through video-replay, e.g. by synchronously visualizing twosurgeries of the same kind, performed by a trainee and by an expert surgeon.
56
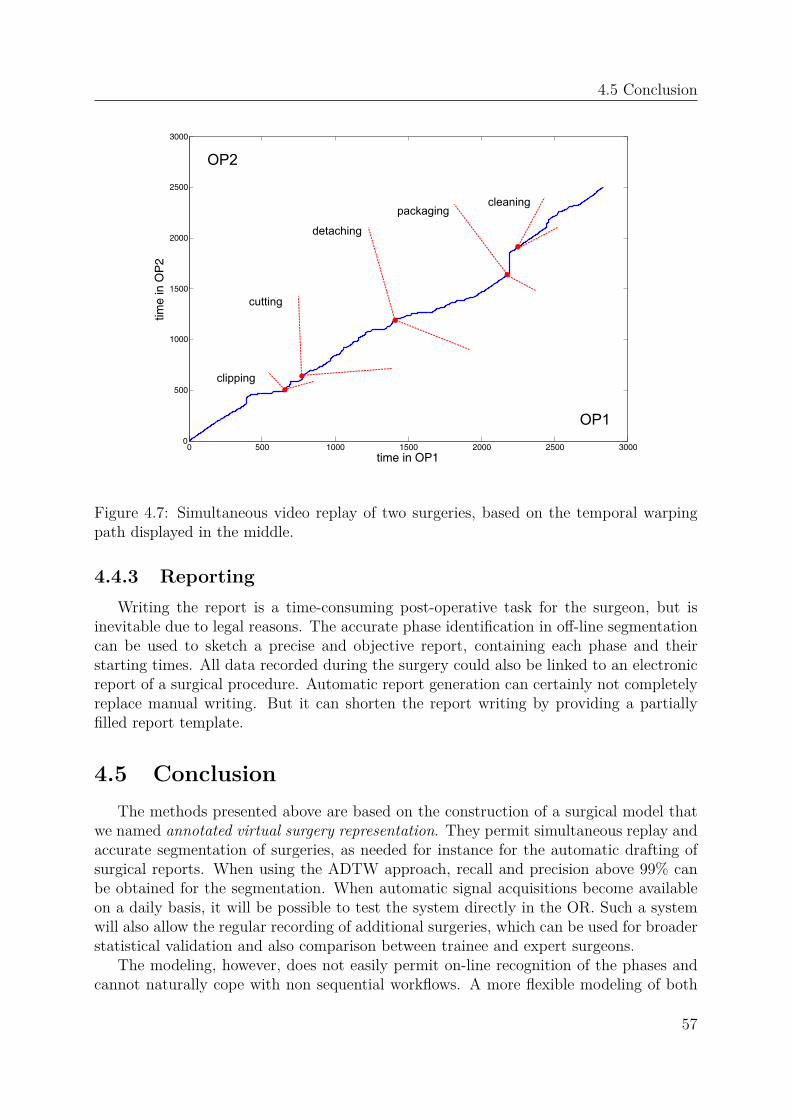
4.5 Conclusion
0 500 1000 1500 2000 2500 30000
500
1000
1500
2000
2500
3000
time in OP1
time
in O
P2
clipping
cutting
detaching
packagingcleaning
OP1
OP2
Figure 4.7: Simultaneous video replay of two surgeries, based on the temporal warpingpath displayed in the middle.
4.4.3 Reporting
Writing the report is a time-consuming post-operative task for the surgeon, but isinevitable due to legal reasons. The accurate phase identification in off-line segmentationcan be used to sketch a precise and objective report, containing each phase and theirstarting times. All data recorded during the surgery could also be linked to an electronicreport of a surgical procedure. Automatic report generation can certainly not completelyreplace manual writing. But it can shorten the report writing by providing a partiallyfilled report template.
4.5 Conclusion
The methods presented above are based on the construction of a surgical model thatwe named annotated virtual surgery representation. They permit simultaneous replay andaccurate segmentation of surgeries, as needed for instance for the automatic drafting ofsurgical reports. When using the ADTW approach, recall and precision above 99% canbe obtained for the segmentation. When automatic signal acquisitions become availableon a daily basis, it will be possible to test the system directly in the OR. Such a systemwill also allow the regular recording of additional surgeries, which can be used for broaderstatistical validation and also comparison between trainee and expert surgeons.
The modeling, however, does not easily permit on-line recognition of the phases andcannot naturally cope with non sequential workflows. A more flexible modeling of both
57

Synchronization and Segmentation of Endoscopic Surgeries
observations and temporal constraints is required and could be provided by well-chosenprobabilistic frameworks. For the requirements of on-line recognition within a workflow,we will use a variant of HMMs. The next chapter gives an introduction to these models,since they will be used later on.
58

CHAPTER 5
Hidden Markov Models
Hidden Markov models (HMMs) and variations thereof are probabilistic models thathave been widely used in recognition problems involving the modeling of time-series. Theyare the core of the on-line recognition methods presented in chapters 6 and 7 for the detec-tion of the current surgical phase, based on data acquired from cholecystectomies or fromthe multi-view reconstruction system. In this chapter, we introduce the common nota-tions and algorithms related to HMMs. They belong to a class of Graphical Models thatcan be very conveniently represented in terms of Dynamic Bayesian Networks (DBNs).As many variations of HMMs are usually presented as DBNs in the literature, we brieflyintroduce DBNs at the end of this chapter. For a more detailed introduction to HMMsand DBNs, we refer the reader to respectively [Rabiner, 1989] and [Murphy, 2002].
5.1 Hidden Markov Models
We first present Markov chains in Section 5.1.1. Hidden Markov models, which can beviewed as an extension of Markov chains by adding an observation model, are introducedin Section 5.1.2.
5.1.1 Markov Chains
A Markov chain models a discrete-time stochastic process with a finite set of N statesx1, . . . , xN connected by transition probabilities. The evolution in time is representedby random variables Xt ∈ x1, . . . , xN for t ≥ 1 and probabilities P (Xt+1 = xj|Xt = xi).A Markov chain is a Markov process of first order, whose transition probabilities to thenext state only depend on the previous state:
P (Xt+1|Xt, . . . , X2, X1) = P (Xt+1|Xt) . (5.1)
59

Hidden Markov Models
x1
x2 x3
P(2|1)P(3|1)
P(1|3)
P(3|2)
P(1|1)
(a) Graphical representation of thetransitions between the states of aMarkov chain.
t t+1
X
O
X
O
t
t
t+1
t+1
(b) Graphical representation of a hidden Markovmodel as a dynamic Bayesian network.
Figure 5.1: Graphical representation of a Markov chain and of a hidden Markov model.Shaded nodes indicate observed nodes. Unshaded nodes indicate hidden (or latent) nodes.
When these probabilities are also constant in time, the process is homogeneous and issimply modeled by the triple λ = (N,A, π), where A is the transition matrix defined by
ai,j = P (Xt+1 = xj|Xt = xi) (5.2)
and π is a vector of initial probabilities: πi = P (X1 = xi). A simple Markov chain isrepresented graphically in Figure 5.1(a).
The probability of a process to be in the sequence of states x = xk1, . . . , xkT can be
computed as:
P (x|λ) = P (X1 = xk1, . . . , Xt = xkT |λ) (5.3)
= p(X1 = xk1|λ)
∏
t
p(Xt = xkt|Xt−1 = xkt−1, λ) . (5.4)
For recognition, Markov chains can be used in maximum a posteriori (MAP) classi-fication, e.g. by finding the most probable model Λ among k models λ1, . . . , λk to havegenerated the sequence x:
Λ = argmaxλ∈λ1,...,λk
P (x|λ) . (5.5)
In many practical problems, such a state sequence is not known or cannot be simplyinferred from the data (for instance a video) generated by the process. HMMs handle thisdifficulty by supposing that the states can only be observed indirectly by observationsthat they generate (the states are hence called "hidden"). Observations are modeled ineach state X by conditional probabilities P (O|X), as defined below.
5.1.2 Hidden Markov Models
A hidden Markov model (HMM) with discrete observations is defined by a quintupletλ = (N,O, A,B, π), where A and π are transition and initial state probabilities as defined
60

5.1 Hidden Markov Models
for Markov chains. B is a matrix modeling for each of the N states x1, . . . , xN anobservation distribution over a discrete set of M symbols O = o1, . . . , oM:
bi,j = P (O = oj|X = xi) . (5.6)
Computing the probability of an observation sequence O = O1, . . . , OT to have beengenerated by the model λ can be achieved by marginalization over the state variables:
P (O|λ) =∑
xk1,...,xkT
P (O, X1 = xk1, . . . , Xt = xkT |λ) (5.7)
=∑
xk1,...,xkT
P (O|xk1, . . . , xkT , λ)P (xk1
, . . . , xkT |λ) (5.8)
=∑
xk1,...,xkT
P (xk1)P (O1|xk1
)T∏
t=2
P (xkt|xkt−1)P (Ot|xkt) . (5.9)
When no ambiguity exists, dependency on λ is omitted for better readability. Thiscomputation is expensive and takes O(2TNT ). Fortunately, a faster computation basedon dynamic programming can be obtained in O(N2T ). This computation addresses thefirst classical problem for HMMs. It permits classification and is presented in Section5.1.2.1. The description of the HMMs problems and of the related algorithms is based on[Rabiner, 1989]. The second classical problem, namely the computation of the "most likelystate path" in the model given an observation sequence, is described in Section 5.1.2.2.The third problem, namely the optimization of the model parameters by expectationmaximization (EM), is addressed in Section 5.1.2.3. In Section 5.1.2.4, we present themodeling in case of continuous observations. Some literature addressing the learning ofmodel parameters based on a set of training sequences is presented in Section 5.1.2.5.
5.1.2.1 Forward-Backward Algorithm
The forward-backward algorithm is based on dynamic programming. It computes theforward variables αt(i) and backward variables βt(i) that can also be used for learningwithin HMMs. For the observation sequence O = O1, . . . , OT , they are defined as
αt(i) = P (O1, . . . , Ot, Xt = xi|λ) (5.10)
βt(i) = P (Ot, . . . , OT |Xt = xi, λ) . (5.11)
They are both computed iteratively. For instance, the initialization and the recursiveformula to compute forward variables are
α1(i) = p(O1|X1 = xi)p(X1 = xi) (5.12)
αt(i) = p(Ot|Xt = xi)∑
j
αt−1(i)p(Xt = xi|Xt−1 = xj) . (5.13)
The probability of an observation sequence is obtained by marginalization over thelast visited state:
P (O|λ) =∑
i
αT (i) . (5.14)
As can be seen from Equation 5.10, the forward variables also permit inference in themodel, namely the computation of P (Xt|O1, . . . , Ot, λ) for t ≤ T .
61

Hidden Markov Models
5.1.2.2 Viterbi Path
The Viterbi path is defined as a state sequence x = xk1, . . . , xkT that maximizes the
probability of having produced a given observation sequence O = O1, . . . , OT :
argmaxx
P (x|O, λ) . (5.15)
This is equivalent to the maximization of P (x,O|λ), obtained in a way similar to thecomputation of the forward variables. Noting
δt(i) = maxxk1,...,xkt−1
P (O, X1 = xk1, . . . , Xt−1 = xkt−1
, Xt = xi|λ) , (5.16)
the best path in terms of Equation 5.15 is obtained by backtracking the maxima in theiriterative computation:
δ1(j) = πjP (O1|xj) (5.17)
δt+1(j) = [maxiδt(i)ai,j]P (Ot+1|xj) . (5.18)
This results in a synchronization between the sequence O and the model. The Viterbipath is really a path in the sense that it does not include any zero transition probability. Itcan be computed in O(N2T ). At each time step t, the state Xt obtained by computationof the Viterbi path may differ from the individually most probable state x maximizingP (Xt = x|O, λ).
This individually most probable state is computed using the variables γt:
γt(i) = P (Xt = xi|O, λ) (5.19)
=αt(i)βt(i)
P (O|λ)(5.20)
=αt(i)βt(i)
∑
j αt(j)βt(j). (5.21)
5.1.2.3 Baum-Welch Algorithm
The Baum-Welch algorithm is a formulation of the expectation maximization al-gorithm to optimize parameters of an HMM. Given a set of l observation sequencesV = O1, . . . ,Ol and an initial set of HMM parameters λ, it updates the parameters inorder to optimize the probability P (V |λ) that the sequences are generated by λ:
P (V |λ) =∏
i
P (Oi|λ) . (5.22)
The algorithm involves two steps:
1. E-step: computation of expected sufficient statistics
2. M-step: reestimation of parameters
62
5.1 Hidden Markov Models
During the E-step, expected sufficient statistics (ESS) are computed based on actualmodel parameters and observation sequences. This corresponds to the computation of thenumber of expected transitions between each pair of states and to the number of expectedobservation of each symbol within each state. During the M-step, the HMM parametersare reestimated from the expected sufficient statistics.
The ESS can be efficiently computed from the forward and backward variables. Notehowever that although the EM algorithm guarantees convergence to a local maximum,the behavior of the optimization highly depends on the initialization parameters, as thefunction to optimize is usually strongly non-convex.
5.1.2.4 Continuous Observation Distributions
If the observed data is continuous, the discrete HMM presented above would requirediscretization of the input space into a finite set of observation symbols. Continuousinput data can however be used directly by changing the modeling of the observationprobabilities. The most common way is to model the observation distributions withmixtures of gaussians:
P (O|X = xi) =∑
k
cikN(O|µik, σik) , (5.23)
where cik are the mixture coefficient and N(·|µ, σ) is a normal distribution. Changingthe distribution does not affect the Forward-Backward algorithm. In the Baum-Welchalgorithm, formulas need to be adapted to account for the different parameters.
Different variants have been considered in the literature, for instance by consideringgaussians tied between states of the HMM. Worth to mention for complex input-spaces areexamplar-based HMMs [Elgammal et al., 2003], where a modeling distribution centereddirectly on data values in non-euclidean spaces is proposed.
5.1.2.5 Parameter Learning
As mentioned in section 5.1.2.3, the success of the expectation maximization algo-rithm highly depends on the initialization. When a large set of training sequences isavailable, model selection can be performed by randomly initializing the model with afully connected graph in which transitions between all nodes are allowed, performing EMtraining with part of the sequences, and then testing the model on the remaining ones.After doing this multiple times, the best model is finally kept. This approach is howevertime-consuming and random. Many heuristics have been proposed to search the pa-rameter space of HMMs, for instance by merging states [Stolcke and Omohundro, 1994],splitting states [Singer and Ostendorf, 1996], combining state merging and state split-ting [Xie et al., 2003], using genetic evolution [Won et al., 2006], or optimizing modelscores such as the Bayesian Information Criterion (BIC) [Friedman et al., 1998] or en-tropy [Brand and Kettnaker, 2000].
Other approaches make guesses or assumptions on the underlying structureof the process and train the model in the respective subspace. For instance[Ghahramani et al., 1997] use factorial HMMs to model independent parallel processes
63

Hidden Markov Models
sharing the same observations and [Brand et al., 1997] propose coupled-HMMs to coupleinteracting processes. These approaches are presented as extensions to HMMs, since theyoften use a modeling containing additional random variables. Using the joint space mod-eling the product of all random variables, they can be modeled as traditional HMMs. It ishowever more convenient to use a factored state space in which all random variables areidentified, as this permits a better presentation and also the design of dedicated learningand inference algorithms. The algorithms can be faster and require less memory space.The dependencies between multiple random variables are conveniently represented in theframework of DBNs, which is introduced in the next section.
5.2 Dynamic Bayesian Networks
A dynamic Bayesian network [Murphy, 2002] is a type of Graphical Model[Stephenson, 2000] that models probabilistic dependencies over time between a set ofrandom variables used to describe a process. Its variables satisfy the Markov properties.Let X1:N
1:T = X1t , . . . , X
Nt : 1 ≤ t ≤ T be a set of random variables, where T is a time
boundary and N the number of nodes used to model the process. Some of these nodescan be observed, the others are hidden.
To specify a DBN, initial probability distributions P (Xj1) for all nodes have to be spec-ified, as well as intra-time-slice probabilities P (Xjt |X
it) and inter-time-slice probabilities
P (Xjt+1|Xit). The joint distribution up to a bounding time T is then obtained by
P (X1:N1:T ) =
N∏
i=1
P (X i1|X1:N1 )
T∏
t=2
N∏
i=1
P (X it |X1:Nt )P (X it |X
1:Nt−1 ) . (5.24)
In the graphical representation, nodes represent random variables and arc dependen-cies. A representation of an HMM as a DBN is given in Figure 5.1(b). At each time step,the observation only depends on the current hidden state, corresponding to the observa-tion distribution B in Section 5.1.2. Due to the Markov assumption, only dependenciesbetween two successive time slices need to be represented. Between two slices, there isa dependency only between the hidden nodes, modeled in Section 5.1.2 by the matrixA. For comparison, an HMM with an observation distribution modeled by a mixture ofgaussians is given in Figure 5.2(a). The hidden (or latent) node Mt is used to representthe mixture coefficients (cik in Section 5.1.2.4). The graphical representation of a facto-rial HMM, in which the observations depend on independent processes, is given in Figure5.2(b).
Similar problems as for HMMs are addressed in DBNs: fast estimation of the prob-ability of a sequence of observations, learning and inference. Using the product space(also called joint space) of the random variables, DBNs can be "flattened" and modeledas HMMs. But an advantage of working within the factorized state space of DBNs isthe improved modularity and interpretability of the model. The representation permitseasily enforcing a-priori constraints in the learning and optimization algorithms. It canbe used to design faster algorithms. It also provides a unique framework to incorporateexisting HMM variants. DBNs generalize Bayesian networks by modeling the temporal
64

5.3 Conclusion
t t+1
X
O
X
O
t
t
t+1
t+1
Mt Mt+1
(a) Graphical representation of a hiddenMarkov model with an observation distri-bution modeled by a mixture of gaussians.
t t+1
X
O
X
O
t
t
t+1
t+1
Xt Xt+1(1) (1)
(2) (2)
(b) Graphical representation of a factorial hiddenMarkov model with two layers.
Figure 5.2: Example graphical representations of hidden Markov models as dynamicBayesian networks. Shaded nodes indicate observed nodes. Unshaded nodes indicatehidden (or latent) nodes.
dependencies. An interesting description of the extension of Bayesian networks to DBNsis available in [Mihajlovic and Petkovic, 2001].
5.3 Conclusion
In this chapter, we have presented the hidden Markov models and several related fun-damental algorithms. We have also described the dynamic Bayesian network framework,in which HMMs and their extensions are conveniently represented. HMMs will be usedin the next chapters for the modeling of workflow processes. The probabilistic frameworkyields a natural formulation of the on-line phase recognition problem. Additionally, thepossibility to define arbitrary topologies permits us to address non-sequential workflows(Chapter 7).
65

Hidden Markov Models
66

CHAPTER 6
Monitoring Endoscopic Surgeries
Context-awareness requires on-line identification of the current surgical events, whichis not provided by the framework described in chapter 4. In this chapter, we introducean approach based on hidden Markov models that permits the on-line recognition of thesurgical phases during endoscopy. Similarly to chapter 4, where we augmented a virtualsurgery representation with an annotation indicating phase probabilities, we introducephase probability variables that can be seen as a latent node within the HMM architecturerepresented as a DBN. The approach, named annotated workflow-HMM (AWHMM), ispresented in Section 6.2. Three different methods are proposed for its construction, whichdiffer in their use of the a-priori knowledge about the phases. Endoscopic videos can alsopotentially provide interesting additional information about the activities. Some exper-iments incorporating visual signals obtained from these videos are given in Section 6.5.Finally, section 6.6.3 shows that the HMM topology construction can provide interestinginformation about the underlying workflow.
6.1 Objectives
HMMs offer a much more general statistical description of a process than the virtualsurgery representation, especially by allowing non-sequential modeling and by explicitlyincluding probabilities, as needed for on-line recognition. A detailed relationship betweenHMM and DTW can be found in [Juang, 1984]. Traditionally, for instance in speechrecognition [Rabiner, 1989], HMMs are used to model the stochastic properties of a train-ing set of time series. The likelihood P (O|λ) that the time series O has been generatedby the HMM λ can for instance be used for classification, if different HMMs are used torepresent the classes. Most approaches using variants of HMMs for human action recog-nition address isolated actions and follow this methodology [Weinland, 2008]. In contrary,we model the complete workflow in a single model, so as to take the specific constraintsof the workflow into account.
67
Monitoring Endoscopic Surgeries
Several works share our initiative of imposing constraints on the flow of events to de-sign a better model and improve recognition results, for example [Moore and Essa, 2002,Vu et al., 2003, Shi et al., 2006, Xiang and Gong, 2008]. Their main focus is however stillon detecting single instances of actions. Our focus is on recognizing phases containingmultiple actions within a lengthy, high-level workflow. In other words, our applicationand therefore modeling differs in that we consider either a higher semantical level (thephase) or an environment with more constrained temporal repetition across the sequencesdue to the surgical protocols.
In this chapter, observations are the vectors of the time-series representing the surg-eries. We aim at constructing HMMs that represent one kind of surgery and also allowus to recognize the phase p ∈ L carried out by the surgeon on-line. Based on trainingsurgeries O
1, . . . ,Ol, we generate a model λ that allows the computation of the probabilityP (phase = p | O1:t) for each time-step t of another surgery O which does not belong tothe training set. This gives us, as in Chapter 4, an annotation function
PO : 1, . . . , T → L . (6.1)
6.2 Annotated Workflow-HMMs
We define annotated workflow-HMMs (AWHMMs) as a form of HMMs extended byphase probability variables that keep track of the semantic (phases) inside the model.Additionally, these variables are convenient for coping with semantic loss during EMtraining and for training the model when only partially labeled data is available.
Formally, the AWHMM is a sextuplet λ = (N,O, A,B, π, φ) where N is the numberof states xi : 1 ≤ i ≤ N in the model, A the transition probability matrix betweenthe states, modeling the topology, and O the space of observations. B is the observationmodel, indicating for any observation O ∈ O and state x the probability Bx(O) = P (O | x)that O can be observed by x. π is a probability distribution over the initial states.φ is an extension that denotes the phase probability variables, indicating the probabilityφx(p) = P (p | x) of each state x to belong to a phase p ∈ L. These variables can be seenas the introduction of a latent node within the generic representation of an HMM as adynamic Bayesian network (see Figure 6.1).
The results of segmentation and phase recognition largely depend on the approachchosen to construct and initialize the parameters of the AWHMM. There exist differentheuristics to initialize and train hidden Markov models. Our choices have been determinedby the fact that in our application, only a small set of training surgeries is available. Wepresent in the following section three generic HMM initialization methods used in theAWHMM construction. We then present in section 6.2.2 several approaches for the con-struction of the AWHMM, based on these generic methods for comparison. The presentedapproaches differ in the required amount of labeled data and in the way the labels areused.
68

6.2 Annotated Workflow-HMMs
t t+1
X
O
X
O
t
t
t+1
t+1
Phase Phase
Figure 6.1: Dynamic Bayesian network representation of the generic AWHMMs withaddition of a latent node.
6.2.1 HMM Initialization Methods
Given a training set of l time-series O1, . . . ,Ol, there exist different methods to initial-
ize and train an HMM λ such that the log-likelihood∑
i logP (Oi|λ) is maximized. TheAWHMM constructions described in the Section 6.2.2 are based, for comparison, on thethree generic initialization methods described in the next sections. The different resultingtopologies of these models are illustrated in Figures 6.2 and 6.3.
6.2.1.1 Fully-connected HMMs
In this initialization, a fixed number of states is chosen, either as a parameter or basedon the amount of data. The topology is fully connected, which means that no transitionprobability is enforced to be zero (see Figure 6.2(a)). All parameters are then randomlyinitialized and the model is further trained by expectation-maximization (EM). Multipleinitializations are performed and each model is evaluated on its ability to represent thetraining data. The best model is ultimately chosen. This is a common approach usuallyrequiring a large amount of training data [Rabiner, 1989]. It will be refered to as (HMM-full) in the experiment sections.
6.2.1.2 Sequential HMMs
Here, the topology is enforced to be sequential with left-right transitions (see Figure6.2(b)). The number of sequentially connected states is given as a parameter or inferredfrom the amount of training data. The training sequences are then split regularly intoas many segments as the number of states and assigned to the states. The transitionprobabilities are chosen such that the expected duration time of the model correspondsto the average lengths of the training sequences. The observation distribution is initial-ized from the corresponding data. EM is finally performed on the model to refine theparameters. This is a natural construction approach, as the sequential topology permitsa good initialization of the parameters from the data. In our experiments, the numberof states is chosen to be
»
(d2) where d is the average length of the training sequences.
69

Monitoring Endoscopic Surgeries
(a) Fully connected topology. (b) Left-right sequential topology.
Figure 6.2: Two usual HMM topologies.
Figure 6.3: Model merging is performed on an exhaustive representation of the trainingsequences (here three are displayed) by merging pairs of states and updating parametersaccordingly.
This is a classical rule of thumb that performs better than choosing any constant, butother classical rules for model selection, like ( d
log(d))
1
3 , perform equivalently well. Variants
in this model include additional left-right transitions skipping one state. This approachwill be referred to as (HMM-seq) in the experiment sections
6.2.1.3 Model Merging
This method is described in [Stolcke and Omohundro, 1994]. Initially, sequential left-right topologies are built out of each training sequence, by creating one state for eachobservation. Only one state is created for consecutive identical observations. Thesetopologies are connected with initial and end states as shown in Figure 6.3 to generate anexhaustive and overfitted model. Then, pairs of states are chosen and merged together tooptimize the probability that the model generates the training sequences. The process isstopped when the decrease in log-likelihood exceeds a given threshold. Additional detailson the model merging approach can be found in [Blum, 2007]. An advantage of theapproach is its direct initialization from the data, which can reveal underlying structures,as described in section 6.6.3. The approach is however time consuming and the data hasto be split at meaningful points if sequences are too long. This approach will be referredto as (HMM-merged) in the experiment sections.
70

6.2 Annotated Workflow-HMMs
6.2.2 AWHMMs Construction Approaches
The following sections describe construction methods to automatically build aAWHMM that describes the stochastics of the surgical signals and permits inferring thecurrent phase using labeled training data.
6.2.2.1 Manual Model Annotation
In this case, the training set is not supposed to be labeled. An HMM is constructed inan unsupervised fashion from the data and the phase probability variables are manuallydefined after its construction. While this is possible for a virtual surgery representation(see section 4.3.1.1), as it resembles a surgery, this is more complicated for HMMs, wherethe meaning of a state is difficult to infer from its observation distribution. This wouldhowever be feasible for models constructed using a left-right topology or model merging,when the signals contain enough semantic to allow for a consistent visualization of themeaning of the states (see section 6.6.3). Another major drawback of this approach isthat the model needs to be re-annotated or updated manually each time a new surgery isadded to the training set.
6.2.2.2 Pre-annotation
This is a fully supervised framework. It supposes all sequences of the training set to belabeled. In this case, an HMM λp for each consecutive phase p is constructed and all thesemodels are concatenated to form an overall model λ as presented in figure 6.4. Artificialstarting and ending states are used in each sub-model to facilitate the concatenation.Using one of the three methods presented in section 6.2.1, each sub-model is initializedfrom the training data of the corresponding phase. For each state x of the overall modelλ, the phase probability variables assign the probability 1 to the phase p, given that thestate x originally stemmed from the sub-model λp before concatenation.
As explained in Section 6.2.2.4, if the EM algorithm is used after concatenation, theannotation φ is updated accordingly, leading to phase probability variables that do nottake only binary values anymore. Practically, this HMM is a hierarchical HMM with 2hierarchy levels.
6.2.2.3 Post-annotation
In this case, the model is first directly constructed from all data without using any labelinformation. Afterwards, the phase probability variables are automatically computedusing the training sequences that are labeled.
An approach using the best path in terms of the Viterbi algorithm is presented below.A more general approach using all paths to visit more states is used in the next sectionfor completeness, but both approaches yield similar results. To compute the phase prob-abilities, the labeled time-series O
1, . . . ,Ol of length T 1, . . . , T l are synchronized to themodel using the Viterbi algorithm (see Section 5.1.2.2), giving for i ∈ 1, . . . , l paths
pathi : 1, . . . , T i → (xk)1≤k≤N . (6.2)
71

Monitoring Endoscopic Surgeries
Figure 6.4: Pre-annotation model construction: Sub-HMMs are constructed for eachphase or cluster of data and appended as displayed in this image. Start and end statesused to facilitate the concatenation are not displayed in this figure.
The labels from the surgeries are then carried over to the model to update the probabilitiesin the states that were visited:
φx(p) ∝#i, t : pathi(t) = x and p = POi(t)
#i, t : pathi(t) = x. (6.3)
where #· is the cardinality operator. If the state x was visited, φx is then normalized toone. If not, all probabilities are kept to zero.
When several labeled surgeries are used, the annotation is averaged. When the modelis not sequential, there can be multiple, parallel paths leading from the starting state tothe terminal state, as can be seen in the graphical representations of Figures 6.2 and 6.3.In this case, it is possible that some states or entire state branches are not visited duringthe process and thus do not receive any annotation. Consequently, the number of states inthe topology has to be kept reasonably small with respect to the amount of training datato avoid graphs containing numerous unannotated states. Alternatively, more labeleddata has to be provided to achieve an annotation of these states. If this is not possibleor unwanted, we choose to assign an average annotation for an un-labeled state by usingall neighboring states with annotation, weighted according to the transition probabilitiesbetween the states.
6.2.2.4 Training and Phase Probabilities
It is usual to refine HMM models with the expectation maximization algorithm. Whenapplying global EM, however, observations can shift to neighboring states. In case of pre-annotation, hidden states might no longer exclusively represent single phases. Phaseprobabilities are hence used to track this shift. In the post-annotation approach, phaseprobabilities also need to be recomputed.
Different proposals have been made to deal with such a shift in the semantic meaning ofthe hidden states. For instance [Shi et al., 2006] proposed, for learning their propagationnetworks, the use of a labeled anchor sequence during EM to prevent alteration of semanticinformation. In their work, sub-actions are represented only through single nodes and themodel topology is provided manually. When the topology is derived from the data andthe modeling involves longer and more complex sub-phases represented by several nodes,
72

6.2 Annotated Workflow-HMMs
constraining the EM algorithm with a labeled sequence requires a complex labeling andis less convenient. Instead, we propose a general approach that keeps track of the phasesprecisely by using the phase probability variables. This provides moreover a convenientformulation during on-line recognition in the AWHMM (see 6.3.2) and is potentially morepowerful by enabling the addition of new labels without performing another EM training.
In this approach, φx is computed a-posteriori using a set of labeled sequencesO
1, . . . ,Ol, in a way similar to a single update of model parameters during EM[Rabiner, 1989]. The approach is refered to as "all-paths", as opposed to the best pathapproach of Section 6.2.2.3. The variables γit(x) = P (Xt = x|Oi) are used (see Section5.1.2.2), indicating the probability to be in state x at time t while knowing the sequenceOi. We count the number of visits that a label makes to each state:
φix(p) =
∑
t,phase(Oit)=p γit(x)
∑
t γit(x)
. (6.4)
Finally, φx is obtained by summing and normalizing over all available sequences. φ canbe quickly recomputed without having to perform EM, for instance if more previoussequences are labeled.
This approach is more general than the one of Equation 6.3, by considering all possiblepaths. In particular, this reduces the likelihood that unannotated nodes occur, as morestates get annotated for each labeled sequence. It however does not garantee that allnodes will get an annotation, since this depends on the available annotated sequences.On our data, the results were similar with both approaches, all paths and best path, bothfor cholecystectomies and the 4D application presented in the next chapter.
In the cholecystectomy application, the phase probabilities are especially interestingfor the modeling when only a subset of the training data is labeled. The post-annotationmethod of section 6.2.2.3 can be used in such case. For the pre-annotation, recomputingthe phase probabilities after global EM shows little change in the results for this applica-tion. This is due to the linear overall workflow and discrete signals. In the next chapter,where continuous signals are used in a workflow with alternative paths, we present exper-iments where the usefulness of recomputing the phase probability variables after globalEM is apparent.
6.2.3 Observation Distributions
The last parameters that need to be determined in the AWHMMs are the observationdistributions for the discrete data. We used two distributions for the discrete signals.The first distribution corresponds to the observation vector frequencies. It is computedby counting the observation occurrences in the data. The second distribution assumesinstrument independence and counts the usage frequencies of each instrument. The re-sulting probability is the product of the probabilities of each instrument. In both cases,a constant small probability is used to account for unobserved data. Since the seconddistribution performed slightly better in the experiments, this was the distribution weused for the evaluation.
73

Monitoring Endoscopic Surgeries
6.2.4 Model Construction Speed-up
Training an HMM model from full data or from data of a long phase can be verycomputationally expensive, especially when using the model merging method. To alleviatethis burden, we split the training data and concatenate the trained sub-models in anunsupervised manner, similarly to the pre-annotation approach (see Section 6.2.2.2). Inthis approach, the transitions between phases are used as synchronization points. Wepropose to use the virtual surgery representation to find such consistent splitting pointsand to construct the full model from subparts. This can be applied to sequential workflowsor to phases. Using the surgical similarity SIMt (see Section 4.2.3), we split at pointswhich correspond to local similarity maxima, where the maximum allowed size of a split isbounded by a single parameter. This provides clusters of training data by back-projectingfrom the virtual representation to the training time-series, as described in fig. 6.5. HMMsub-models are trained from these clusters of training data and finally concatenated.
6.2.5 Discussion
Within the three construction methods, the pre-annotation construction requires allphases of all training surgeries to be labeled. In contrast, the post-annotation providesthe advantage that not all phases or surgeries from the training data need to be labeled,while the other model parameters are still initialized from all the available data. Addi-tionally, when some phase detection is not very reliable, the user can be asked to adda few training surgeries where e.g. only these phases and their neighbors are labeled.When for an application detecting only some subparts of the surgeries is interesting, itis also straightforward to construct the model using only data where these subparts areannotated. The effectiveness of the post-annotation approach depends on the ability ofthe model constructed with no supervision to adequately model the time-series. For thesequential workflow of cholecystectomy, as will be shown in the evaluation, the approachyields good results. For the 4D application presented in the next chapter, where theworkflow contains alternative courses of actions and the observations are continuous, werequired a set labeled data. Finally, addition of new surgeries requires the recomputationof the models in all approaches. For post-annotation, there is the possibility to use thelabeling information for recomputation of the annotation only.
6.3 Off-line Segmentation and On-line Recognition
In this section, we explain how to use the AWHMMs for phase-detection in an unknownsurgery, both in the off-line and on-line case.
6.3.1 Off-line Segmentation
Off-line segmentation is the process of segmenting a new surgery after the acquisitionof all signals O
testt,k . The objective is to compute the phase POtest(t) at each time step t
74

6.3 Off-line Segmentation and On-line Recognition
l
1
Figure 6.5: Training data obtained from surgical similarity splits. Each subpart of thevirtual surgery O corresponds to synchronized subparts of the training surgeries, whichare then used to construct the sub-HMM.
while knowing the complete signals Otest1 , . . . ,O
testT test , where T test denotes the end of the
surgery.
If an AWHMM λ is available from training data, the Viterbi algorithm is used to findthe most likely path through the topology of λ that would generate the time-series O
test.This synchronizes the time-series to the model, giving for each time step the correspondingstate:
path : 1, . . . , T test → (xi)1≤i≤N . (6.5)
The labels from the model are then carried over to the new surgery:
POtest(t) = argmaxpφpath(t)(p) . (6.6)
6.3.2 On-line Phase Recognition
On-line recognition is the computation of the most probable phase when only partialsignals O
test1 , . . . ,O
testt up to the actual time t are known.
In the AWHMM λ, the forward probabilities (see Section 5.1.2.1) permit to computeP (Xt = xi | O
test1 , . . . ,O
testt ), the probability of being in state xi at time t knowing the
partial observations, using dynamic programming. This provides a convenient way toobtain the most probable phase:
POtest(t) = argmaxpP (phase = p | Otest1 , . . . ,O
testt ) . (6.7)
From the annotation of the model, we know the probability
P (p | X = x) =def φx(p) (6.8)
75

Monitoring Endoscopic Surgeries
of being in phase p while being in the HMM state x, thus
POtest(t) = argmaxp
∑
xi
P (p | Xt = xi)×
P (Xt = xi | Otest1 , . . . ,O
testt ) (6.9)
= argmaxp
∑
xi
φxi(p)P (Xt = xi | Otest1 , . . . ,O
testt ) . (6.10)
The model being given, this on-line computation has a constant complexity per time-step.
6.4 Evaluation
We have evaluated the presented methods on data of 16 cholecystectomies performedby 4 different surgeons, using the evaluation measures introduced in Section 4.3.3.1 (accu-racy, recall and precision). Results for off-line segmentation are shown in Table 6.1, resultsfor on-line recognition in Table 6.2. The three different names AWHMM-full, AWHMM-seq and AWHMM-merged refer to the three different generic initialization methods forAWHMMs presented in Section 6.2.1. We performed a leave-one-out cross-validation,where for each of the 16 surgeries the model was built from the remaining 15 ones. Theresults display the mean values and standard deviations over all surgeries.
Since all information is available, results for off-line segmentation are better than foron-line recognition when the same methods are compared. For off-line segmentation,methods based on DTW have measures above 94%. The AWHMM-seq method is onlyslightly worse. In these off-line experiments, we use the same AWHMMs as for the on-lineresults, for fair comparison. HMM topologies are designed general enough for on-linerecognition and adaptation to rare observations.
As can be expected, results with post-annotation are worse than with pre-annotation,as less knowledge is used. They are however good, as recall and precision above 90%can be achieved for HMMs. AWHMM-full is based on random initialization. Multipleinitializations followed by EM training are performed and the model performing best onthe training data is kept. This method is less reliable in presence of limited data than bothother methods, which are directly initialized deterministically from the training data.
For online-recognition, the best results are above 90% and obtained with AWHMM-seq. Post-annotation slightly decreases the values for this method, but the decrease isbelow 3 percentage points. This is very interesting because when only half of the data islabeled, the errors remain similar for all methods, as shown in Figure 6.6.
While AWHMM-merged performed worse than the other methods, this method hasstill an important advantage. As explained in Section 6.6.3, using the inherent semanticof the tool usage signals, the topology of the resulting HMM can be interpreted. It canbe used to automatically generate visualizations and human understandable statisticalmodels of surgical workflow.
In Table 6.3, on-line results per phase are displayed for AWHMM-seq with pre-annotation construction. Results are usually above 90 %, except for short phases with a
76

6.5 Use of Visual Signals
Accuracy (%) Average Recall (%) Average Precision (%)
AVSR (pre) 97.3 (±6.6) 97.6 (±5.6) 97.0 (±5.7)AVSR (post) 95.1 (±6.6) 95.5 (±6.0) 94.0 (±6.2)AWHMM-full (pre) 90.1 (±7.7) 90.2 (±8.6) 89.5 (±7.9)AWHMM-full (post) 85.4 (±12.4) 83.5 (±12.2) 80.1 (±14.2)AWHMM-seq (pre) 96.0 (±6.3) 96.5 (±5.6) 95.9 (±5.5)AWHMM-seq (post) 94.9(±5.1) 94.7(±4.9) 93.6(±5.9)AWHMM-merged (pre) 93.9 (±6.9) 93.9 (±7.9) 94.6 (±7.5)AWHMM-merged (post) 88.2 (±10.1) 88.8 (±9.0) 85.1 (± 11.4)
Table 6.1: Off-line results. Leave-one-out cross-validation on 16 surgeries performed by 4surgeons. Mean and standard deviation over all surgeries. (pre) indicates pre-annotationconstruction, (post) construction with post-annotation. AVSR refers to the approach inChapter 4.
relatively high standard deviation compared to the mean duration, as it is the case forphase 4, 5 and 11. For these phases, there are one or two surgeries in which the phaseswere not recognized.
The results are very promising, since usually all phases are recognized. The errors aremainly caused by a delay of some seconds when detecting a new phase, which is acceptablefor most applications. The phases that are completely skipped are mainly phases thatare very short and that are not recognized due to the delay. For instance, the externalcleaning phase (phase 11) has an average length of 1 minute and 44 seconds. In a fewsurgeries, its duration is below 15 seconds.In Fig. 6.7, the average length of each phase and the corresponding mean error per phase(duration of uncorrect detections) are indicated in minutes. These errors were obtainedfor AWHMM-seq with pre-annotation construction. The maximum mean error per phaseoccurs for phase 3 and is of 1 minute and 14 seconds. For comparison, AWHMM-seq withpost-annotation yields a maximum mean error per phase of 1 minute and 11 seconds,occurring in phase 5. The average length among all surgeries is 48 minutes.
The fact that these results were obtained using only little training data of four differentsurgeons with varying skill levels is especially encouraging, since this demonstrates therobustness of our statistical methods towards inter-person variability. With a large enoughdatabase of cases, it would be possible to generate surgeon-specific models of the surgery.This, in return, can be expected to further increase recognition accuracy.
6.5 Use of Visual Signals
Real surgeries show little repetition in the endoscopic video within such a small amountof data. This is due to patient and surgeon specificities as well as camera movements.Additionally, the images are very challenging for vision algorithms as many perturbationsoccur. These include strong specularities, appearance of smoke, tissue deformations,
77

Monitoring Endoscopic Surgeries
Accuracy (%) Average Recall (%) Average Precision (%)
AWHMM-full (pre) 88.7 (±9.1) 89.4 (±8.4) 85.8 (±9.6)AWHMM-full (post) 85.4 (±11.8) 84.2 (±9.6) 82.4 (±12.6)AWHMM-seq (pre) 91.3 (±8.7) 91.6 (±7.6) 89.9 (± 8.6)AWHMM-seq (post) 91.6 (±7.1) 89.7 (±7.3) 88.5 (±9.7)AWHMM-merged (pre) 88.1 (±12.0) 88.8 (±11.3) 87.8 (±11.9)AWHMM-merged (post) 84.8 (±14.1) 84.9 (±12.0) 85.1 (± 14.7)
Table 6.2: On-line results. Leave-one-out cross-validation on 16 surgeries performed by 4surgeons. Mean and standard deviation over all surgeries. (pre) indicates pre-annotationconstruction, (post) construction with post-annotation.
10 20 30 40 50 60 70 80 90 10084
85
86
87
88
89
90
91
92
93
94
% annotated training surgeries
mea
sure
s (%
)
success
recall
precision
Figure 6.6: Accuracy (rate of success), average recall and average precision for AWHMM-seq with post-annotation evaluated on-line. Influence of number of annotated surgeries.The horizontal lines refer to the best result for each curve, obtained when all trainingsurgeries are labeled.
78

6.5 Use of Visual Signals
Phase Label Rel. Len. (%) Recall (%) Precision (%)
1 CO2 Inflation 6.5 (±3.2) 100.0 (±0.0) 100.0 (±0.0)2 Trocar Insertion 6.4 (±1.4) 98.3 (±6.7) 99.6 (±1.1)3 Dissection Phase 1 17.1 (±9.1) 86.4 (±23.9) 98.1 (±7.5)4 Clipping Cutting 1 3.8 (±1.6) 69.4 (±45.4) 66.4 (±40.6)5 Dissection Phase 2 3.7 (±5.0) 68.3 (±36.9) 67.7 (±37.9)6 Clipping Cutting 2 3.9 (±1.9) 91.5 (±15.7) 79.1 (±25.5)7 Gallbladder Detaching 18.9 (±13.1) 94.8 (±5.9) 88.0 (±18.9)8 Liver Bed Coagulation 1 7.1 (±4.4) 93.4 (±18.1) 90.0 (±13.6)9 Gallbladder Packaging 4.1 (±2.8) 99.7 (±1.1) 96.8 (±6.0)10 External Retraction 11.7 (±11.7) 99.7 (±0.9) 95.9 (±8.4)11 External Cleaning 3.6 (±4.1) 82.3 (±31.9) 79.8 (±17.3)12 Liver Bed Coagulation 2 6.2 (±2.1) 96.8 (±7.3) 99.6 (±1.0)13 Trocar Retraction 2.6 (±1.9) 94.8 (±12.1) 93.9 (±13.7)14 Abdominal Suturing 3.9 (±3.4) 98.1 (±5.5) 93.3 (±17.9)
Table 6.3: Online results. Leave-one-out cross-validation on 16 surgeries performed by 4surgeons. Detailed results per phase for the pre-annotation construction, with mean andstandard deviation over all surgeries. The third column (Rel. Len.) indicates the averagerelative length of each phase with standard deviation.
occlusions and fast change of field of view (see Figure 6.8). In order to use informationfrom these images, robust visual signals need to be constructed.
In the following, we define two specific detectors whose outputs are computed directlyfrom the endoscopic video and can be used as signals. The first detector indicates whetherthe camera is present in the body and the second whether clips are detected in the fieldof view (see Figure 6.9). Their usage shows improvement in the recognition rates.
6.5.1 Signals
Endoscopic camera signal As can be guessed from figures 3.3 on page 32, color isa main cue to obtain the state of the endoscopic camera. Since cameras with differentsettings are used, a color normalization [Paulus et al., 1998] is performed on the imagesbeforehand, which proved to improve the results. We used a small color histogram of size20 as visual feature. The first 10 bins contain a hue histogram and the last 10 bins asaturation histogram of the image. Based on labelled images from training surgeries, twoGaussian mixture models (GMMs) Gendo and Gout are trained to model the color spacesof endoscopic images and of outside images taken by the camera before or after extractionfrom the trocar. The training consists in an initialization with principal component anal-ysis followed by EM iterations. An image is classified as endoscopic when the probabilityof its histogram to belong to Gendo is higher than for Gout. Evaluation based on a fewmanually labelled complete surgeries provides a success rate of 92%.
Two kinds of images are difficult in the evaluation: images where the camera is half
79

Monitoring Endoscopic Surgeries
1 2 3 4 5 6 7 8 9 10 11 12 13 140
1
2
3
4
5
6
7
8
9
10
phase
min
utes
mean phase lengthmean errormean error with std
Figure 6.7: For each phase, average length over all surgeries overlaid with mean detectionerror, in minutes. Errors are computed on-line for AWHMM-seq with pre-annotationconstruction.
(a) Blur. (b) Smoke. (c) Far view. (d) Specularity.
Figure 6.8: Several challenging views taken by the endoscopic camera.
inserted and as much of the metallic trocar can be seen as of the internal anatomy, andimages where the camera is entirely inside the abdomen but fully blinded by specularitydue to its proximity to the tissue.
Clip detection signal Clips are small longitudinal metallic objects used to clamp theblood vessels. In most of the surgeries we recorded, dark blue clips were used, sometimeswith additional grey titanium clips. To detect the blue metallic clips, we use color classi-fication with a similar approach as before.Two GMMs Gclips and Gbg modeling the colorsof the clips and of the endoscopic background are constructed based on a few trainingimages segmented manually. They are used in a first step to classify the image pixels intoclip and background. After morphological closing operations, the connected componentsare elected as clips depending on two properties: reasonable size and longitudinal shape.When the endoscopic camera is detected to be in the body and such a connected compo-nent is found, the clip signal is set as active. Note here, that false positives in the detection
80

6.5 Use of Visual Signals
(a) Endoscopic camera out-side the body.
(b) View of a clip. (c) Detected clip.
Figure 6.9: Exemplary pictures for the computation of visual signals.
are more an issue than false negatives. Indeed, detected clips before their introduction inthe body give a wrong indication about the possible phase. It however often occurs thatclips are small or hidden from the field of view after their introduction in the body. Forthis reason, the criteria are set such that clearly visible clips are detected, while far orpartially hidden clips might not be detected. This reduces the number of false positives.False positives may occur as the dark blue clips have a color similar to coagulated tissuesand to smoke. Clips are also sensitive to specularities and reflections. The recognitionmodel appeared however to cope with these false detections. The evaluation is not easy,as manual labeling of the clips is tedious and has to be done image per image, contraryto the instruments for which we only consider the presence in the body, not in the field ofview. On three manually labeled surgeries, where also partially and hardly visible clipswere noted as present, the automatic detection rate is 76%.
6.5.2 Evaluation
For these experiments, we used 11 surgeries performed by three surgeons where blueclips were used. As before, we perform a cross-validation on the dataset. In the exper-iment without visual signals, all signals presented in Section 3.1.2.1 are used except thesignal indicating the presence of the endoscopic camera. In the experiment with visualsignals, the two signals computed from the endoscopic videos as defined in previous sec-tion are added. The signal indicating clip presence adds information to the existing signalindicating the presence of the clipping device. We use these two binary signals insteadof the color histograms for dimensionality reduction, as a small training set of surgeriesis available. On-line results after cross-validation with the pre-annotation approach arepresented in table 6.4. They show in particular that addition of signals computed fromthe videos can improve the recognition results. As noted before, the two added signalsare noisy, especially due to the ambiguities arising from the challenging images. However,these encouraging results show that the AWHMMs cope with noise that can be presentwithin the input.
Other signals could potentially be derived from the videos. However, as can also beseen in the work of [Lo et al., 2003, James et al., 2007], detection rates are usually low,even when considering simpler cases such as pig surgeries or parts of videos only. For
81

Monitoring Endoscopic Surgeries
Accuracy (%) Average Recall (%) Average Precision (%)
With 91.2 (±7.5) 92.1(±7.9) 86.9 (±10.9)Without 87.3 (±13.8) 88.8 (±11.9) 83.6 (±15.4)
Table 6.4: Online results for AWHMMs, with mean and standard deviation over the cross-validation tests. Comparison of evaluation measures using pre-annotation constructionwith and without the visual signals included during the experiments.
this reason, discriminative signals such as instrument usage seem to be more practical,especially if only small training sets are available.
6.6 Applications
Using methods described in the previous sections, we can develop several applicationswith a direct and potentially large impact on patient welfare, peri-operative hospitalorganization and surgeon’s control over the surgical processes.
6.6.1 Event Triggering
Recognition of the phases can mainly serve in triggering events, like calling automat-ically the next patient, notifying the cleaning personnel, informing the next surgeon orgiving reminders to the surgical staff (see e.g. Figure 6.10). This can also be used tocontrol a user-interface providing context-aware information. Calling the next patientis actually of clinical importance, since if done too soon, the next patient might stayanaesthetized for an unnecessarily long period of time. If done too late, the operatingroom will remain unused during some time, which reduces the hospital efficiency. In caseof cholecystectomy, this is usually done in phase 7 (gallbladder detaching). This couldtherefore be done automatically and reliably, relieving the OR staff from this task. Thisphase was always recognized in the detection process; its mean recall is 94.8% and meanprecision 88.0% in case of AWHMM-seq with pre-annotation. The recall corresponds toa recognition error in absolute time within the phase of 40 seconds, as can be seen in fig.6.7.
6.6.2 Remaining Time Prediction
Another interesting application is the prediction of the remaining time. Making thisinformation automatically available to hospital personnel outside the OR could signif-icantly improve planning of schedules. After detecting the current HMM state duringa running surgery, the average remaining time can be easily inferred from the HMMtransition probabilities. Results are shown in Figure 6.11. For this figure, prediction ofremaining time was performed at each time steps and the errors averaged in each phaseare presented.
82

6.6 Applications
Figure 6.10: Excerpt from an illustrative monitoring video published in[Padoy et al., 2008], showing synchronized input data, recognition and event trig-gering (here a message asking to switch on the OR lights).
1 2 3 4 5 6 7 8 9 10 11 12 13 140
5
10
15
20
25
Phase number
Err
or (
mn)
Figure 6.11: Average errors in remaining time prediction, per phase.
Prediction starts to be accurate with the beginning of phase 10, with a mean pre-diction error below 5 minutes. The average length among all surgeries is 48 minutes.A more accurate prediction could use information about the patient (e.g. size, weight,state of inflammation) and about the surgeons (e.g. skills for the kind of surgery). Weunfortunately lack this data, but hopefully this data will become available in the future.
6.6.3 Towards Workflow Mining
An interesting property of the model merging approach introduced in section 6.2.1, isthat the construction of the topology provides hints about the underlying workflow pro-cess. Models generated with the model merging approach for two phases are presentedin figure 6.12. The method clusters the observations from the training data and permitsto identify the different probable paths within the workflow. Widths of the arrows are
83
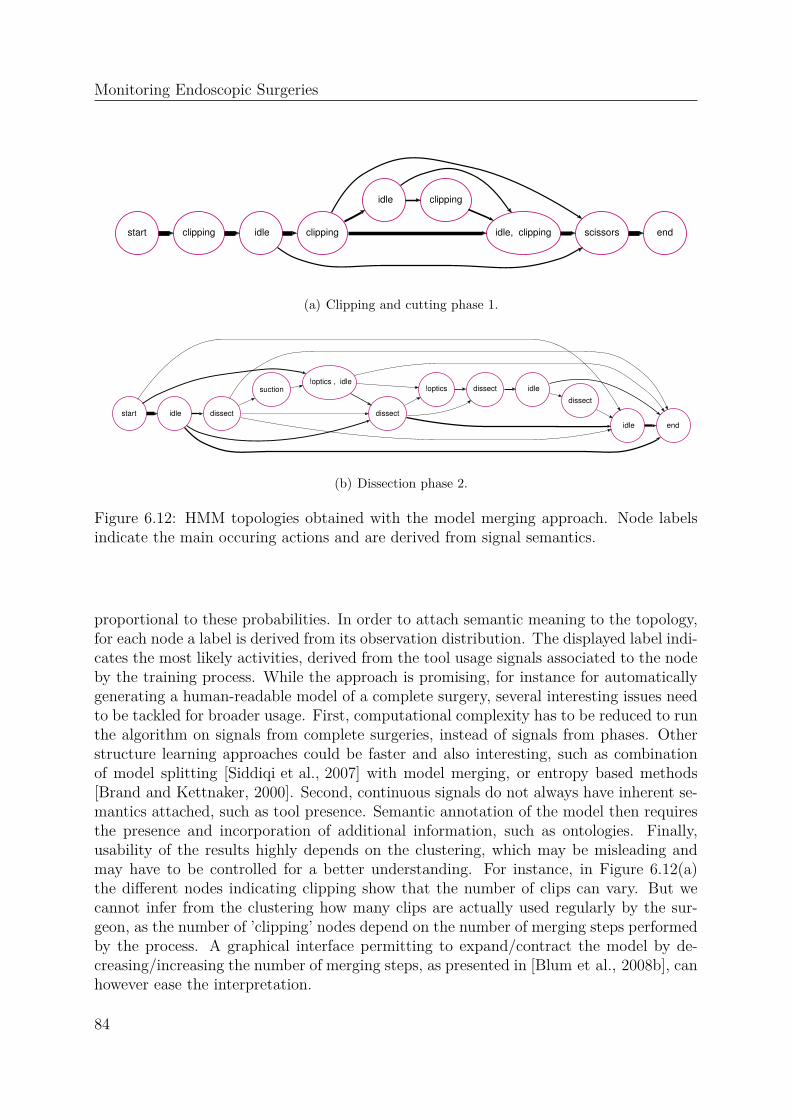
Monitoring Endoscopic Surgeries
start clipping idle end clipping scissors
idle
idle, clipping
clipping
(a) Clipping and cutting phase 1.
start
idle
idle
!optics , idle
end
dissect dissect
!optics dissect suction idle
dissect
(b) Dissection phase 2.
Figure 6.12: HMM topologies obtained with the model merging approach. Node labelsindicate the main occuring actions and are derived from signal semantics.
proportional to these probabilities. In order to attach semantic meaning to the topology,for each node a label is derived from its observation distribution. The displayed label indi-cates the most likely activities, derived from the tool usage signals associated to the nodeby the training process. While the approach is promising, for instance for automaticallygenerating a human-readable model of a complete surgery, several interesting issues needto be tackled for broader usage. First, computational complexity has to be reduced to runthe algorithm on signals from complete surgeries, instead of signals from phases. Otherstructure learning approaches could be faster and also interesting, such as combinationof model splitting [Siddiqi et al., 2007] with model merging, or entropy based methods[Brand and Kettnaker, 2000]. Second, continuous signals do not always have inherent se-mantics attached, such as tool presence. Semantic annotation of the model then requiresthe presence and incorporation of additional information, such as ontologies. Finally,usability of the results highly depends on the clustering, which may be misleading andmay have to be controlled for a better understanding. For instance, in Figure 6.12(a)the different nodes indicating clipping show that the number of clips can vary. But wecannot infer from the clustering how many clips are actually used regularly by the sur-geon, as the number of ’clipping’ nodes depend on the number of merging steps performedby the process. A graphical interface permitting to expand/contract the model by de-creasing/increasing the number of merging steps, as presented in [Blum et al., 2008b], canhowever ease the interpretation.
84

6.7 Conclusion
6.7 Conclusion
In this chapter, we have presented on-line phase detection approaches for endoscopiccholecystectomies. Results on this data suggest that the development of context-awareapplications in the surgery room is possible, if signals providing the tool usage in real timebecome available in regular routine. Both the current choice of signals and the approachcan be applied to other endoscopic surgeries. As in Chapter 4, results were presentedon 16 surgeries performed by 4 different surgeons from the same medical school. Itwill be interesting to see how the results improve when more data is available. Withsufficient exemplary training data, the models are expected to provide good results evenon surgeries performed at different medical schools. An interesting testbed would besurgeries performed with the da Vinci robot, where signals can be automatically acquiredin real time during real surgeries. Once the question of the signal acquisition is solved,other interesting applications would be open surgeries, where workflow plays the sameimportant role. In the next chapter, we apply the methods to another challenging andcomplementary application, the recognition of the daily workflow in the operating room.In this application, the signals are continuous and the workflow can contain alternativepaths. This makes it interesting and complementary to the work presented in this chapter.
85

Monitoring Endoscopic Surgeries
86

CHAPTER 7
Monitoring Workflows using 4D Features
In this chapter, we address the recognition of generic phases occuring during thedaily OR workflow, based on signals recorded from a multi-view reconstruction system.Two such systems have been installed in Munich, the first in a laboratory at TechnischeUniversität München, the second within an intervention room at Hospital Grosshadern. Amain objective of the system, which was supported by Siemens Healthcare, is the detectionof potential collisions between a robotic device and the objects and staff present withinthe surgery room.
A second and very promising application of the system that we address in this thesisis the recognition within a surgical workflow. Recognition based solely on reconstructiondata is also a recent field of research, where existing work has only addressed actionclassification performed by a single human. The purpose of this chapter is to propose aninitial approach for workflow recognition based on reconstruction data, within a complexscene involving several persons and objects. Contrary to the cholecystectomy application,where the workflow is sequential, in this application the workflow contains alternativecourses of actions. The setup of the system has been described in Section 3.2. The featuresderived from the reconstruction data are presented in Section 7.2. The initialisation of theannotated workflow-HMM adapted to these new features and to a workflow containingalternative paths is given in Section 7.3. Finally, experimental results are shown in Section7.4.
7.1 Objectives
Using the multi-camera reconstruction system, we obtain a sequence of visual hullsr1:T in an on-line manner, as explained in Section 3.2.2 on page 38.
Even though much work address the reconstruction problem in a multi-camera setup(we refer the reader to [Seitz et al., 2006] for a recent review), only few work addressactivity recognition using 3D reconstruction data. Existing work address the recognition
87

Monitoring Workflows using 4D Features
of actions performed by a single human, such as kicking or punching. The INRIA XmasMotion Acquisition Sequences (IXMAS) dataset [Weinland et al., 2006] is usually used asreference in experiments. This dataset consists of synchronized acquisitions of 5 multi-view videos capturing actions performed by various actors.
In [Weinland et al., 2006], the motion template approach that had been introducedin [Bobick and Davis, 2001] for 2D action recognition was generalized to 3D. Motion his-tory volumes together with a viewpoint independent representation were proposed toclassify human actions. The method was directly applied to 3D reconstruction data.In [Lv and Nevatia, 2007, Weinland et al., 2007, Yan et al., 2008], actions were learnedfrom 3D voxels for view-invariant action recognition in 2D images. For recognition,[Lv and Nevatia, 2007] rendered multiple 2D poses from 3D examples and performedsilhouette matching. During matching, temporal smoothness constraints were enforcedusing a deterministic action graph. [Weinland et al., 2007] proposed a similar approachbased on key poses, using HMMs to recognize actions. In [Yan et al., 2008], recognitionwas performed with spatio-temporal features, computed from 2D projections of the 3Dexamples over time.
As motivated in section 3.2.1.1, in this work, the purpose is both to learn from the 3Ddata and to perform recognition directly on this data. The data has the reconstructionquality that can be achieved by our real-time system. We also do not focus on classificationof isolated action sequences from a pre-segmented dataset, but on recognition of activitiesinside the continuous workflow, involving several persons and objects. Due to the spatialconstraints present in the OR, especially the fixed position and orientation of the patienttable, no view invariance is required in our case.
For recognition, we use several 3D features, namely 3D occupation and 3D motion flow.2D optical flow was recently used for action recognition by [Efros et al., 2003]. To ourknowledge, no previous work has used 3D features for the analysis of complex workflow.
The AWHMMs introduced in the previous chapter are used as recognition approach.To deal with the alternative paths of actions, the a-priori annotation approach is appliedand temporal relationships between the phases are automatically computed from the la-beled data.In order to model activities containing several actions occuring in parallel,[Shi et al., 2006] manually provided the relationships between the nodes within their prop-agation networks. In this model, each node modeled a single action. In [Vu et al., 2003],the relationships are given a-priori in form of formal rules. Contrary to these two work,[Xiang and Gong, 2008] interestingly proposed to learn the relationships between the ac-tivities, which were first classified by a dedicated classifier performing dimensionalityreduction. The classifier does not use a temporal model. Adding a temporal modeling toeach action would be similar to using a hierarchical HMM, which is a model more com-plicated to train in presence of a small amount of data containing a complex structureand without additional information. This is the main reason why we use a set of labeleddata to compute the temporal structure of the workflow.
In the following, we denote as O the feature sequence computed out of a reconstructionsequence r1:T . Using training sequences O
1, . . . ,Ol, we generate a model λ that takesalternative courses of action into account and permits the computation of the probability
88

7.2 Observations
P (phase | O1:t) for each time-step t of the surgery O.
7.2 Observations
The multi-camera system provides sequences of 3D occupation grids, also called visualhulls:
r1:T, r : v→ 0, 1, v ∈ Ω ⊂ R3 . (7.1)
As explained in Section 3.2.1.1, individual tracking of objects is very challenging inthe surgery room. For phase recognition, we compute features which coarsely describethe spatial distribution of occupancy and motion in the OR over time, without linkingthese to specific instances of persons and objects. We thereby rely on the fact that thedifferent phases are discriminative with respect to different occupancy constellations andmotion patterns appearing at key-locations in the OR. For instance, the patient entering(see section 3.2.2.2) can be identified by a strong motion close to the entrance of the OR,while the surgery phases are characterized through distinct motion patterns appearing inthe neighborhood of the operation table.
In our experiments, motion features appeared as the most interesting. Occupancybased features revealed indeed to be poorly discriminative, even in combination with themotion features. Below, we present the computation of these two features.
7.2.1 Occupancy Features
Each visual hull r is split into Q × R × S evenly spaced cells ci. For each cell wecompute occupancy features O1:Q·R·S as the number of voxels that fall into the cell. Inthe following, for clarity we omit indices representing time and sequence number. To avoidquantization effect, voxels vote smoothly for each cell, weighted by radial basis functionscentered at the cell’s centroid:
Oi =∑
v∈Ω
r(v) expÇ
−(v− ci)2
2σ2i
å
, (7.2)
where ci is the centroid of cell ci, and σi controls the radius at which voxels contribute toa certain cell.
7.2.2 3D Motion Features
7.2.2.1 3D Optical Flow
In 3D, optical flow has mainly been used for medical image analysis. This isone of the rare domains were 3D+t datasets are available on a regular basis. Re-covery of the motion field can be used for registration of several volumes acquiredover time. 3D optical flow has been used to find mapping between PET vol-umes [Klein and Huesman, 1997], cardiac MRI volumes [Barron, 2004] and CT volumes
89

Monitoring Workflows using 4D Features
...
Figure 7.1: Computation of 3D flow histograms within the reconstructed volume, usingregular polyhedron quantization.
[Zhang et al., 2008]. In [Chen et al., 2001], 3D optical flow was used on 3D doppler datato compute the velocities in storms. The extensions of the widely used 2D optical flowmethods [Horn and Schunck, 1980] and [Lucas and Kanade, 1981] to 3D were presentedin [Barron and Thacker, 2005, Simon Baker and Matthews, 2004].
We describe the 3D Lucas-Kanade optical flow, which will be used for the computa-tion of the motion features. Using the intensity constancy assumption, the optical flowconstraint at a voxel v is given as:
δr(v)
δv· f(v) +
δr(v)
δt= 0 , (7.3)
with f(v) representing the velocity vectors. For each velocity vector, three parametershave to be estimated. This requires additional equations, obtained by assuming that thevelocities to be locally constant around each voxel. For a voxel v, this assumption yieldsa set of linear equations
δr(v1)δv· f(v) + δr(v1)
δt= 0
δr(v2)δv· f(v) + δr(v2)
δt= 0
...δr(vn)δv· f(v) + δr(vn)
δt= 0
, (7.4)
where v1,v2, . . . ,vn are the voxels in a window centered at v. The equation system canbe rewritten in the matrix form as AF = −b and solved using the least-square method,which provide the solution F = (A⊤A)−1A⊤(−b). In order to give more weight to thecenter voxels, an additional gaussian weighting W is used, actually yielding the equation:WAF = −Wb. Meaningful velocities are obtained after a reliability test based on athresholding of the smallest eigenvalue obtained during the decomposition of (A⊤W 2A).Our implementation extends to 3D the code available for the 2D case in the Piotr matlabtoolbox 1.
7.2.2.2 Motion Features
As for occupancy features, we split the reconstruction volume into a set of Q×R× Sevenly spaced cells c. For each cell, we compute a histogram of 3D motion orientations (see
1. http://vision.ucsd.edu/~pdollar/toolbox/doc/
90

7.2 Observations
Figure 7.1). To avoid quantization effects at the boundaries of the cells and to introduceinvariance to small variations, we use a smooth voting scheme for histogram computationbased on radial basis functions. From the occupation grid sequences r we compute 3Doptical-flow sequences as explained in previous section:
f1:T, f(v) : Ω→ R3, Ω ⊂ R
3 , (7.5)
The flow vectors f(v) for all voxels v are then quantized into n orientation binsh1(v), . . . , hn(v) using a soft voting scheme, and accumulated into histograms
H1:Q·R·S,1:n . (7.6)
One histogram is computed for each of the Q×R× S evenly spaced cells ci:
Hij =∑
v∈Ω
hj(v) expÇ
−(v− ci)2
2σ2i
å
, (7.7)
where ci is the centroid of cell ci, and σi controls the radius at which flow vectors contributeto a certain cells.
To quantize the 3D flow vectors, we adapt an approach proposed by[Kläser et al., 2008], which uses regular polyhedrons to define the histogram bins. Thisquantization scheme avoids well-known problems of standard spherical quantizations,such as singularities close to the poles and decreased accuracy close to the equa-tor [Kläser et al., 2008]. Polyhedrons generalize polygons in 3D. In order to regularlyapproximate a sphere 2, there are only five regular polyhedrons with respectively 4 (tetra-hedron), 6 (cube), 8 (octagon), 12 (dodecahedron) and 20 (icosahedron) faces. In thisapproach, quantization is performed by projecting 3D flow vectors onto the homogeneouslydistributed face normals. The face normals can be easily computed out of the face centers.For instance, a dodecahedron centered at the origin can be described by the following 12face centers:
(0,±1,±ϕ) (±1,±ϕ, 0) (±ϕ, 0,±1) , (7.8)
with ϕ = 1+√
52
being the golden ratio.Let p1:n be the face normals of a regular n-sided polyhedron. A flow vector f(v)
votes for each bin as follows:
hi(v) = max
Ç
f(v)T · pi‖f(v)‖2
− q, 0å
. (7.9)
q is chosen such that a flow vector lined up with one of the bin’s normals will only vote forthis bin, that is q = p⊤j pk, with pj,pk being direct neighbors (see Figure 7.2). Otherwise,it votes for several neighboring bins, in proportion to its proximity to the correspondingbin.
The final contribution of flow vector f(v) into histogram bin h(v)i is computed bynormalizing the values of hi(v) to the unit and weighting them by the flow vectors mag-nitude:
h(v)i =‖f(v)‖2 · hi(v)
∑
i hi(v). (7.10)
The resulting motion flow is illustrated in Figure 7.3.
2. Question: what polyhedron is used to build a soccer ball?
91

Monitoring Workflows using 4D Features
p
p
j
k
q
Figure 7.2: Notations for quantization using face normals.
Figure 7.3: Two scenes from a surgery, with reconstruction and motion flow.
7.3 Modeling
In the cholecystectomy application, the surgery is performed continuously withoutinterruptions. The surgical phases are contiguous and for this reason there is no needfor an extra phase, modeling background or intermediate activities. In the daily ORworkflow, it appeared necessary to use an additional label ’background’ assigned to periodsof time where nothing semantically interesting with respect to the workflow occurred. Thiscorresponds to parts in the videos that were not labeled.
To deal with the non-linear workflow containing alternative paths, we build theAWHMM structure using a phase-wise construction approach (see Section 6.2.2.2). Weuse labeled data, and do not rely on structural learning. This is in particular of advantagefor this dataset as only a small set of training sequences with continuous observations isavailable and signals do not contain any semantic. By using the labeling, we can directlyderive a meaningful high level topology for concatenation of the sub-models. Effectively,
92

7.3 Modeling
t t+1
Event
Mixture
Obs
Trigger
Hierar
Phase
Event
Mixture
Obs
Trigger
Hierar
Phase
Figure 7.4: Dynamic Bayesian network representation of the AWHMMs: two-level hier-archy with a phase variable.
the model has a two-layer hierarchy: nodes on the top layer represent dependencies be-tween distinct phases, while nodes on the bottom layer represent dependencies withinindividual phases. We construct the AWHMM using labeled and unlabeled observationsequences of the workflow. The construction involves the generation of the top-level topol-ogy, the initialization of the parameters in the lower hierarchy, and the overall trainingusing EM to refine all probabilities.
The detailed structure of our AWHMM is illustrated using the convenient graphicaldescription of dynamic Bayesian networks [Murphy, 2002] in Fig. 7.4. In this formalism,the random variables Hierar, Event and Trigger enforce the two-level hierarchy, whichmodels the phases and their dependencies. Mixture and Obs represent the observationdistributions occurring within the process. Finally, Phase models the probabilities ofbeing in a phase knowing the current Event. As in the previous chapter, to model thetopology we use a conventional HMM with a single state variable x, which encodes allpossible combinations of the Markov states of the original model. The topology shownin Figure 7.4 is nevertheless preserved by enforcing its structure on the transition matrixof x, i.e. by setting non-possible transitions to zero. The construction of the model isexplained in the next section 7.3.1.
7.3.1 Initialization of Model Parameters
The initialization consists in two steps: 1) generating the top-level topology by en-forcing the temporal constraints between the phases using a set of labeled sequencesO
1, . . . ,Ol. 2) initializing the bottom level from the labeled information.As each labeled sequence provides the temporal relationships between its labels, a
directed graph can be deterministically derived from the data, modeling the temporalrelationships between the phases, ie. the overall workflow (such a graph is illustrated inFigure 7.5). For the sake of recognition, inter-phases, namely the chunks of observationsbetween two consecutive labels, are also used to build nodes of the graph. Inter-phases
93

Monitoring Workflows using 4D Features
1
23 4
5
6
7
8 9 10. . . . . .
. . .. . . . . . . . .
. . .
. . .
. . .. . .
Figure 7.5: Graph representing the temporal relationships between the phases of theworkflow in Figure 3.9, as extracted from annotated sequences. Colored nodes stand forlabeled phases and gray nodes for inter-phases. The bottom levels of gray nodes are notdisplayed for visualization purposes.
model background and intermediary activities, which are also repetitive across instancesof the workflow.
Figure 7.5 also shows that the resulting initialization is obtained by replacing eachnode of this graph with a sub-HMM modeling the corresponding group of events, asin Section 6.2.2.2. Each sub-HMM is first initialized using the sub-sequences of datacorresponding to its label. We use a left-right model (see Section 6.2.1) with skip-one-ahead transitions and mixtures of two gaussians to model the continuous observations.The number of states is defined based on the average-length of the sub-sequences and thetransition probabilities are set so that the expected duration corresponds to the durationof the phase. The mixtures are initialized by using k-means from their respective dataafter splitting temporally the training subsequences in as many chunks as available statesin the sub-model. Each sub-HMM is finally trained independently with EM on the sub-sequences.
7.3.2 Training and Recognition
To train the model, we use EM and the refinement of phase probabilities after EM asdescribed in the previous chapter in Section 6.2.2.4. The computation of the annotationfunction
POtest : 1, . . . , T → L (7.11)
for a test surgery Otest, both off-line and on-line, is also done as presented in Section 6.3.
7.4 Evaluation
In the experiments, we use a data-set composed of a series of 22 videos (illustrated inFigure 3.11 on page 40) of 3D volumetric reconstructions of resolution 128x128x128. Weperformed the recordings in a mock-up OR as described in Section 3.2.2.2. The numberof occurrences of each phase within our dataset is indicated in the second column of Table
94

7.4 Evaluation
Accuracy (%) Average Recall (%) Average Precision (%)
Off-line 92.5 (±7.0) 92.2 (±5.4) 89.9 (±8.4)On-line 89.2 (±5.5) 87.8 (±5.2) 85.3 (±7.2)
Table 7.1: On-line results and off-line results for AWHMMs. Mean and standard deviationover 22 sequences using leave-one-out cross-validation.
7.2. We evaluate the phase recognition results both on-line and off-line. In a first set ofexperiments, we present general results and compare the two features. Then, using thiscomplex dataset containing alternative paths and continuous observations, we illustratethe effect of the training process on phase probabilities, especially in case of partial la-beling. Finally, we show the importance of incorporating the temporal constraints of theworkflow within the model to obtain better recognition rates.
In practice, we use a dodecahedron with 12 bins for the quantization. Both for occu-pancy and motion features, the volume is split into a grid of 3 × 3 × 2 cells and we setσi = si ∗ 0.6, where si is the average spacing between cell ci and its neighbors (see section7.2.1). The resulting observations vectors, obtained by vectorization of the histograms,are passed as observations O1:T to the recognition system after dimensionality reductionusing PCA. For evaluation, we perform a full cross-validation. The presented results areaveraged over all tests performed with the leave-one-out method.
7.4.1 General Results
The overall results using motion features only are presented in Table 7.1. They showslightly inferior recognition rates on-line than off-line. On-line results for each phase aregiven in table 7.2. This table shows reliable detection using 3D-flow, except for phase5. Interestingly, this phase corresponds to an emergency, which is actually defined as ananomaly in our workflow. Indeed, it consists of the accelerated performance of the firstpreparation phases and only occurs 4 times in our dataset. When wrongly detected, itis recognized as these similar phases. Standard deviations in the precision measures arehigher in the presence of alternatives, since the beginning of the phases are ambiguous,also compared to the background phase.
The occupancy features appear to be less discriminative, especially because in manyphases, the actors are at similar places. For comparison, the recognition rates usingoccupation features only or using a combination of occupation and motion features arepresented in Table 7.3.
7.4.2 Partial Labeling
The phase probabilities are used in general to attach semantic information to themodel. Their utility to track semantic shift during training appears in particular inexperiments conducted with sub-sets of annotated sequences and sub-sets of the labeledphases to be recognized.
95

Monitoring Workflows using 4D Features
Phase # Recall (%) Precision (%)
B Background 22 91.1 (±5.4) 85.7 (±6.7)1 Patient Entering 18 86.0 (±8.3) 76.0 (±38.0)2 Anesthesy Cont. 5 86.2 (±9.0) 96.8 (±5.7)3 Patient Prep. 18 86.5 (±16.9) 89.6 (±22.0)4 Surgeon Prep. 18 89.7 (±11.3) 94.6 (±4.5)5 Emergency 4 15.8 (±12.5) 91.4 (±14.8)6 Min. Invasive 11 85.7 (±10.3) 76.9 (±41.7)7 Open Surgery 15 89.3 (±14.1) 68.8 (±41.4)8 Suturing 22 87.3 (±10.5) 86.1 (±11.9)9 Patient Leaving 22 94.8 (±3.5) 87.2 (±10.9)10 Cleaning 22 96.0 (±7.1) 99.0 (±1.7)
Table 7.2: On-line results presented per phase using AWHMMs. Mean and standarddeviation over 22 sequences using leave-one-out cross-validation. Column Phase indicatesthe phase label, as in Figure 3.9. B stands for the phase modeling background activity.Column # shows the number of occurrences of each phase within the dataset.
Accuracy (%) Average Recall (%) Average Precision (%)occ occ+mot occ occ+mot occ occ+mot
Off-line 47.4 89.8 41.9 86.8 50.5 84.7On-line 61.8 85.2 53.4 80.5 64.0 82.8
Table 7.3: On-line and off-line results, using occupancy features (occ) and both oc-cupancy and motion features (occ+mot). Mean over 22 sequences using leave-one-outcross-validation. Results for motion features only are presented in Table 7.1.
96

7.4 Evaluation
Accuracy (%) Average Recall (%) Average Precision (%)
Off-lineNO 90.5 (±13.1) 88.4 (±18.2) 87.4 (±18.6)EM 86.6 (±13.9) 84.8 (±16.2) 73.9 (±22.4)PV 92.9 (±6.2) 91.3 (±9.1) 75.8 (±15.6)
On-lineNO 78.6 (±12.2) 70.5 (±16.4) 66.7 (±19.3)EM 80.7 (±9.5) 75.3 (±12.7) 71.5 (±13.4)PV 84.2 (±6.7) 78.8 (±10.7) 74.8 (±11.9)
Table 7.4: Results in percent using solely labels 3, 6, 7 and 8. Mean and standarddeviation over all sequences using leave-one-out cross-validation. Comparison on-line andoff-line, without EM (NO), with EM only (EM) and with EM followed by recomputationof phase probability variables (PV).
Figure 7.6 shows the influence of EM training and of phase probabilities. We see thatperforming the phase probability computation after EM training improves the results.Additionally, this figure shows how the overall results vary depending on the percentage oflabeled sequences available in the training set. For this experiment, results were computedfrom a single random split of the sequences into training and test data for each number oflabeled sequences and cross-validation test. Results are expected to get smoother if theyare averaged on all the possible subsets.
Results using only a subset of the labels are shown in Table 7.4 . In this experiment,only four labels are available in the training sequences, corresponding to phases 3, 6, 7 and8. Phase probabilities also improve significantly the results, the means and the standarddeviations, as a semantic shift during EM can easily occur in the long background phases.
7.4.3 Temporal Constraints
To illustrate the importance of considering the temporal constraints of the workflowwith alternative paths, we compare AWHMM with two methods that do not use theseconstraints. In the first method used for comparison, named MAP-HMMs, all phases aremodeled independently by different HMMs trained on sub-windows of the data. Maximumlikelihood classification is performed at each time-step using a sliding-window. There istherefore no distinction between off-line and on-line for this approach. In the secondmethod, the sub-HMMs modeling all phases are arranged in parallel and connected viaanother sub-HMM modeling background activity, as shown in Figure 7.7. We use thisform of connections instead of fully inter-connected HMMs, having a single or multipleHMMs modeling the background activities, since it showed better results. We call thisapproach CO-HMMs.
As can be seen in Table 7.5, AWHMM outperforms both CO-HMMs and MAP-HMMsapproaches, showing the importance of using all information provided by the annotation.A difficulty when performing on-line recognition with MAP-HMMs on phases with highlyvarying lengths, is the choice of the window size. We performed experiments with dif-ferent sizes but could not match the results of the two other approaches. CO-HMMs
97

Monitoring Workflows using 4D Features
Figure 7.6: Precision and Recall of AWHMMs as a function of the percentage of annotatedsequences in the training set. On-line results before EM (none), after global EM (EM)and after global and computation of phase variables (EM+PV). Mean over all sequencesusing leave-one-out cross-validation.
perform worse than AWHMM as they are less constrained and do not take advantage ofall temporal relationships. An additional disadvantage of CO-HMMs are the numerousshort and incorrect transitions that occur both off-line and on-line. This effect also occurson-line for AWHMMs, but in a much smaller scale, as shown in Figure 7.8. This figureshows the number of transitions occurring between all pairs of phases during a completecross-validation test. Self-transitions on the diagonal were removed for better visualiza-tion and the background phase is not taken into account. CO-HMMs produce 4 timesmore short incorrect transitions than AWHMMs.
7.5 Conclusion
In this chapter, we have given a simple but effective way to initialize a AWHMM fromthe labeling of a small set of training data. It was demonstrated on continuous datafrom a workflow containing alternative paths of activities. An interesting future work isto automatically discover the topology of the workflow from the available data withoutusing the labeling information, similarly to the workflow mining application presentedin Section 6.6.3. Initial work in this direction using continuous data can be found in
98

7.5 Conclusion
Accuracy (%) Average Recall (%) Average Precision (%)AW CO MA AW CO MA AW CO MA
Off-line 92.5 79.4 70.5 92.2 80.7 63.6 89.9 72.8 53.5On-line 89.2 78.2 70.5 87.8 79.5 63.6 85.3 62.3 53.5
Table 7.5: Summarized results, comparing AWHMMs (AW), CO-HMMs (CO) and MAP-HMMs (MA), on-line and off-line, using EM and computation of phase probabilities.Mean over 22 sequences using leave-one-out cross-validation.
1
2
3
45 6
7
8
910
. . .
10
. . .
. . .
. . .
. . .
. . . . . .
. . .
. . .
. . .
. . .
Figure 7.7: Parallel structure of CO-HMMs, where all phases are interconnected throughthe background phase.
[Brand and Kettnaker, 2000, Xie et al., 2004]. These methods will have to be adapted,implemented and experimented on relevant surgical signals.
We have also presented 4D features that can be used for workflow recognition insidecomplex scenes observed by a multi-camera reconstruction system. 3D motion flow yieldedgood results in our experiments. The approaches have been designed as a proof of concept.The major challenge to be tackled for such a direction, to become effective in the realintervention room, is the obtention of a good reconstruction under real clinical conditions.Indeed, additional issues such as highlights, shadows and systems permanently presentin the room have to be taken into account. The sequences acquired in real conditionswill also bring additional challenges, such as broader variations and more exceptions inthe activities. The experiments presented in this chapter show that reconstruction dataprovides interesting input signals for surgical workflow analysis.
99

Monitoring Workflows using 4D Features
Figure 7.8: Occurring phase transitions, on-line, for AWHMMs and CO-HMMs. Whitecolor means absence of transition. The diagonal has been removed for better visualisation.Mean over all sequences using leave-one-out cross-validation.
100

Part III
Outlook and Conclusion
101


CHAPTER 8
Conclusion
In this chapter, we summarize the achievements presented within the dissertation. Wealso discuss the current limitations and present several ideas for future work aiming atrecognizing activities within surgical workflow.
8.1 Summary
This dissertation has addressed a novel research field, namely the problem of recog-nizing activities inside the workflow taking place in Operating Rooms. This is highlymotivated by the increasing complexity of ORs, due to the rapid development and intro-duction of new and high-tech surgical systems, and by the need to optimize the workflow.Using signals acquired in the OR, robust workflow activity recognition will permit the de-velopment of new assistance systems for the OR and the department of surgery. Examplesof applications are context-aware support, for assistance to the surgical staff and easiermonitoring and scheduling inside the department of surgery, automatic report generationand workflow optimization.
Operating rooms bring several new specificities and challenges to the activity recog-nition problem. Due to sterility requirements, safety standards and the fact that the ORworkflow should not be modified or impaired, restrictions apply with respect to the kindof sensory information that can be used. Furthermore, the crowded environment, thesmall field of operation, the similar clothes and the changing lighting conditions bringadditional difficulties for purely vision-based solutions.
Nonetheless, the operating room is getting increasingly high-tech and digital. Thus,there is little doubt about the fact that every activity performed in the OR will soon besensed by some signal. Moreover, certain constraints, such as the strict and repetitiveoverall workflow in regular surgeries, can be used to facilitate the recognition task.
In this work, we layed some foundations towards recognition in the operating room andthe use of workflow constraints in the modeling of the problem. We represented surgeries
103

Conclusion
in terms of multidimensional signals acquired over time and considered recognition in thesurgical workflow as a learning problem based on previously acquired surgeries. First,we proposed to model the entire workflow within a single model, an annotated averagesurgery representation or an annotated workflow hidden Markov model, both containingphase probability variables to attach semantic information. The introduction of thesevariables allowed us to conveniently cope with model construction and training underpartial labeling. They also prevent semantic information from getting blurred duringtraining.
Second, we addressed two complementary applications: recognition inside a laparo-scopic surgery and recognition inside a daily OR workflow. For each of these applications,we proposed specific signal representations. In the Cholecystectomy application, we modelthe activity by using instrument usage information. Recordings from real Cholecystec-tomy were used to demonstrate the concept. In the OR workflow application, we use3D reconstruction data obtained from a real-time multi-camera system. The data wasobtained by simulating an OR workflow containing alternative paths of activities in amock-up OR. This is the first work that uses reconstruction data and 3D motion flow forthe recognition of complex activities.
For both applications, we provided on-line and off-line recognition results. We alsointroduced several applications, such as the simultaneous replay and synchronisation ofsurgeries performed on different patients, the drafting of a surgical report and the predic-tion of remaining operating time.
Finally, we presented several efforts towards the automatic acquisition of additionalsignals in the OR: endoscopic tool signals using a vision-based approach relying on atrocar-camera and surgeon’s hand movements using inertial sensors (appendix A).
8.2 Discussion and Future Work
The applications we have targeted have been largely determined by the availabilityof signals permitting regular recordings. Despite the interest and collaboration of oursurgical partners, our cholecystectomy recordings have been fairly time-consuming andnot all available signals could be obtained. For the study of other surgical workflows,future work has to focus on an easier and more automatic acquisition system that can beintegrated in the OR and easily started when the patient is introduced. Additionally, forthe demonstration of a recognition system during real surgeries, it is necessary that toolusage information and other informative signals become available in real-time. Ideally,further research towards a cognitive operating room will be facilitated by open standardsand a fully digital Operating Room of the Future.
Obtaining real-time reconstruction data from the OR also faces important challenges.Indeed, the algorithm will have to cope with the reflective surfaces and illuminationchanges. Moreover, the permanent devices stationed in the room need to be includedwithin the reconstruction. These difficulties could be alleviated by the complementaryusage and fusion of time-of-flight camera information.Our 4D features were based on motion computed from the visual hulls. It will be in-teresting to use textured reconstruction data for the computation of new 4D features
104

8.2 Discussion and Future Work
incorporating color information. Such data should be available in real-time soon. Fur-thermore, during real surgeries, reconstruction data shall in the end be only one part ofthe information. Recognition will highly benefit from the usage of the multiple availablesignals.
The methods that have been proposed for constructing the AVSR and AWHMM mod-els all require supervision, since they need semantic information provided by the labeleddata. Results however show that only a subset of the data needs to be labeled. A practicalapproach for the OR would be to label incrementally and at regular intervals parts of thenew surgeries. Labeling should focus on phases that receive lower recognition accuracythan required by the application. In particular, in case the system is used by surgeonsfrom different surgical schools, training data from the different surgeons is required, sincethe models can only recognize what has been learnt.In order to more finely model differences inside phases or between surgeons, the hiddenMarkov models could be extended with further hierarchies and latent nodes. To avoidthe tedious task of very finely labeling the data for training these bigger models, struc-ture discovery approaches will need to be developped for the identification and modelingof these differences. Additionally, even though the models cope with variations in thesurgical performance, novel phases cannot be recognized and are associated to the mostprobable existing phase. Discovering novel phases and anomalies, off-line and especiallyon-line by analysing the models’ output, would be an interesting extension to this work.
The addition of novel semantic labels naturally creates alternative paths of activitiesin the workflow. The AWHMM approach then becomes indicated for recognition. But,where synchronization makes sense, for instance between common subparts of surgeriesor between surgeries that follow the same workflow path, the AVSR approach can also beapplied. This can yield more precise results by using only corresponding subsets of thedata, e.g. identified with the AWHMM approach. For instance, to replay simultaneouslytwo surgeries which do not exactly follow the same workflow path, AWHMMs can beapplied to detect the common parts and also to find other surgeries following the samepaths. The AVSR approach can then be used on this data for meaningful synchronization.
In this initial work, the modeling of the workflow has been designed for the on-linerecognition of phases provided by an expert. While this level of semantic informationalready permits the development of interesting medical applications, larger semantic de-scriptions of surgical workflows already exist, which include different levels of granularity.Future research should focus on combining these descriptions with a statistical recogni-tion model and with appropriate signals, so as to deliver recognition of additional andpossibly finer events that can also occur simultaneously. Conversely, methods for struc-ture discovery, topology optimization and workflow mining out of OR signals have to beinvestigated. They could permit us to generate a better model initialization from a smallamount of data and also to refine and update the existing descriptions provided by expertswith respect to the workflow effectively taking place in the OR. Extending the AWHMMswith respect to these two aspects, incorporation of finer medical semantic information anddiscovery of the internal structure of the surgical data, should be a main future direction.
In addition to recognition in the workflow, techniques have to be developed in parallelto identify all objects and persons present in the OR. This is a complementary objective,
105

Conclusion
as recognition in the workflow would highly benefit from additional signals. Reciprocally,disambiguation in the identification process could be achieved using the workflow context.Fusing information from the different systems together with the context would help inthis regard. For instance, workflow phase information combined with RFID informationabout the staff present in the room could result in identifying the role and location of thepersons located within the reconstruction volume.
Finally, a recognition system will have little impact on the workflow within the surgeryroom if not completed by the right interaction mechanisms. Multimedia user interfacesneed to be designed and accessible to all personnel, taking into account the specificitiesof each kind of surgery. Integrated OR suites, as already provided by several companies,are the ideal testbed for the development of such advanced context-sensitive support.
106

Part IV
Appendix
107


APPENDIX A
Discovering a Surgical Vocabulary from Inertial Sensor Data
In the previous chapters, we have either used signals from tool usage or from recon-struction data. Tool usage captured activities within a surgical workflow, while recon-struction data captured the overall activity of the surgery room. We have investigatedanother potential source of information: accelerometer data from sensors attached to thewrists and the waist of the surgeon. We present here briefly some early work and ideasfor these signals, published in [Ahmadi et al., 2008, Ahmadi et al., 2009].
As the raw accelerometer data is unstructured, we have experimented an approach toautomatically discover a vocabulary of atomic activities from the signals. The objective isto reduce dimensionality by generating discrete signals with semantic information similarto the instrument usage out of this data. Using an automatic approach permits thegeneration of objective discrete signals without intensive labeling by an expert.
Besides the generation of supplementary signals that can be used for recognitionin a surgical workflow, discovering a motion vocabulary from raw data can be poten-tially beneficial to other tasks such as the evaluation of surgical skills. For instance, in[Lin et al., 2006] surgical gestures are identified by an expert to define words of a "lan-guage of surgery". This language is further used to segment a surgeon’s motions and toassess his skills. The automatic generation of an objective vocabulary from the data is astep towards the automatic definition of a motion "language" for each kind of surgery.
In section A.1, we present the introduction of inertial sensors in the surgery room. Insection A.2, we present an approach from the motif discovery community that we appliedon surgical data recorded in the context of the percutaneous vertebroplasties.
109

Discovering a Surgical Vocabulary from Inertial Sensor Data
Figure A.1: (Left) Attachment of the inertial sensors with bandages. (Right) Setup duringa vertebroplasty procedure.
A.1 Inertial Sensors in the OR
For the recordings, we used three 3D actibelt accelerometers designed by the SylviaLawry Centre for Multiple Sclerosis Research 1. These accelerometers are light, wireless,compact and have a sampling rate of 100Hz. The acquired data is stored in the internalmemory of the sensor and can in our case be retrieved after the surgery. For on-line dataprocessing and analysis, wireless transmission of the data would be required. Convenientlight-weight sensors with wireless transmission are for example available from the companyIntersense 2.
An inertial sensor was fixed on the waist of the surgeon using a belt. To attach thesensors on his wrists, we used sterilizable TG tube bandages as displayed in Figure A.1.The sensors were fixed over the sterile bandages with Velcro fasteners. The sides of thebandages were then folded around the sensors. This setup is performed right before thesurgeon puts on the surgical coat and the latex gloves over it. This protocol permittedus to ensure the sterility requirements and only introduced a quick additional step in theprocedure’s workflow.
We recorded several laparoscopic surgeries and percutaneous vertebroplasty proce-dures under these conditions. The setup was reported as comfortable by the surgeons.In the following, we present early experiments of automatic vocabulary generation in thepercutaneous vertebroplasty procedure. This surgical intervention consists of the repairof a damaged vertebra by introduction of cement through a needle [Predey et al., 2002].This is achieved under visual guidance and control with CT scans.
1. http://www.slcmsr.net/
2. http://www.intersense.com/
110

A.2 Vocabulary Generation
A.2 Vocabulary Generation
We consider a motion vocabulary to be interesting if its elements occur within almostall surgeries in the training set. For this reason, we search for similar temporal patternsoccuring repetitively across the datasets. In the motif discovery community, such patternsare called motifs [Keogh and Lin, 2005]. Motifs can be seen as clusters in the space oftime-series subsequences, using a time-invariant distance.
To discover a surgical vocabulary, we used an algorithm called subsequence densityestimation [Minnen et al., 2007]. It permits the unsupervised identification of motifs andhas been successfully used on accelerometer data [Minnen et al., 2006]. In our experi-ments, we search for motifs by enforcing the condition that instances are present in alldatasets. The algorithm permitted the automatic selection of meaningful patterns fromthe data. Semantic was attached to these motions by labeling one instance of each motifusing the corresponding video data. Interesting motions in the procedure are for instanceidle, tool change, needle positioning, hammering, cement stirring, syringe filling, applyingsyringe.
We achieved promising results on data simulated on a phantom vertebra, where mostinteresting motifs were discovered. Up to now, only three real surgeries could be recorded.For this reason results on real data are poor. Additional data is required to cope withthe motion variability. To validate the discovery of the vocabulary, we therefore recordeddata of simulated surgeries. The discovered motifs were used to train an Hidden MarkovModel for each motion. The resulting HMMs were finally applied for the redetection ofthese motions in surgeries that were not used in the motif discovery dataset. For six ofthe interesting motions, including hammering, stirring, putting off vest, cross-validatedresults yielded detection accuracies above 70%. These detections could be used in futurework to provide intermediate signals. Further details on the results and experiments canbe found in [Ahmadi, 2008, Rybachuk, 2009].
A.3 Conclusion
The definition of an intermediate language of activities is an interesting future di-rection for the dimensionality reduction and interpretation of unstructured data. Theunsupervised generation of the vocabulary can in our case permit the generation ofadditional discrete signals for recognition. It could also be used for skills assessment[Lin et al., 2006] or database queries [Ikizler and Forsyth, 2008]. While our early exper-iments are promising in the sense that meaningful patterns can be discovered in thesimulated surgical data, a larger dataset of real data is required for further validation.Furthermore, the algorithms are computationally expensive. This is a shortcoming asmuch data processing is required in order to cope with variations and surgeons’ specifici-ties. A practicable approach for vocabulary discovery in the data of complete surgeriesneeds to be scalable. Other unsupervised clustering techniques for time-series, for instancebased on HMMs [Xie et al., 2004] or using embedded spaces, like spatio-temporal-isomaps[Jenkins and Matarić, 2004], could also be investigated.
111

Discovering a Surgical Vocabulary from Inertial Sensor Data
112

APPENDIX B
Examples of Surgical Reports for Laparoscopic Cholecystectomy
Figures B.1 and B.2 in the next pages show two surgical reports written by surgeonsfrom Hospital Rechts der Isar, Munich. Using the recognition methods developed in PartII, drafts from such reports could be generated automatically to include objective andquantitative information about the performance of the surgery, such as the beginning ofthe phases and the usage of the instruments. The surgeon would then only need to verifyand to add complementary information to the report. Such information especially includethe specific medical characteristics of each case. This is a next step of interesting futurework.
113

Examples of Surgical Reports for Laparoscopic Cholecystectomy
Figure B.1: Surgical report of a laparoscopic cholecystectomy.114

Figure B.2: Surgical report of a laparoscopic cholecystectomy.115

Examples of Surgical Reports for Laparoscopic Cholecystectomy
116
APPENDIX C
List of Abbreviations
ADTW Adaptive Dynamic Time WarpingAR Augmented RealityAVSR Annotated Virtual Surgery RepresentationAWHMM Annotated Workflow Hidden Markov ModelCT Computed TomographyDBN Dynamic Bayesian NetworkDICOM Digital Imaging and COmmunications in MedicineDTW Dynamic Time WarpingEM Expectation MaximizationEMR Electronic Medical RecordESS Expected Sufficient StatisticsGMM Gaussian Mixture ModelGPU Graphics Processing UnitHMM Hidden Markov ModelMAP Maximum A PosterioriMRI Magnetic Resonance ImagingOR Operating RoomORF Operating Room of the FuturePACS Picture Archiving and Communication SystemPCA Principal Component AnalysisPET Positron Emission TomographyRFID Radio Frequency IDentificationTIMMS Therapy Imaging and Model Management SystemUML Unified Markup Language
117

List of Abbreviations
118

APPENDIX D
List of Recurring Mathematical Notations
O Time series of observations representing a surgeryO Time series representing a virtual surgeryK Number of instruments used in the observation vectors of cholecystectomiesT Length of a time-seriesΩ Spatial area reconstructed by the 4D systemr Visual hullv Voxel positionp Phase labelL Set of phase labelsP Labeling function, associating a phase label to each time-step of a time-series#· Cardinality operatorl Number of training sequencesP Time series representing a phaseP Time series representing a virtual phaseξ The annotation of an AVSRX Random variable indicating the state of an HMMx HMM stateO Set of observationsO Observationλ Set of parameters of an HMMN Number of states of an HMMA Transition matrix of an HMMB Observation model of an HMMπ Initial probabilities of an HMMφ Phase variablessynci↔j Warping between two time-series as provided by DTW
119

List of Recurring Mathematical Notations
120
APPENDIX E
List of Publications
i. Padoy, N., Mateus, D., Weinland, D., Berger, M.-O., and Navab, N. Workflow moni-toring based on 3d motion features. In: Proceedings of the International Conferenceon Computer Vision (ICCV), Workshop on Video-oriented Object and Event Classi-fication. 2009.
ii. Pauly, O., Padoy, N., Poppert, H., Esposito, L., and Navab, N. Wavelet EnergyMap: A Robust Support for Multi-modal Registration of Medical Images. In: IEEEComputer Society Conference on Computer Vision and Pattern Recognition (CVPR).pages 2184-2191. 2009.
iii. Pauly, O., Padoy, N., Poppert, H., Esposito, L., Eckstein, H-H., and Navab, N. To-wards Application-specific Multi-modal Similarity Measures: a Regression Approach.In: MICCAI Workshop on Probabilistic Models for Medical Image Analysis (PM-MIA). 2009.
iv. Ahmadi, S.-A., Padoy, N., Rybachuk, K., Feussner, H., Heining, S. M., and Navab, N.Motif Discovery in OR Sensor Data with Application to Surgical Workflow Analysisand Activity Detection. In: MICCAI Workshop on Modeling and Monitoring ofComputer Assisted Interventions (M2CAI). 2009.
v. Radrich, H., Padoy, N., Ahmadi, S.-A., Feussner, H., Hager, G., Burschka, D., andKnoll, A. Synchronized Multimodal Recording System for Laparoscopic MinimallyInvasive Surgeries. In: MICCAI Workshop on Modeling and Monitoring of ComputerAssisted Interventions (M2CAI). 2009.
vi. Ahmadi, S.-A., Padoy, N., Heining, S. M., Feussner, H., Daumer, M., and Navab, N.Introducing wearable accelerometers in the surgery room for activity detection. In:7. Jahrestagung der Deutschen Gesellschaft für Computer-und Roboter-AssistierteChirurgie (CURAC). 2008.
vii. Blum, T., Padoy, N., Feussner, H., and Navab, N. Modeling and online recognitionof surgical phases using hidden markov models. In: International Conference on
121

List of Publications
Medical Image Computing and Computer-Assisted Intervention (MICCAI). pages627-635. 2008a.
viii. Traub, J., Ahmadi, S.-A., Padoy, N., Wang, L., Heining, S. M., Euler, E., Jannin, P.,and Navab, N. Workflow based assessment of the camera augmented mobile c-armsystem. In: MICCAI Workshop on Augmented environments for Medical Imagingincluding Augmented Reality in Computer-aided Surgery (AMIARCS). 2008.
ix. Padoy, N., Blum, T., Feussner, H., Berger, M.-O., and Navab, N. On-line recognitionof surgical activity for monitoring in the operating room. In: Proceedings of the20th Conference on Innovative Applications of Artificial Intelligence (IAAI). pages1718-1724. 2008.
x. Blum, T., Padoy, N., Feussner, H., and Navab, N. Workflow mining for visualizationand analysis of surgeries. International Journal of Computer Assisted Radiology andSurgery, 3(5):379-386. 2008b.
xi. Klank, U. F., Padoy, N., Feussner, H., and Navab, N. An automatic approach forfeature generation in endoscopic images. International Journal of Computer AssistedRadiology and Surgery, 3(3-4):331-339. 2008.
xii. Padoy, N., Blum, T., Essa, I., Feussner, H., Berger, M.-O., and Navab, N. A boostedsegmentation method for surgical workflow analysis. In: International Conferenceon Medical Image Computing and Computer-Assisted Intervention (MICCAI). pages102-109. 2007a.
xiii. Padoy, N., Horn, M., Feussner, H., Berger, M.-O., and Navab, N. Recovery of surgicalworkflow: a model-based approach. In: International Journal of Computer AssistedRadiology and Surgery (CARS), Supplement 1. 2:481- 482. 2007b.
xiv. Groher, M., Jakobs, T. F., Padoy, N., and Navab, N. Planning and intraoperative vi-sualization of liver catheterizations: New cta protocol and 2d-3d registration method.Academic Radiology, 14:1324-1339. 2007.
xv. Cohen, J., Jeannot, E., Padoy, N., and Wagner, F. Messages scheduling for par-allel data redistribution between clusters. IEEE Trans. Parallel Distrib. Syst.,17(10):1163-1175. 2006.
xvi. Groher, M., Padoy, N., Jakobs, T. F., and Navab, N. New cta protocol and 2d-3dregistration method for liver catheterization. In: International Conference on MedicalImage Computing and Computer-Assisted Intervention (MICCAI). (1):873-881. 2006.
xvii. Groher, M., Jakobs, T. F., Padoy, N., and Navab, N. Towards a feature-based 2d-3dregistration method of cta and 2d angiograms for liver tumor chemoembolizations.In: 4. Jahrestagung der Deutschen Gesellschaft für Computerund Roboter-AssistierteChirurgie (CURAC). 2005.
xviii. Cohen, J., Jeannot, E., and Padoy, N. Messages scheduling for data redistributionbetween clusters. In: 5th International Conference on Parallel Processing and AppliedMathematics (PPAM). pages 896-906. 2003.
122

APPENDIX F
Abstract of Major Publications Not Discussed in this Thesis
Towards Application-specific Multi-modal Similarity Measures:a Regression Approach
Olivier Pauly, Nicolas Padoy, Holger Poppert, Lorena Esposito, Hans-Henning
Eckstein and Nassir Navab
In multi-modal registration, similarity measures based on intensity statistics are the cur-rent standard for aligning medical images acquired with different imaging systems. Infact, the statistical relationship relating the intensities of two multi-modal images is con-strained by the application, defined in terms of anatomy and imaging modalities. In thispaper, we present the benefits of exploiting application-specific prior information con-tained in one single pair of registered images. By varying the relative transformationparameters of registered images around the ground truth position, we explore the man-ifold described by their joint intensity distributions. An adapted measure is fitted usingsupport vector regression on the training set formed by points on the manifold and theirrespective geometric errors. Experiments are conducted on two different pairs of modali-ties, MR-T1/MR-TOF and MR-T1/SPECT. We compare the results with those obtainedusing mutual information and Kullback-Leibler distance. Experimental results show thatthe proposed method presents a promising alternative for multi-modal registration.
Wavelet Energy Map: A Robust Support for Multi-modal Reg-istration of Medical Images
Olivier Pauly, Nicolas Padoy, Holger Poppert, Lorena Esposito, and Nassir
Navab
Multi-modal registration is the task of aligning images from an object acquired with dif-ferent imaging systems, sensors or parameters. The current gold standard for medicalimages is the maximization of mutual information by computing the joint intensity dis-tribution. However intensities are highly sensitive to various kinds of noise and denoising
123

Abstract of Major Publications Not Discussed in this Thesis
is a very challenging task often involving a-priori knowledge and parameter tuning. Wepropose to perform registration on a novel robust information support: the wavelet energymap, giving a measure of local energy for each pixel. This spatial feature is derived fromlocal spectral components computed with a redundant wavelet transform. The multi-frequential aspect of our method is particularly adapted to robust registration of imagesshowing tissues, complex textures and multiple interfaces. We show that the wavelet en-ergy map approach outperforms the classical framework in rigid registration experimentson synthetic, simulated and real data, whether noise is present or not.
New CTA Protocol and 2D-3D Registration Method for LiverCatheterization
Martin Groher, Nicolas Padoy, Tobias F. Jakobs, and Nassir Navab
2D-3D registration for angiographic liver interventions is an unsolved problem mainly be-cause of two reasons. First, a suitable protocol for Computed Tomography Angiography(CTA) to contrast liver arteries is not used in clinical practice. Second, an adequate regis-tration algorithm which addresses the difficult task of aligning deformed vessel structureshas not been developed yet. We address the first issue by introducing an angiographic CTscanning phase and thus create a strong link between radiologists and interventionalists.The scan visualizes arteries similar to the vasculature captured with an intraoperativeC-arm acquiring Digitally Subtracted Angiograms (DSAs). Furthermore, we propose aregistration algorithm using the new CT phase that aligns arterial structures in two steps:a) Initialization of one corresponding feature using vessel diameter information, b) opti-mization on three rotational and one translational parameter to register vessel structuresthat are represented as centerline graphs. We form a space of good features by iterativelycreating new graphs from projected centerline images and by restricting the correspon-dence search only on branching points (the vertices) of the vessel tree. This algorithmshows good convergence and proves to be robust against deformation changes, which isdemonstrated through studies on one phantom and three patients.
124

References
[Agarwal et al., 2007] Agarwal, S., Joshi, A., Finin, T., Yesha, Y., and Ganous, T. 2007.A pervasive computing system for the operating room of the future. Mobile Networksand Applications, 12(2-3):215–228.
[Aggarwal and Cai, 1999] Aggarwal, J. K. and Cai, Q. 1999. Human motion analysis: Areview. Computer Vision Image Understanding Journal (CVIU), 73:90–102.
[Ahmadi, 2005] Ahmadi, A. 2005. First steps towards monitoring and recovery of surgicalworkflow. Bachelor Thesis. Technische Universität München.
[Ahmadi, 2008] Ahmadi, A. 2008. Discovery and detection of surgical activity in percu-taneous vertebroplasty. Diploma Thesis. Technische Universität München.
[Ahmadi et al., 2008] Ahmadi, S.-A., Padoy, N., Heining, S. M., Feussner, H., Daumer,M., and Navab, N. 2008. Introducing wearable accelerometers in the surgery room foractivity detection. In: 7. Jahrestagung der Deutschen Gesellschaft für Computer-undRoboter-Assistierte Chirurgie (CURAC 2008), Leipzig, Germany.
[Ahmadi et al., 2009] Ahmadi, S.-A., Padoy, N., Rybachuk, K., Heining, S. M., Feussner,H., and Navab, N. 2009. Motif discovery in or sensor data with application to sur-gical workflow analysis and activity detection. In: MICCAI Workshop on Modelingand Monitoring of Computer Assisted Interventions (M2CAI), London, GB. MICCAISociety.
[Ahmadi et al., 2006] Ahmadi, S.-A., Sielhorst, T., Stauder, R., Horn, M., Feussner, H.,and Navab, N. 2006. Recovery of surgical workflow without explicit models. In: Inter-national Conference on Medical Image Computing and Computer-Assisted Intervention(MICCAI). pages 420–428.
[Bao and Intille, 2004] Bao, L. and Intille, S. S. 2004. Activity recognition from user-annotated acceleration data. Pervasive 2004, pages 1–17.
[Bar-Or et al., 2004] Bar-Or, S. A., Bar-or, A., Goddeau, D., Healey, J., Kontothanassis,L., Logan, B., Nelson, A., and Thong, J. V. 2004. Biostream: A system architecturefor real-time processing of physiological. In: Proc. of IEEE Engineering in Medicineand Biology Society. Springer, pages 3101–3104.
125

References
[Bardram, 2004] Bardram, J. E. 2004. Applications of context-aware computing in hospi-tal work: examples and design principles. In: SAC ’04: Proceedings of the 2004 ACMsymposium on Applied computing, New York, NY, USA. ACM, pages 1574–1579.
[Barron, 2004] Barron, J. L. 2004. Experience with 3d optical flow on gated mri cardiacdatasets. In: Canadian Conference on Computer and Robot Vision. pages 370–377.
[Barron and Thacker, 2005] Barron, J. L. and Thacker, N. 2005. Tutorial: Computing2d and 3d optical flow. In: Tina Memo No. 2004-012.
[Berci et al., 2004] Berci, G., Phillips, E. H., and Fujita, F. 2004. The operating room ofthe future: what, when and why? Surgical Endoscopy, 18(1):1–5.
[Bhatia et al., 2007] Bhatia, B., Oates, T., Xiao, Y., and Hu, P. 2007. Real-time identifi-cation of operating room state from video. In: Proceedings of the 19th Conference onInnovative Applications of Artificial Intelligence (IAAI). pages 1761–1766.
[Blum, 2007] Blum, T. 2007. Surgical workflow analysis: Representation and applicationto monitoring. Diploma Thesis. Technische Universität München.
[Blum et al., 2008a] Blum, T., Padoy, N., Feussner, H., and Navab, N. 2008a. Modelingand online recognition of surgical phases using hidden markov models. In: Interna-tional Conference on Medical Image Computing and Computer-Assisted Intervention(MICCAI), New York, USA. pages 627–635.
[Blum et al., 2008b] Blum, T., Padoy, N., Feussner, H., and Navab, N. 2008b. Workflowmining for visualization and analysis of surgeries. International Journal of ComputerAssisted Radiology and Surgery, 3(5):379–386.
[Bobick, 1997] Bobick, A. 1997. Movement, activity, and action: The role of knowledgein the perception of motion. Proceedings of the Royal Society, 352:1257–1265.
[Bobick and Davis, 2001] Bobick, A. F. and Davis, J. W. 2001. The recognition of humanmovement using temporal templates. IEEE Transactions on Pattern Analysis andMachine Intelligence, 23(3):257–267.
[Brand and Kettnaker, 2000] Brand, M. and Kettnaker, V. 2000. Discovery and segmen-tation of activities in video. IEEE Trans. Pattern Analysis and Machine Intelligence(PAMI), 22(8):844–851.
[Brand et al., 1997] Brand, M., Oliver, N., and Pentland, A. 1997. Coupled hiddenmarkov models for complex action recognition. In: IEEE Conf. on Computer Visionand Pattern Recognition (CVPR), Washington, DC, USA. IEEE Computer Society,page 994.
[Bravo et al., 2008] Bravo, J., Hervás, R., Gallego, R., Casero, G., Vergara, M., Carmona,T., Fuentes, C., Gachet, D., Nava, S., Chavira, G., and Villarreal, V. 2008. Identifica-tion technologies to support alzheimer contexts. In: PETRA ’08: Proceedings of the 1stinternational conference on PErvasive Technologies Related to Assistive Environments,New York, NY, USA. ACM, pages 1–2.
[Brdiczka et al., 2007] Brdiczka, O., Crowley, J. L., and Reignier, P. 2007. Learning sit-uation models for providing context-aware services. In: Human-Computer Interaction(6). pages 23–32.
126

References
[Bremond et al., 2006] Bremond, F., Thonnat, M., and Zuniga, M. 2006. Video under-standing framework for automatic behavior recognition. Behavior Research Methods,3(38):416–426.
[Bucher et al., 2009] Bucher, P., Pugin, F., Buchs, N., Ostermann, S., Charara, F., andMorel, P. 2009. Single port access laparoscopic cholecystectomy (with video). World J.Surg., 33(5):1015–1019.
[Burgert et al., 2007] Burgert, O., Neumuth, T., Gessat, M., Jacobs, S., and Lemke, H. U.2007. Deriving dicom surgical extensions from surgical workflows. In: SPIE MedicalImaging 2007, PACS and Imaging Informatics. 6516:651604.
[Burgert et al., 2006] Burgert, O., Neumuth, T., Lempp, F., Mudunuri, R., Meixens-berger, J., Strauss, G., Dietz, A., Jannin, P., and Lemke, H. U. 2006. Linking top-levelontologies and surgical workflows. In: International Journal of Computer AssistedRadiology and Surgery. 1(1):437–438.
[Cao et al., 1996] Cao, C. G. L., Mackenzie, C. L., and Payandeh, S. 1996. Task andmotion analyses in endoscopic surgery. In: 5th Annual Symposium on Haptic Interfacesfor Virtual Environment and Teleoperator Systems. pages 583–590.
[Chang et al., 2007] Chang, K.-H., Chen, M. Y., and Canny, J. 2007. Tracking free-weightexercises. In: International Conference on Ubiquitous Computing. pages 19–37.
[Chen et al., 2001] Chen, X., Barron, J. L., Mercer, R. E., and Joe, P. 2001. 3d regular-ized velocity from 3d doppler radial velocity. In: International Conference on ImageProcessing (ICIP). pages 664–667.
[Cleary et al., 2005] Cleary, K., Chung, H. Y., and Mun, S. K. 2005. Or 2020: Theoperating room of the future. Laparoendoscopic and Advanced Surgical Techniques,15(5):495–500.
[Darrell et al., 1996] Darrell, T., Essa, I. A., and Pentland, A. 1996. Task-specific ges-ture analysis in real-time using interpolated views. IEEE Trans. Pattern Analysis andMachine Intelligence (PAMI), 18(12):1236–1242.
[Darzi et al., 1999] Darzi, A., Smith, S., and Taffinder, N. 1999. Assessing operative skill:needs to become more objective. British Medical Journal, 318(7188):887–888.
[Davies, 2000] Davies, B. 2000. A review of robotics in surgery. Proceedings of the Insti-tution of Mechanical Engineers. Part H, Journal of engineering in medicine, 214(1):129–140.
[Dubois, 1993] Dubois, S. 1993. Cholécystectomie et exploration de la voie biliaire princi-pale par coelioscopie. Editions Techniques - Encycl. Med. Chir. (Paris, France), Tech-niques chirurgicales - Généralités-Appareil digestif, 40(950):1–17.
[Efros et al., 2003] Efros, A. A., Berg, A., Mori, G., and Malik, J. 2003. Recognizingaction at a distance. In: IEEE International Conference on Computer Vision (ICCV).pages 726–733.
[Egan and Sandberg, 2007] Egan, M. T. and Sandberg, W. S. 2007. Auto identificationtechnology and its impact on patient safety in the operating room of the future. SurgInnov, 14(1):41–50.
127

References
[Elgammal et al., 2003] Elgammal, A., Shet, V., Yacoob, Y., and Davis, L. S. 2003. Learn-ing dynamics for exemplar-based gesture recognition. In: IEEE Conf. on ComputerVision and Pattern Recognition (CVPR). pages 571–578.
[Favela et al., 2007] Favela, J., Tentori, M., Castro, L. A., Gonzalez, V. M., Moran, E. B.,and Martínez-García, A. I. 2007. Activity recognition for context-aware hospital ap-plications: issues and opportunities for the deployment of pervasive networks. Mob.Netw. Appl., 12(2-3):155–171.
[Feussner, 2003] Feussner, H. 2003. The operating room of the future: A view fromeurope. Surg Innov, 10(3):149–156.
[Feussner et al., 1991] Feussner, H., Ungeheuer, A., Lehr, L., and Siewert, J. 1991. Tech-nik der laparoskopischen cholezystektomie. Arch Chir, 376(6):367–374.
[Fishkin et al., 2004] Fishkin, K., Consolvo, S., Rode, J., Ross, B., Smith, I., , and Souter,K. 2004. Ubiquitous computing support for skills assessment in medical school. In: Ubi-health 2004: The 3rd Int’l Workshop Ubiquitous Computing for Pervasive HealthcareApplications.
[Freund and Schapire, 1995] Freund, Y. and Schapire, R. E. 1995. A decision-theoreticgeneralization of on-line learning and an application to boosting. In: EuroCOLT. pages23–37.
[Friedman et al., 2007] Friedman, D. C. W., Dosher, J., Kowalewski, T., Rosen, J., andHannaford, B. 2007. Automated tool handling for the trauma pod surgical robot. In:Proceedings of IEEE International Conference on Robotics and Automation (ICRA).pages 1936–1941.
[Friedman et al., 1998] Friedman, N., Murphy, K., and Russell, S. 1998. Learning thestructure of dynamic probabilistic networks. In: Uncertainty in Artificial Intelligence(UAI). Morgan Kaufmann, pages 139–147.
[Fukui et al., 2006] Fukui, S., Iwahori, Y., Itoh, H., Kawanaka, H., and R.Woodham2006. Robust background subtraction for quick illumination changes. In: Proceedingsof First Pacific-Rim Symposium on Image and Video Technology. pages 1244–1253.
[Ghahramani et al., 1997] Ghahramani, Z., Jordan, M. I., and Smyth, P. 1997. Factorialhidden markov models. In: Machine Learning. MIT Press.
[Ghodoussi et al., 2002] Ghodoussi, M., Butner, S. E., and Wang, Y. 2002. Roboticsurgery - the transatlantic case. In: Proceedings of IEEE International Conferenceon Robotics and Automation (ICRA). IEEE, pages 1882–1888.
[Grimson et al., 1998] Grimson, W. E. L., Stauffer, C., Romano, R., and Lee, L. 1998.Using adaptive tracking to classify and monitor activities in a site. In: IEEE Conf. onComputer Vision and Pattern Recognition (CVPR). pages 22–29.
[Guthart and Jr., 2000] Guthart, G. and Jr., J. K. S. 2000. The intuitivetm telesurgerysystem: Overview and application. In: Proceedings of IEEE International Conferenceon Robotics and Automation (ICRA). pages 618–621.
[Hamid et al., 2007] Hamid, R., Maddi, S., Bobick, A. F., and Essa, I. A. 2007. Structurefrom statistics: Unsupervised activity analysis using suffix trees. In: IEEE InternationalConference on Computer Vision (ICCV). pages 1–8.
128

References
[Hartley and Zisserman, 2004] Hartley, R. I. and Zisserman, A. 2004. Multiple ViewGeometry in Computer Vision. Cambridge University Press, ISBN: 0521540518, secondedition.
[Herfarth, 2003] Herfarth, C. 2003. ’lean’ surgery through changes in surgical workflow.British Journal of Surgery, 90(5):513–514.
[Horn and Schunck, 1980] Horn, B. K. and Schunck, B. G. 1980. Determining opticalflow. Technical report, Cambridge, MA, USA.
[Houliston and Parry, 2008] Houliston, B. and Parry, D. 2008. Sensors and insensibility:Monitoring anaesthetic activity with rfid. In: Health Informatics New Zealand, SeventhAnnual Conference and Exhibition.
[Hu et al., 2006] Hu, P. F., Xiao, Y., Ho, D., Mackenzie, C. F., Hu, H., Voigt, R., andMartz, D. 2006. Advanced visualization platform for surgical operating room coordi-nation: distributed video board system. Surg Innov, 13(2):129–135.
[Huynh et al., 2007] Huynh, T., Blanke, U., and Schiele, B. 2007. Scalable recognition ofdaily activities with wearable sensors. In: International Symposium on Location andContext Awareness. pages 50–67.
[Ikizler and Forsyth, 2008] Ikizler, N. and Forsyth, D. A. 2008. Searching for complexhuman activities with no visual examples. International Journal of Computer Vision,80(3):337–357.
[Jacques et al., 2007] Jacques, M., Bernard, D., Silvana, P., Arnaud, W., Didier, M.,Dimitri, C., and G., H. J. 2007. Surgery without scars : Report of transluminal chole-cystectomy in a human being. Archives of surgery, 142(9):823–827.
[James et al., 2007] James, A., Vieira, D., Lo, B. P. L., Darzi, A., and Yang, G.-Z. 2007.Eye-gaze driven surgical workflow segmentation. In: International Conference on Med-ical Image Computing and Computer-Assisted Intervention (MICCAI). pages 110–117.
[Jannin and Morandi, 2007] Jannin, P. and Morandi, X. 2007. Surgical models forcomputer-assisted neurosurgery. Neuroimage, 37(3):783–91.
[Jannin et al., 2001] Jannin, P., Raimbault, M., Morandi, X., and Gibaud, B. 2001. Mod-eling surgical procedures for multimodal image-guided neurosurgery. In: InternationalConference on Medical Image Computing and Computer-Assisted Intervention (MIC-CAI). pages 565–572.
[Jenkins and Matarić, 2004] Jenkins, O. C. and Matarić, M. J. 2004. A spatio-temporalextension to isomap nonlinear dimension reduction. In: ICML ’04: Proceedings of thetwenty-first international conference on Machine learning, New York, NY, USA. ACM,page 56.
[Juang, 1984] Juang, B.-H. 1984. On the hidden markov model and dynamic time warpingfor speech recognition – a unified view. AT and T Technical Journal, 63(7):1213–1243.
[Kassidas et al., 1998] Kassidas, A., MacGregor, J. F., and Taylor, P. A. 1998. Synchro-nization of batch trajectories using dynamic time warping. AIChE Journal, 44(4):864–875.
129

References
[Keogh and Lin, 2005] Keogh, E. and Lin, J. 2005. Clustering of time-series subsequencesis meaningless: implications for previous and future research. Knowledge and Informa-tion Systems, 8(2):154–177.
[Keogh and Ratanamahatana, 2005] Keogh, E. and Ratanamahatana, C. A. 2005. Exactindexing of dynamic time warping. Knowledge and Information Systems, 7(3):358–386.
[Kern et al., 2003] Kern, N., Schiele, B., and Schmidt, A. 2003. Multi-sensor activitycontext detection for wearable computing. First European Symposium on AmbientIntelligence, pages 220–232.
[Kidd et al., 1999] Kidd, C. D., Orr, R., Abowd, G. D., Atkeson, C. G., Essa, I. A.,MacIntyre, B., Mynatt, E. D., Starner, T., and Newstetter, W. 1999. The aware home:A living laboratory for ubiquitous computing research. In: CoBuild ’99: Proceedings ofthe Second International Workshop on Cooperative Buildings, Integrating Information,Organization, and Architecture, London, UK. Springer-Verlag, pages 191–198.
[Kläser et al., 2008] Kläser, A., Marszałek, M., and Schmid, C. 2008. A spatio-temporaldescriptor based on 3d-gradients. In: British Machine Vision Conference (BMVC).
[Klein and Huesman, 1997] Klein, G. J. and Huesman, R. H. 1997. A 3d optical flowapproach to addition of deformable pet volumes. In: NAM ’97: Proceedings of the1997 IEEE Workshop on Motion of Non-Rigid and Articulated Objects (NAM ’97),Washington, DC, USA. IEEE Computer Society, page 136.
[Ko et al., 2007] Ko, S.-Y., Kim, J., Lee, W.-J., and Kwon, D.-S. 2007. Surgery taskmodel for intelligent interaction between surgeon and laparoscopic assistant robot. In-ternational Journal of Assitive Robotics and Mechatronics, 8(1):38–46.
[Koile et al., 2003] Koile, K., Tollmar, K., Demirdjian, D., Shrobe, H., and Darrell, T.2003. Activity zones for context-aware computing. In: International Conference onUbiquitous Computing. Springer-Verlag, pages 90–106.
[Krause et al., 2003] Krause, A., Siewiorek, D. P., Smailagic, A., and Farringdon, J. 2003.Unsupervised, dynamic identification of physiological and activity context in wearablecomputing. In: ISWC ’03: Proceedings of the 7th IEEE International Symposium onWearable Computers, Washington, DC, USA. IEEE Computer Society.
[Ladikos et al., 2008a] Ladikos, A., Benhimane, S., and Navab, N. 2008a. Efficient visualhull computation for real-time 3d reconstruction using cuda. In: Proceedings of the2008 Conference on Computer Vision and Pattern Recognition, Workshop on VisualComputer Vision on GPUs (CVGPU).
[Ladikos et al., 2008b] Ladikos, A., Benhimane, S., and Navab, N. 2008b. Real-time 3dreconstruction for collision avoidance in interventional environments. In: InternationalConference on Medical Image Computing and Computer-Assisted Intervention (MIC-CAI). pages 526–534.
[Laurentini, 1994] Laurentini, A. 1994. The visual hull concept for silhouette-based im-age understanding. IEEE Trans. Pattern Analysis and Machine Intelligence (PAMI),16(2):150–162.
[Lemke, 2007] Lemke, H. U. 2007. Summary of the white paper of dicom wg24 ’dicom insurgery’. In: SPIE Medical Imaging 2007 - PACS and Imaging Informatics, Progress inBiomedical Optics and Imaging. 6516.
130

References
[Lemke and Berliner, 2007] Lemke, H. U. and Berliner, L. 2007. Specification and designof a therapy imaging and model management system (timms). In: SPIE MedicalImaging 2007 - PACS and Imaging Informatics, Progress in Biomedical Optics andImaging. 6516:651602.
[Lemke et al., 2005] Lemke, H. U., Ratib, O. M., and Horii, S. C. 2005. Workflow in theoperating room: review of Arrowhead 2004 seminar on imaging and informatics (InvitedPaper). In: Ratib, O. M. and Horii, S. C. (Editors), Medical Imaging 2005: PACS andImaging Informatics. Edited by Ratib, Osman M.; Horii, Steven C. Proceedings of theSPIE, Volume 5748, pp. 83-96 (2005). 5748:83–96.
[Lemke and Vannier, 2006] Lemke, H. U. and Vannier, M. W. 2006. The operating roomand the need for an it infrastructure and standards. International Journal of ComputerAssisted Radiology and Surgery, 1(3):117–121.
[Leong et al., 2007] Leong, J., Nicolaou, M., Atallah, L., Mylonas, G., Darzi, A., andYang, G.-Z. 2007. HMM Assessment of Quality of Movement Trajectory in LaparoscopicSurgery. Computer Aided Surgery, 12(6):335–346.
[Lester et al., 2006] Lester, J., Choudhury, T., and Borriello, G. 2006. A Practical Ap-proach to Recognizing Physical Activities.
[Lin et al., 2006] Lin, H. C., Shafran, I., Yuh, D., and Hager, G. D. 2006. Towards auto-matic skill evaluation: Detection and segmentation of robot-assisted surgical motions.Computer Aided Surgery, 11(5):220–230.
[Lo et al., 2003] Lo, B. P. L., Darzi, A., and Yang, G.-Z. 2003. Episode classification forthe analysis of tissue/instrument interaction with multiple visual cues. In: Interna-tional Conference on Medical Image Computing and Computer-Assisted Intervention(MICCAI). pages 230–237.
[Lucas and Kanade, 1981] Lucas, B. D. and Kanade, T. 1981. An iterative image registra-tion technique with an application to stereo vision. In: International Joint Conferenceson Artificial Intelligence. pages 674–679.
[Lv and Nevatia, 2007] Lv, F. and Nevatia, R. 2007. Single view human action recognitionusing key pose matching and viterbi path searching. In: IEEE Conf. on ComputerVision and Pattern Recognition (CVPR).
[Macario et al., 2006] Macario, A., Morris, D., and Morris, S. 2006. Initial Clinical Eval-uation of a Handheld Device for Detecting Retained Surgical Gauze Sponges UsingRadiofrequency Identification Technology. Arch Surg, 141(7):659–662.
[MacKenzie et al., 2001] MacKenzie, C. L., Ibbotson, J. A., Cao, C. G. L., and Lomax,A. J. 2001. Hierarchical decomposition of laparoscopic surgery: a human factors ap-proach to investigating the operating room environment. Minimally Invasive TherapyAllied Technologies, 10(3):121:128.
[Maruster et al., 2001] Maruster, L., van der Aalst, W., Weijters, T., van den Bosch, A.,and Daelemans, W. 2001. Automatic discovery of workflow models from hospital data.In: Proceedings BNAIC-01. pages 183–194.
[Mayoral et al., 2008] Mayoral, R., Vazquez, A., and Burgert, O. 2008. A general frame-work for data streaming in the digital operating room. In: Horii, Steven C.; Andriole,K. P. (Editor), SPIE Medical Imaging:PACS and Imaging Informatics. 6919:691933.
131

References
[Megali et al., 2006] Megali, G., Sinigaglia, S., Tonet, O., and Dario, P. 2006. Modellingand Evaluation of Surgical Performance Using Hidden Markov Models. BiomedicalEngineering, IEEE Transactions on, 53(10):1911–1919.
[Mehta et al., 2001] Mehta, N. Y., Haluck, R. S., Frecker, M. I., and Snyder, A. J. 2001.Sequence and task analysis of instrument use in common laparoscopic procedures. Sur-gical Endoscopy, 16(2):280–285.
[Meyer et al., 2007] Meyer, M. A., Levine, W. C., Egan, M. T., Cohen, B. J., Spitz, G.,Garcia, P., Chueh, H., and Sandberg, W. S. 2007. A computerized perioperative dataintegration and display system. International Journal of Computer Assisted Radiologyand Surgery, 2(3-4):191–202.
[Mihajlovic and Petkovic, 2001] Mihajlovic, V. and Petkovic, M. 2001. Dynamic bayesiannetworks: A state of the art. CTIT technical reports series, TR-CTIT-34. DMW-project.
[Minnen et al., 2007] Minnen, D., Jr., C. L. I., Essa, I. A., and Starner, T. 2007. Dis-covering multivariate motifs using subsequence density estimation and greedy mixturelearning. In: National Conference on Artificial Intelligence (AAAI). pages 615–620.
[Minnen et al., 2006] Minnen, D., Starner, T., Essa, I. A., and Jr., C. L. I. 2006. Discov-ering characteristic actions from on-body sensor data. In: Tenth IEEE InternationalSymposium on Wearable Computers (ISWC). pages 11–18.
[Miyawaki et al., 2005] Miyawaki, F., Masamune, K., Suzuki, S., Yoshimitsu, K., andVain, J. 2005. Scrub nurse robot system - intraoperative motion analysis of a scrubnurse and timed-automata-based model for surgery. IEEE Transactions on IndustrialElectronics, 52(5):1227–1235.
[Moore and Essa, 2002] Moore, D. and Essa, I. 2002. Recognizing multitasked activitiesfrom video using stochastic context-free grammar. In: National Conference on ArtificialIntelligence (AAAI). pages 770–776.
[Moore et al., 1999] Moore, D. J., Essa, I. A., and Hayes, M. H., I. 1999. Exploitinghuman actions and object context for recognition tasks. In: IEEE International Con-ference on Computer Vision (ICCV). 1:80–86.
[Morgenstern, 1992] Morgenstern, L. 1992. Carl langenbuch and the first cholecystectomy.Surgical Endoscopy, 6(3):113–114.
[Morris and Paradiso, 2002] Morris, S. J. and Paradiso, J. A. 2002. Shoe-integrated sensorsystem for wireless gait analysis and real-time feedback. In: Proceedings of the SecondJoint EMBS/BMES Conference. pages 2468–2469.
[Murphy, 2002] Murphy, K. P. 2002. Dynamic Bayesian Networks: Representation, In-ference and Learning. PhD thesis, UC Berkeley, Computer Science Division.
[Nagy et al., 2006] Nagy, P., George, I., Bernstein, W., Caban, J., Klein, R., Mezrich, R.,and Park, A. 2006. Radio frequency identification systems technology in the surgicalsetting. Surg Innov, 13(1):61–67.
[Navab et al., 2007] Navab, N., Traub, J., Sielhorst, T., Feuerstein, M., and Bichlmeier,C. 2007. Action- and workflow-driven augmented reality for computer-aided medicalprocedures. IEEE Computer Graphics and Applications, 27(5):10–14.
132

References
[Neumuth et al., 2006a] Neumuth, T., Durstewitz, N., Fischer, M., Strauß, G., Dietz,A., Meixensberger, J., Jannin, P., Cleary, K., Lemke, H. U., and Burgert, O. 2006a.Structured recording of intraoperative surgical workflows. In: SPIE Medical Imaging2006 - PACS and Imaging Informatics, Progress in Biomedical Optics and Imaging.6145.
[Neumuth et al., 2008] Neumuth, T., Mansmann, S., Scholl, M. H., and Burgert, O. 2008.Data warehousing technology for surgical workflow analysis. In: IEEE Symposium onComputer-Based Medical Systems (CBMS). pages 230–235.
[Neumuth et al., 2006b] Neumuth, T., Schumann, S., Strauss, G., Jannin, P., Meixens-berger, J., Dietz, A., Lemke, H. U., and Burgert, O. 2006b. Visualization options forsurgical workflows. International Journal of Computer Assisted Radiology and Surgery,1(1):438–440.
[Neumuth et al., 2006c] Neumuth, T., Strauß, G., Meixensberger, J., Lemke, H. U., andBurgert, O. 2006c. Acquisition of process descriptions from surgical interventions. In:International Conference on Database and Expert Systems Applications (DEXA). pages602–611.
[Nguyen et al., 2005] Nguyen, N., Phung, D., Venkatesh, S., and Bui, H. H. 2005. Learn-ing and detecting activities from movement trajectories using the hierarchical HMMs.In: IEEE Conf. on Computer Vision and Pattern Recognition (CVPR). pages 955–960.
[Oliver et al., 2004] Oliver, N., Garg, A., and Horvitz, E. 2004. Layered representationsfor learning and inferring office activity from multiple sensory channels. ComputerVision Image Understanding Journal (CVIU), 96(2):163–180.
[Olsen, 2006] Olsen, D. O. 2006. Historical overview and indications for cholecystectomy.Laparoscopic Surgery of the Abdomen, pages 71–72.
[Padoy et al., 2007a] Padoy, N., Blum, T., Essa, I., Feussner, H., Berger, M.-O., andNavab, N. 2007a. A boosted segmentation method for surgical workflow analysis. In:International Conference on Medical Image Computing and Computer-Assisted Inter-vention (MICCAI). pages 102–109.
[Padoy et al., 2008] Padoy, N., Blum, T., Feussner, H., Berger, M.-O., and Navab, N.2008. On-line recognition of surgical activity for monitoring in the operating room. In:Proceedings of the 20th Conference on Innovative Applications of Artificial Intelligence(IAAI). pages 1718–1724.
[Padoy et al., 2007b] Padoy, N., Horn, M., Feussner, H., Berger, M.-O., and Navab, N.2007b. Recovery of surgical workflow: a model-based approach. In: InternationalJournal of Computer Assisted Radiology and Surgery (CARS), Supplement 1. 2:481–482.
[Padoy et al., 2009] Padoy, N., Mateus, D., Weinland, D., Berger, M.-O., and Navab,N. 2009. Workflow monitoring based on 3d motion features. In: Proceedings of theInternational Conference on Computer Vision (ICCV), Workshop on Video-orientedObject and Event Classification (To Appear).
[Patel et al., 2007] Patel, S., Lorincz, K., Hughes, R., Huggins, N., Growdon, J. H.,Welsh, M., and Bonato, P. 2007. Analysis of feature space for monitoring persons
133

References
with parkinson’s disease with application to a wireless wearable sensor system. In:Proc. 29th IEEE EMBS Annual International Conference.
[Paulus et al., 1998] Paulus, D., Csink, L., and Niemann, H. 1998. Color cluster rotation.In: International Conference on Image Processing (ICIP). pages 161–165.
[Peters, 2006] Peters, T. 2006. Image-guidance for surgical procedures. Physics inMedicine and Biology, 51(14):R505–R540.
[Pinhanez and Bobick, 1997] Pinhanez, C. and Bobick, A. 1997. Intelligent studios mod-eling space and action to control tv cameras. Applied Artificial Intelligence, 11(4):285–305.
[Predey et al., 2002] Predey, T., Sewall, L., and Smith, S. 2002. Percutaneous vertebro-plasty: New treatment for vertebral compression fractures. American Family Physician,66(4):611–615.
[Qi et al., 2006] Qi, J., Jiang, Z., Zhang, G., Miao, R., and Su, Q. 2006. A surgical man-agement information system driven by workflow. In: IEEE International Conferenceon Service Operations and Logistics, and Informatics (SOLI). pages 1014–1018.
[Rabiner, 1989] Rabiner, L. R. 1989. A tutorial on hidden markov models and selectedapplications in speech recognition. Proceedings of the IEEE, 77(2):257–286.
[Radrich, 2008] Radrich, H. 2008. Vision-based motion monitoring through data fusionfrom a chirurgical multi-camera recording system. Diploma Thesis. Technische Univer-sität München.
[Riskin et al., 2006] Riskin, D. J., Longaker, M. T., Gertner, M., and Krummel, T. M.2006. Innovation in surgery, a historical perspective. Annals of Surgery, 244(5):686–693.
[Rogers et al., 2007] Rogers, A., Jones, E., and Oleynikov, D. 2007. Radio frequencyidentification (rfid) applied to surgical sponges. Surg Endosc, 21(1237):1235.
[Rosen et al., 2006] Rosen, J., Brown, J., Chang, L., Sinanan, M., and Hannaford, B.2006. Generalized approach for modeling minimally invasive surgery as a stochas-tic process using a discrete markov model. IEEE Trans. on Biomedical Engineering,53(3):399–413.
[Rybachuk, 2009] Rybachuk, K. 2009. Motif discovery and refinement for detection andlabeling of human activity. Master Thesis. Technische Universität München.
[Sakoe and Chiba, 1978] Sakoe, H. and Chiba, S. 1978. Dynamic programming algorithmoptimization for spoken word recognition. IEEE Trans. Acoust. Speech Signal Process.,26(1):43–49.
[Sanchez et al., 2008] Sanchez, D., Tentori, M., and Favela, J. 2008. Activity recognitionfor the smart hospital. IEEE Intelligent Systems, 23(2):50–57.
[Sandberg et al., 2005] Sandberg, W. S., Daily, B., Egan, M., Stahl, J. E., Goldman,J. M., Wiklund, R. A., and Rattner, D. 2005. Deliberate perioperative systems designimproves operating room throughput. Anesthesiology, 103(2):406–418.
[Satava, 2003] Satava, R. M. 2003. The operating room of the future: observations andcommentary. Semin Laparosc Surg., 10(3):99–105.
134

References
[Satava, 2005] Satava, R. M. 2005. Telesurgery, robotics, and the future of telemedicine.European Surgery, 37(5):304–307.
[Seitz et al., 2006] Seitz, S. M., Curless, B., Diebel, J., Scharstein, D., and Szeliski, R.2006. A comparison and evaluation of multi-view stereo reconstruction algorithms. In:IEEE Conf. on Computer Vision and Pattern Recognition (CVPR), Washington, DC,USA. IEEE Computer Society, pages 519–528.
[Shi et al., 2006] Shi, Y., Bobick, A. F., and Essa, I. A. 2006. Learning temporal sequencemodel from partially labeled data. In: IEEE Conf. on Computer Vision and PatternRecognition (CVPR). pages 1631–1638.
[Shi et al., 2004] Shi, Y., Huang, Y., Minnen, D., Bobick, A., and Essa, I. 2004. Propa-gation networks for recognition of partially ordered sequential action. In: IEEE Conf.on Computer Vision and Pattern Recognition (CVPR). pages 862–869.
[Siddiqi et al., 2007] Siddiqi, S., Gordon, G. J., and Moore, A. W. 2007. Fast statediscovery for hmm model selection and learning. In: In Proceedings of the EleventhInternational Conference on Artificial Intelligence and Statistics (AI-STATS).
[Sielhorst et al., 2005] Sielhorst, T., Blum, T., and Navab, N. 2005. Synchronizing 3dmovements for quantitative comparison and simultaneous visualization of actions. In:Fourth IEEE and ACM International Symposium on Mixed and Augmented Reality(ISMAR’05), Vienna, Austria. pages 38–47.
[Sielhorst et al., 2008] Sielhorst, T., Feuerstein, M., and Navab, N. 2008. Advanced med-ical displays: A literature review of augmented reality. IEEE/OSA Journal of DisplayTechnology; Special Issue on Medical Displays, 4(4):451–467.
[Simon Baker and Matthews, 2004] Simon Baker, Raju Patil, K. M. C. and Matthews, I.2004. Lucas-kanade 20 years on: Part 5. Technical Report CMU-RI-TR-04-64, RoboticsInstitute, Pittsburgh, PA.
[Singer and Ostendorf, 1996] Singer, H. and Ostendorf, M. 1996. Maximum likelihoodsuccessive state splitting. In: ICASSP ’96: Proceedings of the Acoustics, Speech,and Signal Processing, 1996. on Conference Proceedings., 1996 IEEE InternationalConference, Washington, DC, USA. IEEE Computer Society, pages 601–604.
[Smith et al., 2005] Smith, J. R., Fishkin, K. P., Jiang, B., Mamishev, A., Philipose, M.,Rea, A. D., Roy, S., and Sundara-Rajan, K. 2005. Rfid-based techniques for human-activity detection. Commun. ACM, 48(9):39–44.
[Speidel et al., 2008] Speidel, S., Sudra, G., Senemaud, J., Drentschew, M., MÃijller-Stich, B. P., Gutt, C., and Dillmann, R. 2008. Recognition of risk situations basedon endoscopic instrument tracking and knowledge based situation modeling. In: Med.Imaging. SPIE.
[Stephenson, 2000] Stephenson, T. A. 2000. An introduction to Bayesian network theoryand usage. IDIAP-RR 03, IDIAP.
[Stolcke and Omohundro, 1994] Stolcke, A. and Omohundro, S. M. 1994. Best-first modelmerging for hidden markov model induction. Technical Report Technical report TR-94-403, ICSI,Berkeley, CA.
135

References
[Subramanya et al., 2006] Subramanya, A., Raj, A., Bilmes, J. A., and Fox, D. 2006.Recognizing activities and spatial context using wearable sensors. In: Uncertainty inArtificial Intelligence (UAI).
[Svoboda et al., 2005] Svoboda, T., Martinec, D., and Pajdla, T. 2005. A convenientmulticamera self-calibration for virtual environments. Presence: Teleoper. Virtual En-viron., 14(4):407–422.
[Szeliski, 1993] Szeliski, R. 1993. Rapid octree construction from image sequences.CVGIP: Image Understanding, 58(1):23–32.
[Tahar et al., 2008] Tahar, K., Korb, W., Burgert, O., Möckel, H., and Neumuth, T. 2008.Ein system zur sensorbasierten erfassung chirurgischer instrumentennutzung für dieunterstützung von workflowanalysen. In: 7. Jahrestagung der Deutschen Gesellschaftfür Computer-und Roboter-Assistierte Chirurgie (CURAC 2008), Leipzig, Germany.
[Taylor, 2008] Taylor, R. H. 2008. Medical robotics and computer-integrated surgery.Computer Software and Applications Conference, Annual International, 0:1.
[van der Aalst et al., 2003] van der Aalst, W. M. P., van Dongen, B. F., Herbst, J.,Maruster, L., Schimm, G., and Weijters, A. J. M. M. 2003. Workflow mining: asurvey of issues and approaches. Data Knowl. Eng., 47(2):237–267.
[Viola and Jones, 2004] Viola, P. and Jones, M. J. 2004. Robust real-time face detection.International Journal of Computer Vision (IJCV), 57(2):137–154.
[Vu et al., 2003] Vu, V.-T., Brémond, F., and Thonnat, M. 2003. Automatic video inter-pretation: A novel algorithm for temporal scenario recognition. In: International JointConferences on Artificial Intelligence. pages 1295–1302.
[Wang and Gasser, 1997] Wang, K. and Gasser, T. 1997. Alignment of curves by dynamictime warping. Annals of Statistics, 25(3):1251–1276.
[Wang et al., 2007] Wang, X., Ma, X., and Grimson, E. 2007. Unsupervised activityperception by hierarchical bayesian models. In: IEEE Conf. on Computer Vision andPattern Recognition (CVPR). IEEE Computer Society, pages 1–8.
[Ward et al., 2006] Ward, J., Lukowicz, P., Tröster, G., and Starner, T. 2006. Activityrecognition of assembly tasks using body-worn microphones and accelerometers. IEEETrans. Pattern Analysis and Machine Intelligence, 28(10):1553–1567.
[Weinland, 2008] Weinland, D. 2008. Action Representation and Recognition. PhD thesis,Institut National Polytechnique de Grenoble.
[Weinland et al., 2007] Weinland, D., Boyer, E., and Ronfard, R. 2007. Action recogni-tion from arbitrary views using 3d exemplars. In: IEEE International Conference onComputer Vision (ICCV). pages 1–7.
[Weinland et al., 2006] Weinland, D., Ronfard, R., and Boyer, E. 2006. Free viewpoint ac-tion recognition using motion history volumes. Computer Vision Image UnderstandingJournal (CVIU), 104(2-3):249–257.
[Won et al., 2006] Won, K.-J., Prugel-Bennett, A., and Krogh, A. 2006. Evolving thestructure of hidden markov models. IEEE Transactions on Evolutionary Computation,10(1):39–49.
136
References
[Wyatt, 2005] Wyatt, D. 2005. Unsupervised activity recognition using automaticallymined common sense. In: National Conference on Artificial Intelligence (AAAI). pages21–27.
[Xiang and Gong, 2008] Xiang, T. and Gong, S. 2008. Optimising dynamic graphicalmodels for video content analysis. Computer Vision Image Understanding Journal(CVIU), 112(3):310–323.
[Xiao et al., 2005] Xiao, Y., Hu, P., Hu, H., Ho, D., Dexter, F., Mackenzie, C. F., Seagull,F. J., and Dutton, R. P. 2005. An algorithm for processing vital sign monitoring data toremotely identify operating room occupancy in real-time. Anesth Analg, 101:823–829.
[Xie et al., 2003] Xie, L., Chang, S.-F., Divakaran, A., and Sun, H. 2003. Unsuperviseddiscovery of multilevel statistical video structures using hierarchical hidden markovmodels. In: ICME ’03: Proceedings of the 2003 International Conference on Multimediaand Expo - Volume 3 (ICME ’03), Washington, DC, USA. IEEE Computer Society,pages 29–32.
[Xie et al., 2004] Xie, L., Xu, P., Chang, S.-F., Divakaran, A., and Sun, H. 2004. Struc-ture analysis of soccer video with domain knowledge and hidden markov models. Pat-tern Recognition Letters, 25(7):767–775.
[Yan et al., 2008] Yan, P., Khan, S. M., and Shah, M. 2008. Learning 4d action featuremodels for arbitrary view action recognition. In: IEEE Conf. on Computer Vision andPattern Recognition (CVPR).
[Yang, 2006] Yang, G. Z. 2006. Body Sensor Networks. Springer.
[Yaniv and Burshtein, 2003] Yaniv, R. and Burshtein, D. 2003. An enhanced dynamictime warping model for improved estimation of dtw parameters. IEEE Transactions onSpeech and Audio Processing, 11(3):216–228.
[Yaniv and Cleary, 2006] Yaniv, Z. and Cleary, K. 2006. Image-guided procedures: Areview. Technical report, Imaging Science and Information Systems, Georgetown Univ.
[Yoshimitsu et al., 2007] Yoshimitsu, K., Miyawaki, F., Sadahiro, T., Ohnuma, K., Fukui,Y., Hashimoto, D., and Masamune, K. 2007. Development and evaluation of the secondversion of scrub nurse robot (snr) for endoscopic and laparoscopic surgery. In: Intelli-gent Robots and Systems, 2007. IROS 2007. IEEE/RSJ International Conference on.pages 2288–2294.
[Zhang et al., 2008] Zhang, G. G., Huang, T.-C., Guerrero, T., Lin, K.-P., Stevens, C.,Starkschall, G., and Forster, K. 2008. The use of 3d optical flow method in mappingof 3d anatomical structure and tumor contours across 4d ct data. Journal of AppliedClinical Medical Physics, 9(1):59–69.
[Zornig et al., 2008] Zornig, C., Mofid, H., Emmermann, A., Alm, M., von Waldenfels,H.-A., and Felixmüller, C. 2008. Scarless cholecystectomy with combined transvaginaland transumbilical approach in a series of 20 patients. Surgical Endoscopy, 22(6):1427–1429.
137