workflows & tools. data analysis review of typical data analyses reproducibility &...
TRANSCRIPT

Module 08
Data AnalysisWorkflows & Tools
Data Analysis
Review of typical data analyses Reproducibility & provenance Overview of workflows Computer-based scientific workflows (SWF) Benefits of SWF Examples of SWF and associated tools
Topics

Data Analysis
After completing this lesson, the participant will be able to: ◦ Understand a subset of typical analyses used◦ Define a workflow◦ Define an SWF◦ Discuss the benefits of workflows in general and SWF in
particular◦ Locate resources for using SWF
Learning Objectives

Data Analysis
Plan
Acquire & Process
AnalyzePreserve
Publish & Share
The Data Life Cycle
Data Analysis
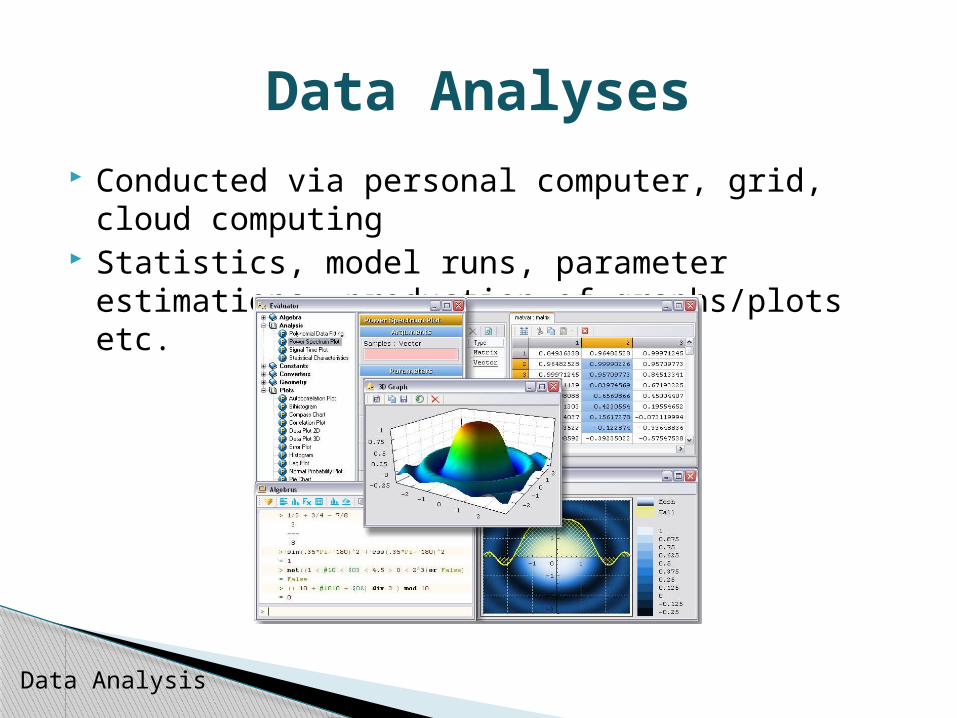
Conducted via personal computer, grid, cloud computing Statistics, model runs, parameter estimations, production of
graphs/plots etc.
Data Analyses

Data Analysis
Processing: subsetting, merging, manipulating◦ Reduction: important for high-resolution datasets◦ Transformation: unit conversions, linear and nonlinear algorithms
Types of Analyses
0711070500276000 0711070600276000 0711070700277003 0711070800282017 0711070900285000 0711071000293000 0711071100301000 0711071200304000
Date timeair temp precip
C mm11-Jul-07 5:0027.6 00011-Jul-07 6:0027.6 00011-Jul-07 7:0027.7 00311-Jul-07 8:0028.2 01711-Jul-07 9:0028.5 00011-Jul-07 10:0029.3 00011-Jul-07 11:0030.1 00011-Jul-07 12:0030.4 000
Recreated from Michener & Brunt (2000)

Data Analysis
Graphical analyses◦ Visual exploration of data: search for patterns◦ Quality assurance: outlier detection
Types of Analyses
Box and whisker plot of temperature by monthScatter plot of August Temperatures
Strasser, unpub. data
Data Analysis
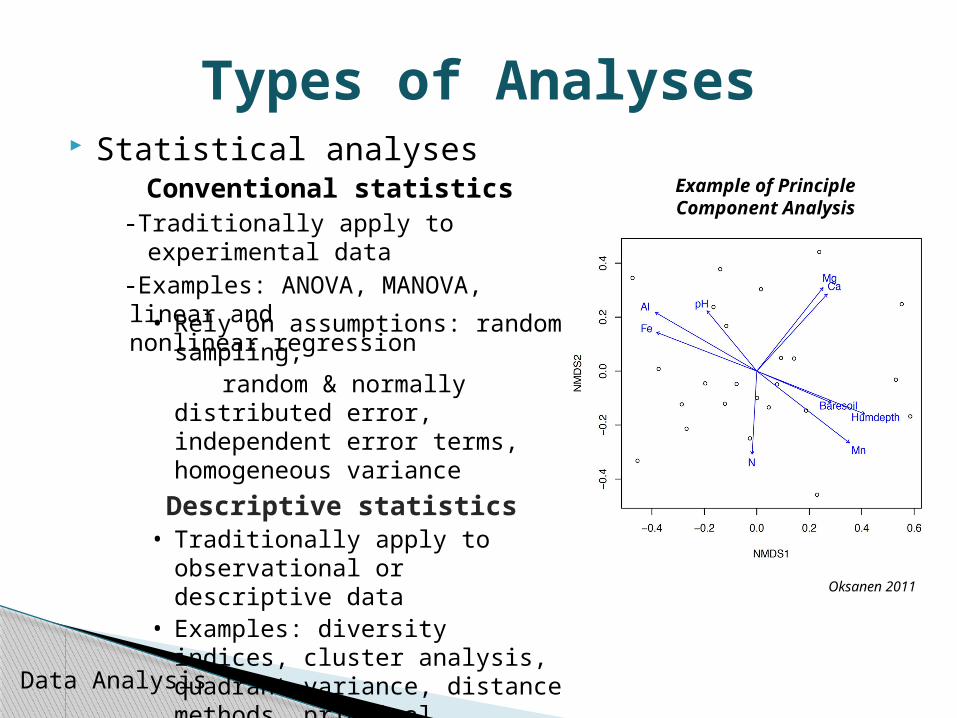
Statistical analyses Conventional statistics
-Traditionally apply to experimental data-Examples: ANOVA, MANOVA, linear and nonlinear regression
Types of Analyses
• Rely on assumptions: random sampling, random & normally distributed error,
independent error terms, homogeneous variance
Descriptive statistics• Traditionally apply to observational or
descriptive data• Examples: diversity indices, cluster
analysis, quadrant variance, distance methods, principal component analysis, correspondence analysis
Oksanen 2011
Example of Principle Component Analysis

Data Analysis
Statistical analyses (continued)◦ Temporal analyses: time series◦ Spatial analyses: for spatial autocorrelation◦ Nonparametric approaches: useful when conventional assumptions
violated or underlying distribution unknown◦ Other misc. analyses: risk assessment, generalized linear models, mixed
models, etc. Analyses of very large datasets◦ Data mining & discovery◦ Online data processing
Types of Analyses

Data Analysis
Re-analysis of outputs Final visualizations: charts, graphs, simulations etc.
After Data Analysis
Science is iterative: The process that results in the final product
can be complex

Data Analysis
Reproducibility is at the core of scientific method Complex process = more difficult to reproduce Good documentation required for reproducibility◦Metadata: data about data◦ Process metadata: data about process used to create,
manipulate, and analyze data
Reproducibility

Data Analysis
Process metadata is information about the process used to get to the data outputs
Related concept: data provenance◦Data provenance is information about the origins of data◦Good provenance = able to follow data throughout entire
life cycle (collection, organization & quality control, analyses, visualization)
◦Allows for Replication & reproducibility Analysis for potential defects, errors in logic, statistical errors Evaluation of hypotheses
Process Metadata

Data Analysis
A workflow is a formalization of process metadata Includes precise description of scientific procedure Includes conceptualized series of data ingestion,
transformation, and analytical steps Three components of a workflow:
1. Inputs: Information or material required2. Outputs: Information or material produced & potentially
used as input in other steps3. Transformation rules/algorithms (e.g. analyses)
Overview of Workflows

Data Analysis
Simplest form of workflow: flow chart
Overview of Workflows
Data import into ExcelData import into Excel
Analysis: mean, SDAnalysis: mean, SD
Graph productionGraph production
Quality control & data cleaning
Quality control & data cleaning

Data Analysis
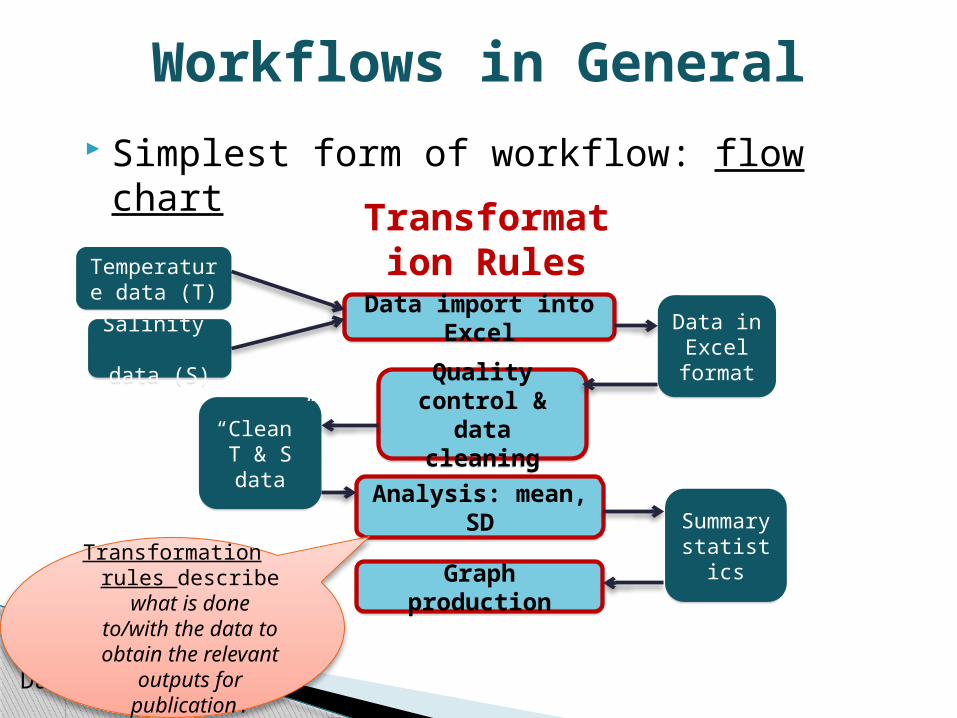
Simplest form of workflow: flow chart
Workflows in General
Temperature data (T)
Temperature data (T)
Salinity data (S)
Salinity data (S)
Data import into ExcelData import into Excel
Analysis: mean, SDAnalysis: mean, SD
Graph productionGraph production
Quality control & data cleaning
Quality control & data cleaning
“Clean” T & S data“Clean” T & S data
Inputs & Outputs
Summary statisticsSummary statistics
Data in Excel
format
Data in Excel
format
Input: Raw T and S data Output: data in
Excel format
Input: data in Excel format
Data Analysis
Workflows in General
Temperature data (T)
Temperature data (T)
Salinity data (S)
Salinity data (S)
Data import into ExcelData import into Excel
Analysis: mean, SDAnalysis: mean, SD
Graph productionGraph production
Quality control & data cleaning
Quality control & data cleaning
“Clean” T & S data“Clean” T & S data
Transformation Rules
Summary statisticsSummary statistics
Data in Excel
format
Data in Excel
format
Simplest form of workflow: flow chart
Transformation rules describe what is done
to/with the data to obtain the relevant
outputs for publication.
Data Analysis
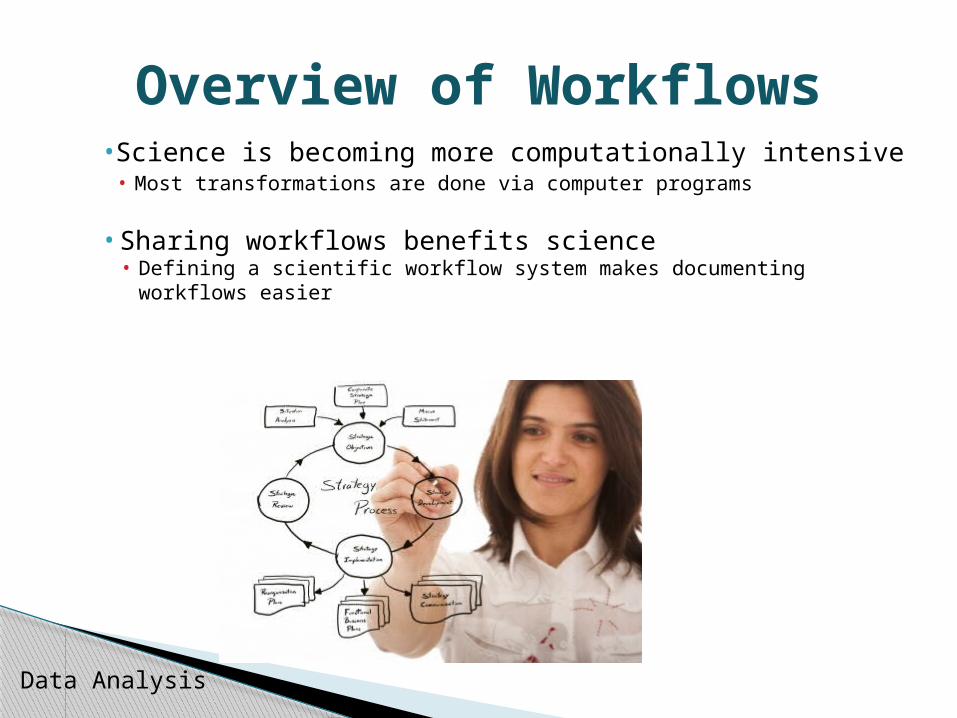
• Science is becoming more computationally intensive• Most transformations are done via computer programs
• Sharing workflows benefits science• Defining a scientific workflow system makes documenting workflows easier
Overview of Workflows

Data Analysis
A scientific workflow is an “analytical pipeline” Each step can be implemented in different software
systems Each step and its parameters/requirements are
formally recorded This allows reuse of both individual steps and the
overall workflow
Scientific Workflows (SWF)

Data Analysis
Single access point for multiple analyses across software packages
Keeps track of analysis and provenance: enables reproducibility◦ Each step & its parameters/requirements formally recorded
Workflow can be stored Allows sharing and reuse of individual steps or overall
workflow◦ Automate repetitive tasks◦ Use across different disciplines and groups◦ Can run analyses more quickly since not starting from scratch
Benefits of Scientific Workflows (SWF)

Data Analysis
Open-source, free, cross-platform Drag-and-drop interface for workflow construction Steps (analyses, manipulations, etc) in workflow represented
by an “actor” Actors connect via inputs and outputs to form a workflow Possible applications◦ Theoretical models or observational analyses◦ Hierarchical modeling◦ Can have nested workflows◦ Can access data from web-based sources (e.g. databases)
Downloads and more information at kepler-project.org
Example of SWF: Kepler

Data Analysis
Example of SWF: Kepler
Drag & drop components from this list
Actors in workflow

Data Analysis
Example of SWF: Kepler
This model shows the solution to the classic Lotka-Volterra predator prey dynamics model. It uses the Continuous Time domain to solve two coupled differential equations, one that models the predator population and one that models the prey population. The results are plotted as they are calculated showing both population change and a phase diagram of the dynamics.

Data Analysis
Example of SWF: KeplerResulting output

Data Analysis
Open-source Workflow & provenance
management support Geared toward
exploratory computational tasks◦ Can manage evolving SWF◦ Maintains detailed history
about steps & data www.vistrails.org
Other SWF Tools: VisTrails
Screenshot example

Data Analysis
Social networking site to support scientists that use SWF
Allows searching for, sharing, reuse of SWF
Can comment on and discuss contributed SWF
Gateway to journals and data repositories
www.myexperiment.org
Other SWF Tools: myExperiment

Data Analysis
Scientists should document workflows used to create results◦Data provenance◦Analyses and parameters used◦ Connections between analyses via inputs and outputs
Documentation can be informal (for example, a flowchart) or formal (for example, Kepler software)
Best Practices for Data Analysis

Data Analysis
Modern science is computer-intensive◦Heterogeneous data, analyses, software
Reproducibility is important Workflows = process metadata◦Necessary for reproducibility, repeatability, validation
There are formal systems for documenting process metadata◦ Enable storage, sharing, visualization, reuse
Summary

Data Analysis
Gil, Y, E Deelman, M Ellisman, T Fahringer, G Fox, D Gannon, C Goble, M Livny, L Moreau, and J Myers. Examining the Challenges of Scientific Workflows. Computer 40:24–32, 2007.
Michener, K, J Beach, M Jones, B Ludaescher, D Pennington, R Pereira, A Rajasekar, and M Schildhauer. A knowledge environment for the biodiversity and ecological sciences. Journal of Intelligent Information Systems, 29:111–126, August 2007.
Ludäscher, B, I Altintas, S Bowers, J Cummings, T Critchlow, E Deelman, DD Roure, J Freire, C Goble, M Jones, S Klasky, T McPhillips, N. Podhorszki, C Silva, I Taylor, and M Vouk. Scientific Process Automation and Workflow Management. Computational Science Series Ch 13. Chapman & Hall, Boca Raton, 2009.
McPhillips, T, S Bowers, D Zinn, B Ludäscher. Scientific workflow design for mere mortals. Future Generation Computer Systems 25: 541-551, 2009.
B Ludäscher, I Altintas, C Berkley, D Higgins, E Jaeger-Frank, M Jones, E Lee, J Tao, and Y Zhao. Scientific workflow management and the kepler system. Concurrency and Computation: Practice & Experience, 18, 2006.
W Michener and J Brunt, editors. Ecological Data: Design, Management and Processing. Blackwell Science, 180p, 2000.
Resources for Data Analysis & SWF

What did you learn?
START QUIZ

Data Analysis
Analyses
1. A workflow involves the formalization and processing of metadata with a precise description of scientific procedures and analytical steps. Which of the following is a component of a workflow?
The output which is the information produced
The input that contains the information
All of the above

Data Analysis
Review this section
Think about this …
Return

Data Analysis
Proceed to the next question
Excellent!
NEXT
Data Analysis
Data mining and discovery
2. Which of the following may not be typically used when analyzing a large amount of data?
Grid computing
Pattern searching and decision trees
Spatial analyses

Data Analysis
Review this section
Think about this …
Return

Data Analysis
Proceed to the next question
Excellent!
Next

Data Analysis
Scatter plots
3. After data analysis, outputs can be generated as _______________ .
Box-and-whisker plots
Plots that show you potential data errors
All graphical formats and analyses

Data Analysis
Review this section
Think about this …
Return

Data Analysis
Proceed to the next question
Excellent!
Next

Data Analysis
Reproducibility
4. Best practices for data analysis should involve the documentation of workflows to show results of data provenance, analyses, and parameters used. Workflows are necessary for which of the following?
Repeatability
Validation
All of the above

Data Analysis
Review this section
Think about this …
Return

Data Analysis
Proceed to the next question
Excellent!
Next

Data Analysis
Scientific workflow
5. SWF stands for _________ and offers computer-based formal systems for documenting the metadata process.
Systematic workflow
Scientific workforce
Systematic work information

Data Analysis
Review this section
Think about this …
Return

Data Analysis
Proceed to the next question
Excellent!
Next

Data Analysis
Each step can be implemented in different software systems with requirements formally recorded
6. Which of the following is a key benefit of SFW?
Single access point for multiple analyses.
Workflow can be stored
Allows sharing of individual steps.
All of the above.

Data Analysis
Review this section
Think about this …
Return

Data Analysis
Proceed to the next question
Excellent!
Next

Data Analysis
Good organization
7. ___________ enables one to follow data throughout the entire data life cycle (collection, organization, quality control, analyses, and visualization).
Good data maintenance
Good provenance
Good metadata

Data Analysis
Review this section
Think about this …
Return

Data Analysis
You have completed this learning module.
Congratulations!
Next

Data Analysis
We want to hear from you! CLICK the arrow to take our short survey.
Before you go . . .