workforce investment act training for older workers
TRANSCRIPT

U.S. Department of Labor (DOL)
Employment and Training Administration (ETA)
Workforce Investment Act Training for Older Workers: Toward a Better Understanding of
Older Worker Needs during the Economic Recovery
Prepared by: Ting Zhang, Ph.D.
Public Policy George Mason University
Fairfax, Virginia This paper was funded, either wholly or in part, with Federal funds from the U.S. Department of Labor, Employment and Training Administration (ETA) under Contract Number DOLJ061A20380. The contents of this publication do not necessarily reflect the views or policies of the Department, nor does mention of trade names, commercial products, or organizations imply endorsement of same by the U.S. Government. This paper was one of seven prepared under the 2009 ETA Research Papers Program, which competitively awarded doctoral and post-doctoral students funding to conduct original research and prepare scholarly papers on topics relating to the workforce investment system.

1
Introduction
“With about two-thirds of their 401(k) portfolios invested in equities, older workers should recognize that the only way to compensate for their decimated assets [in the current economic recession and financial crisis] is to remain in the workforce longer” (Munnell, et al., 2009, p. 6). The ongoing economic recession has increased older workers’ incentives to continue working or return
to work, while multiplying the challenges they face to do so. This stark reality contrasts with earlier research reports projecting stable retirement rate trends (National Institute on Aging, 2007; Taeuber and Graham, 2007). At this historical moment, the long-term demographic trend of an aging population means more older workers in the labor force (Zhang, 2008a, 2008b). In the meantime, the current recession similarly pushes older workers to remain in or return to the labor force. As a result, better equipping older workers for the labor market is becoming increasingly important.
Older workers’ and retirees’ demand for training to remain or regain labor market competitiveness is certain to increase. This has policy implications for Workforce Investment Act (WIA) planning. Building on a book and literature review previously completed (Zhang, 2008a), this research will examine and help inform investments in future WIA services for older worker training.
Many employers are concerned about older workers’ obsolete skill sets, high health insurance and benefit costs. In the meantime, many employers also recognize that older workers or retirees have accumulated years of still valuable experiences, work ethic, mentoring and language skills (Collison, 2003). It is therefore critical to deliver the appropriate level and mix of WIA services for older workers who need training to continue working or to return to work.
Relying on the Workforce Investment Act Standardized Record Data (WIASRD) 2007 data and Bureau of Labor Statistics (BLS) unemployment data, this paper adopts a panel data model and empirically examines the impacts of unemployment rates and various WIA services on older workers’ Entered Employment Rate (EER)1. An innovative two-sector unemployment rate measure is adopted. Older workers’ demographic and socioeconomic conditions are controlled for in the investigations. Following the finding interpretation and discussions, this paper concludes with policy implications. Literature Review
To understand the uniqueness in training older workers, it is critical to understand the demographic shift, older workers’ vulnerability, productivity, unique assets, potential training methods for older audiences, and available resources related to the training. This section reviews literature from the above perspectives.
Aging Resulted Labor Changes Older workers’ share in the labor force is rising quickly. Currently over 18 percent of the labor force is
aged 55 and above (Bureau of Labor Statistics, 2009), up from nearly 12 percent in 1995. This figure was projected by the Bureau of Labor Statistics (BLS) to be 21 percent in 2014 (U.S. Department of Labor, 2005). The actual number of older labor force participants could be even greater than official projections suggest (Rix, 2006).
1 For WIA adult program, of those who are not employed at registration, it is defined as the number of adults who have entered employment by the end of Q1 after the exit quarter divided by the number of adults who exit during the quarter. For WIA dislocated worker program, it is defined as the number of dislocated workers who have entered employment by the end of Q1 after the exit quarter divided by the number of dislocated workers who exit during the quarter.

2
Older Workers’ Vulnerability However, older workers are particularly vulnerable in the economy, not just due to their shrunken
retirement assets affected by the current financial crisis. According to Heidkamp (2009), older workers: 1) are increasingly more likely than younger workers to be laid off; 2) take longer to find a new job; 3) are less likely overall than younger workers to find another job; 4) and also tend to earn less income when able to find another job. Given this background, it is critical for government programs to empower older workers and help them overcome these vulnerabilities when seeking a new job.
Many employers are concerned about the higher costs and lower productivity of hiring older employees. Older workers are generally perceived to be more vulnerable to skill obsolescence and tend to be at odds with technological innovations that are associated with increased training needs (Crown and Longino, 2000). For those older people who have retired for a while or who have been working for an employer for a long time and do not change jobs as often as younger workers, lacking job hunting techniques is another structural disincentive for older people (Hooyman & Kiyak, 2005). Even the “Seniority Principle” (Thurow, 1975) which increases salary with experience tends to discourage hiring seniors.
There is also general doubt about older workers’ trainability as well as employability. Many cognitive abilities such as working memory, the capacity to pay attention, and spatial cognition decline with age, especially when a task is complex or represents an unfamiliar knowledge/skill area (Charness and Czaja, 2006). Seniors are typically slower to acquire skills than younger adults, though some of the slowing in learning new tasks may be explained by older adults’ preference for accuracy over speed, with the reverse holding true for younger adults. Charness and Czaja (2006) indicated the importance to allow extra time to train an older adult (1.5 to 2 times the training time expected for a young adult). In addition, older workers have a shorter work life over which to recoup the costs of training.
Older Does Not Mean Less Productive Older workers may have more difficulty than younger ones for learning new knowledge, but it does not
necessarily mean they are less productive. People’s intelligence is composed of crystallized intelligence and fluid intelligence. Crystallized intelligence is a form of acquired knowledge and is usually stable until very late life; fluid intelligence refers to ability to quickly solve novel problems and shows declines from the 20s or 30s (Schulz and Salthouse, 1999). Although older workers may have a disadvantage in fluid intelligence, they may not have a disadvantage in crystallized intelligence. For example, older workers tend to have better language skills.
Actually, various studies show that age is a poor indicator of work performance and that variations in performance within the same cohorts far exceed the average differences between cohorts (Sterns and McDaniel, 1994; Human Resources Development Canada, 1999). Using data on U.S. General Motor employees, the Florida State University Psychology Department and the Pepper Institute on Aging and Public Policy also found that older workers were not less productive or valuable in the workplace, despite their longer learning processes (Charness, 2004).
Even for new skills related to high technology, research also shows that older people’s deficiencies in computer skills, for example, are really a function of socially driven motivation (Friedberg, 2003; Resnick et al., 2004). Social factors may be more important in modulating motivation to train (Colquitt et al., 2000; Maurer et al., 2003).
Although marketing and training for new information and communication technologies has focused mainly on younger people, studies (such as Resnick et al, 2004) demonstrated that older adults could learn to use the Internet, and that web use could improve elders’ quality of life. A number of other studies (e.g., Elias et al., 1987; Gist et al., 1988; Czaja et al., 1989; Charness et al., 1992; Morrell et al., 1995; Mead et al., 1997) have examined the ability of older adults to learn to use a variety of computer applications with perspective training strategies. Based on those studies, there were no discernable differences in performance for different age

3
groups at the end of training, and performance was often better among older novices than that achieved by younger novices, though the older group requires more time.
Older Workers’ Valuable Assets On the other hand, older workers can bring many unique qualities to the workplace. The wisdom of
older people is typically represented by experience, guidance, leadership, and comfort (Peterson, 1999) and older workers typically bring maturity, dependability, and years of relevant experience to the workplace (Eyster, et al., 2008). As identified by the 2003 SHRM/NOWCC/CED2 Older Workers Survey, older workers have invaluable experience, established business ties, a strong work ethic, loyalty to their company, diversity of thoughts and approaches, and can provide additional support to younger workers through mentoring (Collison, 2003).
Older workers possess unique skills that younger workers might not have. Older workers can also be effectively trained. Facing different economic conditions3, job training that aid older workers to obtain and succeed in a job could play a necessary and pivotal role in workforce development and economic growth.
Methods to Train Older Workers Understanding older workers’ vulnerability and values would help to understand training methods that
are suitable for older workers. Previous literature also addresses some clues on how to train older workers. Generally, what is best for young adults works for older adults; however, specific approaches could be particularly helpful for seniors. Previous knowledge has been found to be a strong and positive predictor of learning performance both for in-class instruction and homework learning activities (Beier and Ackerman, 2005). This mirrors Schmidt and Hunter’s (2004) research that indicated experience as a better predictor of job performance than intellectual abilities. This situation hints at the advantage of training older workers based on their previous job experience and skills. Also, certain physical or other accommodations can be made to enhance older workers’ productivity. With seniors’ decreasing vision, high contrast settings for print or computer screens can effectively stimulate their vision, and similarly important are adjustment settings for audio equipment (see Fisk et al., 2004). It is also important to match the instructional technique and medium (e.g., text, voice, animation) to the type of material that is being presented. Older adults might also have greater difficulty ignoring irrelevant information than younger adults based on basic experimental work on attention spans (Carlson et al., 1995); though Schneider, et al. (2000) disagree. Previous literature also found that there were greater gains for older adults when performing procedural (action or hands-on) activities, compared to conceptual training using automated teller machines (Mead and Fisk, 1998). A similar differential advantage was shown on training to search the Internet (Mead et al., 1997).
Older Workers’ Training Resources Publicly-funded training programs have been serving older workers for decades. The Workforce
Investment Act (WIA), the federally-funded employment and training program, provides skill upgrades to 2 This survey is a combination of a team effort between the Society for Human Resource Management (SHRM), the National Older Worker Career Center (NOWCC) and the Committee for Economic Development (CED). A sample of HR professionals was randomly selected from SHRM’s membership database, which consists of more than 170,000 members. In November 2002, 2,500 randomly selected SHRM members received an e-mail invitation containing a link that directed them to the online survey. Of these, 2,143 e-mails were successfully delivered to respondents, and 428 HR professionals responded, yielding a response rate of 20 percent. 3 The aging workforce is projected to result in potential labor force shortages, Social Security fund bankruptcy and other related fiscal pressure. Older individuals’ participation in the labor force can be a possible solution to those above socioeconomic problems (Zhang, 2008). The current recession and decimated retirement assets are also pushing seniors to remain or return to the labor force, either for those who have retired or those who are about to retire. Retaining more seniors in the labor force becomes a necessity for both older individuals and the economy.

4
workers regardless of age, and allows states and local areas to give priority to special populations, such as older workers, for training funds allocation. Some states have recently begun to focus on older workers’ training needs and to tailor some services and funding to serve older workers. Programs funded through WIA serve a growing number of older workers. Shown in Table 1, according to the Workforce Investment Act Standardized Record Data (WIASRD) Data Book, comparing Program Year (PY) 2005, 2006, and 20074, among all WIA program exiters, adult workers aged 55 and above increased from 6 percent in 2005, to 9 percent in 2006, and to 11 percent in 2007; and dislocated workers who are aged 55 and above increased from 12 percent in 2005, to 13 percent in 2006, and to 15 percent in 2007 (U.S. Department of Labor Employment and Training Administration, 2007a, 2008a, and 2008b). As the population ages and with growing financial pressure from the current recession, the use of WIA-funded training by older workers will likely continue to grow.
Table 1: Percentage of Older Workers (Aged 55 and above) among all WIA Program Exiters, PY 2005-2007
WIA Exiter Groups
Program Year
2005 2006 2007
Older Adults 6% 9% 11% Older Dislocated Workers 12% 13% 15%
Data sources: U.S. Department of Labor Employment and Training Administration (2007a, 2008a, and 2008b).
In addition to WIA funding, the U.S. Department of Labor (DOL) funds Senior Community Service
Employment Program (SCSEP) sites, a dedicated employment and training program offering job search assistance, training and work experience to lower-income seniors. SCSEP provides many grants to state governments and national nonprofit organizations to train workers ages 55 and older (U.S. Department of Labor Employment and Training Administration, 2007b). Some community colleges are also leading efforts to develop job training opportunities for older workers to meet local labor market needs.
Unfortunately, based on the WIA National Summary of Annual Performance Data, the key WIA program performance measure, Entered Employment Rate (EER) has been declining over recent years. As shown in Table 2, from 2005-2007, the annual EER for older adults are respectively 69.6 percent, 63.3 percent, 63.2 percent, and the EER for older dislocated workers5 are respectively 74.1 percent, 68.2 percent, 61.5 percent (U.S. Department of Labor Employment and Training Administration, 2009). This measure is an aggregate measure for all WIA programs, for all locations in the country, and for all industry sectors. When
4 The Program Years span respectively from April 2005 to March 2006, April 2006 to March 2007, and April 2007 to March 2008. 5 A dislocated worker is defined as a person who (A) (i) has been terminated or laid off from their job, or who has received a notice of termination or layoff, from their employer; (ii) (I) is eligible for or has used up their unemployment payments; or (II) has been employed for long enough to show, to a program at a One-Stop Career Center referred to in section 134(c), attachment to the Workforce Investment Act, but who cannot get unemployment payments because of low earnings or having done work for an employer that is not covered under a State unemployment compensation law; and (iii) is not likely to return to the same type of work; (B) (i) has lost his or her job, or has received a notice of termination or layoff, from their job because of a permanent closure of, or a big layoff at a plant, facility, or company; (ii) is working at a facility where the employer has announced that it will close within 180 days; or (iii) in order to receive services besides the training services described in section 134(d)(4), intensive services described in section 134(d)(3), or supportive services, is employed at a place where the employer has made an announcement that the facility will close;(C) was self-employed (including employment as a farmer, a rancher, or a fisherman) but is unemployed because of the local economy where the individual lives or because of natural disasters; or (D) is a displaced homemaker.

5
tional nuances. investigated down to program, location, and industry or occupation sector details, this performance indicator might introduce addi
Table 2 Older Workers’ (Aged 55 and above) Entered Employment Rates, PY 2005-2007
WIA Exiter Groups
Program Year
2005 2006 2007
Older Adults 69.6% 63.3% 63.2% Older Dislocated Workers 74.1% 68.2% 61.5%
Data sources: U.S. Department of Labor, Employment and Training Administration (2009).
Research Questions and Hypotheses
With a rising share of older workers enrolled in federally-funded WIA programs but a decreasing EER, it is necessary to examine what programs and services are more effective than others. What level and mix of WIA employment and training programs will be needed to serve older workers? When investigating EER, it is also necessary to determine if WIA program effectiveness is sensitive to cyclical changes in labor market conditions considering the heterogeneity of demographics, socioeconomic background, location, time of enrollment and even occupation preferences. Answers to the above questions may differ depending upon the timing of the cyclical trough of a recession and the speed and magnitude of a recovery.
While previous literature on this investigation is thin, this study is designed to address these above questions and test the following two hypotheses:
1. Some WIA training and related service combinations can be identified to inform strategic decision-
making about future allocations of WIA funds to serve older workers. 2. WIA program success with older workers is sensitive to cyclical changes in labor market
conditions.
The following sections introduce the methodology adopted in this study and then observations based on descriptive statistics and empirical research. Findings are discussed and policy implications are indicated where appropriate. Methodology and Data Sources
This paper uses a panel data model and adopts an innovative measure of unemployment rate to test the impacts of unemployment rates and various WIA programs and services on older workers’ EER. WIASRD 2007 data and BLS unemployment data series are used. This research starts with descriptive statistics using the WIASRD 2007 data to describe older workers’ demographic and socioeconomic background, as well as WIA program participation.

6
The WIASRD 2007 data is used as a longitudinal dataset, and the unit of analysis is WIA program exiting date (temporal unit) at the Workforce Investment Area level (geographical unit). Post-estimation regression diagnostics is conducted to address the model fit and specifications. Older workers in this study are defined as workers of age 55 and above. This age divide is often used as a definition for older workers, and represents the front edge of an older worker cohort with employment problems that are generally regarded to be particularly acute (Rix, 1990).
Data and Variable Measurements
The BLS unemployment data used in this study refer to non-seasonally adjusted unemployment rates.
This variable captures regional cyclical labor market conditions. In this research, an innovative method to measure unemployment is used. Previous literature has identified the dubious role of unemployment rates in entrepreneurship related employment growth (Audretsch, et al., 2000). Similarly, unemployment rates could have a dubious role in employment growth. Higher unemployment rates on the one hand mean more unemployed persons and lower employment growth; higher unemployment rates on the other hand push more people to the job-hunting labor pool, and ultimately result in an upcoming rising employment growth. One way to explain the dubious role of unemployment rates is to observe the timing of unemployment rates. To further clarify the role of unemployment rates, this paper innovatively adopts a two-vector measurement to capture the change of unemployment rates. These two vectors are the unemployment rate level and the unemployment rate trend. The unemployment rate level (U) captures the magnitude of unemployment rate changes and the unemployment rate trend (dU) captures the direction of unemployment rate changes, whether it is going upward or going downward. In this study, the trend measure captures the directional difference (which can be negative or positive) of unemployment rates between two neighboring time periods. In specific, the unemployment rate trend (dU) is measured by the difference between unemployment rate of the current month (m) and the previous month (m-1), i.e., dU=Um- Um-1. The month (m) is corresponding to each exit date (t).
At the same magnitude, U, there could be two totally opposite economic situations: one is when the unemployment rate is rising (i.e. a slowing down economy) and the other is when the unemployment rate is decreasing (i.e. a recovering or growing economy). Explaining the unemployment phenomenon using these two vectors could capture both magnitude and direction and thus introduce additional nuances that the traditional unemployment rate magnitude measure did not achieve.
The WIASRD 2007 data are used to extract data for the number of older exiters6 who were employed by the end of first quarter after exiting a WIA training program, i.e. Entered Employment Level (N) in a reference Workforce Investment Area (w) and for a specific program exit date (t). This is represented by Ntw. This measure is an important component of the dependent variable or output variable for the statistical
models in this study. In this study, the WIASRD 2007 data used for the regression models covered exit dates from January 01, 2006 through September 30, 2007 (see Appendix B and Appendix C). The Entered Employment Level by the WIA definition is a one quarter lagged value taken after a WIA program participant’s exit date, i.e., N(t+q)w, where subscript t denotes the program exit date, q denotes a quarter’s lag after exiting,
and w denotes a Workforce Investment Area . This one quarter lagged value allows a quarter’s time for workers to find a job after exiting WIA programs and services; this also avoids simultaneous causation and endogeneity issues in statistical inference.
Entered Employment Rate (EER) is a common measure for WIA program performance. For WIA adult program, of those who are not employed at registration, EER is defined as the number of adults who have entered employment by the end of the first quarter after the exit quarter divided by the number of adults who exited during the quarter. For the WIA dislocated worker program, EER is defined as the number of dislocated workers who have entered employment by the end of the first quarter after the exit quarter divided by the number of dislocated workers who exited during the quarter. This paper uses EER as the dependent variable for
6 Older exiters refer to older workers who are aged 55 and above and exited WIA training programs.

7
the following empirical tests. Although there are concerns on using EER as a measure for WIA program performance, EER is still a legitimate and best available direct measure when this research is conducted7.
The WIASRD 2007 data also offers older workers’ background information and information by program, training, and occupation types. The older workers’ background information includes demographic, socioeconomic, and WIA program participation information details of older workers who have participated in WIA programs. The demographic and socioeconomic information includes gender, age, disability, education attainment, veteran status, employment status at participation, whether the participant had limited English skills, whether the participant was a low-income resident, whether the participants accepted services or assistance from Temporary Assistance to Needy Families (TANF) and other public assistance. The WIA program participation information includes whether the participants was served by the National Emergency Grant program, whether the participant received services or benefits financially assisted by Wagner-Peyser Act or Trade Adjustment Assistance (TAA) programs. Additionally, program types, training types and occupational categories of training are also offered in the dataset. To be more specific, the program types (P) includes the following: Supportive Services (except needs-related payments), Needs-Related payments, Core Self-Services and Informational Activities, Workforce Information Services, Established Individual Training Accounts (ITA), Pell grants and Pre-Vocational Activities. The training types (T) include On-the-Job Training, Skill Upgrading and Retraining, Entrepreneurial Training, Adult Basic Education (ABE) or English as A Second Language (ESL) in Combination with Training, Customized Training and Other Occupational Skills Training. The occupational categories of training (O) include (1) Agricultural, forestry, fishing and related workers, construction and extractive workers, (2) Managerial, administrative, professional or technical, (3) Sales, clerical and administrative support, (4) Service workers, and (5) Mechanics, installers, repairers, precision workers, machine setters, set-up operators, operators, tenders, assemblers, hand workers, transportation and related workers, and military.
With program participation date and exit date, this paper computes a variable, program participation length or training length (L), to capture how long it took a participant to finish the services. The service participation length is determined by program design as well as individual motivation, efforts, and access. This variable is believed to affect an individual’s EER.
Please note that the WIASRD data is informative, but using it for statistical tests is not without participation bias. The WIASRD 2007 data only offers information related to or reported by the participants. This situation results in possible participation bias of the data8. It is therefore necessary to be cautious about the statistical inference based on this data.
Unit of Analysis
7 There were concerns about using Entered Employment Rate as the dependent variables due to two issues related to this variable as a performance measure. First, the measure is based on program exit. It was noted that performance measures that focuses on exiters is related to selection on both who enters and who exits the program in practice. Focusing exclusively on exiters could introduce selection bias. One suggestion was to focus on program entry as a better measure. However, using entry as a measure offers no clue on when exit happens and therefore cannot directly test the economic impact on participants’ employment following accepting training and services. However, with an appropriate measure of training length as a variable and if entry is not selected, future sensitive study comparing using entry and exit as a measure for performance could be interesting. Second, there was a concern that the outcome measure, EER, is measured only one quarter after program exit. The previous literature shows that many individuals do not receive benefits from job-training programs until several quarters after program entry / exit. However, at the moment, the one-quarter lag performance measure, EER, is still a commonly used measure for WIA services and that is how the WIASRD data is designed. The WIASRD data made this research possible. Using one-quarter lag already serves the purpose of this paper. If a longer-lag is permitted in the dataset, future investigation on the sensitivity of length of lags could a possible extension of the research. 8 There was a concern about the Ashenfelter’s dip (Ashenfelter, 1978) in earnings and employment prior to program participation (called dip). However, this research is not comparing employment rate before and after the training, but comparing those participated to those not participated in a specific service, across specific Workforce Investment Areas, and across different exit dates. For a specific exiting date, the comparison is cross-sectional, not before-and-after comparison. Therefore, the Ashenfelter’s dip is not particularly concerned in this paper.

8
As noted above, this study uses Workforce Investment Area as the geographical unit of analysis and a worker’s exiting date as the temporal unit of analysis. Considering that the effects of WIA training/service programs are examined in this study, Workforce Investment Areas would be the best geographic units. The WIASRD 2007 data does not offer data at the metropolitan area or labor market level. Individual level test was originally preferred; however, due to too much software and computer processing speed capacity would be needed to handle individual level data, this study collapsed the data into Workforce Investment Area rather than at the individual level9. However, the BLS unemployment information is not offered at the workforce investment area level, neither is the BLS unemployment information measured by date. The BLS unemployment measures are monitored and evaluated monthly at the state level. The sub-state level unemployment rates, though available, are mostly estimated data under certain assumptions.
This paper adopts unemployment rates monthly and at the state level. For the temporal unit, it is impossible and unnecessary to monitor unemployment rates daily. For the spatial unit, although states are broader geographic units than workforce investment areas, local economy is determined by residents in and around the neighborhood and under the state and local legislation. Workforce investment areas are not by themselves labor markets or residential areas or legislative districts. A number of employment dynamics occur across borders of workforce investment areas, but remain within a state legislative boundary. It is for these above reasons that the paper adopts monthly state unemployment rates as a general cyclical economic background measure.
Considering the fact that Entered Employment is measured based on a participant’s exit date, exit date is used as the temporal dimension of the paper. Therefore, the unit of analysis is a workforce investment area on a specific program exit date.
Serial Autocorrelation The longitudinal WIASRD dataset makes temporal dynamics and serial autocorrelation a natural
concern affecting statistical estimates. Therefore, correlegram plots and Portmanteau (Q) tests for white noise are used to detect potential serial autocorrelations. If serial autocorrelation is detected, the nature of the serial autocorrelation needs to be investigated to adopt appropriate temporal variables and model specific adjustments. In this study, no evident serial autocorrelation is detected in each spatial panel (i.e., each Workforce Investment Area). A major reason is that the temporal unit is an older worker’s exit date from the WIA programs and services. Since the exit dates are not necessarily continuous in many cases, the date distributions sometimes have gaps in between. Also, a few days’ exiting timing difference does not necessarily result in EER change and is not necessarily related to differences in individual demographics, socioeconomic status or program/service participation situations. Therefore, the panel specific serial autocorrelation concern was eliminated after the tests.
The Panel Data Model
Using longitudinal data that incorporates both temporal and spatial dimensions, the paper adopts a panel data model. The Hausman specification tests and Breusch and Pagan LM tests for random effects are conducted to choose between the random effect and fixed effect models for the panel data.
The following equation briefly exhibits the base panel data model10. Please note that the left hand side of the model is measuring older workers’ EER. The right hand side of the equation measures in turn
9 If using the individual level data, the data would be multi-level panel data which would make the sample size extremely large when running regression models and thus bring a major challenge to the computing power. Using the Workforce Investment Area level actually made the data more balanced. The author is willing to conduct the individual level study for the future when the software and computer power is not an issue. 10 Please note that for categorical variables that have several categories and the sum is the total population, one category was omitted to avoid multicollinarity.

9
unemployment rates, demographic-socioeconomic-program participation attributes, program types, training types, training length, and occupational category of training.
N(t+q)w / Etw= β0+ β1Utw+ β2dUtw+ ∑γlDltw +∑δiPitw +∑ζjTjtw+ ηLtw + ∑θmOmtw
+ f(t-k) + εtw (1
where
N(t+q)w is the number of older workers who entered employment a quarter q after the
WIA program exiting date t at Workforce Investment Area w. Subscript t specifies the exiting date. Subscript q specifies a quarter. Subscript w specifies the Workforce Investment Areas. β0, β1, β2, γl, δi, ζj, η, and θm are the regression parameters.
Etw represents the number of older WIA program exiters.
N(t+q)w / Etw captures the EER(t+q)w.
Utw is the unemployment rate level measure. The exit date t is corresponding to the
corresponding current month m for this variable. dUtw is the unemployment rate trend measure. The exit date t is corresponding to the
current month m and previous month m-1 to compute this variable. Dltw represents the combination of demographic, socioeconomic, as well as the
background WIA program participation information. These variables are all proportions of a special group among all relevant participants.
Subscript l denotes a specific demographic, socioeconomic, or program participation background attribute.
Pitw represents the proportion of WIA program participants in a specific program type
i. These are all proportions of a special group among all relevant participants. Subscript i denotes a specific program type. Tjtw represents the share of WIA program participants in a specific training type j.
These are all proportions of a special group among all relevant participants. Subscript j denotes a specific training type. Ltw represents the duration of the training or service.
Omtw captures the occupational skills by Standard Occupational Classification (SOC)
broad occupation categories. These occupation skill variables are all proportions for participants of a specific occupation skill category among relevant participants of all occupation skill categories.
Subscript m denotes the mth occupation skill category. f(t-k) is a vector to capture the time effect, if there is any. If the time effect exists, this
item represents any or any combination of kth lagged autoregressive terms, differenced series, and forecast errors (moving average terms). Since no serial autocorrelation is detected in each spatial panel, the time effect vector eventually disappears in this study.
εtw is the regression error term.
)
Dislocated Workers vs. Adults

10
Considering the fact that dislocated workers are exclusive and different from adult participants in many perspectives, such as wage levels and prior attachment to the labor market, the modeling separates dislocated workers from adults. Therefore, the above model is transformed into two separate models below, for older dislocated workers (2) and older adults (3) respectively. The superscript D and A respectively denote the model for older dislocated workers and the model for older adults.
ND(t+1)w / EDtw= β0+ β1Utw+ β2dUtw+ ∑γlDDltw +∑δiPDitw +∑ζjTDjtw+ ηLDtw + ∑θmODmtw + fD (t-k) + εDtw (2
NA(t+1)w / EAtw= β0+ β1Utw+ β2dUtw+ ∑γlDAltw +∑δiPAitw +∑ζjTAjtw+ ηLAtw + ∑θmOAmtw + fA (t-k) + εAtw (3
)
)
These above two equations adopt the same model, but extract two separate and independent datasets.
Each equation uses a different and unrelated dataset due to the very different and unrelated attributes between dislocated worker participants and adult participants in the WIA programs. Equations (2) and (3) are therefore estimated separately11. Older Workers’ WIA Program Participation This section describes the key attributes of older workers’ WIA program participation through the WIASRD 2007 data. To be more specific, this section delineates older workers’ WIA program participation, age distribution, gender, health situation, racial composition, training types in which they participated, educational attainments, and their occupational category of training. Figure 1 first exhibits older workers’ overall demographic composition by age in the WIA program.
As Figure 1 shows, according to the WIASRD 2007 data, among those WIA older worker participants who exited WIA programs in 2006 and 2007, there were more older adult participants than older dislocated worker participants, particularly by age 80. By age 60, there were evidently more adult participants than dislocated worker participants in the dataset12. Unsurprisingly, this dataset also shows the number of older adults’ Entered Employment (please note, not EER in this figure) is higher than older dislocated workers.
As age increases, program participation sharply decreases. There could be several reasons. First, as age increases, the total population of older people drops. Second, as age increases and health conditions decline, older workers are less likely to participate in the labor market and less likely to seek training for a potential future job or job change. Appendix A shows that seniors’ labor force participation decreases with age, according to Current Population Survey 2009 data. According to this data set, seniors’ total population is declining by age, but seniors’ labor force declines even more quickly; as a result, seniors’ labor force participation rate drops with age. Third, as age increases, accessibility becomes a rising concern for some seniors to physically access local Workforce Investment Board offices, one-stop centers, and other facilities for
11 The author initially considered using Seemingly Unrelated Regression model (SUR) developed by Arnold Zellner (1962). SUR is a technique for analyzing a system of multiple equations with cross-equation parameter restrictions and correlated error terms. In this study, the model contains two independent equations. Each of those two equations used a different and unrelated dataset, due to the very different attributes between dislocated worker participants and adult participants in the WIA programs. For example, participants in the adult workers program have extremely low wages and very little prior attachment to the labor market, while participants in the dislocated worker program have had strong attachment to the labor market and relatively high wages. These two participant groups do not have necessary relationships. In this case, the SUR assumption that error structures of the two models are similar does not necessarily hold. There is no need to estimate SUR and the above regression equations (2) and (3) are estimated separately. 12 Please note that this total numbers of older dislocated workers and older adults do not represent the numbers of observations in the regression models. The data used in the regression models do not use individual worker as the unit of analysis.

11
training. Last, the WIA program was in place for only a few years at the time the WIASRD data was collected. This could result in limited awareness of training options among older workers. This limited awareness could be even more limited as age increases for older workers.
Figure 1 also shows several other perspectives of older worker participants. Among all older workers, only a very small fraction of them reported disabilities13. A larger proportion of older workers’ WIA program participants are male. In Figure 1, the line representing male older workers is above the middle division between older adult participants and older dislocated workers. This is particularly so for workers in their 60s.
Overall, training length drops with age. Although there are a few high spikes for older workers over age 90 (not shown in Figure 1), the total number of observations drops sharply for the very old ages. The limited number of observations for older workers aged over 90 could result in extreme fluctuations of training length.
Figure 1 Senior WIA Program Participants’ Demographic Overview by Age14
Data Source: WIASRD 2007 Data
13 Reporting disability and recognizing or defining disability is often tricky. Psychological factors could play a role in this reporting. Since most WIASRD data is self reporting based, this fraction of disability could be underreported. 14 Please note that not data of all ages are shown. When age increases to over 80s, the limited observations distract the main message delivered in the figure.

12
As shown in Figure 2, among older participants in the WIASRD 2007 data, 66 percent of them are Non-
Hispanic Whites, 19 percent are Non-Hispanic Blacks, 10 percent are Hispanics, and 4 percent are Non-Hispanic Asians.
Figure 2 Racial Compositions of WIA Participants
Data Source: WIASRD 2007 Data

13
Figure 3 shows that among those older workers who accepted training reported in this dataset, almost
three quarters (74 percent) accepted Other Occupational Training, 12 percent accepted Skill Upgrading and Retraining, 7 percent accepted On-the-Job Training, about 3 percent accepted Customized Training, 3 percent accepted ABE or ESL in combination with training, and only less than 0.5 percent of older worker participants accepted Entrepreneurial Training. Please note that this low participation rate for Entrepreneurial Training does not necessarily imply that older workers lack entrepreneurial ambition. Instead, it could relate to older workers who turn to workforce training might not necessarily have or indicate entrepreneurial ambition as their first priority. Older workers participated in the WIA programs and services do not necessarily representing all American older workers. This dataset is subject to participation bias, as noted earlier. The relatively low rate of accepting Entrepreneurial Training could also relate to how the entrepreneurial training program is designed, accessed, and promoted by the One-Stop Career Center.
Figure 3 Training Type Distributions among Senior WIA Participants
Data Source: WIASRD 2007 Data

14
Figure 4 shows older WIA program participants’ educational attainment by age based on the WIASRD 2007 data. As age increases and the number of older worker participants sharply decreases, the educational attainment becomes less distinguishable. Among younger older participants, a predominantly high proportion of them enrolled in an occupational skills certificate/credential/licensure; a relatively limited number of them reported college or full-time technical or vocational school education. This number, though limited relative to those with occupational skill credentials, is still higher than older workers who reported high school diploma (including General Equivalency Diploma or GED) or who reported Bachelor’s degree. Equally limited numbers of older worker participants reported either only a high school diploma (including GED) or a Bachelor’s degree.
Figure 4 Education Attainments among Older WIA Program Participants by Age15
Data Source: WIASRD 2007 Data
15 Please note that not data of all ages are shown. When age increases to over 70s, the limited observations distract the main message delivered in the figure.
15
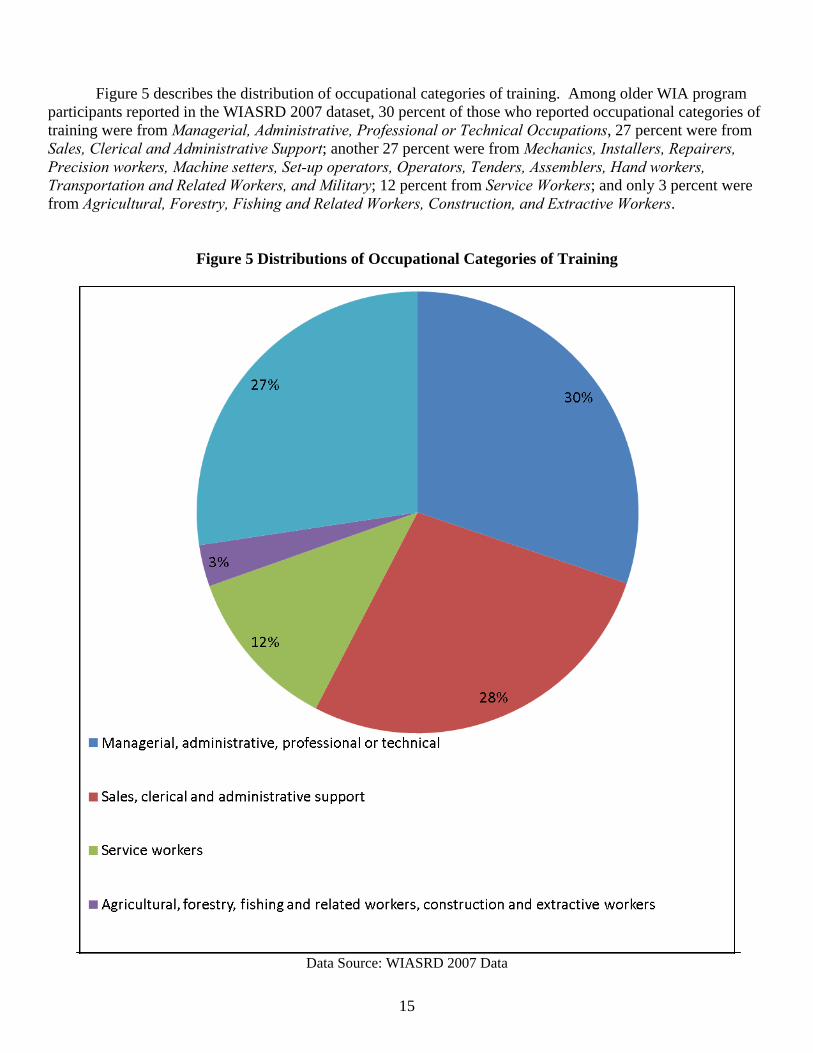
Figure 5 describes the distribution of occupational categories of training. Among older WIA program
participants reported in the WIASRD 2007 dataset, 30 percent of those who reported occupational categories of training were from Managerial, Administrative, Professional or Technical Occupations, 27 percent were from Sales, Clerical and Administrative Support; another 27 percent were from Mechanics, Installers, Repairers, Precision workers, Machine setters, Set-up operators, Operators, Tenders, Assemblers, Hand workers, Transportation and Related Workers, and Military; 12 percent from Service Workers; and only 3 percent were from Agricultural, Forestry, Fishing and Related Workers, Construction, and Extractive Workers.
Figure 5 Distributions of Occupational Categories of Training
Data Source: WIASRD 2007 Data

16
Regression Model Estimates This section focuses on testing which factors affect older workers’ EER after exiting the WIA programs. The models discussed in the methodology section are estimated. Appendix B and C exhibit the descriptive statistical details of each variable used in the regression models16. Table 3 displays the model estimates for older WIA program participants who are dislocated workers, and Table 4 displays the model estimates for older WIA program participants who are adults. The results presented in the tables are the final estimates after using Hausman tests and Breusch and Pagan LM tests for random effects to select an appropriate model for each panel data set17.
Model Estimates for Older Dislocated Workers
According to Table 1, when controlling for other variables, unemployment rate level (i.e. the magnitude measure of underemployment rate) does not have statistically significant (p=0.1) association with older dislocated workers’ EER, but unemployment rate trend (i.e. the directional measure of unemployment rate) matters. When unemployment rate trends up, the fixed-effect panel data model shows a lower EER among older dislocated workers a quarter after they exited from the WIA programs and services. To be more specific, when the unemployment rate increase of a state where a Workforce Investment Area situates rises by 1 percentage point, this Workforce Investment Area’s older dislocated workers’ EER drops by 0.03 of a percentage point, holding other variables constant. This makes sense. When unemployment rate keeps trending up, it normally means an economic downturn or even a recession. With an economic downturn when the unemployed are increasing and the employed are threatened by an increasingly large laid-off worker pool, it increases the difficulty for older workers to find a job. It therefore naturally affects older workers’ EER. This is a typical example where the traditional magnitude unemployment rate measure does not show as sensitive and direct effect as a trend measure of unemployment rate. It is for this exact reason that this paper particularly adopts this innovative compound two-vector unemployment rate measure that integrates both unemployment rate magnitude and unemployment rate trend.
Among demographic information, as expected, the EER decreases with older dislocated workers’ age18. When the mean age of a Workforce Investment Area increases by 1 year, this Workforce Investment Area’s older dislocated workers’ EER decreases by 1.4 percentage points, holding other variables constant. This situation could be related to older workers’ or their family members’ declining health conditions, a more limited access to program and services, and more limited awareness of information when age increases. This implies that older cohorts among older dislocated workers particularly need help if they need to or chose to stay in the labor force.
Race and ethnicity factors do not seem to make much difference. Among older dislocated workers, compared to non-Hispanic Blacks, only American Indian or Alaska Natives show a higher and statistically significant (at p=0.1) EER19. Compared to a Workforce Investment Area’s non-Hispanic Black older dislocated 16 Please note that Appendix B and Appendix C show the statistics across all observations used in the two regression model estimations. The regression models’ unit of analysis is not individual workers; therefore, the statistics showing in the tables are not necessarily consistent with what was shown in the figures of the previous section. 17 Please also note that many older workers reported in the WIASRD data did not offer occupational information. Therefore, when estimating our models incorporating occupational categories, many observations were dropped. However, this situation happened not just to this variable; a few other variables faced the challenge of missing values as well. This occupational training variable is one of the key observing variables and it is an important control variable due to different nature of occupational trainings. Even with dropped observation, it is still perceived to be necessary to be included. 18 The author tried some simple non-linear form of age in preliminary analysis, but did not find major difference of regression estimates. It was therefore not reported to simplify the coefficient interpretation. Future exploration for more complicated non-linear model would be necessary. It was also one of the future research directions the paper mentioned. 19 The relatively limited occurrence of an older worker to be an American Indian or Alaska Native (only 0.6% among older dislocated workers in the statistical test, shown in Appendix B) could have helped to augment the statistical significance to some extent, though the opposite situation could occur as well. Non-Hispanic Blacks are a bigger population group and possibly more heterogeneous.

17
workers, when the area’s share of American Indian or Alaska Native older dislocated workers rises by 1 percentage point, this area’s older dislocated workers’ EER becomes 0.12 percentage point higher, controlling for other variables.
Unexpectedly, disability status is statistically insignificant at 0.1 level for older dislocated workers. This could be related to the fact that a very limited number of older dislocated workers reported disabilities, as noted earlier and shown in Figure 1. According to Appendix B, an average of 3.9% of older dislocated workers reported disabilities across all Workforce Investment Areas and program exiting dates for the regression model, compared to the other 96.1% of older dislocated workers who did not report disabilities. Considering the fact that disability status is highly relevant for older workers’ labor condition, this variable, though with relatively limited observations, deserves to be kept in the regression modeling.
Workforce Investment Areas with higher proportions of older dislocated workers reporting to have occupational skill credentials or to have college or full-time technical or vocational school education have a higher EER. Controlling for other variables and compared to a Workforce Investment Area’s older dislocated workers with lower than high school education or with unreported education attainments, when this area’s share of older dislocated workers with college or full-time technical or vocational school education and with occupational skill credentials goes up by 1 percentage point, the area’s older dislocated worker EER becomes 0.18 or 0.10 of a percentage point higher. The effect of those older dislocated workers reporting to have high school diploma (including GED) and Bachelors’ degrees are not statistically significant (p=0.1). This could be related to the fact that occupational skill credentials as well as many college or technical or vocational school education programs on the one hand prepared the workers with better knowledge set than only high school (including GED) education, and on the other hand are often more career-oriented with more applied skill set training than Bachelors’ degree education. The insignificant effects from high school diploma (including GED) and Bachelors’ degrees could also be partially related to the fact that only a relatively limited number of older workers reported to have high school diploma (including GED) and Bachelors’ degrees, as illustrated in Figure 4. Appendix B also shows that on average only 0.4 percent and 0.3 percent of older dislocated workers reported to have high school diploma (including GED) and Bachelors’ degrees respectively across all units of the regression analysis.
Socioeconomic conditions, such as veteran status, employment status at participation, English levels, low income status, participation status of TANF and other public assistance, do not seem to matter, based on this testing result. Among those variables, a few variables’ insignificant statistical effect (p=0.1) could be partially related to their limited occurrence in the dataset used in the regression. According to Appendix B, among older dislocated workers across all units of the regression analysis, on average only 1.7 percent reported as low-income residents, only 0.03 percent reported to have received TANF and only 0.3 percent reported to have received other public assistance.
Among program participation information variables, training length and receiving services or benefits financially assisted by the Trade Adjustment Assistance (TAA) are tested to matter to older dislocated workers’ EER with statistically significant (p=0.05) impacts. The longer an older dislocated worker participated in the training, the less likely this person would be employed within a quarter after exiting the WIA programs and services. When a Workforce Investment Area’s older dislocated workers’ average training duration increases by 1 day, this area’s older dislocated workers’ EER drops by 0.03 percentage point, holding other variables constant. Therefore adopting certain policies to more effectively monitor the training length might be helpful to enhance the cost-effectiveness of WIA programs. Although this training length effect is not strong, the 0.03 of a percentage point is relative to each additional day, not week or month or year, of training. According to Appendix B, the standard deviation of training length across all units of analysis is as long as 341 days. Older dislocated workers who received services or benefits financially assisted by the TAA program reported a lower EER, based on the test results. This could be related to structural unemployment impact for older dislocated workers assisted by the TAA program. The impacts of National Emergency Grant and Wagner-Peyser Act are not statistically significant at p=0.1 level.
Among services and other related assistance, Workforce Investment Areas with a higher share of older dislocated workers receiving Supportive Services (except needs-related payments) and Core Self-Services and

18
Informational Activities tend to have a higher EER. Controlling for other variables, when a Workforce Investment Area’s shares of older dislocated workers who received Supportive Services (except needs-related payments) and Core Self-Services and Informational Activities increase by 1 percentage point, the area’s older dislocated workers’ EER increases respectively by 0.04 and 0.05 of a percentage point. This situation shows that those two WIA services matter and work for older dislocated workers. Therefore, strengthening those two types of services would help to stabilize older dislocated workers’ EER.
However, it does not mean all services work well. Workforce Investment Areas with a higher share of older dislocated workers whose services were purchased utilizing an Individual Training Account (ITA) have a lower EER among older dislocated workers after exiting the WIA programs and services. When a Workforce Investment Area’s share of older dislocated workers whose services were purchased utilizing an Individual Training Account (ITA) increases by 1 percentage point, the area’s older dislocated workers’ EER drops by 0.03 of a percentage point, controlling for other variables. This ITA effect warrants further investigations for older dislocated workers. Other WIA services, such as Needs-Related Payments, Workforce Information Services, Pell Grant, and Pre-Vocational Activities, do not have statistically significant impact at p=0.1 level.
As for types of training services, On-the-Job Training, Skill Upgrading & Retraining, and Customized Training are effective to older dislocated workers’ EER. Compared to Other Occupational Skills Training, Workforce Investment Areas with a higher share of older dislocated workers who participated in the three types of training noted above have a higher EER, and these effects are statistically significant at 0.05 level. To be more specific, when a Workforce Investment Area’s share of older dislocated workers who received On-the-Job Training, Skill Upgrading & Retraining, and Customized Training increase by 1 percentage point, the area’s older dislocated workers’ EER becomes 0.06, 0.05, and 0.12 of a percentage point higher respectively, compared to Other Occupational Skills Training and controlling for other variables. Those training types are mostly job specific with more focused targets. The effect from Customized Training is relatively stronger than others. Customization helps older dislocated workers to get more direct training, and it is not surprising that there is a better training effect. Therefore, strengthening On-the-Job Training, Skill Upgrading & Retraining and Customized Training is advisable for older dislocated workers in the WIA programs. Entrepreneurial Training and ABE or ESL in Combination with Training do not have a statistically significant effect at p=0.1 level, compared to Other Occupational Skills Training. As illustrated previously in Figure 3, there are a very limited number of seniors who accepted entrepreneurial training. Appendix B also shows that, on average for the data used in the regression model, only 0.8 percent of older dislocated workers across all units of analysis received entrepreneurial training, as well as ABE or ESL training. This partially explains why the coefficients on these two variables are statistically insignificant. Please note that all training type effects are relative to Other Occupational Skills Training.
Among occupational categories of training, compared to Agricultural, Forestry, Fishing and Related Workers, Construction, and Extractive Workers, only Service Worker seems to be predictive of older dislocated workers’ EER. Compared to older dislocated workers who are in Agricultural, Forestry, Fishing and Related, Construction, and Extractive occupations, Workforce Investment Areas with a higher share of older dislocated worker who received trainings as a Service Worker have a higher EER. When a Workforce Investment Area’s share of older dislocated workers who received Service Worker training increases by 1 percentage point, the area’s older dislocated workers’ EER becomes 0.06 percentage point higher, compared to older dislocated workers who are in Agricultural, Forestry, Fishing and Related, Construction, and Extractive occupations and controlling for other variables.
Table 3 Fixed Effect Panel Data Model Estimates for Older WIA Program Participants Who Are Dislocated Workers
POPULATION GROUP: DISLOCATED WORKERS
DEPENDENT VARIABLE: ENTERED EMPLOYMENT RATE Fixed-effects (within) regression

19
INDEPENDENT VARIABLES Coef. Std. Err. t P>|t|
UNEMPLOYMENT RATE
Unemployment Rate Level 0.0168149 0.0130652 1.29 0.198
Unemployment Rate Trend ‐0.0287712 0.0143462 ‐2.01 0.045
DEMOGRAPHIC INFORMATION
Age at Registration ‐0.0137948 0.0015805 ‐8.73 0.000 Male 0.0028158 0.0140803 0.2 0.842
Hispanic 0.0288499 0.028227 1.02 0.307
Asian (not Hispanic) ‐0.0259991 0.0368624 ‐0.71 0.481
Native Hawaiian or Pacific Islander (not Hispanic) 0.0343185 0.1212326 0.28 0.777
American Indian or Alaska Native 0.1163797 0.0678828 1.71 0.087
White(not Hispanic) 0.023401 0.0185467 1.26 0.207
Mixed not Hispanic ‐0.0412238 0.0568056 ‐0.73 0.468 HEALTH STATUS
Disabled ‐0.0228398 0.0274906 ‐0.83 0.406 EDUCATION ATTAINMENT
High School Diploma /GED ‐0.1434284 0.0923218 ‐1.55 0.120
AA or AS Diploma/Degree 0.1841377 0.0334348 5.51 0.000
BA or BS Diploma/Degree ‐0.0173378 0.110996 ‐0.16 0.876
Occupational Skills Licensure/Certificate/Credential 0.0972123 0.0149796 6.49 0.000
SOCIOECONOMIC STATUS
Veteran 0.0045801 0.0152199 0.3 0.763
Employed at Participation 0.0362872 0.0268083 1.35 0.176
Limited English ‐0.0285468 0.031234 ‐0.91 0.361 Low Income 0.060984 0.0511892 1.19 0.234
Temporary Assistance to Needy Families (TANF) 0.1137865 0.2699375 0.42 0.673
Other Public Assistance Recipient ‐0.1783591 0.1161673 ‐1.54 0.125
PROGRAM PARTICIPATION DATA
Training Length ‐0.0002823 0.0000187 ‐15.1 0.000
National Emergency Grant 0.0106345 0.0317255 0.34 0.737
Trade Adjustment Assistance (TAA) ‐0.043001 0.0189468 ‐2.27 0.023
Wagner-Peyser Act 0.0198991 0.0211108 0.94 0.346
SERVICES AND OTHER RELATED ASSISTANCE DATA
Received Supportive Services (except needs-related payments) 0.0425163 0.0146239 2.91 0.004
Needs-Related payments 0.0303082 0.0608594 0.5 0.619
Received Core Self-Services and Informational Activities 0.0506986 0.018824 2.69 0.007

20
Received Workforce Information Services 0.0284463 0.020002 1.42 0.155
Established Individual Training Account (ITA) ‐0.031655 0.0185049 ‐1.71 0.087
Pell Grant Recipient ‐0.0614274 0.0386687 ‐1.59 0.112
Received Pre-Vocational Activities ‐0.0081501 0.023164 ‐0.35 0.725
Type of Training Service
On-the-Job Training 0.0617694 0.0283098 2.18 0.029
Skill Upgrading & Retraining 0.0534248 0.0319535 1.67 0.095
Entrepreneurial Training ‐0.0328344 0.0625962 ‐0.52 0.600
ABE or ESL in Combination with Training ‐0.0117201 0.0709926 ‐0.17 0.869
Customized Training 0.1229962 0.0503191 2.44 0.015
Occupational Category of Training
Managerial, administrative, professional or technical 0.019298 0.033341 0.58 0.563
Sales, clerical and administrative support 0.0183524 0.0343191 0.53 0.593
Service workers 0.0603768 0.0362665 1.66 0.096 Mechanics, installers, repairers, precision
workers, machine setters, set-up operators, operators, tenders,
assemblers, hand workers, transportation and related workers, and military
0.0142394 0.032695 0.44 0.663
constant 1.488055 0.1202214 12.38 0.000
sigma_u 0.1938907
sigma_e 0.36502747
rho 0.22005326 (fraction of variance due to u_i)
Number of Observations: 5780
Group Variable: WIB
Number of Groups: 438
Obs per Group: min= 1
avg= 13.2
max= 105
R-sq: within= 0.0864
between= 0.0535
overall= 0.0915
corr(u_i, Xb): ‐0.1833
F(41,5301) = 12.23
Prob > F = 0.0000
F test that all u_i=0: F(437, 5301) =1.30; Prob > F = 0.0001
Model Estimates for Older Adult Workers
The testing results for older adult workers share some similarities with that for older dislocated workers, but there are important differences as well. Several demographic, educational, socioeconomic, and

21
occupational background variables that were shown not to be statistically significant (at p=0.1 level) for older dislocated workers now are statistically significant for older adult workers. This could be related to the general fact that workers who participate in WIA adult programs and services tend to be more homogeneously low income residents with limited prior attachment to the labor market, compared to dislocated workers. Similarly, participants in the dislocated worker programs have relatively higher wages. On the other hand, several WIA program and service factors and unemployment rates that were statistically significant for older dislocated workers in Table 3 now are not statistically significant for older adult workers. This could be related to the fact that adult program participants tend to have little prior attachment to the labor market, while participants in the dislocated worker program have had strong attachment to the labor market. Stronger prior attachment to the labor market better prepares workers for employment, helps workers target specific WIA programs and enhances certain WIA program and service sensitivity to EER.
When controlling for other factors, unemployment rates, no matter for the level measure or the trend measure, are not statistically significant at p=0.1 level for older adult workers’ EER. Since adult workers were previously not strongly attached to the labor market, it is understandable that the change of market conditions represented by unemployment rates does not show significant effects for older adult workers.
Among demographic variables, the age variable again shows a negative effect to older adult workers’ EER. Older workers tend to be associated with a lower EER. Controlling for other variables, when the mean age of a Workforce Investment Area’s older adult workers increases by 1 year, those older adult workers’ EER drops by 0.93 of a percentage point. As older adult workers get older, it becomes more difficult for them to get a job after exiting the WIA programs and services, as explained earlier in the paper. In this case, older workers with the oldest ages who want or need to find a job would need special attention from policy makers and WIA program designers.
Similar to older dislocated workers, the gender effect is not statically significant (p=0.1). For races and ethnicities, Workforce Investment Areas with a higher share of Hispanic and non-Hispanic White older adult workers tend to have a higher EER, compared to non-Hispanic Black older adult workers. Holding other variables constant, when a Workforce Investment Area’s shares of Hispanic and non-Hispanic White older adult workers rise by 1 percentage point, the area’s older adults’ EER becomes respectively 0.11 and 0.07 of a percentage point higher than that of non-Hispanic Black older adult workers. Other races and ethnicities do not have statistically significant difference from non-Hispanic Blacks in EER. This implies that policy attention could be directed to give some focus on certain minority older adults, including non-Hispanic Blacks, non-Hispanic Asians, Native Hawaiian or Pacific Islander (not Hispanic), American Indian or Alaska Native, and those with non-Hispanic mixed races.
Although disability does not show statistically significant effect on older dislocated workers’ EER, disability reduces older adult workers’ EER with statistical significance at p=0.05 level. Controlling for other variables, when a Workforce Investment Area’s share of disabled older adults increases by 1 percentage point, the area’s older adults’ EER drops by 0.07 of a percentage point. Disability could result in more difficulty for older workers to find a job. The fact that a higher share of older adults than older dislocated workers reported disability could have helped enhance this factor’s statistical significance among older adults. According to Appendix B and Appendix C, averagely 3.9 percent of dislocated workers reported disability across all units of analysis, but averagely 7.7 percent of older adults reported disability. The lower income levels of older adults, as compared to older dislocated workers, is another contributing factor that could deepen the negative impact of disability with more statistical significance. Therefore, special policy attention should be paid to older adult workers with disabilities.
For education attainments, college or full-time technical or vocational school education and education with occupational skills and credentials are associated with a higher EER among older adults. Compared to older adults with lower than high school education or with no reported education, when a Workforce Investment Area’s shares of older adults with college or full-time technical or vocational school education and education with occupational skills and credentials increase by 1 percentage point, the areas’ older adults’ EER becomes respectively 0.15 and 0.12 of a percentage point higher, controlling for other variables. This is consistent with the test results for older dislocated workers. Those two types of education attainments are more

22
career oriented and therefore could increase EER. Different from older dislocated workers, high school education (or GED) shows a statistically significant (p=0.05) effect on older adult workers’ EER. Areas with a higher share of older adult workers who only reported high school (including GED) as education attainment have a lower EER, compared to older adults with lower than high school education or with no reported education and holding other variables constant20. Among socioeconomic variables, Workforce Investment Areas with a higher share of low income older adult workers have a lower EER. When a Workforce Area’s share of low income older adults increases by 1 percentage point, the area’s older adults’ EER drops by 0.04 of a percentage point, controlling for other variables. This low income effect is statistically significant (p=0.05), though this was not the case for older dislocated workers. This low income effect difference reflects the different natures between dislocated workers and adults. While dislocated workers have relatively high income, adults have very low incomes. Among all older workers subject to the regression tests across all units of analysis, only 1.7 percent of older dislocated workers are low income residents, however 56 percent of older adults are low income residents. Other socioeconomic variables, such as veteran status, employment status at participation, English levels, and TANF and other public assistance reception situation, are again not statistically significant for older adult workers (p=0.1).
Training length again shows a negative effect on EER for older adult workers, as well as for older dislocated workers. Workforce Investment Areas with an averagely longer training length among older workers are associated with a lower EER. When the training length of a Workforce Investment Area’s older adults increase by 1 day, those older adult workers’ EER drops by 0.02 of a percentage point, controlling for other variables. This effect is again highly significant (p=0.001).
Different from older dislocated workers, receiving services or benefits financially assisted by Trade Adjustment Assistance (TAA) programs do not show statistically significant (p=0.1) impact on older adult workers’ EER. The relatively small number of older adults who were assisted by TAA could have reduced the statistical significance. Among older dislocated workers, 20 percent of them were assisted by TAA, but for older adults, this percentage dropped to only 1.1 percent, according to Appendix B and Appendix C. Being served by an NEG program or receiving services or benefits financially assisted by Wagner-Peyser programs has no statistically significant impact for either older dislocated workers or older adult workers (p=0.1).
Among WIA services and other related assistance variables, receiving Supportive Services (except needs-related payments) boosts older adult workers’ EER (p=0.1). Controlling for other variables, when a Workforce Investment Area’s share of older adult workers who received Supportive Services (except needs-related payments) increases by 1 percentage point, the area’s older adult workers’ EER increases respectively by 0.04 of a percentage point. This effect for older adult workers is consistent with that for older dislocated workers. Although receiving Core Self-Services and Informational Activities and establishing Individual Training Account (ITA) have statistically significant impact on older dislocated workers’ EER, those two factors do not have significant impact on older adult workers’ EER at p=0.1 level. This could be related to the major differences between adults and dislocated workers, such as their prior attachment to the labor market, as explained earlier in this section. None of the following WIA services or related assistance, including Needs-Related payments, Workforce Information Services, Pell grants, and Pre-Vocational Activities, have a significant impact on older adult workers or older dislocated workers’ EER.
20 Compared to older adults with lower than high school education or with no reported education, when a Workforce Investment Area’s shares of older adults with high school (including GED) education increase by 1 percentage point, the areas older adults’ EER becomes 0.42 of a percentage point lower, controlling for other variables. It is not surprising that older workers with relatively low education attainment like high school (including GED) or less (i.e., lower than high school education) tend to have more difficulty in finding a job and those two levels of education attainment could have undistinguishable impact on EER. Therefore, for older dislocated workers, the impact of high school education (or GED) was not statistically significant, compared to older dislocated workers with lower than high school education or with no reported education. For older adults, however, this impact of high school education (or GED) becomes statistically significant and negative, relative to that of lower than high school education or with no reported education. This could be related to the better-off nature of dislocated workers in the job market and might hint at the lower average job quality for older adults, compared to the job quality for older dislocated workers. Further investigation on this could be an extension of this research.

23
As for the types of training services, On-the-Job Training has a positive and statistically significant impact on older adult workers’ EER, as well as on older dislocated workers’ EER. Workforce Investment Areas with a higher share of older workers who received On-the-Job Training have a higher EER, controlling for other variables. Compared to Other Occupational Skills Training, when a Workforce Investment Area’s shares of older adult workers who received On-the-Job Training increase by 1 percentage point, the area’s older adult workers’ EER becomes 0.12 of a percentage point higher, controlling for other variables.
However, Customized Training has a positive and significant impact on older dislocated workers’ EER, and has significant but negative effect on older adult workers’ EER. Compared to Other Occupational Skills Training, when a Workforce Investment Area’s shares of older adult workers who received Customized Training increase by 1 percentage point, the area’s older adult workers’ EER becomes 0.14 of a percentage point lower, controlling for other variables. As mentioned before, dislocated workers have a stronger prior attachment to the labor market. This strong prior attachment to the labor market makes it easier for dislocated workers to identify their training needs and help to design customized training for themselves. However, for older adults with limited prior attachment to the labor market, customized training could be less helpful to them and therefore even show a negative impact when compared to the impact of Other Occupational Skills Training. Similarly, Skill Upgrading & Retraining has a significant and positive effect on older dislocated workers EER, and does not have a significant effect on older adult workers’ EER. Neither of the Entrepreneurial Training or ABE/ ESL in Combination with Training have significant impact on older workers’ EER, for either older dislocated workers or for older adults. As indicated earlier, there are a limited number of older workers who participated in the Entrepreneurial Training and ABE/ESL training, which helps explain the lack of statistical significance. Entrepreneurship is possibly not the first priority for most older workers in the WIA program, and nor is English a major concern to many older workers. Most people who need ABE or ESL training are immigrants; most immigrants who are looking for a job tend to be younger, not older.
Among occupational categories of training, compared to Agricultural, Forestry, Fishing and Related Workers, Construction, and Extractive Workers, all other four occupational categories of training21 are associated with higher EERs for older adult workers. Compared to Agricultural, Forestry, Fishing and Related Workers, Construction, and Extractive Workers and controlling for other variables, an area’s older adult workers’ EER becomes respectively 0.14, 0.10, 0.16, and 0.13 of a percentage point higher, when the Workforce Investment Area’s shares of older adult workers increase by 1 percentage point for the following occupational categories of training: (a) Managerial, Administrative, Professional or Technical Workers, (b) Sales, clerical and administrative support Workers, (c) Service Workers, and (d) Mechanics, Installers, Repairers, Precision Workers, Machine Setters, Set-up Operators, Operators, Tenders, Assemblers, Hand Workers, Transportation and Related Workers, and Military Employees. For dislocated workers, only impacts from Service Worker training have a significant impact (p=0.1), while other occupation categories have positive impacts that were not significant. Compared to Agricultural, Forestry, Fishing and Related Workers, Construction, and Extractive Workers, the other four occupational categories of training tend to be knowledge-based or service related jobs that require relatively less physical labor and strength. This situation could benefit older workers; therefore training in those occupational categories could enhance their EER. As adults tend to be a more homogeneously low-income group with limited resources, the training effect could show up more evidently than that for dislocated workers. This might partially help explain the difference in statistical significance of those occupational categories for older adults versus for older dislocated workers.
Table 4 Random Effect Panel Data Model Estimates for Older WIA Program Participants Who Are Adults
POPULATION GROUP: ADULTS
21 Those occupational categories include (1) Managerial, administrative, professional or technical, (2) Sales, clerical and administrative support, (3) Service workers, and (4) Mechanics, installers, repairers, precision workers, machine setters, set-up operators, operators, tenders, assemblers, hand workers, transportation and related workers, and military occupations.

24
DEPENDENT VARIABLE: ENTERED EMPLOYMENT RATE Random effects u_i ~ Gaussian
INDEPENDENT VARIABLES Coef. Std. Err. t P>|t|
UNEMPLOYMENT RATE
Unemployment Rate Level 0.0018059 0.0081674 0.22 0.825 Unemployment Rate Trend ‐0.0352783 0.0215427 ‐1.64 0.102
DEMOGRAPHIC INFORMATION
Age at Registration ‐0.0093111 0.0020708 ‐4.5 0.000
Male ‐0.0055131 0.0221473 ‐0.25 0.803 Hispanic 0.1053346 0.0326824 3.22 0.001
Asian (not Hispanic) ‐0.0022945 0.0579831 ‐0.04 0.968
Native Hawaiian or Pacific Islander (not Hispanic) 0.1594613 0.1579125 1.01 0.313
American Indian or Alaska Native ‐0.0088495 0.0991271 ‐0.09 0.929
White(not Hispanic) 0.0679957 0.0225965 3.01 0.003
Mixed not Hispanic 0.1243167 0.0860148 1.45 0.148 HEALTH STATUS
Disabled ‐0.0713425 0.0315089 ‐2.26 0.024 EDUCATION ATTAINMENT
High School Diploma /GED ‐0.4162823 0.1779513 ‐2.34 0.019 AA or AS Diploma/Degree 0.1538826 0.0778017 1.98 0.048 BA or BS Diploma/Degree ‐0.0266752 0.1392866 ‐0.19 0.848
Occupational Skills Licensure/Certificate/Credential 0.1170023 0.0187078 6.25 0.000
SOCIOECONOMIC STATUS
Veteran ‐0.0077172 0.0237544 ‐0.32 0.745 Employed at Participation 0.1386255 0.0921702 1.5 0.133
Limited English 0.0399606 0.0451793 0.88 0.376 Low Income ‐0.0397435 0.0180465 ‐2.2 0.028
Temporary Assistance to Needy Families (TANF) ‐0.0286952 0.0786419 ‐0.36 0.715 Other Public Assistance Recipient ‐0.0208225 0.029699 ‐0.7 0.483
PROGRAM PARTICIPATION DATA
Training Length ‐0.0002497 0.0000297 ‐8.41 0.000 National Emergency Grant 0.0667152 0.0619613 1.08 0.282
Trade Adjustment Assistance (TAA) 0.0176829 0.0789964 0.22 0.823 Wagner-Peyser Act 0.0018309 0.0198566 0.09 0.927
SERVICES AND OTHER RELATED ASSISTANCE DATA
Received Supportive Services (except needs-related payments) 0.0378822 0.019315 1.96 0.050
Needs-Related payments 0.0215168 0.0812317 0.26 0.791
Received Core Self-Services and Informational Activities 0.0029197 0.0222041 0.13 0.895
Received Workforce Information Services 0.0283687 0.0209903 1.35 0.177 Established Individual Training Account (ITA) 0.0116964 0.0208823 0.56 0.575
Pell Grant Recipient ‐0.0264372 0.0555906 ‐0.48 0.634

25
Received Pre-Vocational Activities ‐0.0132815 0.0259433 ‐0.51 0.609 Type of Training Service
On-the-Job Training 0.117898 0.0292538 4.03 0.000 Skill Upgrading & Retraining 0.0088351 0.0336603 0.26 0.793
Entrepreneurial Training ‐0.0410963 0.1769088 ‐0.23 0.816 ABE or ESL in Combination with Training 0.1049368 0.1004306 1.04 0.296
Customized Training ‐0.1438236 0.0717727 ‐2 0.045 Occupational Category of Training
Managerial, administrative, professional or technical 0.1437004 0.0567912 2.53 0.011
Sales, clerical and administrative support 0.1043988 0.0575076 1.82 0.069 Service workers 0.160866 0.0586988 2.74 0.006
Mechanics, installers, repairers, precision workers, machine setters, set-up operators, operators, tenders, assemblers, hand workers, transportation and related
workers, and military
0.1314017 0.0551502 2.38 0.017
constant 1.115842 0.143045 7.8 0.000
sigma_u 0.04576398
sigma_e 0.38470506
rho 0.01395369 (fraction of variance due to u_i)
Number of Observations: 2380
Group Variable: WIB
Number of Groups: 342
Obs per Group: min= 1
avg= 7 max= 91
R-sq: within= 0.0796 between= 0.1527 overall= 0.1062
corr(u_i, Xb): 0 (assumed) Wald chi2(41) = 12.23 Prob > chi(2) = 0.0000
Discussion Although the two regression models are based on the same model, the different data and the very
different nature of older dislocated workers and older adults result in some different findings. The regression diagnostic statistics also show differences. For example, the model for older dislocated workers has limited explanation power due to a relatively low R-squared values, but the model for older adults has higher R-squared values. The higher financial and labor market homogeneity among adults could be related to the better model fit and therefore a better explanation power with higher R-squared values. On the other hand, the current model specification could be further enhanced. Considering the data limitations, a few robustness check and sensitivity analysis dropping certain variables and observations could be the first extension of this research. Adding a few variables, such as industry details, considering a microdata level test, and incorporating some

26
non-linear formalities could enhance the model specification. This study has tested for serial autocorrelations, but sometimes spatial autocorrelations could distract model estimates as well. Future study can also consider spatial autocorrelations and spatial spillover effects in the empirical models.
Conclusion This paper relies on the WIASRD 2007 data and BLS unemployment data and adopts a random effect model and a fixed effect panel data model to identify factors associated with older workers’ EER after exiting WIA programs. The statistical test is conducted separately for older dislocated workers and older adults.
Summary of Findings
Several common factors are identified that affect older workers’ EER. The common factors that are associated with a higher EER include having a college degree or finished full-time technical or vocational school education, attained education with occupational skills and credentials, receiving Supportive Services (except needs-related payments), receiving On-the-Job Training, and training for Service Workers as occupations. For example, when a Workforce Investment Area’s share of older workers who received Supportive Services (except needs-related payments) increases by 1 percentage point, the area’s older workers’ EER increases by 0.04 of a percentage point, controlling for other variables. This effect is consistent for both older dislocated workers and older adult workers. Compared to Other Occupational Skills Training and controlling for other variables, when a Workforce Investment Area’s shares of older adult workers who received On-the-Job Training increase by 1 percentage point, the area’s older adult workers’ EER becomes 0.12 of a percentage points higher; when a Workforce Investment Area’s share of older dislocated workers who received On-the-Job Training increases by 1 percentage point, the area’s older dislocated workers’ EER becomes 0.06 of a percentage point higher.
The common factors that are associated with a lower EER include an older age and a longer training length. Holding other variables constant, when the mean age of a Workforce Investment Area’s older dislocated workers increases by 1 year, these older dislocated workers’ EER decreases by 1.4 percentage points; when the mean age of a Workforce Investment Area’s older adult workers increases by 1 year, those older adult workers’ EER drops by 0.93 of a percentage point. Compared to other factors observed in the model testing, the age effects are relatively strong. Controlling for other variables, when the average training duration of a Workforce Investment Area’s older dislocated workers increase by 1 day, those older dislocated workers’ EER drops by 0.03 of a percentage point; when the training length of a Workforce Investment Area’s older adults increase by 1 day, those older adult workers’ EER drops by 0.02 of a percentage point. This training length effect is highly significant (p=0.001). Although this training length effect appears not to be strong with relatively small regression coefficients (0.0003 or 0.0002), the 0.03 or 0.02 percentage points’ decrease in EER is relative to each additional day of training. If changing the training length scale to weeks, months, or even years, this training length effect will jump to a much larger scale. The model for older dislocated workers and the model for older adults also identify several different factor effects on EER. Some are related to data distributions. For example, disability is not a significant (p=0.1) factor affecting older dislocated workers’ EER, but this factor has a significant effect on older adults’ EER. Controlling for other variables, when a Workforce Investment Area’s share of disabled older adults increases by 1 percentage point, the area’s older adults’ EER drops by 0.07 of a percentage point. It is not surprising that disability brings down older workers’ EER because disability often results in greater difficulty for older workers in finding a job. The fact that a higher share of older adults than older dislocated workers reported disabilities helps contribute to statistical significance in the case of older adults. According to Appendix B and Appendix C, on average 3.9 percent of dislocated workers reported disability across all units of analysis, but 7.7 percent of older adults reported disability on average. Compared to older dislocated workers,

27
older adults’ lower income level is another contributing factor that could deepen the negative impact of disability. Also, different from older dislocated workers, receiving services or benefits financially assisted by Trade Adjustment Assistance (TAA) programs do not show statistically significant (p=0.1) impact on older adult workers’ EER. The relatively small number of older adults who were assisted by TAA could have contributed to reduce the statistical significance. Among older dislocated workers, 20 percent of them were assisted by TAA, but for older adults, this percentage dropped to only 1.1 percent, according to Appendix B and Appendix C.
Other different or even opposite variable effects for older dislocated workers versus older adults are related to the different natures of dislocated workers and adults. For example, low income is not a significant factor for older dislocated workers’ EER, but it is a significant factor for older adults’ EER. Controlling for other variables, when a Workforce Area’s share of low income older adults increase by 1 percentage point, the area’s older adults’ EER drops by 0.04 of a percentage point. The prevalence of low income among adults is a direct cause for the significant low income effect on older adults. Adults tend to have very low income and more than half of older adults in this study are low-income residents; however, only 1.7 percent of older dislocated workers are low-income residents. While Core Self-Services and Information Activities, Skill Upgrading & Retraining and Customized Training have significant and positive effect for older dislocated workers’ EER, those services and types of training do not show statistical significance for older adults’ EER. Older adults’ limited prior attachment to the labor market makes it more difficult to customize training or choose specific skill upgrading and retraining that cater to their needs. Similarly, older adults’ limited prior attachment to the labor market makes the minimal level of training, such as self-services and informational activities, not sufficiently helpful. WIA program success with older dislocated workers is sensitive to cyclical changes in labor market conditions. The innovative two-vector unemployment rate measure shows its advantage in measuring economic cycles. For older dislocated workers, the unemployment rate level does not have significant impact, but it is the unemployment rate trend that captures the economic cyclical effect on EER. The unemployment rate trend shows an advantage in measuring unemployment rate, not just because it captures the direction of economic change, but because it captures the timing of unemployment rate level. This solves the potential dubious role of unemployment rates in employment growth. When the unemployment rate increase of a state where a Workforce Investment Area situates goes up by 1 percentage point, this Workforce Investment Area’s older dislocated workers’ EER drops by 0.03 of a percentage point, holding other variables constant. For older adults, although unemployment rate measures do not seem significant, it could be related to adults’ limited prior attachment to the labor market that makes them less sensitive to cyclical economic conditions.
Policy Implications
The empirical tests also identify some policy implications. In terms of policy equity perspective, the findings suggest a need to draw policy attentions in several specific directions. The older cohorts among older workers deserve more policy attention in workforce programs and training, as older ages among older workers are associated with a lower EER, and this age effect is strong, as noted earlier.
Low income older workers, particularly low income older adults, deserve more policy attention to enhance their EER. Over half of observed older adults are low income residents, and their low income status results in a lower EER. Low income older adult workers are among those who need the most assistance. Similarly vulnerable are the older adult workers with disabilities. They deserve more funds to be allocated to empower them in the labor market. Additional social support would also be helpful to them.
For older adult workers, special focus can also be placed on certain minority groups, including non-Hispanic Blacks, non-Hispanic Asians, Native Hawaiian or Pacific Islander (not Hispanic), American Indian or Alaska Native, and those with non-Hispanic mixed races.
The findings also suggest some implications for policy efficiency and effectiveness. Among the services and related assistance, keeping and expanding Supportive Services (except needs-related payments) would help

28
to stabilize and strengthening EER for older workers. For the training types, more funding focusing on On-the-Job Training would help to enhance EER for both older dislocated workers and older adults.
Better monitoring training length would be helpful to enhance the cost effectiveness of WIA training programs. For both older dislocated workers and older adults, the tests reveal that longer training is associated with a lower EER. However, please note that it is necessary to allow relatively longer training time for older workers to digest the training and learning. The standard deviation of training length shown in the WIASRD 2007 data is as high as about a year with the longest training duration spanning almost ten years. What this paper wants to call for policy makers’ monitoring is not the reasonably longer learning time necessary to trainees, but the unreasonably long training duration spanning for over several years22. Based on preliminary data analysis, the long training length was not related to older ages. Instead, many occurrence of long training lengths were from the youngest cohorts among senior WIA participants. The number of cases of long training length was not extremely few. Further investigation on the impact of training length from one specific service or a few services would be needed. It is also necessary to target funds on needs and prioritize the funding directions. Emphasizing Core Self-Service and Information Activities would be helpful for older dislocated workers who are better prepared with skills and labor market information, but not necessarily for older adults. For older dislocated workers, policy attention can continue focusing on Skill Upgrading and Retraining and Customized Training, but not necessarily for older adults. For older dislocated workers, not all occupational categories of training should be priorities, but focusing on Service Worker training could be effective. For older adults, policy could be oriented to allocate extra funds to On-the-Job Training and could be diversified to various occupational categories of training.
Future Research Directions
Further exploration on other potential factors, such as industry details and spatial effects, could be helpful to add more nuances. Due to the data limitations, a few robustness check and sensitivity analysis can be conducted as an extension of this current research. Future research could also consider incorporating non-linear modeling, micro level data, and spatial autocorrelation and spillover effects to enhance the model specification.
22 Please note that the training length does not mean a participant’s total participation of a specific WIA training program. Instead, it is calculated as the time span from the participation of the first service to the exit from the last service. This would therefore result in some long training length because of returning participants for the same or different services over the years. Based on preliminary analysis on training length, it was associated with the nature of service/training and other personal factors like the participants’ education attainment.

29
References Ashenfelter, O. (1978), “Estimating the Effect of Training Programs on Earnings”, Review of Economics and
Statistics, 60, 47–57. Audretsch, D.B., Carree, M.A., and Thurik, A.R. (2000), “Does Entrepreneurship Reduce Unemployment?”
Unpublished Working Paper. Available at http://www.bls.gov/opub/mlr/2000/07/art1full.pdf. Beier, M. E., and Ackerman, P. L. (2005). “Age, Ability, and the Role of Prior Knowledge on the Acquisition
of New Domain Knowledge: Promising Results in a Real-World Learning Environment.” Psychology and Aging, 20, 341-355.
Brown, S. K. (2003). “Staying Ahead of the Curve 2003:The AARP Working in Retirement Study.” AARP Knowledge Management: Washington DC.
Bureau of Labor Statistics, (2009), 2008 Annual table: Employment status by detailed age group, sex, and race. Washington, DC: U.S., Department of Labor. Available at http://www.bls.gov/cps/cpsaat3.pdf.
Carlson, M. C., Hasher, L., Zacks, R. T., and Connelly, S. L. (1995). “Aging, Distraction, and the Benefits of Predictable Location.” Psychology and Aging, 10, 427-436.
Charness, N.. (2004). “The Age-Ability-Productivity Paradox”. Conference processing of a Wharton Impact Conference, Maximizing Your Labor force: Employees Over 50 In Today’s Global Economy. Nov. 10, 2004. University of Pennsylvania and AARP Global Aging Program.
Charness, N. and Czaja, S. J. (2006), “Older Worker Training: What We Know and Don’t Know,” AARP working paper #2006-22.
Charness, N., Schumann, C. E., and Boritz, G. A. (1992). “Training Older Adults in Word Processing: Effects of Age, Training Technique and Computer Anxiety.” International Journal of Aging and Technology, 5, 79-106.
Collison, J. (2003). (program manager). “Older Workers Survey.” SHRM research, June 2003. Society for Human Resource Management (SHRM), National Older Worker Career Center (NOWCC) and Committee for Economic Development (CED).
Colquitt, J. A., LePine, J. A., and Noe, R. A. (2000). “Toward an Integrative Theory of Training Motivation: A Meta-Analytic Path Analysis of 20 Years of Research.” Journal of Applied Psychology, 85, 678-707.
Crown, W. H. and Longino, C. F., Jr. (2000). “Labor Force Trends and Aging Policy.” E. W. Markson & L. A. Hollis-Sawyer (Eds.). Intersections of aging: Readings in social gerontology. Los Angeles: Roxbury.
Czaja, S. J., Hammond, K., Blascovich, J., and Swede, H. (1989). “Age-Related Differences in Learning to Use a Text-Editing System.” Behavior and Information Technology 8, 309-319.
Elias, P. K., Elias, M. F., Robbins, M. A., and Gage, P. (1987). “Acquisition of Word- Processing Skills by Younger, Middle-Aged, and Older Adults.” Psychology and Aging, 2, 340-348.Psychology, 85, 678-707.
Eyster, L., Johnson, R. W., and Toder, E. (2008), “Current Strategies to Employ and Retain Older Workers,” Urban Institute Report to the Department of Labor, Employment and Training Administration. Retrievable at World Wide Web www.urban.org/publications/411626.html.
Friedberg, L.. (2003). "The Impact Of Technological Change On Older Workers: Evidence From Data On Computer Use," Industrial and Labor Relations Review, v56 (3,Apr), 511-529.
Fisk, A. D., Rogers, W. A., Charness, N., Czaja, S. J., and Sharit, J. (2004). Designing for Older Adults: Principles and Creative Human Factors Approaches. Boca Raton, Florida: CRC Press.
Gist, M., Rosen, B., and Schwoerer, C. (1988). “The Influence of Training Method and Trainee Age on the Acquisition of Computer Skills.” Personal Psychology, 41, 255-265.
Heidkamp, M. (2009), “Older and Out of Work: Trends in Older Worker Displacement,” SCSEP Senate Briefing, Rutgers University: available at http://www.heldrich.rutgers.edu/uploadedFiles/Publications/Older%20Workers%20PPT_5_14_09_Heidkamp.pdf, May 14, 2009
Hooymann, N. R. and Kiyak, H. A.. (2005). Social Gerontology: A multidisciplinary Perspective. Boston: Allyn and Bacon. Chapter 1, 8, 9, 12, 14, 16.

30
Human Resources Development Canada, (1999). “Older Worker Adjustment Programs Lessons Learned (Final Report): Evaluation and Data Development Strategic Policy.” Human Resources Development Canada, Government of Canada: SP-AH093-12-99E. Retrieved from World Wide Web on Aug 30, 2005 at http://www11.hrdcdrhc.gc.ca/pls/edd/OWAP_134000.htm.
Office of Technology Assessment. Worker Training: Competing in the New International Economy. Washington, DC: OTA, September 1990. (ED 326 622).
Maurer, T., Weiss, M. , and Barbeite, F. (2003). “A model of Involvement in Work-Related Learning and Development Activity: The Effects of Individual, Situational, Motivational and Age Variables.” Journal of Applied Psychology, 88, 707-724.
Mead, S., and Fisk, A. D. (1998). “Measuring skill acquisition and retention with an ATM simulator: The need for age-specific training.” Human Factors, 40, 516-523.
Mead, S. E., Spaulding, V. A., Sit, R. A., Meyer, B., and Walker, N. (1997). “Effects of Age and Training on World Wide Web Navigation Strategies.” Proceedings of the Human Factors and Ergonomics Society 41st Annual Meeting, 152-156. Santa Monica, California: Human Factors and Ergonomics Society.
Morrell, R. W., Park, D. C., Mayhorn, C. B., and Echt, K. V. (1995). Older Adults and Electronic Communication Networks: Learning to Use ELDERCOMM. Paper presented at the 103rd Annual Convention of the American Psychological Association. New York.
Munnell, A., Muldoon D., and Sass, S. A., (2009). Recessions & Older Workers, IB#9-2, Chestnut Hill, MA: Center for Retirement Research at Boston College, 10 pp., available at http://crr.bc.edu.
National Institute on Aging, (2007). Growing Older in America: The Health & Retirement Study, Chapter 2: “Work & Retirement,” Bethesda, MD: National Institutes of Health, available at http://www.nia.nih.gov/ResearchInformation.
Peterson, P. G., 1999. Gray Dawn: How the Coming Age Wave Will Transform America—and the World. Times Books, Random House: New York.
Resnick, B., Mills, M. E., and Nahm, E. (2004). “Web Use Can Improve Quality of Life for Elders,” Maximizing Human Potential, Vol. 11, No. 3 (Winter 2004). pp. 4, 6.
Rix, S. E., (1990). Older Workers. Santa Barbara, CA: ABC-CLIO. Rix, S. (2006). “Foreword,” in Charness, N. and Czaja, S. J. “Older Worker Training: What We Know and
Don’t Know,” AARP working paper #2006-22. Schmidt, F. L., and Hunter, J. (2004). “General Mental Ability in the World of Work: Occupational Attainment
and Job Performance.” Journal of Personality and Social Psychology,86, 162-173. Schneider, B. A., Daneman, M., Murphy, D. R., and Kwong See, S. (2000). “Listening to Discourse in
Distracting Settings: The Effects of Aging.” Psychology and Aging, 15, 110-125. Schulz, R. and T. A. Salthouse. (1999). Adult development and aging: Myths and emerging realities (3rd
Edition). Upper Saddle River, New Jersey: Prentice Hall. Sterns, H. L. and McDaniel, M. A. (1994). “Job Performance and the Older Worker.” In Sara E. Rix (Editor),
Older Workers: How Do They Measure Up? Washington, DC: AARP. Taeuber, C. and Graham, M. R., (2007). The Geographic Distribution and Characteristics of Older Workers,
available at http://lehd.did.census.gov/led/library/profiles_2007.html. Thurow, L.C. (1975). Generating Inequality, New York: Basic Books. U. S. Department of Labor, Bureau of Labor Statistics. (2005). Tomorrow’s Jobs. Washington, D.C.: U.S.
Department of Labor. U.S. Department of Labor, Employment and Training Administration. (2007a). “PY 2005 WIASRD Data
Book.” Washington, DC: U.S. Department of Labor, Employment and Training Administration. Available at http://www.doleta.gov/performance/results/PY_2005_WIASRD_DataBook_Rev%208-14-2007.pdf.
U.S. Department of Labor, Employment and Training Administration. (2007b). “Senior Community Service Employment Program (SCSEP).” Available at http://www.doleta.gov/seniors/.
U.S. Department of Labor, Employment and Training Administration. (2008a). “PY 2006 WIASRD Data Book,” Washington, DC: U.S., Department of Labor, Employment and Training Administration.

31
Available at http://www.doleta.gov/performance/results/PY2006_WIASRD_Data_Book_Revised_31708.pdf.
U.S. Department of Labor, Employment and Training Administration. (2008b). “PY 2007 WIASRD Data Book,” Washington, DC: U.S. Department of Labor, Employment and Training Administration. Available at http://www.doleta.gov/performance/results/pdf/PY2007_WIASRD_Data_Book.pdf.
U.S. Department of Labor, Employment and Training Administration. (2009). ‘The WIA National Summary of Annual Performance Data,” Washington, DC: U.S. Department of Labor, Employment and Training Administration. Available at http://www.doleta.gov/performance/results/wia_national_performance.cfm.
Zellner, Arnold (1962). ""An efficient method of estimating seemingly unrelated regression equations and tests for aggregation bias"". Journal of the American Statistical Association 57: 348–368.doi:10.2307/2281644.
Zhang, T., (2008a). Older Entrepreneurship for an Aging U.S. Economy: It’s Never Too Late, London, New Jersey, Singapore: World Scientific.
Zhang, T., (2008b). Aging in the "Knowledge Economy": Crises or Opportunities? Saarbrucken, Germany: VDM (Verlag Dr. Mueller).
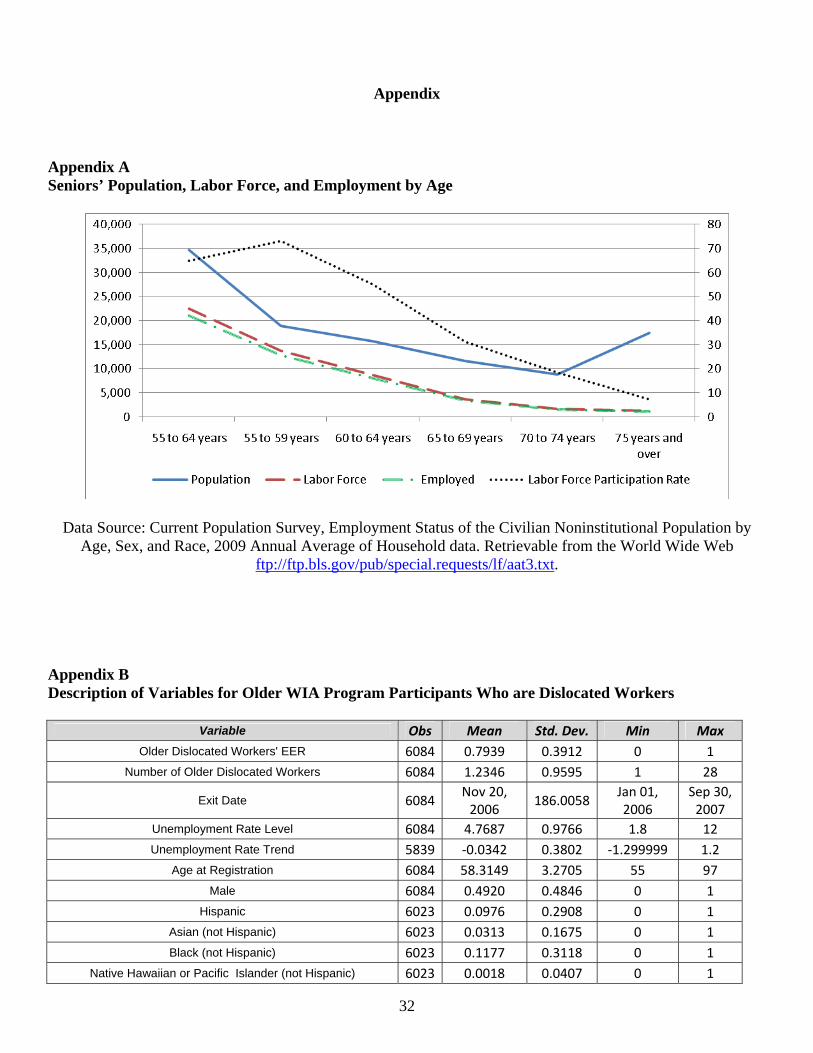
32
Appendix
Appendix A Seniors’ Population, Labor Force, and Employment by Age
Data Source: Current Population Survey, Employment Status of the Civilian Noninstitutional Population by Age, Sex, and Race, 2009 Annual Average of Household data. Retrievable from the World Wide Web
ftp://ftp.bls.gov/pub/special.requests/lf/aat3.txt. Appendix B Description of Variables for Older WIA Program Participants Who are Dislocated Workers
Variable Obs Mean Std. Dev. Min Max
Older Dislocated Workers' EER 6084 0.7939 0.3912 0 1 Number of Older Dislocated Workers 6084 1.2346 0.9595 1 28
Exit Date 6084Nov 20, 2006
186.0058 Jan 01, 2006
Sep 30, 2007
Unemployment Rate Level 6084 4.7687 0.9766 1.8 12 Unemployment Rate Trend 5839 ‐0.0342 0.3802 ‐1.299999 1.2
Age at Registration 6084 58.3149 3.2705 55 97 Male 6084 0.4920 0.4846 0 1
Hispanic 6023 0.0976 0.2908 0 1 Asian (not Hispanic) 6023 0.0313 0.1675 0 1 Black (not Hispanic) 6023 0.1177 0.3118 0 1
Native Hawaiian or Pacific Islander (not Hispanic) 6023 0.0018 0.0407 0 1

33
American Indian or Alaska Native 6023 0.0060 0.0753 0 1 White(not Hispanic) 6023 0.7361 0.4294 0 1 Mixed not Hispanic 6023 0.0095 0.0945 0 1
Disabled 6084 0.0386 0.1845 0 1 Veteran 6084 0.1939 0.3819 0 1
Employed at Participation 6084 0.0783 0.2644 0 1
Limited English 6084 0.0796 0.2671 0 1 Low Income 6084 0.0169 0.1260 0 1
High School Diploma /GED 6084 0.0040 0.0603 0 1 AA or AS Diploma/Degree 6084 0.0341 0.1769 0 1 BA or BS Diploma/Degree 6084 0.0028 0.0517 0 1
Occupational Skills Licensure/Certificate/Credential 6084 0.6478 0.4673 0 1 Temporary Assistance to Needy Families (TANF) 6084 0.0003 0.0181 0 1
Other Public Assistance Recipient 6084 0.0026 0.0502 0 1 Training Length 6084 417.6150 341.2550 0 3548
National Emergency Grant 6084 0.1023 0.3003 0 1 Trade Adjustment Assistance (TAA) 6084 0.1982 0.3939 0 1
Wagner-Peyser Act 6084 0.7277 0.4412 0 1 Received Supportive Services (except needs-related
payments) 6084 0.2928 0.4463 0 1
Needs-Related payments 6084 0.0090 0.0916 0 1 Received Core Self-Services and Informational Activities 6084 0.3206 0.4620 0 1
Received Workforce Information Services 6084 0.4297 0.4902 0 1 Established Individual Training Account (ITA) 6084 0.6645 0.4663 0 1
Pell Grant Recipient 6084 0.0255 0.1548 0 1 Received Pre-Vocational Activities 6084 0.1885 0.3875 0 1
On-the-Job Training 6084 0.0722 0.2551 0 1 Skill Upgrading & Retraining 6084 0.1237 0.3271 0 1
Entrepreneurial Training 6084 0.0082 0.0894 0 1 ABE or ESL in Combination with Training 6084 0.0083 0.0890 0 1
Customized Training 6084 0.0167 0.1247 0 1 Managerial, administrative, professional or technical 6084 0.3206 0.4530 0 1
Sales, clerical and administrative support 6084 0.2827 0.4369 0 1 Service workers 6084 0.1080 0.3005 0 1
Agricultural, forestry, fishing and related workers, construction and extractive workers 6084 0.0312 0.1691 0 1
Mechanics, installers, repairers, precision workers, machine setters, set-up operators, operators, tenders, assemblers, hand
workers, transportation and related workers, and military 6084 0.2575 0.4264 0 1

34
Appendix C Description of Variables for Older WIA Program Participants Who are Adults
Variable Obs Mean Std. Dev. Min Max Older Adults' EER 2489 0.7736 0.4088 0 1
Number of Older Adults 2489 1.1535 0.7210 1 16
Exit Date 2489Dec 01, 2006
186.3938 Jan 01, 2006
Sep 30, 2007
Unemployment Rate Level 2489 4.7356 1.2251 2.2 12.1 Unemployment Rate Trend 2410 ‐0.0137 0.3794 ‐1.1 1.2
Age at Registration 2489 58.5982 3.8906 55 99 Male 2489 0.4993 0.4887 0 1
Hispanic 2457 0.1232 0.3220 0 1 Asian (not Hispanic) 2457 0.0243 0.1500 0 1
Black (not Hispanic) 2457 0.2029 0.3950 0 1 Native Hawaiian or Pacific Islander (not Hispanic) 2457 0.0032 0.0547 0 1
American Indian or Alaska Native 2457 0.0074 0.0810 0 1 White(not Hispanic) 2457 0.6287 0.4754 0 1 Mixed not Hispanic 2457 0.0103 0.0982 0 1
Disabled 2489 0.0767 0.2597 0 1 Veteran 2489 0.1948 0.3877 0 1
Employed at Participation 2489 0.0085 0.0892 0 1 Limited English 2489 0.0434 0.1996 0 1
Low Income 2489 0.5613 0.4891 0 1 High School Diploma /GED 2489 0.0028 0.0530 0 1 AA or AS Diploma/Degree 2489 0.0123 0.1086 0 1 BA or BS Diploma/Degree 2489 0.0034 0.0575 0 1
Occupational Skills Licensure/Certificate/Credential 2489 0.6647 0.4650 0 1 Temporary Assistance to Needy Families (TANF) 2489 0.0113 0.1032 0 1
Other Public Assistance Recipient 2489 0.0997 0.2945 0 1 Training Length 2489 331.6957 309.4293 0 3013
National Emergency Grant 2489 0.0185 0.1340 0 1
Trade Adjustment Assistance (TAA) 2489 0.0111 0.1042 0 1 Wagner-Peyser Act 2489 0.7008 0.4531 0 1
Received Supportive Services (except needs-related payments) 2489 0.2896 0.4471 0 1 Needs-Related payments 2489 0.0111 0.1029 0 1
Received Core Self-Services and Informational Activities 2489 0.3146 0.4607 0 1 Received Workforce Information Services 2489 0.3752 0.4816 0 1
Established Individual Training Account (ITA) 2489 0.6550 0.4714 0 1 Pell Grant Recipient 2489 0.0234 0.1493 0 1
Received Pre-Vocational Activities 2489 0.1499 0.3549 0 1 On-the-Job Training 2489 0.1270 0.3299 0 1
Skill Upgrading & Retraining 2489 0.0970 0.2952 0 1 Entrepreneurial Training 2489 0.0020 0.0448 0 1

35
ABE or ESL in Combination with Training 2489 0.0080 0.0879 0 1 Customized Training 2489 0.0158 0.1210 0 1
Managerial, administrative, professional or technical 2489 0.2339 0.4155 0 1 Sales, clerical and administrative support 2489 0.2482 0.4236 0 1
Service workers 2489 0.1548 0.3554 0 1 Agricultural, forestry, fishing and related workers, construction
and extractive workers 2489 0.0239 0.1502 0 1
Mechanics, installers, repairers, precision workers, machine setters, set-up operators, operators, tenders, assemblers, hand
workers, transportation and related workers, and military 2489 0.3393 0.4663 0 1