workforce race equality standard (wres) 2019 …...workforce race equality standard (wres) 2019...
TRANSCRIPT

Pag
e1
Workforce Race Equality Standard (WRES) 2019 Report
Pag
e2
Executive Summary
The WRES came into effect on 1st April 2015. The standard is designed to improve the
representation and experience of BAME (Black, Asian and Minority Ethnic) staff at all levels
of the organisation, focusing on experiences within their employment such as recruitment,
management, training development and opportunities. To provide a context this standard’s
focus is on staff comprising of White British, White Irish and White Other in comparison to
BAME staff.
Overall there are nine indicators that make up the NHS WRES Standard. These are detailed
on page 2 and comprises of workforce indicators (1 – 4), staff survey indicators (5 – 8) and
an indicator focused on board representation.
The report provides:
A summary of the key findings in this reporting period (2018/19), in comparison to the
previous year (2017/18) in accordance with the three workforce themes: workforce diversity
(indicators 1 – 4), staff experience (indicators 5 – 8) and leadership diversity (indicator 9).
More detail on the nine indicators and any contributing factors.
Areas of focus for the coming year, 2019/20.
A summary of the key findings based on most up to date workforce analytics include:
The Trust’s Workforce composite (based on the last financial year 2018/19) is White
84.2%, BAME 15.2% and 0.6% unknown.
62% of the consultant workforce is made up of BAME staff.
11.1% of the overall workforce is made up of non-medical BAME staff and 4.1% of
the overall workforce is made up the medical BAME staff
BAME representation within the Trust is higher by 2.1% in the non-medical workforce
and 6.2% greater in comparison to the local population, which is reported at 9%
(JSNA 18/19) for Tameside and Glossop at a slightly higher 12% in Tameside.
Percentage of BAME staff experiencing harassment, bullying or abuse from patients,
relatives of members of the public had fallen significantly by 9% from 2018 to 2019
BAME representation in leadership (Bands 8A – VSM, has risen from 9% to 12% in
the clinical workforce from 2018 to 2019.

Pag
e3
The areas of concerns are as follows:
BAME staff reporting experiences of harassment, bullying and abuse from Patients/
Visitors and Staff remains higher than white staff by 2%, at 25%
Percentage of BAME staff experiencing harassment, bullying or abuse from staff has
risen by 5% from the previous year at 37% in comparison to white staff
Percentage of BAME staff personally experiencing discrimination at work from a
manager / team leader is at an all-time high of 20, 3.3 times higher than white staff
BAME diversity in senior leadership roles (Bands 8A to VSM) has fallen by 5% in
non-clinical roles
BAME staff view that equal opportunities for career progression exist within the Trust
has fallen from the previous year by 6.2%, currently at 82.6%
Trust Board BAME representation is reported at 0% again for 2018, in comparison to
the overall workforce percentage of 15.2%.
Pag
e4
NHS WORKFORCE RACE EQUALITY STANDARD (WRES) 2018/19
Background
The WRES standard is designed to report on representation and experience of BAME staff
within the organisation, focusing on their employment such as recruitment, management,
training development and opportunities.
The WRES standard was introduced to prompt an inquiry to better understand why BAME
staff often receive much poorer treatment than White staff in the workplace and to facilitate
the closing of those gaps.
National research and evidence strongly suggest that less favourable treatment of Black and
Ethnic Minority (BAME) staff occurs in the NHS, which ultimately leads to a negative impact
on the efficiency and effective running of the NHS and the quality of care received by
patients.
It is important that the Trust actively monitors performance locally, to fully understand any
inequality or disparity that occurs and to take the necessary actions in light of the WRES
findings.
This document reports on Trust’s activity between 1st April 2018 and 31st March 2019
against the WRES, in accordance with the three workforce themes: workforce diversity
(indicators 1 – 4), staff experience (indicators 5 – 8) and leadership diversity (indicator 9). A
copy of this report will be made published on the Trust’s Website.
WRES Results
There are a total of nine indicators that makes up the WRES; split across Workforce, Staff
Survey and Board Representation. These are detailed in the following table 1.
Table 1 WRES 2018/ 19
Workforce Indicators
1 Percentage of staff in each of the AfC Bands 1-9, Medical and Dental and VSM staff
groups compared by:
Pag
e5
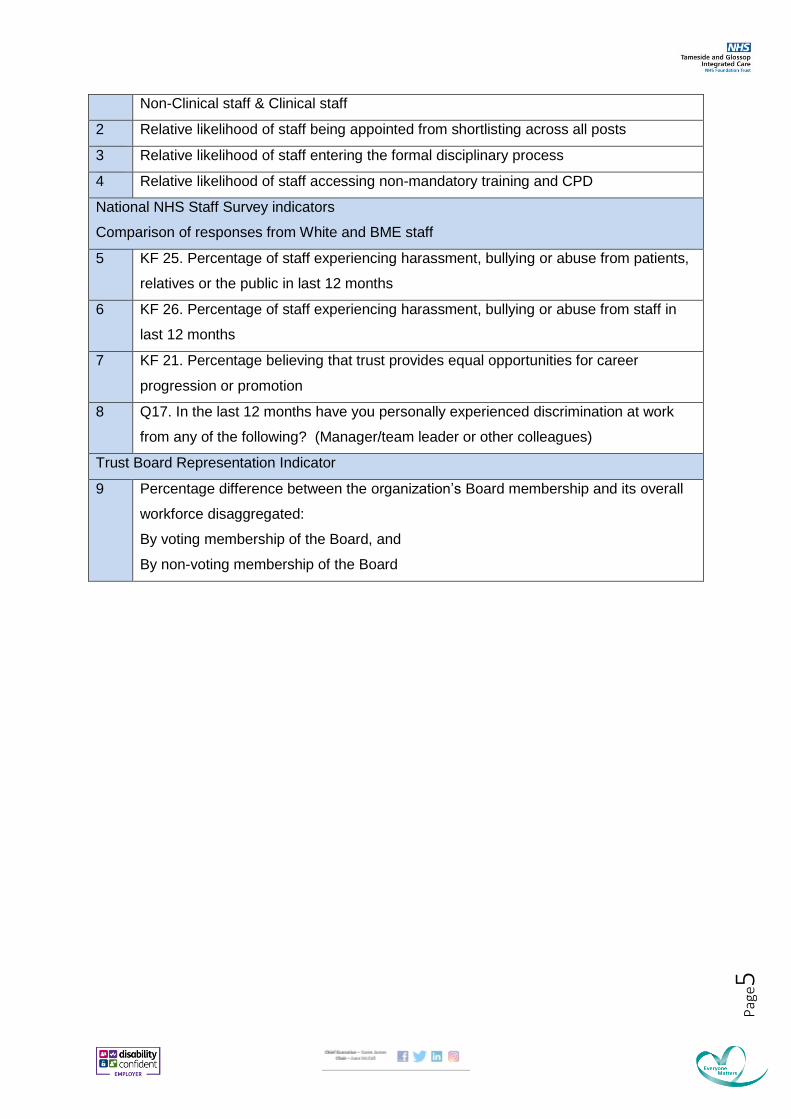
Non-Clinical staff & Clinical staff
2 Relative likelihood of staff being appointed from shortlisting across all posts
3 Relative likelihood of staff entering the formal disciplinary process
4 Relative likelihood of staff accessing non-mandatory training and CPD
National NHS Staff Survey indicators
Comparison of responses from White and BME staff
5 KF 25. Percentage of staff experiencing harassment, bullying or abuse from patients,
relatives or the public in last 12 months
6 KF 26. Percentage of staff experiencing harassment, bullying or abuse from staff in
last 12 months
7 KF 21. Percentage believing that trust provides equal opportunities for career
progression or promotion
8 Q17. In the last 12 months have you personally experienced discrimination at work
from any of the following? (Manager/team leader or other colleagues)
Trust Board Representation Indicator
9 Percentage difference between the organization’s Board membership and its overall
workforce disaggregated:
By voting membership of the Board, and
By non-voting membership of the Board

Pag
e6
3. Workforce Diversity: WRES Results This section provides a full breakdown of the WRES results by indicators 1- 4, based on the
reference period of 2018/19 in comparison to the previous year (2017/18).
At the point of the WRES report submission for 18/19, the Trust employed 4003 staff of
which 84.2% was White British/ Irish/ Other, compared to 15.2% reported as BAME and
0.6% who have not declared their ethnicity. In comparison to the previous year BAME
representation in the Trust has neither increased nor decreased, despite the 3.1% growth in
over all workforce size. Figure 1 provides an overview of the Trust’s demographics in the
last 3 years.
Figure 1: Percentage of Staff by Ethnicity
Based on the indicators highlighted in Table 1, please note the following definitions:
Agenda for Change (Band 1- 9) and Medical and Dental define different terms and
conditions of the employment for employees within the NHS.

Pag
e7
Very Senior Managers (VSM) are employees who are paid above Band 9 or on spot
salaries, including Executive Board members.
Clinical Staff are individuals who are employed in roles such as Health Care Assistant, Staff
Nurses, Midwives, Sister, Therapist etc. Those employees who would provide direct clinical
care to patients.
Non-Clinical Staff are individuals who are employees in roles such as Administrative
Assistants, Reception staff, Domestic and Portering etc. Those employees who provide a
support function within the Trust.
Indicator 1 - Percentage of staff who are employed on Agenda for Change (AFC)
Medical and Dental and VSM (Very Senior Managers)
3.4 The tables 2 and 3 provide an overview of the workforce breakdown for both Clinical
and Non-Clinical Staffing within the Trust.
Table 2: Breakdown of Clinical staff by Ethnicity
Headcount %
WRES Banding BAME White Not
Stated/Not
Given
BAME White Not
Stated/Not
Given
Band 1 0 3 0 0% 100% 0%
Band 2 95 542 1 15% 85% 0%
Band 3 4 127 1 4% 96% 0%
Band 4 7 150 0 4.5% 95.5% 0%
Band 5 143 475 5 23% 76% 1%
Band 6 52 513 3 9% 90% 1%
Band 7 22 264 1 8% 92% 0%
Band 8a 7 63 0 10% 90% 0%
Band 8b 2 12 0 14% 86% 0%

Pag
e8
Band 8c 0 1 0 0% 100% 0%
Band 8d 0 5 0 0% 100% 0%
Band 9 0 0 0 0% 0% 0%
VSM 1 7 0 12.5% 87.5% 0%
Medical & Dental
Consultant
78 44 3 62% 35% 3%
Senior Medical
Manager
4 4 1 44% 44% 12%
Medical & Dental
Non-Consultant
Career Grade
61 14 1 80% 18% 2%
Medical & Dental
Trainee Grades
30 37 4 42% 52% 6%
Total 505 2261 20 18% 81% 1%
3.5 Overall, BAME representation within the Clinical staff group has neither increased
nor decreased in BAME diversity from 2018 to 2019.
3.6 There has been an increase in BAME representation in the following Bands in
comparison to the previous year:
Band 3 increase of 1% from 2018
Band 5 increase by 1% from 2018
3.7 There has been some movement in the level of BAME representation in Medical and
Dental roles, as highlighted below:
Middle/ Career Grade roles – there was an 11% increase from 2018
Trainee Grade roles – there was a 7% decrease from 2018

Pag
e9
3.8 When analyzing the reasons behind the turnover in the medical roles, the following
are the main themes.
15.38 % of BAME resignations relate to ‘completion of a fixed term contract/ end of
training contract’
69.23% of BAME resignations related to ‘voluntary resignation’
26.92% of resignation related to ‘Relocation and Work-life balance’
15.38% of BAME resignations related to ‘Retirement’
3.9 Since the last report, the Trust has undertaken a review of Medical staff retention,
followed by the development of an action plan focused on improving staff experience
within the Trust and to reduce the level of turnover in the medical roles.
3.10 BAME representation in clinical roles continues to remain low overall in comparison to
White Staff.
Table 3: Breakdown of Non-Clinical staff by Ethnicity
Headcount %
WRES Banding BAME White Not
Stated/Not
Given
BAME White Not
Stated/Not
Given
Band 1 25 215 6 10% 87% 3%
Band 2 26 291 1 8% 92% 0%
Band 3 15 198 1 7% 93% 0%
Band 4 10 175 0 5% 95% 0%
Band 5 2 52 1 4% 95% 1%
Band 6 5 31 0 14% 86% 0%
Band 7 7 48 0 13% 87% 0%
Band 8a 1 23 0 4% 96% 0%
Band 8b 1 23 1 4% 92% 4%
Band 8c 1 9 0 10% 90% 0%
Band 8d 0 4 0 0% 100% 0%
Band 9 0 1 0 0% 100% 0%
VSM 0 7 1 0% 88% 12%
Total 93 1077 11 8% 91% 1%

Pag
e10
3.11 Overall BAME representation within the Non-Clinical staff group has neither
increased not decreased compared to the previous year, at 8%.
3.12 Significant workforce variation in BAME diversity includes:
2% increase in BAME representation at Band 2 roles from the 2018 position
1% increase in Band 4 roles from the 2018 position
6% decrease in Band 5 roles from the 2018 position
8% decrease in Band 6 roles from the 2018 position
3% decrease in Band 8A roles from the 2018 position
11% decrease in Band 8B roles from the 2018 position
7% decrease in Band 8C roles from the 2018 position
The Trust has developed a Talent Management Strategy initially focusing on succession
planning on senior management roles, which will assist in the progression of employees
within the first 4 tiers within the Trust. This work is further supported by the actions detailed
in the EDI Workforce Strategy 2019 - 21 for leadership diversity.
Indicator 2 – Recruitment and Selection
3.14 This indicator looks to analyse the relative likelihood of BAME applicants being
appointed from shortlisting compared to that of White applicants. This indicator looks to
report on all recruitment within the Trust, both internal and external recruitment initiatives.
3.15 Since the last report for 17/18, the Trust has implemented a new recruitment
software known as TRAC which is an ‘end to end’ recruitment package. For example, this
software allows for vacancies to be advertised through to the management of successful
candidates (including the issuing of employment contracts). This software came into place
from October 2017.
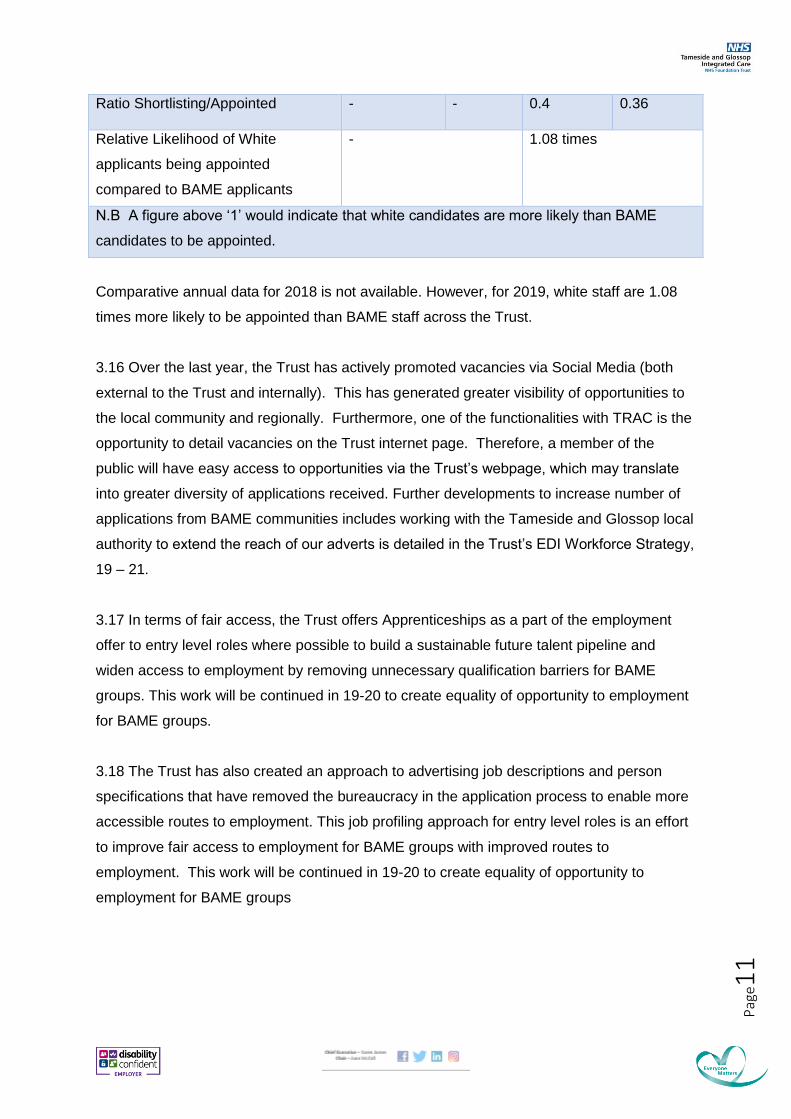
Table 4: Breakdown of Shortlisting v Appointment by Ethnicity
2018 2019
Descriptor White BAME White BAME
Number of Applications Received - - 7577 3392
Number of Shortlisted Applicant - - 1445 513
Number of appointed Applicants - - 571 187
Pag
e11
Ratio Shortlisting/Appointed - - 0.4 0.36
Relative Likelihood of White
applicants being appointed
compared to BAME applicants
- 1.08 times
N.B A figure above ‘1’ would indicate that white candidates are more likely than BAME
candidates to be appointed.
Comparative annual data for 2018 is not available. However, for 2019, white staff are 1.08
times more likely to be appointed than BAME staff across the Trust.
3.16 Over the last year, the Trust has actively promoted vacancies via Social Media (both
external to the Trust and internally). This has generated greater visibility of opportunities to
the local community and regionally. Furthermore, one of the functionalities with TRAC is the
opportunity to detail vacancies on the Trust internet page. Therefore, a member of the
public will have easy access to opportunities via the Trust’s webpage, which may translate
into greater diversity of applications received. Further developments to increase number of
applications from BAME communities includes working with the Tameside and Glossop local
authority to extend the reach of our adverts is detailed in the Trust’s EDI Workforce Strategy,
19 – 21.
3.17 In terms of fair access, the Trust offers Apprenticeships as a part of the employment
offer to entry level roles where possible to build a sustainable future talent pipeline and
widen access to employment by removing unnecessary qualification barriers for BAME
groups. This work will be continued in 19-20 to create equality of opportunity to employment
for BAME groups.
3.18 The Trust has also created an approach to advertising job descriptions and person
specifications that have removed the bureaucracy in the application process to enable more
accessible routes to employment. This job profiling approach for entry level roles is an effort
to improve fair access to employment for BAME groups with improved routes to
employment. This work will be continued in 19-20 to create equality of opportunity to
employment for BAME groups
Pag
e12
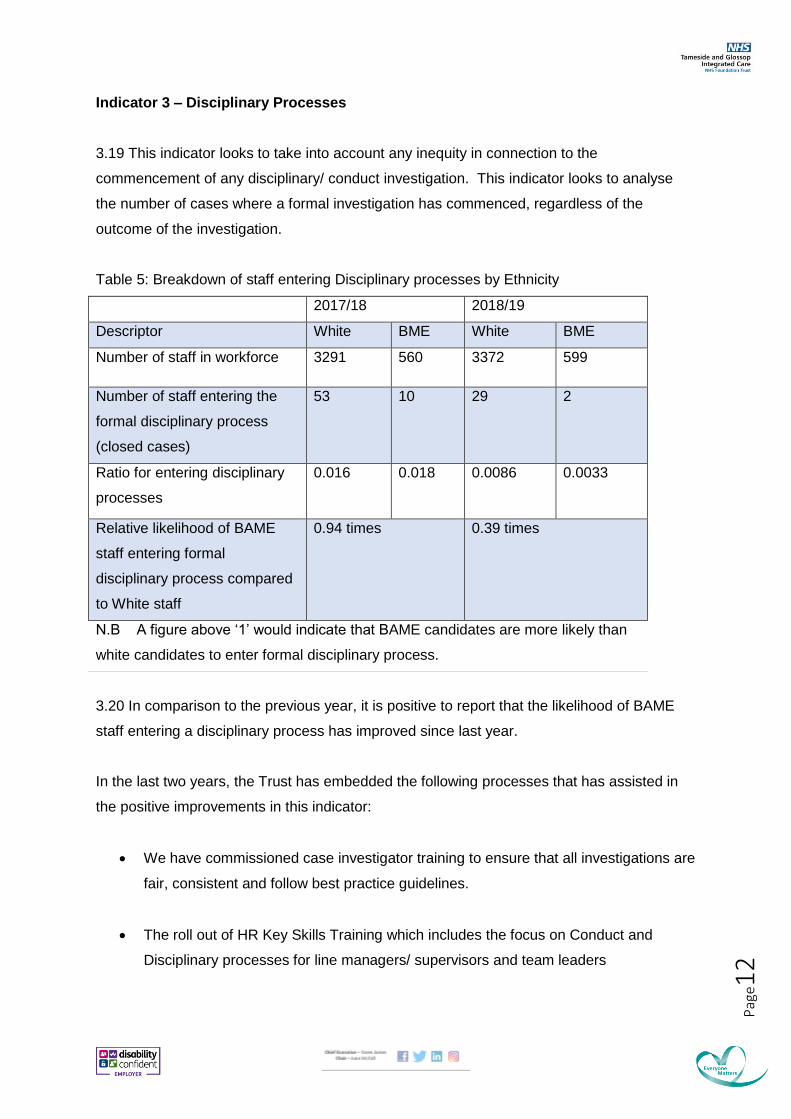
Indicator 3 – Disciplinary Processes
3.19 This indicator looks to take into account any inequity in connection to the
commencement of any disciplinary/ conduct investigation. This indicator looks to analyse
the number of cases where a formal investigation has commenced, regardless of the
outcome of the investigation.
Table 5: Breakdown of staff entering Disciplinary processes by Ethnicity
2017/18 2018/19
Descriptor White BME White BME
Number of staff in workforce 3291 560 3372 599
Number of staff entering the
formal disciplinary process
(closed cases)
53 10 29 2
Ratio for entering disciplinary
processes
0.016 0.018 0.0086 0.0033
Relative likelihood of BAME
staff entering formal
disciplinary process compared
to White staff
0.94 times 0.39 times
N.B A figure above ‘1’ would indicate that BAME candidates are more likely than
white candidates to enter formal disciplinary process.
3.20 In comparison to the previous year, it is positive to report that the likelihood of BAME
staff entering a disciplinary process has improved since last year.
In the last two years, the Trust has embedded the following processes that has assisted in
the positive improvements in this indicator:
We have commissioned case investigator training to ensure that all investigations are
fair, consistent and follow best practice guidelines.
The roll out of HR Key Skills Training which includes the focus on Conduct and
Disciplinary processes for line managers/ supervisors and team leaders

Pag
e13
As part of the training, managers are advised of how ‘unconscious bias’ can influence
decisions when managing incidents and/or disciplinary processes.
By creating a greater awareness of unconscious bias, it will allow managers to reflect
on decisions they have made (and/ or are likely to make in the future).
Anyone who is facing a formal disciplinary investigation is assigned a neutral ‘buddy’
who is there to provide support and advice to them
Indicator 4 – Staff Accessing Non-Mandatory Training
This indicator focuses on the opportunities provided to staff regarding non-mandatory
training and CPD, particularly to identify the likelihood of BAME staff compared to White
staff.
At the Trust all mandatory and non-mandatory training is publicized via existing internal
communication channels for staff members to access regardless of their ethnicity. There are
two type of non-mandatory training, one which is advertised centrally and coordinated via the
Education and Training team, and separately training that is organized and advertised in the
locally teams. Table 6 reports on training activity recorded on the Trust’s OLM system.
Table 6: Breakdown of staff accessing non-mandatory training by Ethnicity
2017/18 2018/19
Descriptor White BAME White BAME
Number of staff accessing non-
mandatory training
3291 559 3233 578
Relative likelihood of White staff
accessing non-mandatory training
compared to BME staff
1.00 0.99
N.B A figure below ‘1’ would indicate that BME candidates are more likely than white
candidates to access non-mandatory training.
Based on the comparison between 17/18 and 18/19, there has been a 3.3% drop in BAME
access of CPD which is slightly lower by 0.8% than white staff.

Pag
e14
Since the last report, the following work has been underway:
The roll-out of the Talent Management Strategy is continuing and currently focusses
on the development of employees within the first ‘four tiers of management’ of the
Trust.
The Appraisal Window closes at the end of September 2019. Staff have been having
Appraisal conversations to include a rating of their Behaviours and Performance over
the last year and to set objectives for the coming 12 months too. New for this year to
the Appraisal was the introduction of an approach to reflect on carer responsibilities
and work/life balance to prompt supportive management action in this area.
4.Staff Experience: WRES Results (National Staff Survey Findings)
Indicator 5 - Staff experiencing harassment, bullying or abuse from Patients/ Public
4.1 The NHS staff survey question (KF25) explores responses relating to staff experiencing
harassment, bullying or abuse from patients, relatives or the public in last 12 months.
4.2 The findings within the indicator has highlighted that 23% White Staff and 25% BAME
staff have reported such experiences. Whilst a 2% disparity exists between White and
BAME staff, there has been a significant 9% improvement in the negative experience of
BAME staff between last year and 2019 within this indicator which highlighted a 34% rate of
bullying, harassment or abuse for BAME staff in 2018.
4.3 Over the last year, the Trust instigated Staff Focus groups (aimed to support BAME staff)
to provide the opportunity to share their ‘lived experiences’ of working within the Trust along
with identifying areas of improvement. The Staff Focus groups were positively attended, the
benefits and added value of holding the forums were identified and going forwards the Trust
commits to continuing these arrangements, as further described in the EDI Workforce
Strategy for 2019-21.
Figure 2: Staff Survey results – Staff experiencing harassment, bullying or abuse from
Patients/ Public in the last 12 months (NB the lower the score the better)

Pag
e15
Indicator 6 – Staff experiencing harassment, bullying or abuse from staff in the last 12
months
4.4This indicator provides the percentage of staff experiencing harassment, bullying or
abuse from staff in the Trust in last 12 months. (KF 26)
Figure 3 presents the findings relating to the indicator, which shows that BAME staff (37%)
experience greater incidents of harassment, bullying or abuse from staff in comparison to
their White counterparts (27%), highlighting a striking 10% disparity in experience based on
ethnicity. There has been a 5% increase in this indicator for BAME staff from last year,
suggesting that bullying and harassment is on the rise from staff for groups with this
protected characteristic.
4.5 The Trust is committed to addressing the negative experiences of BAME staff
experience and as a result, have taken action to create both a staff equality network and
equality champions to enable creating psychological safety for minority groups as well as
provide opportunities to identify and eradicate experiences of discrimination, the details of
which are outlined in the EDI Workforce Strategy 19-21.
Figure 3: Staff Survey results – Staff experiencing harassment, bullying or abuse from
staff in the last 12 months (NB the lower the score the better)
Pag
e16
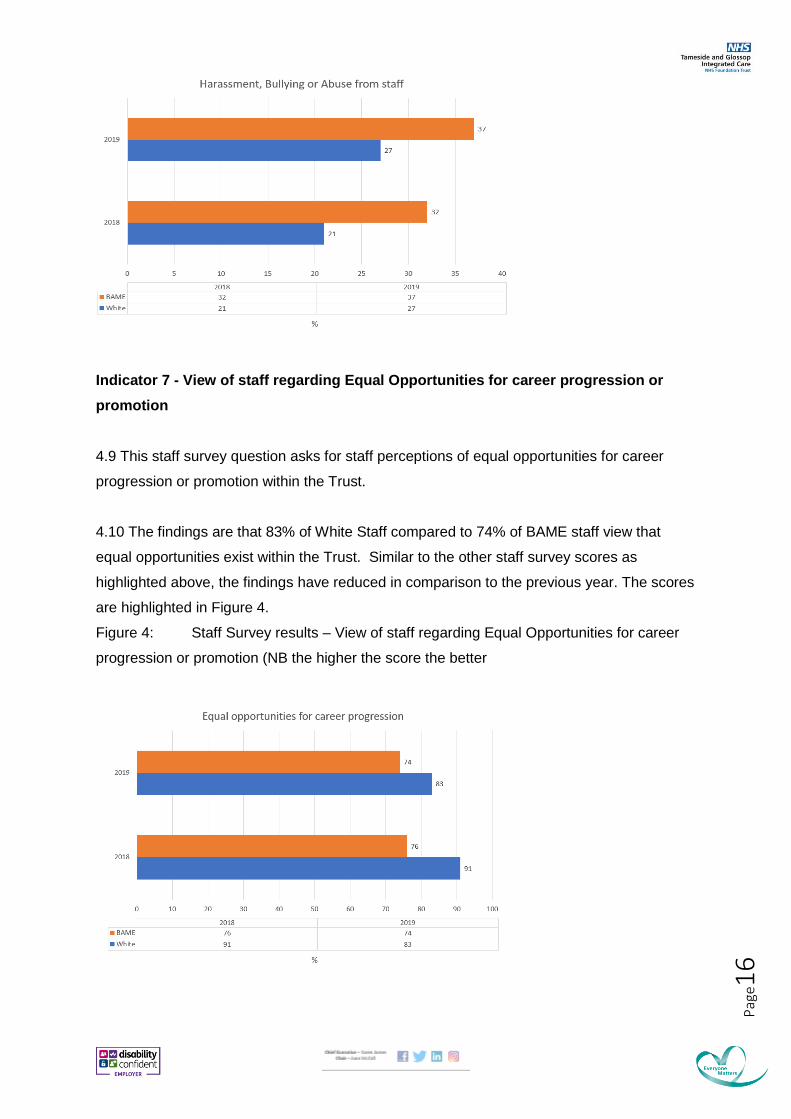
Indicator 7 - View of staff regarding Equal Opportunities for career progression or
promotion
4.9 This staff survey question asks for staff perceptions of equal opportunities for career
progression or promotion within the Trust.
4.10 The findings are that 83% of White Staff compared to 74% of BAME staff view that
equal opportunities exist within the Trust. Similar to the other staff survey scores as
highlighted above, the findings have reduced in comparison to the previous year. The scores
are highlighted in Figure 4.
Figure 4: Staff Survey results – View of staff regarding Equal Opportunities for career
progression or promotion (NB the higher the score the better

Pag
e17
4.11 As demonstrated in figure 4, there is a significant difference in the view of BAME staff
compared to White staff of 9%. The perception gap has closed somewhat from 15% of the
previous year to 9% for 2019 but the disparity in experience continues to exist.
4.12 Since the last report the Trust has established the ‘internal transfer scheme’ which has
assisted in creating greater opportunities for staff. The internal transfer scheme is open to
all staff, whereby they have the opportunity to request an internal move within the Trust to
another department or role i.e. a member of staff who is based in finance requesting a
transfer to the governance team etc. The criteria for such moves are that the opportunity
has to be at an equivalent band (not a promotion) and there has to be a vacancy available to
facilitate the transfer. Since the establishment of the scheme, the HR team have received
positive feedback from staff and will in turn result in staff retention.
Indicator 8 - Experience of discrimination from Managers/ Team Leaders
This last staff survey question explores staff experiences of discrimination within the
workplace by a manager or senior, in the last 12 months. (Q17)
The results of this staff survey questions shows that 20% of BAME staff reported
discrimination within the workplace from a manager or senior compared to 6% of White Staff
in 2019. The findings show an improvement in comparison to the previous year (21% BAME
staff and 5% White) and is better than the national average which was reported as 15%
BAME and 6% White staff.
Figure 5: Staff Survey results – Experience of discrimination from Managers/ Team
Leaders (NB the lower the score the better).

Pag
e18
Figure 5 shows that BAME staff are 3.33 times more likely to experience discrimination from
a manager than white colleague, an area of particular concern for the Trust.
Over the last 18 months, the Trust has continued to train line managers/ team leaders and
supervisors on HR Key Skills. As part of the training, managers are encouraged to reflect on
their management styles, they are taught the principles of being an authentic and
compassionate leader, good management techniques and a greater awareness of their
unconscious bias and how to manage with inclusive practice. As the training continues to be
rolled out, it is intended to create a greater skill set and awareness within the management
team to improve staff experience for BAME staff.
Based on the findings within indicator 5 through to 8, the Trust has rolled out a number of
Staff Focus groups aimed to support BAME staff. The aim of the focus groups is to allow for
BAME staff to feedback on their ‘lived experiences’ within the Trust and to share the
emergent stories as learning resource to drive large scale cultural change for Equality, as
described in the EDI workforce strategy 19 – 21.
The Trust will be actively rolling out a programme of bespoke face-to-face Equality and
Diversity training which is in addition to the standard e-learning training package that is
required of all employees. The training provides the attendees with a greater awareness of
the different types of discrimination, overview of reasonable adjustments, how to raise
concerns and the support that is available to staff.
5. Leadership Diversity: WRES Results (Indicator 9 - Trust Board Representation)
This indicator compares the BAME compliment on the Trust Board in comparison of the
overall workforce.
5.1 For the purpose of this indicator, Board membership includes all voting and non-
voting members of the Board and includes Executive and Non-Executive members.
5.2 As of 31st March 2019:
The Trust’s BAME workforce representation was 15.2%

Pag
e19
All board members (including voting and non-voting members) are White British.
There are 12 members on board, 1 Chair, 5 Non-Executive Directors and 6 Executive
Directors. 11 members of board are voting members and 1 member is non-voting.
The BAME representation on Trust Board has not changed from the previous year.
5.3 Based on the findings within this indicator, the Board BAME composite does not
reflect the local population (which is reported at 9%) or the overall BAME workforce which is
15.2%.
6. Summary of Key Findings
6.1 Indicator 1 shows that:
o The overall workforce compliment of BAME staff is 15.2%, as at 31st March
2019, demonstrating no progress for diversity since the position of 2018.
o The percentage of Clinical staff is reported at 18%. There has been no
increase from the previous year. The majority of the BAME clinical staff are
within Band 2 and Band 5 roles.
o Within Medical and Dental roles, there has been a significant growth of 11%
in non-consultant career grades and a decline of 7% in trainee roles.
o 2019 WRES data has also identified a 44% BAME workforce size in the
Senior Medical manager role that was not reported on last year.
o The percentage of Non-Clinical staff is reported at 8% with no variation from
the previous year.
6.2 Indicator 2 shows that people from a White Background are 1.08 times more likely to be
appointed (following shortlisting) than people from a BAME background.
6.3 Indicator 3 shows that BAME are 0.55 times more likely to enter a formal disciplinary
process at the Trust than white staff.
Pag
e20
6.4 Indicator 4 shows a slight reduction in the likelihood of White staff accessing non-
mandatory training which currently, white staff are 0.99 times likely to access CPD training in
comparison to BAME staff.
6.5 Indicator 5 shows an increase in BAME staff reporting bullying and harassment from
patients, relatives and the public. The current position is 25% of BAME, compared to 23% of
White Staff. There has been significant improvement in the experience of BAME staff this
year in comparison to last year.
6.6 Indicator 6 shows an increase in BAME staff experiencing bullying and harassment or
abuse from staff than the previous year. The current position is reported to 37% for BAME
staff compared to 27% for White staff.
6.7 Indicator 7 shows that BAME staff feel less likely that the Trust offers equal opportunities
in career progression, 74% of BAME staff compared to 83% of White Staff.
6.8 Indicator 8 shows a huge difference between the experience of BAME staff and white
staff in terms of discrimination from line managers at 20% for BAME staff and 6% for white
staff. This is a priority area of concern for the Trust
6.9 Indicator 9 shows that the all Trust board members (both voting and non-voting) are
White British, and therefore the board composite does not reflect BAME diversity, again a
priority area of concern for the Trust.
7. AREAS OF FOCUS FOR 2018/19
7.1 The area of focus relates to the following:
The development of a staff equality network to provide BAME staff with a forum to
address bullying, harassment and abuse with psychological safety
The development of a community of Equality Champions to challenge discrimination
in the workplace and advocate for the health and wellbeing of BAME staff
Talent pipelining, management and succession planning for BAME diversity in senior
leadership roles
Workforce diversity at all levels of the organisation
Pag
e21
Review of the employment cycle to create fair access to employment and promote
equality of opportunity for BAME staff.
The findings of the WRES report will be shared with the Trust’s Workforce Committee and
Equality and Diversity Steering Group whereby an action plan will be produced to deliver on
each of the findings.