working but poor: asian american poverty in new …aafny.org/doc/workingbutpoor.pdfv working but...
TRANSCRIPT

Working but Poor: Asian American Poverty
in New York City

Working but Poor: Asian American Poverty in
New York City
October 2008
Funding for the Report by C.J. Huang Foundation Ong Family Foundation
United Way of New York City

Data Citations from this report should include the following acknowledgment: “Data derived from analysis per-formed by the Asian American Federation Census Information Center.” For more information about the report, please contact the Asian American Federation Census Information Center at (212) 344-5878 x 19 or [email protected]. Copyright © 2008 Asian American Federation

iii
Working but Poor: Asian American Poverty in New York City
Table of Contents Foreword ......................................................................................................... v Definition of Terms ........................................................................................ vi Executive Summary ....................................................................................... ix Chapter 1: Introduction .................................................................................. 1 Chapter 2: Overview of Asian American Poverty in New York City ............ 3 Chapter 3: Demographics of Poor and Low-Income Asian New Yorkers ..... 9 Chapter 4: Children ...................................................................................... 17 Chapter 5: Working-Age Adults ................................................................... 23 Chapter 6: Seniors ........................................................................................ 35 Chapter 7: Policy Considerations ................................................................. 43 Appendix A: National Asian American Poverty Statistics .......................... 47
iv
Working but Poor: Asian American Poverty in New York City

v
Working but Poor: Asian American Poverty in New York City
Foreword For many years, the success stories of Asian Americans have masked the reality of families struggling to make ends meet. The fact that few poverty studies have included the Asian American population also has contributed to the invisibility of Asian Americans in poverty. To most poor Asian immigrants, the issue is not finding work but having the opportunity to earn a decent living to provide for their children and older family members. The primary hope for Asian American families in poverty is that their children will get an education that enables them to lift themselves and their parents up the economic ladder. This is the same dream that has inspired genera-tions of immigrant families from various countries, dating back to the early days of the American republic. Working but Poor tells a story that needs to be told: a population mostly of immigrants who work hard in their ac-tive adult life and often after retirement. Their collective labor helps fuel New York City’s economy. Yet they remain poor, often unprotected, and trapped on the lower rungs of the economic ladder. This story raises a funda-mental question of economic equity and equal protection under the social safety net. Since welfare reforms in the 1990s, the main focus of anti-poverty policy has been to reduce the number of people on government assistance. Mayor Bloomberg’s Commission for Economic Opportunity has presented a chance to take a more comprehensive approach. We applaud the mayor’s efforts and hope that this report will help inform the work of the New York City Center for Economic Opportunity. Similarly, we look to the philanthropic commu-nity for greater responsiveness to Asian Americans in need. Working but Poor is the first detailed study of Asian American poverty in New York City. The Federation would like to acknowledge the support of the C.J. Huang Foundation, the Ong Family Foundation, and United Way of New York City for their support of this research. We also would like to thank David Chen, Larry Lee, Setsuko Matsunaga Nishi and Shao-Chee Sim for their insights and contributions to this study. Together we can improve the lives of the most vulnerable members of our community. . Cao K. O Executive Director Asian American Federation

vi
Working but Poor: Asian American Poverty in New York City
vii
Working but Poor: Asian American Poverty in New York City
Definition of Terms Householder – The head of a household.
Age Categories Child – A person from birth to 17 years.
School-Age Child – A child age 5 to 17. Senior – A person age 65 or older. Working-Age Adult – A person age 18 to 64.
Young Adult – A person age 16 to 24.
English-Speaking Status Limited English Proficient (LEP) – Those who speak a language other than English at home and speak English less than very well are considered LEP by the Department of Justice for voting rights purposes. The Census Bu-reau categories for English proficiency are “speaks English very well,” “speaks English well,” “speaks English not well,” and “speaks English not at all.” Linguistic Isolation – Those living in a household in which no adults (people age 14 or older) speak English only or speak English very well.
Income Categories Poverty Status – Determined by the relationship of family income to the federal poverty threshold, shown in Ta-ble G.1. The poverty threshold is higher for families with more children.
Poor – The terms “in poverty” and “below poverty level” are also used synonymously in this report. An indi-vidual is considered poor if the individual or the individual’s family’s income is below the federal poverty threshold. Example: A family of two adults and two children under 18 years old with family income of less than $20,444 was considered poor in 2006.
Near-Poor – An individual is considered near-poor if the individual or the individual’s family’s income is above the federal poverty threshold but below twice the federal poverty threshold. Example: A family of two adults and two children under 18 years old with family income of MORE than $20,444 but LESS than $40,888 was considered near-poor in 2006.

viii
Working but Poor: Asian American Poverty in New York City
Low-income – An individual is considered low-income if the individual or the individual’s family’s income is below twice the federal poverty threshold. The poor and the near-poor income groups together make up the low-income population. Example: A family of two adults and two children under 18 years old with family income of less than $40,888 was considered low-income in 2006.
Table G.1: Poverty Thresholds for 2006 by Size of Family and Number of Related Children Under 18 Years
Source: U.S. Census Bureau.
Size of family unit
Weighted average thresholds
Related children under 18 years
None
One
Two
Three
Four
Five
Six
Seven
Eight or
More One person (unrelated individual) $10,294 Under 65 years $10,488 $10,488 65 years and over $9,669 $9,669 Two people $13,167 Householder under 65 years $13,569 $13,500 $13,896 Householder 65 years and over $12,201 $12,186 $13,843 Three people $16,079 $15,769 $16,227 $16,242 Four people $20,614 $20,794 $21,134 $20,444 $20,516 Five people $24,382 $25,076 $25,441 $24,662 $24,059 $23,691 Six people $27,560 $28,842 $28,957 $28,360 $27,788 $26,938 $26,434 Seven people $31,205 $33,187 $33,394 $32,680 $32,182 $31,254 $30,172 $28,985 Eight people $34,774 $37,117 $37,444 $36,770 $36,180 $35,342 $34,278 $33,171 $32,890 Nine people or more $41,499 $44,649 $44,865 $44,269 $43,768 $42,945 $41,813 $40,790 $40,536 $38,975

ix
Working but Poor: Asian American Poverty in New York City
Executive Summary
Introduction Asian American poverty in New York City is a serious, growing issue although it is largely unknown to the general public. The New York metropolitan area has the highest Asian poverty rate among the 10 metro areas with the most Asian residents, according to 2006 census information. The number of poor Asian New Yorkers also is in-creasing, as Asians are the fastest-growing major race or ethnic group in the city.1
To increase understanding and encourage improvements, the Asian American Federation is providing the first de-tailed report on Asian New Yorkers in poverty based on 2006 and 2000 U.S. Census Bureau data. This report is designed to inform policy discussions and create a foundation for tracking conditions of low-income2 Asians in the city over time. National Asian population statistics help cast Asians as the model minority. According to the 2006 American Community Survey (ACS), median household income for Asians nationwide was $63,642, higher than $52,375 for non-Hispanic whites. However, the poverty rate among Asians nationwide was almost 11 percent, higher than 9 percent for non-Hispanic whites. New York City presents greater contrasts between Asians on the one hand and non-Hispanic whites.
Key Findings
Asians in Poverty in New York City Have a Distinctive Set of Traits and Cir-cumstances.
• Asian New Yorkers are much more likely to live in poverty than non-Hispanic whites. Being near-poor is more common for Asians than for non-Hispanic whites, blacks and the population at large. In New York City in 2000, nearly 1 in 5 Asians (19.6 percent, or 152,674 people) lived below the poverty level and 40.9 percent (318,981) lived below twice the federal poverty level (in the low-income bracket). Those figures surpassed an 11.5 percent poverty rate and 24.0 percent low-income rate for non-Hispanic whites. Asians were less likely to be poor than New Yorkers at large, who had a 21.2 percent poverty rate, but Asians’ low-income rate exceeded 39.8 percent for city residents overall.
1 New York City’s Asian population of 963,295 represented 12 percent of city residents in 2006, up from 10 percent in 2000. Major race groups defined by the White House Office of Management and Budget are American Indian, Asian, black, Alaska native, native Hawaiian, Pacific Islander and white. Hispanic origin is considered the major ethnic category.
2 The Urban Institute defines low-income as less than twice the federal poverty level. Urban Institute, “Low-Income Working Families: Facts and Figures,” http://www.urban.org/publications/900832.html. Downloaded August 8, 2008.

x
Executive Summary
• These patterns persisted in 2006, when poverty and low-income rates dropped somewhat for the entire population and for all race and ethnic groups. In 2006, Asian poverty and low-income rates were 18.5 percent and 40.5 percent, respectively, compared with 10.8 percent and 23.8 percent for non-Hispanic whites and 19.3 percent and 38.8 percent for the total city population.
• In 2000 and 2006, New York City’s Asian population had a higher percentage of near-poor3 people (21.3 percent in 2000 and 22 percent in 2006) than non-Hispanic whites (12 percent and 13 percent), blacks (19 percent and 19.4 percent), and the general population (18.5 percent and 19 percent).
The composition of New York City Asian households in poverty differs substantially from that of poor city households in general.
• The majority (56 percent) of Asian households in poverty in 2006 were led by married couples, compared with 26 percent of all poor city households.
• Among Asians that year, people in non-family households had the highest poverty rate (26 percent). However, in the general population, households headed by single women had the highest incidence of poverty (32 percent).
Asian immigrants arriving in the United States in this decade are more apt to be poor than recent New York City immigrants overall.
• In 2006, about three-quarters of Asian New Yorkers were immigrants, compared with slightly more than one-third of all city residents.
• Asians in New York City who immigrated from 2000 to 2006 had a higher poverty rate (28 percent) than all city immigrants arriving in that time frame (23 percent), suggesting higher economic hurdles for new Asian immigrants than other recent arrivals.
Poverty rates vary widely among Asian ethnic groups in New York City.
• The poverty rate ranged from 5 percent for Filipinos to 31 percent for Cambodians in 2000, the most re-cent year for which this information is available for all Asian ethnic groups.
• Besides Cambodians, ethnicities with poverty rates exceeding the overall Asian rate by at least one per-centage point in 2000 were Bangladeshis (29 percent), Vietnamese (28 percent), Pakistanis (27 percent), Japanese (24 percent), Sri Lankan and Chinese (both 22 percent).
• At the other end of the spectrum of poverty rates, just above Filipinos, were Thais (10 percent), Taiwanese (16 percent), Indians and Koreans (both 17 percent).
Family and Language Differences Separate Asian Children in Poverty from New York City Children in General. About one-fourth of Asian children in New York City live in poverty, and more than half are in the low-income bracket.
• Roughly 1 in 4 Asian children in New York City (25.6 percent) lived in poverty in 2006 – up from 22.6 percent in 2000. In the same time period, poverty rates also were relatively constant for children overall and for black, Hispanic and non-Hispanic white children in the city.
• In 2006, Asian children had a slightly lower poverty rate than all New York City children (28.3 percent) but a somewhat higher low-income rate (52.2 percent for Asians compared with 51.1 percent).
The majority of Asian children in poverty grow up in a different family setting than poor New York City children as a whole.
• More than half (55 percent) of Asian children below the poverty level in 2006 lived in two-parent house-holds in which only the father worked.
3 An individual is considered near-poor if he or she lives in a family with income above the federal poverty threshold but below twice the federal poverty threshold.

xi
Working but Poor: Asian American Poverty in New York City
• By contrast, among the general population, the majority (58 percent) of poor children lived with only their mother, and slightly more than half of those mothers were employed.
Poor and low-income school-age Asian children (age 5 to 17) are about twice as likely to face language obsta-cles as school-age city children overall in those income categories.
• Almost one-third (32 percent) of poor school-age Asian children limited English proficient, compared with 15 percent of all city children in that age group, in 2006. For low-income school-age children, 28 percent of Asians and 14 percent of all children had limited English skills.
• Almost half (49 percent) of Asian children below the poverty level were in linguistically isolated4 house-holds, compared with less than a quarter (23 percent) of all children. In the low-income range, language isolation affected 44 percent of Asian school-age children, double the rate for school-age children overall.
Asian children have diverse poverty rates based on ethnicity.
• Child poverty rates in 2000 varied from 4 percent for Filipinos to 39 percent for Vietnamese. • Other Asian ethnic groups with higher percentages of children in poverty than the city’s Asian total popu-
lation were Cambodians (37 percent), Bangladeshis (34 percent), Pakistanis (34 percent), and Chinese (28 percent).
Most Working-Age Asian New Yorkers Are Among the Working Poor. Asian working-age adults (age 18 to 64) are more apt to be poor than non-Hispanic whites and more apt to be low-income than city residents overall in their age category.
• In 2006, working-age Asians had a poverty rate of 14.6 percent – higher than for non-Hispanic whites (10.1 percent) but lower than for the general population (15.9 percent), blacks (19.3 percent) and Hispan-ics (22.8 percent) in that age group.
• However, that year, the working-age Asian population had a higher low-income rate than the city’s entire working-age population (35.1 percent compared with 32.8 percent).
• From 2000 to 2006, poverty rates decreased for the city’s total working-age population and for all race and ethnic groups. During that time period, low-income rates rose for the general population and all other groups except blacks, for whom this rate stayed the same.
Working-age Asian New Yorkers are more likely to be among the working poor than the general city popu-lation in that age group.
• Almost half (47 percent) of working-age Asians below the poverty level and 71 percent of such Asians who were near-poor were participating in the labor force in 2006. These percentages compare with 42 percent and 68 percent, respectively, of all working-age New Yorkers.
• The unemployment rate of working-age Asians in poverty was 16 percent, compared with 27 percent for all poor New Yorkers in that age group. Only 8 percent of low-income working-age Asians were unem-ployed, compared with 11 percent of the general working-age population.
• Poor and low-income Asians were more apt to work full time (35 or more hours a week) than the city’s low-income population overall. Almost one-third (31 percent) of working-age Asians in poverty worked full time, compared with less than one-fourth (24 percent) of all poor working-age adults. Among low-income working-age adults, 57 percent of Asians and 52 percent of all New Yorkers worked full time.
• Poor and low-income Asians were more likely than Asians with higher incomes to work in service, pro-duction, transportation and material-moving occupations.
• Food services, retail trade, manufacturing, construction, and other service industry groups employed dis-proportionately large percentages of poor and low-income Asians.
4 Linguistic isolation is defined as including all members of a household in which no adults (people age 14 or older) speak English only or speak English very well.

xii
Executive Summary
Levels of educational attainment are less associated with income categories for working-age Asians than for the general city population.
• In 2006, low-income status was more common for Asians with more-advanced schooling (a high school diploma or beyond) than for New York City’s total working-age population in the same income brackets.
• Considering that working-age Asians were more educated than New Yorkers as a whole, there are indica-tions Asians may be less able to transfer their educational credentials to the U.S. labor market.
Poverty rates among Asian working-age adults range by ethnic group.
• In 2000, more than one-fourth of working-age Bangladeshis, Cambodians and Japanese were living in poverty, compared with 5 percent of Filipinos and 10 percent of Thais.
• Only Filipino, Indian, Korean, Taiwanese and Thai working-age adults had lower poverty rates than that of the total working-age population in New York City.
Among young adults (age 16 to 24) in New York City, poor and low-income Asians are more apt to be in school and less likely to be disconnected from employment or education than youths at large or in other race or ethnic groups.
• Only 11 percent of poor young Asian adults were not in the work force or school in 2006. • Twice as large a proportion (22 percent) of the general impoverished youth population and 20 percent or
more of poor blacks, Hispanics and non-Hispanic whites were not working or in school. Senior Citizens Are the Most Economically Vulnerable Asian Age Group. Seniors are the poorest Asian age group in New York City.
• Almost 1 in 3 elderly Asians (31.3 percent) lived in poverty in 2006. That poverty rate surpassed that of senior New Yorkers overall (19.4 percent) and all other race and ethnic groups in the city.
• Also in 2006, more than half (54.1 percent) of elderly Asians lived below twice the poverty level, com-pared with 42.6 percent of all older New Yorkers. Hispanic seniors had a higher low-income rate (56.9 percent) than elderly Asians while seniors in other race and ethnic groups had lower rates.
Poverty among Asian senior citizens (age 65 or older) is a rapidly growing problem.
• New York City’s elderly Asian population ballooned 46 percent from 2000 to 2006. In the same time frame, the city’s total senior population rose 6 percent.
• In that six-year period, among elderly New Yorkers, the poverty rate for Asians increased by one-third (from 23.6 percent to 31.3 percent). The extent of that jump far exceeded senior poverty-rate growth for non-Hispanic whites (from 11.5 percent to 13.6 percent) and the general population (from 17.6 percent to 19.4 percent). Meanwhile, poverty rates declined for black and Hispanic seniors from 2000 to 2006.
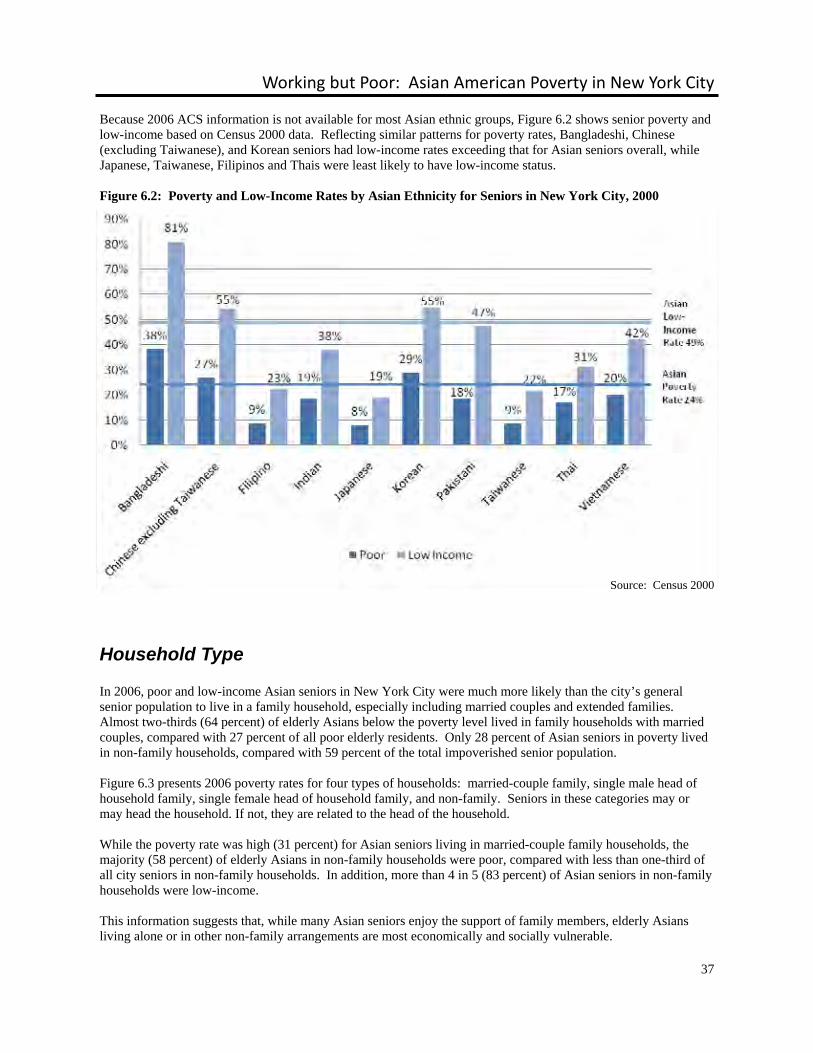
Asian seniors’ income status varies broadly among ethnic groups.
• In 2000, more than a quarter of Bangladeshi, Chinese and Korean seniors lived in poverty. Some 38 per-cent of elderly Bangladeshis were poor.
• Less than 9 percent of Filipinos and Taiwanese and 8 percent of Japanese seniors lived below poverty level.
Poor and low-income Asian seniors on the one hand and seniors city-wide on the other hand display major differences in household makeup.
• Almost two-thirds (64 percent) of elderly Asians in poverty lived in households headed by married cou-ples, compared with 27 percent of all poor New York City elders, in 2006. Only 28 percent of impover-ished Asian seniors lived in non-family households, compared with 59 percent of all city seniors in pov-erty.
• While less than a third (31 percent) of elderly Asians in married-couple family households lived in pov-erty, the majority (58 percent) of older Asians in non-family households were poor. More than 4 in 5 Asian seniors in non-family households (83 percent) lived below twice the poverty level.

xiii
Working but Poor: Asian American Poverty in New York City
Similar gaps in language abilities separate Asian elders from New York City’s overall senior population. • The vast majority (91 percent) of poor senior Asian New Yorkers in 2006 had limited English ability,
compared with 56 percent of all poor seniors. An elderly Asian’s specific English-skill level correlated closely with income status.
• Some 45 percent of Asian seniors who did not speak English at all and 35 percent of those who did not speak English well were living in poverty. At the other end of the spectrum, 5 percent of elderly Asians who spoke English very well were poor.
• Three-quarters of Asian seniors living below the poverty level were in linguistically isolated households, compared with less than a half (49 percent) of all elderly New Yorkers.
Across immigration and citizenship categories, elderly Asians are more likely to be poor than the general senior population.
• Virtually all Asian seniors (97 percent) in New York City in 2006 were foreign-born, compared with 44 percent of city seniors overall.
• Among native-born residents, naturalized citizens and non-citizens, elderly Asians had higher poverty rates than seniors at large.
• Poverty rates for senior Asian immigrants were similar regardless of their decade of entry.
Policy Considerations The poverty experiences of Asian New Yorkers, and perhaps of the larger immigrant population, suggest several implications for policies and programs to reduce poverty. Improving economic opportunities for immigrants addresses the primary causes of persistent poverty: low wages and limited employment opportunities. Building English ability, learning new job skills, and better using existing skills and credentials would help immigrants advance to superior jobs. Economic development efforts in enclave economies that encourage a diversified, vibrant business community rather than a hypercompetitive, low-margin, narrow economy would help stabilize the local economy and raise wages and labor standards. Educating workers to file income tax returns and pay due employment taxes to establish a work history would enable workers to invest in the Social Security system for their future retirement. Increasing the availability of low-income housing is critical for alleviating poverty. More than 90 percent of Asian households in poverty spend more than 30 percent of their income on housing costs, the commonly used threshold for affordable housing. Investing in child care, schools, and youth development programs in immigrant communities is essential to enabling working families to break out of poverty by enriching future opportunities for the next generation. Improve communications with immigrant parents to encourage them to enroll their children in these programs so youth can fully expand their resource repertoires beyond academic success.
Expanding health insurance coverage and making health care more linguistically accessible and culturally appropriate are important to poor and low-income Asian immigrants. Enabling elderly Asian immigrants to benefit fully from the social safety net that has protected the general elderly population is key to combating poverty among elderly Asian and nurturing their well-being. Providing opportunities for active Asian seniors to participate in the economy and community as workers or paid volunteers would increase earning opportunities and enrich their quality of life.

1
Introduction

1
Working but Poor: Asian American Poverty in New York City
Chapter 1
Introduction Poverty among Asian Americans in New York City is a major, growing and complex issue. Yet the characteristics and implications of Asian poverty in New York are largely unknown to the general public. The Asian American Federation, a leading advocate for Asian Americans and a champion of those in poverty, provides a revealing portrait in this first in-depth report on Asian New Yorkers in poverty based on 2000 and 2006 census data. In addition, the report lays a foundation for discussing policy issues facing Asian New York residents in poverty and sets the stage for tracking the status of low-income5 Asians over time. New York City has an exceptionally high incidence of Asian poverty. For example, the city’s Asians had a much higher poverty rate and lower median household income than non-Hispanic whites. Nationwide, Asians were only slightly more likely than non-Hispanic whites to be in poverty and had a much higher median household income. In addition, the New York metropolitan area has the highest Asian poverty rate among the 10 metro areas with the largest Asian populations. Some New York City Asian population segments, such as senior citizens and certain ethnic groups, have particularly severe poverty rates. Also in New York City, low-income rates for Asians far exceed those for non-Hispanic whites. Asian poverty in New York City is expanding. The Asian population is the city’s fastest-growing major race or ethnic group,6 increasing by 22 percent from 2000 to 2006. Moreover, current economic conditions are challenging low-income New Yorkers across the board, and many Asians have additional disadvantages, such as linguistic isolation7 and rejection of academic credentials acquired outside the United States. Diversity within New York’s Asian community, as well as demographic disparities between Asians and the general population, add complexity to Asian poverty in the city. The extent of poverty among Asians varies substantially from one age or ethnic segment to another. Attributes of Asians below the poverty level also differ significantly from those of the general population in poverty, presenting special program and service needs for Asians. Recent actions by New York City government institutions make it timely to highlight poverty issues among Asian New Yorkers. The Mayor’s Commission for Economic Opportunity has issued a report proposing anti-poverty strategies to help children, youths and the working poor. The Center for Economic Opportunity, an outgrowth of the commission’s recommendations, recently published study results supporting an alternative to the federal
5 The Urban Institute defines low-income as less than twice the federal poverty level. Urban Institute, “Low-Income Working Families: Facts and Figures,” http://www.urban.org/publications/900832.html. Downloaded August 8, 2008.
6 Major race groups defined by the White House Office of Management and Budget are American Indian, Asian, black, Alaska Native, Native Hawaiian, Pacific Islander and white. Hispanic origin is considered the major ethnic category.
7 Linguistic isolation is defined as including all members of a household in which no adults (people age 14 or older) speak English only or speak English very well.

2
Introduction
poverty measurement. The study found that based on this alternative measure, Asian New Yorkers would have the second-highest poverty rate among the city’s major race and ethnic groups. Working but Poor: Asian American Poverty in New York City is based on analysis of two U.S. Census Bureau data sources: Census 2000 and the 2006 American Community Survey (ACS). The ACS has made it possible for the first time to track poverty among Asian ethnic groups more than once every 10 years. The ACS has replaced the decennial-census long form as the source of socioeconomic and demographic data across the entire nation and for specific race and ethnic groups. As more information is collected, the Census Bureau plans to release ACS data for smaller populations, culminating in annual five-year estimates beginning in the next decade. The Federation will update this report to incorporate these future data releases. The remainder of this report will cover findings in Chapters 2 through 6, followed by policy considerations in Chapter 7. Chapter 2 will provide an overview of poverty and low-income rates among Asians and Asian ethnic groups in New York City. Chapter 3 will examine demographic characteristics of poor and low-income New York Asians. Chapters 4 through 6 will look more closely at poverty among each of three Asian age populations: children, working-age adults and seniors. An appendix presents statistics for Asian American poverty nationwide. Federal poverty thresholds for 2006 and definitions of terms used in this report are presented in the Glossary.

3
Working but Poor: Asian American Poverty in New York City
Chapter 2
Overview of Asian American Poverty in New York City Asians were the fastest growing major race or ethnic group in New York City from 2000 to 2006. Asians repre-sented 12 percent of the population in New York City in 2006, up from 10 percent in 2000. Among the 10 U.S. cities with the largest Asian populations in 2006, New York City had the second-highest Asian poverty rate, at 18.5 percent, behind Philadelphia, with 29 percent. In New York City in 2006, the Asian poverty rate was much higher than that for non-Hispanic whites but slightly lower than for the general population, as shown in Figure 2.1. However, Asian New Yorkers in 2006 were more likely to be low-income than the general population. Slightly more than 40 percent Asians lived in households with incomes less than twice the poverty level, compared with a little more than 38 percent of the general population.
Figure 2.1: Poverty and Low-Income Rates by Race and Ethnicity for New York City, 2000 and 2006
Sources: Census 2000 and 2006 American Community Survey Public Use Microdata Sample

4
Overview of Asian American Poverty in New York City
Comparing Census 2000 and 2006 ACS data shows that poverty rates declined for Asians, non-Hispanic whites, blacks and Hispanics in New York City. However, for Asians and non-Hispanic whites, the percent of low-income people decreased by less than half a percent, compared with reductions of at least 2 percent for blacks and Hispan-ics. Asian poverty is concentrated geographically in New York City. Table 2.1 shows Asian poverty rates in 20008 for New York City Community Districts with 20 percent or higher Asian poverty rates. The highest poverty rate for Asians in Manhattan (nearly 30 percent) was in Community District 3, which includes Chinatown, the Lower East Side and Two Bridges. In the Bronx, the highest Asian poverty rate (34 percent) was in Community District 4, covering the Highbridge and Concourse areas. Community districts in Brooklyn with higher than 30 percent Asian poverty rates were Community Districts 2 (Downtown Brooklyn, Fort Green, Brooklyn Heights and Boerum Hill); 3 (Bedford Stuyvesant, Tompkins Park North and Stuyvesant Heights); 8 (Crown Heights, Prospect Heights and Weeksville); 7 (Sunset Park and Windsor Terrace); 12 (Borough Park, Ocean Parkway and Kensington); and 13 (Coney Island, Brighton Beach, Gravesend, Homecrest, and Seagate). In Queens, Community Districts 1 (Astoria and Long Island City) and 3 (Jackson Heights, East Elmhurst and North Corona) had Asian poverty rates of more than 20 percent. Three additional community districts – all in Queens – had Asian poverty rates lower than 20 percent but had large numbers of Asians in poverty in 2000. Community District 7, which contains Flushing, Whitestone and College Point, had more than 15,000 Asians living below the poverty level and a 17 percent Asian poverty rate. Commu-nity District 2 (Sunnyside and Woodside) had 7,734 Asians in poverty and a 19 percent poverty rate. Community District 4 (Elmhurst and Corona) had 6,384 Asians below the poverty level and a 15 percent poverty rate. Asian New Yorkers are very diverse ethnically. While the city’s overall Asian poverty rate in 2000 was slightly lower than that of the general population, certain ethnic groups experienced much higher levels of poverty. For example, Bangladeshis, Cambodians, Chinese, Japanese, Pakistanis, Sri Lankans and Vietnamese had poverty rates exceeding the citywide rate, as shown in Table 2.2. Because the single-year estimates from the ACS were designed to provide statistically accurate data for population groups of 65,000 or more, many Asian ethnicities presented in Table 2.2 do not have poverty statistics for 2006. The ACS eventually will collect enough data over three- and five-year periods to estimate population groups of fewer than 65,000 people. For groups with 2006 data, Table 2.2 shows poverty rates were lower than 2000 rates for all but Indians. However, the Indian poverty rate increase was not statistically significant. Comparing New York City poverty rates with national rates in 2000, all Asian ethnic groups except Filipinos, Ma-laysians and Thais had higher percentages in poverty in the city than nationwide. National poverty rate data can be found in Appendix A. Also noteworthy, the poverty rate for Japanese New Yorkers (24 percent) was more than twice the rate for Japanese nationally (10 percent). Figure 2.4 presents the Census 2000 data in Table 2.2 in graphical format and adds the percentage of people who were low-income. Bangladeshis, Cambodians, Chinese, Pakistanis, and Vietnamese had poverty and low-income rates far surpassing those of Asians in general. Filipinos, Indians, Koreans, Taiwanese and Thais had poverty rates and low-income rates well below that of Asians in general. Indonesian New Yorkers had a poverty rate compara-ble to that of Asians overall but a much higher low-income rate than Asians in general. Japanese and Sri Lankans had higher poverty rates but much lower low-income rates than Asians overall, suggesting a major gap in the in-come distribution in those communities. Malaysians had almost the same poverty and low-income rates as Asians in general. Only Filipino and Thai New Yorkers had lower poverty and low-income rates than Asian New Yorkers as a whole in 2000.
8 Sample sizes for the 2006 ACS were too small for analyzing Asian American data at the community district data. Therefore, this study relies on 2000 Census data for community district analysis.

5
Working but Poor: Asian American Poverty in New York City
Table 2.1: New York City Community Districts With Asian Poverty Rates 20 Percent or Higher, 2000
Source: Census 2000 Public Use Microdata Sample
Community District
Neighborhoods Total Population
Poverty Rate
Asian Population
Asian Poverty Rate
Brooklyn CD 3 Bedford Stuyvesant, Tompkins Park North, Stuyvesant Heights
121,057 37% 562 59%
Brooklyn CD 7 Sunset Park, Windsor Terrace 136,334 26% 30,328 35%
Brooklyn CD 12 Borough Park, Ocean Parkway, Kensington
160,633 29% 18,227 34%
Bronx CD 4 Highbridge, Concourse 130,582 40% 1,942 34%
Brooklyn CD 2 Downtown Brooklyn, Fort Greene, Brooklyn Heights, Boerum Hill
113,068 24% 4,558 33%
Brooklyn CD 13 Coney Island, Brighton Beach, Gravesend, Homecrest, Seagate
116,574 30% 10,016 31%
Brooklyn CD 8 Crown Heights, Prospect Heights, Weeksville
120,170 27% 2,190 30%
Manhattan CD 3 Lower East Side, Chinatown, Two Bridges
167,512 28% 56,134 29%
Manhattan CD 9 West Harlem, Morningside Heights, Manhattanville, Hamilton Heights
125,179 30% 7,983 28%
Brooklyn CD 5 East New York, New Lots, City Line, Starrett City
143,427 30% 5,193 27%
Bronx CD 7 Kingsbridge Heights., Bedford Park, Fordham, University Heights
131,430 36% 9,614 27%
Brooklyn CD 14 Flatbush, Ocean Parkway, Midwood
163,638 22% 12,934 26%
Queens CD 1 Astoria, Long Island City 190,035 21% 24,589 25%
Brooklyn CD 10 Bay Ridge, Dyker Heights, Fort Hamilton
122,506 14% 15,853 25%
Brooklyn CD 11 Bensonhurst, Mapleton, Bath Beach, Gravesend
171,385 20% 40,058 24%
Bronx CD 5 Morris Heights, University Heights, Fordham, Mt. Hope
136,018 40% 1,976 24%
Brooklyn CD 15 Sheepshead Bay, Manhattan Beach, Kings Highway, Gravesend
150,967 17% 18,746 23%
Queens CD 3 Jackson Heights, East Elmhurst, North Corona
175,586 20% 24,399 22%
Brooklyn CD 1 Greenpoint, Williamsburg 142,534 35% 6,045 22%
Manhattan CD 4 and 5
Chelsea, Clinton, Midtown, Times Square, Herald Square, Midtown South
123,136 14% 11,811 20%

6
Overview of Asian American Poverty in New York City Figure 2.2: Asian American Poverty Rates by Community District for the Bronx and Manhattan, 2000

7
Working but Poor: Asian American Poverty in New York City Fi
gure
2.3
: A
sian
Am
eric
an P
over
ty R
ates
by
Com
mun
ity D
istr
ict f
or B
rook
lyn
and
Que
ens,
2000

8
Overview of Asian American Poverty in New York City
Population Group
Population 2000
Poverty Rate 2000
Population 2006
Poverty Rate 2006
City 8,008,278 21.2% 8,214,426 19.2% Non-Hispanic White 2,801,267 12.0% 2,854,519 11.1% Asian 787,047 19.6% 963,295 17.7% Bangladeshi 19,148 28.6% 24,440 N/A Cambodian 1,771 30.8% 3,005 N/A Chinese 361,531 22.1% 434,617 19.0% Chinese excluding Taiwanese 357,243 22.1% 431,829 19.0% Filipino 54,993 5.5% 68,147 2.4% Indian 170,899 17.1% 230,476 18.1%* Indonesian 2,263 20.2% 4,272 N/A Japanese 22,636 23.6% 24,623 N/A Korean 86,473 17.0% 98,102 13.0% Malaysian 1,368 19.9% 2,884 N/A Pakistani 24,099 26.6% 27,532 N/A Sri Lankan 2,033 22.2% 3,700 N/A Taiwanese 4,288 15.8% 2,788 N/A Thai 4,169 9.6% 4,155 N/A Vietnamese 11,334 27.8% 14,624 N/A
Table 2.2: New York City Poverty Rates by Ethnicity, 2000 and 2006
Source: Census 2000 and 2006 American Community Survey N/A indicates sample size too small for data to be reported. * indicates the difference from Census 2000 poverty rate is not statistically significant.
Figure 2.4: Poverty and Low-Income Rates by Asian Ethnicity, 2000
Source: Census 2000

9
Working but Poor: Asian American Poverty in New York City
Chapter 3
Demographics of Poor and Low-Income Asian New Yorkers This chapter examines demographic characteristics for New York City’s Asian population overall, as well as for poor and low-income Asians. It describes Asian New Yorkers, in terms of poverty and low income, by age, family type, marital status, household type, housing costs, educational attainment, English proficiency, citizenship, immi-gration, labor-force participation, unemployment, hours worked, occupation and industry. Asian groups’ traits will be compared with those of the city’s general population, highlighting contrasts. Informa-tion refers to 2006 ACS data and New York City residents unless noted otherwise.
Age While Asian children (age 0 to 17) and working-age adults (age 18 to 64) had lower poverty rates than age-group peers in the general population, greater proportions of Asians in all age ranges were low-income than in the general population.
Figure 3.1: Poverty by Age Group Comparing Asian American and General Population in New York City, 2006
Source: 2006 American Community Survey Public Use Microdata Sample

10
Demographics of Poor and Low‐Income Asian New Yorkers Among senior citizens (age 65 or older), more than half of Asians were low-income, and almost one-third of this age group lived below the poverty level. Subsequent chapters will look in more detail at poverty and low-income status among Asian children, working adults and seniors.
Family Type and Marital Status Unlike in the general population, the majority of Asian households in New York City were headed by married cou-ples. In 2006, 67 percent of Asian households were led by married couples, compared with 48 percent of house-holds city-wide. Also, almost 3 in 5 Asian adults (60 percent) were married, compared with 41 percent of all adults. As a consequence, slightly more than half (56 percent) of Asian households in poverty were married-couple households, compared with about one-fourth (26 percent) of all city households in poverty. While single female-led families in the general population had the highest poverty rate by a wide margin, non-family households had the highest poverty rates among Asians, as shown in Figure 3.2. Asian married-couple families were more likely to be low-income than their counterparts in the general population. More than two in five (41 percent) of Asian married-couple families were low-income, compared with 29 percent of all married-couple households. Single male-headed families of Asians and the general population had similar poverty and low-income rates. However, Asian single female-led families were significantly less likely to be in poverty or low income compared with single female-headed families in general. Asian non-family households had higher poverty rates than non-family households overall. Figure 3.2: Poverty and Low-Income Rates by Household Type, 2006
Source: 2006 American Community Survey Public Use Microdata Sample

11
Working but Poor: Asian American Poverty in New York City
Housing Costs The U.S. Department of Housing and Urban Development deems a household that pays less than 30 percent of their income for housing costs as living in affordable housing. For poor Asian households who rent their homes, 9 percent of households lived in affordable housing. For the few poor Asian households who own their homes, 5 percent are in affordable housing. This compares with 13 percent of all poor renters and 10 percent of all poor owners whose housing are affordable. For all low-income households who rent, 15 percent of Asian households and 18 percent of all households were in affordable housing. For low-income owners, 17 percent of Asians and 16 percent of all households were in afford-able housing.
Educational Attainment The ACS asks respondents age 25 or older for their highest level of education attained. Typically, respondents in this age group have achieved lifetime educational goals. Asians as a group had higher levels of educational attainment than New Yorkers in general. In 2006, 44 percent of Asians had an associate’s degree or more schooling, compared with 38 percent of all New Yorkers. However, greater educational levels did not correlate as strongly with lower poverty rates among Asians as in the general population. Asians with high educational attainment were more likely to be low-income than members of the gen-eral population with similar education levels. As Figure 3.3 illustrates, 46 percent of Asian high school graduates were low-income, compared with 39 percent of all high school graduates in the city. Among college graduates, 21 percent of Asians were low-income, exceeding 16 percent of all New Yorkers. The discrepancies may reflect difficulties many immigrants encounter in transfer-ring credentials or expertise acquired in their native countries to the U.S. job market. Figure 3.3: Poverty and Low-Income Rates by Educational Attainment, 2006
Source: 2006 American Community Survey Public Use Microdata Sample

12
Demographics of Poor and Low‐Income Asian New Yorkers
English Proficiency A lack of English competency is a major hurdle for poor and low-income Asians. Asian New Yorkers were twice as apt to be limited English-proficient (LEP), as defined by the Department of Justice,9 as residents city-wide. Half of Asians, versus a quarter (24 percent) of the general population, were LEP. As Figure 3.4 shows, English proficiency is associated very strongly with poverty and low-income rates among the overall population. However, for many given levels of English proficiency, Asians have slightly lower poverty and low-income rates than the general population. Figure 3.4: Poverty and Low-Income Rates by English Ability, 2006
Source: 2006 American Community Survey Public Use Microdata Sample
Immigration and Citizenship Asians were much more likely to be immigrants than New Yorkers overall. Almost three-quarters (74 percent) of Asian New Yorkers were foreign-born, with more than half (57 percent) of immigrants arriving in the United States after 1990. By comparison, 37 percent of all New Yorkers were immigrants, with 53 percent arriving after 1990. Across immigration and citizenship categories, Asians had nearly the same poverty and low-income rates as New Yorkers overall, as shown in Figure 3.5. Most compared rates were within one or two percentage points of each other.
9 People are classified as LEP when they speak a language other than English at home and speak English less than very well.

13
Working but Poor: Asian American Poverty in New York City
Figure 3.5: Poverty and Low-Income Rates by Citizenship, 2006
Source: 2006 American Community Survey Public Use Microdata Sample Figure 3.6 presents poverty and low-income data by decade of entry for foreign-born New Yorkers. For immi-grants as a whole, increased time in the United States correlated with gradual decreases in poverty and low-income rates. Compared with the general immigrant population, poverty was somewhat more common for Asians arriving from 2000-2006 but less likely for Asians who entered this country from 1980 to 1999. However, the relative closeness of poverty and low-income rates by immigration year suggests Asians follow a path of economic assimi-lation similar to that of other immigrant groups. Figure 3.6: Poverty and Low-Income Levels by Year of Entry for Foreign-Born New Yorkers, 2006
Source: 2006 American Community Survey Public Use Microdata Sample

14
Demographics of Poor and Low‐Income Asian New Yorkers
Labor-Force Participation and Employment Poor and low-income Asians were more likely to be working or actively seeking work than peers in the general population. Unemployment rates among poor and low-income Asians were lower than for New York’s total low-income population. For Asians below the poverty level, the jobless rate was 17 percent, compared with 28 percent for the city-wide population in poverty. These factors suggest higher representation of Asians among the working poor. Near-poor Asians were much more likely than poor Asians and the near-poor population in general to be active in the labor force and employed. Figure 3.7: Labor-Force Participation Rates for Poor and Near-Poor Groups, 2006
Source: 2006 American Community Survey Public Use Microdata Sample Figure 3.8: Unemployment Rates for Poor and Near-Poor Groups, 2006
Source: 2006 American Community Survey Public Use Microdata Sample

15
Working but Poor: Asian American Poverty in New York City
Hours Worked Low-income Asians were more apt to work full time than the general population in those income brackets. About one-quarter of Asians age 16 or older living below the poverty level worked 35 or more hours a week, compared with one-fifth of all poor New Yorkers City in that age group. For the near-poor, almost half of Asians age 16 or older worked full time, compared with 41 percent of near-poor New Yorkers in that age range in general.
Occupations and Industries Poor and near-poor Asians were more likely to hold jobs in service; production, transportation and material mov-ing; and construction occupations than Asian workers living above two times the poverty level. Asians in house-holds with incomes above twice the poverty threshold were highly represented in management, professional and related occupations. Figure 3.9: Percentage of Asian American Adults in Each Income Category by Occupation in New York City, 2006
Source: 2006 American Community Survey Public Use Microdata Sample Food services, retail trade, manufacturing, construction, and other service industry segments disproportionately employed poor and near-poor Asians in relation to the rest of the population. Asian workers living above twice the poverty level were more likely than low-income Asians to work in industries requiring more education or skills, such as health care, professional and scientific, and finance and insurance in-dustry segments.

16
Demographics of Poor and Low‐Income Asian New Yorkers
Figure 3.10: Percentage of Asian Americans in Each Income Category by Industry Group in New York City, 2006
Source: 2006 American Community Survey Public Use Microdata Sample

17
Working but Poor: Asian American Poverty in New York City
Chapter 4
Children This chapter presents a demographic profile of poor and low-income Asian children in New York City. Poverty and low-income status will be explored by ethnicity, family type, parental work status, English proficiency, lin-guistic isolation, and immigration. The chapter will conclude with a look at children 5 and younger. Statements refer to 2006 ACS information and New York City residents unless specified. In 2006, New York City had 204,284 Asian children (younger than 18), representing 21 percent of the city’s Asian population. By comparison, the 1.9 million total children in New York City constitute 24 percent of the entire city population. Asian children had a lower poverty rate than city children in general. However, 52 percent of Asian children lived were low-income, compared with 51 percent of children city-wide. Figure 4.1 compares Asian children in poverty with non-Hispanic white, black and Hispanic children, as well as all children. It illustrates that Asian children experienced an increase in poverty from 2000 to 2006, while poverty rates fell for all the other groups. Also in that time frame, low-income rates rose for Asian and non-Hispanic white children.
Source: Census 2000 and 2006 American Community Survey
Figure 4.1: Poverty and Low-Income Rates by Race and Ethnicity for Children in New York City, 2000 and 2006

18
Children
Ethnicity Table 4.1 provides Census 2000 data, along with 2006 ACS information if available. The 2006 ACS only pub-lished data for Asian ethnicities with 65,000 or more people. Thus, for New York City, 2006 information only was available for the city’s four largest Asian ethnicities: Chinese, Filipinos, Indians and Koreans. While less common than in the general population, poverty among Asian children was much more widespread than among non-Hispanic white children in 2000 and 2006. Also, Asian children’s poverty rates varied greatly by eth-nicity. In 2000, almost 2 in 5 Cambodian and Vietnamese children lived in poverty, compared with about 4 per-cent of Filipino children and 7 percent of Thai children. While city-wide child-poverty rates declined by 7 percent from 2000 to 2006, the Asian child poverty rate stayed the same, at 24 percent. Child poverty rates fell for Chinese and Filipinos but increased for Indians. The popula-tion of Indian children also grew the fastest among the four largest Asian groups. A drop in Korean child poverty rates from 2000 to 2006 is not statistically significant, so no firm conclusions may be drawn from that data. Table 4.1: Child Poverty Rates by Ethnicity for New York City, 2000 and 2006
Source: Census 2000 and 2006 American Community Survey N/A indicates sample size too small for data to be reported. * indicates the difference from Census 2000 is not statistically significant.
Population Group Population, 2000
Poverty Rate, 2000
Population, 2006
Poverty Rate, 2006
City 1,940,269 30.3% 1,943,923 28.2%
Non-Hispanic White 455,703 16.2% 508,765 15.5%*
Asian 171,125 24.0% 204,284 24.0%*
Bangladeshi 5,743 34.3% N/A N/A
Cambodian 666 37.0% N/A N/A
Chinese 73,336 27.6% 82,574 22.6%
Chinese excluding Taiwanese 72,872 27.7% N/A N/A
Filipino 10,269 4.4% 10,493* 1.6%
Indian 44,187 22.3% 61,222 27.4%
Indonesian 469 17.9% N/A N/A
Japanese 1,686 15.3% N/A N/A
Korean 16,575 15.1% 16,420* 13.9%*
Malaysian 200 N/A N/A N/A
Pakistani 8,118 33.8% N/A N/A
Sri Lankan 464 21.1% N/A N/A
Taiwanese 464 15.7% N/A N/A
Thai 596 7.2% N/A N/A
Vietnamese 2,635 39.4% N/A N/A
19
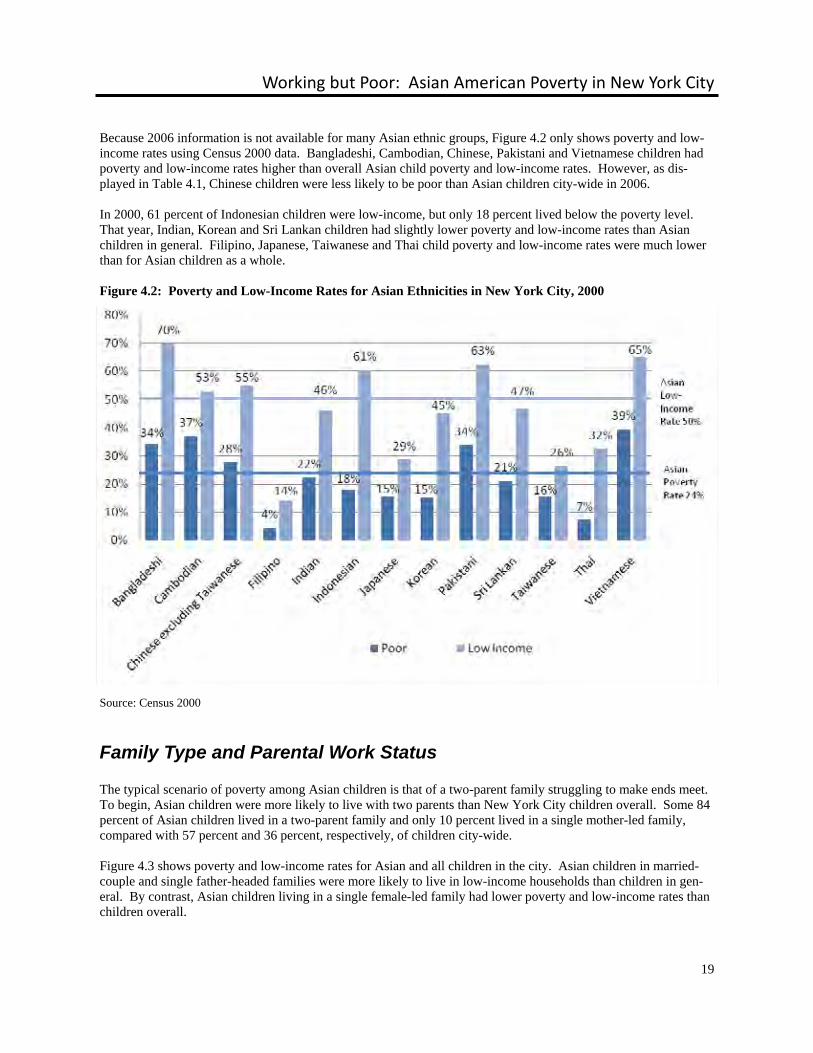
Working but Poor: Asian American Poverty in New York City Because 2006 information is not available for many Asian ethnic groups, Figure 4.2 only shows poverty and low-income rates using Census 2000 data. Bangladeshi, Cambodian, Chinese, Pakistani and Vietnamese children had poverty and low-income rates higher than overall Asian child poverty and low-income rates. However, as dis-played in Table 4.1, Chinese children were less likely to be poor than Asian children city-wide in 2006. In 2000, 61 percent of Indonesian children were low-income, but only 18 percent lived below the poverty level. That year, Indian, Korean and Sri Lankan children had slightly lower poverty and low-income rates than Asian children in general. Filipino, Japanese, Taiwanese and Thai child poverty and low-income rates were much lower than for Asian children as a whole. Figure 4.2: Poverty and Low-Income Rates for Asian Ethnicities in New York City, 2000
Source: Census 2000
Family Type and Parental Work Status The typical scenario of poverty among Asian children is that of a two-parent family struggling to make ends meet. To begin, Asian children were more likely to live with two parents than New York City children overall. Some 84 percent of Asian children lived in a two-parent family and only 10 percent lived in a single mother-led family, compared with 57 percent and 36 percent, respectively, of children city-wide. Figure 4.3 shows poverty and low-income rates for Asian and all children in the city. Asian children in married-couple and single father-headed families were more likely to live in low-income households than children in gen-eral. By contrast, Asian children living in a single female-led family had lower poverty and low-income rates than children overall.

20
Children Figure 4.3: Poverty and Low-Income Rates for Children Living in Families in New York City, 2006
Source: 2006 American Community Survey Public Use Microdata Sample Figure 4.4 conveys that more than half (55 percent) of Asian children in poverty lived in families with both parents and only the father held an income-producing job. Among the general population, the majority (58 percent) of poor children lived with only their mother and slightly more than half of those mothers were employed. Figure 4.4: Distribution of Children in Poverty by Parental Work Status in New York City, 2006
Source: 2006 American Community Survey Public Use Microdata Sample

21
Working but Poor: Asian American Poverty in New York City
In Figure 4.5, a similar pattern emerges in the near-poor bracket. Asian families in this group were more likely to be two-income families than in the general population, but the highest percentage of Asian households have two parents with the father as the primary breadwinner. For near-poor children in general, a family led by a single working mother is most common, while two-parent families are more widespread than in the poverty bracket. Figure 4.5: Percentage of Near-Poor Children by Parental Work Status in New York City, 2006
Source: 2006 American Community Survey Public Use Microdata Sample
English Proficiency and Linguistic Isolation Among children age 5 to 17 in poverty, almost a third (32 percent) of Asians had limited English proficiency (LEP), compared with 15 percent of all children. For low-income children in that age bracket, 28 percent of Asians and 14 percent of all children were LEP. Among children in the same age range who were not low-income, LEP rates were 15 percent for Asians and 6 percent overall. Almost half (49 percent) of Asian children below the poverty level were in linguistically isolated households, com-pared with less than a quarter (23 percent) of all children. For low-income children, language isolation affected 44 percent of Asians – double the rate for children overall. Those figures contrast with linguistic isolation for 24 per-cent of Asian children and 8 percent of all children who were not low-income.
Immigration About one-quarter of Asian children in New York City were foreign-born, compared with 9 percent overall. Among foreign-born children, Asians and children in general had similar poverty rates: 32 percent and 29 percent, respectively. Low-income rates also were comparable for immigrant children, with 62 percent of Asians and 58 percent of all low-income children.

22
Children
Young Children The New York City Commission for Economic Opportunity has identified children 5 or younger as a target popu-lation for its strategies. Young Asian children were more likely to live in low-income families than non-Hispanic white children, according to the 2006 ACS. Almost half of Asian children in this age group lived in low-income households and more than a quarter (27 percent) lived below the poverty level. These rates compare with less than a third of non-Hispanic white children in the same age bracket who were low-income and 17 percent who were poor. For black children, 32 percent lived in poverty and 55 percent were low-income. For Hispanic children, comparable figures were 36 percent and 65 percent.

23
Working but Poor: Asian American Poverty in New York City
Chapter 5
Working-Age Adults This chapter describes demographic characteristics of poor and low-income working-age Asian adults (age 18 to 64) in New York City. This chapter covers ethnicity, educational attainment, English proficiency, linguistic isolation, immigration, citizenship, labor-force participation, unemployment, hours worked, occupation, and industry. In addition, this chapter includes a discussion of young adults (age 16 to 24) – a group the New York City Commission for Economic Opportunity has identified as at high risk for poverty. In several respects, working-age Asian New Yorkers have different demographic traits and exhibit different patterns than members of their age group in the city overall. However, Asians and the general population also share some characteristics. Among differences, working-age adults constitute a higher percentage of New York City’s Asian community than of the total city population. The city had 672,480 working-age Asians, representing nearly 70 percent of Asian New Yorkers, while the 5.3 million working-age adults in New York City at large comprised 64 percent of city residents. Asian working-age adults had a slightly lower poverty rate but a somewhat higher percentage of people with low-income status than the city-wide working-age population. Less correlation between education levels and income status than in the general population also sets Asians apart. That factor, limited English proficiency and scarce job-advancement opportunities suggest a poverty trap for many Asian adults. Figure 5.1 shows poverty rates declined for Asian, non-Hispanic white, black, and Hispanic working-age adults in New York City from 2000 to 2006.

24
Working‐Age Adults
Figure 5.1: Poverty and Low-Income Rates by Race and Ethnicity for Working-Age Adults in New York City, 2000 and 2006
Sources: Census 2000 and 2006 American Community Survey
Ethnicity With 2006 ACS data available only for New York City’s four largest Asian ethnicities (Chinese, Filipinos, Indians and Koreans), Table 5.1 also presents Census 2000 information. Following the general population trend, poverty rates for working-age adults in each of the four top Asian ethnic groups dropped from 2000 to 2006. However, the decrease for Indians was not statistically significant. For working-age adults in 2000 and 2006, overall Asian poverty rates were just a bit lower than those for the city at large but far exceeded rates for non-Hispanic whites. Percentages of Asian working-age adults in poverty ranged widely by ethnicity. In 2000, more than a quarter of Bangladeshi, Cambodian and Japanese working-age adults lived in poverty, compared with about 5 percent of Filipinos and 10 percent of Thais. Filipinos, Indians, Koreans, Taiwanese and Thais in this age group had lower poverty rates than the city’s total working-age population.

25
Working but Poor: Asian American Poverty in New York City
Table 5.1: Poverty Rates for Working-Age Adults by Ethnicity for New York City, 2000 and 2006
Sources: Census 2000 and 2006 American Community Survey N/A indicates sample size too small for data to be reported. * indicates that the difference from Census 2000 is not statistically significant. Because 2006 ACS statistics were not available for many Asian ethnic groups, Figure 5.2 shows poverty and low-income rates using Census 2000 data. Poverty and low-income status were more common for Bangladeshi, Cambodian, Chinese, Indonesian, Malaysian, Pakistani and Vietnamese working-age adults than for the overall working-age Asian population. Working-age Japanese and Sri Lankans had higher poverty rates but lower incidences of being near-poor. The difference is especially pronounced in the Japanese population, in which one-fourth of working-age adults lived in poverty while only 7 percent were in the near-poor category. Filipino, Indian, Korean, Taiwanese, and Thai adults had poverty and low-income rates lower than those of working-age Asian adults as a whole.
Population Group Population, 2000
Poverty Rate, 2000
Population, 2006
Poverty Rate, 2006
Total City 5,130,152 18.5% 5,273,139 15.9%
Non-Hispanic White 1,811,582 10.3% 1,833,710 9.2%
All Asians 556,738 17.8% 672,480 14.4%
Bangladeshi 13,037 25.9% N/A N/A
Cambodian 1,037 27.9% N/A N/A
Chinese 249,862 19.7% 301,297 15.5%
Chinese excluding Taiwanese 246,362 19.8% N/A N/A
Filipino 40,603 5.4% 50,301 2.4%
Indian 119,874 15.2% 157,416 14.3%*
Indonesian 1,710 19.9% N/A N/A
Japanese 19,833 25.1% N/A N/A
Korean 64,028 16.4% 71,488 10.5%
Malaysian 1,149 22.8% N/A N/A
Pakistani 15,370 23.1% N/A N/A
Sri Lankan 1,482 22.6% N/A N/A
Taiwanese 3,500 16.3% N/A N/A
Thai 3,475 9.8% N/A N/A
Vietnamese 8,123 24.4% N/A N/A

26
Working‐Age Adults
Figure 5.2: Poverty and Low-Income Rates by Asian Ethnicity in New York City, 2000
Source: Census 2000
Educational Attainment Education has less association with economic well-being for working-age Asians than for that age group in general. In 2006, Asians with more-advanced education were more likely to have low-income status than New York City’s total working-age population in the same educational brackets. The fact that Asians tend to have more schooling than the total population makes this contrast particularly striking. Figure 5.3: Poverty and Low-Income Rates for Working-Age Adults by Educational Attainment for New York City, 2006
Source: 2006 American Community Survey Public Use Microdata Sample

27
Working but Poor: Asian American Poverty in New York City On the other hand, working-age Asians without a high school diploma had a lower frequency of poverty than all New Yorkers at that educational level. All told, more than half (56 percent) of working-age Asians without a high school diploma were low-income, compared with 60 percent of all working-age New Yorkers.
English Proficiency and Linguistic Isolation Among poor working-age adults in New York City, two-thirds (66 percent) of Asians had limited English proficiency (LEP), compared with slightly more than one-third (36 percent) of the general age-group population. LEP rates for low-income working-age adults were similar, with 67 percent of Asians and 38 percent of the total working-age population having limited English ability. Figure 5.4 shows that Asians in each LEP category had lower poverty rates and were less likely to be low income than the general working-age population. Figure 5.4: Poverty and Low-Income Rates for Working-Age Adults by English Ability for New York City, 2006
Source: 2006 American Community Survey Public Use Microdata Sample ACS data also underline the language barrier separating Asians from other New Yorkers. Almost half (47 percent) of working-age Asians living below the poverty level were in linguistically isolated households, compared with less than a quarter (24 percent) of all working-age New Yorkers. For low-income working-age adults, 43 percent of Asians and 24 percent of the general population were linguistically isolated. Those figures contrast with 23 percent of working-age Asians and 10 percent of all working-age New Yorkers who were not low-income but were linguistically isolated.

28
Working‐Age Adults
Immigration and Citizenship About 87 percent of working-age Asians in New York City in 2006 were foreign-born, compared with 46 percent of the total city population. For this age group, poverty and low-income rates were virtually identical for Asians and the general population across immigration and citizenship characteristics. Foreign-born Asians and foreign-born adults in general had poverty rates of 15 percent and 16 percent, respectively. Roughly one-third (37 percent) of Asians and of all working-age adults were low-income. Working-age naturalized Asians had the same poverty rate — 11 percent – as all naturalized citizens in that age group. Thirty percent of working-age naturalized Asians were low-income, compared with 28 percent of all working-age citizens. The largest income differences linked to immigration or citizenship were among native-born working-age New Yorkers – a group in which Asians fared better. One in 10 Asians born in the United States lived in poverty in 2006, compared with 16 percent of all native-born working-age city residents. One-fifth of U.S.-born working-age Asians were low-income, compared with 29 percent of the city’s entire native-born working-age population. Figure 5.5 presents poverty and low-income data by decade of entry for working-age immigrants. All groups show a drop in poverty and low-income rates with longer time in this country. Working-age Asian immigrants arriving from 2000 to 2006 had slightly higher combined poverty and low-income rates than all New York City immigrants, but Asians who arrived earlier had lower poverty and low-income rates than immigrants as a whole. The largest gap in poverty and low-income rates involves immigrants who arrived before 1980. In that time frame, 22 percent of working-age Asian immigrants lived below twice the poverty level, compared with 30 percent of all working-age immigrants in New York City. Figure 5.5: Poverty and Low-Income Rates for Working Age Adults by Decade of Entry for New York City, 2006
Source: 2006 American Community Survey Public Use Microdata Sample

29
Working but Poor: Asian American Poverty in New York City
Labor-Force Participation and Employment Poor and low-income working-age Asians have higher work-force participation and lower unemployment rates than general working-age populations in those income categories. For Asians below the poverty level in 2006, the unemployment rate was 16 percent, compared with 27 percent for the general population in poverty. Both of these factors suggest Asians were more likely to be among the working poor. Figure 5.6: Labor Force Participation Rate for Working-Age Adults by Poverty Level and Ethnicity, 2006
Source: 2006 American Community Survey Public Use Microdata Sample Figure 5.7: Unemployment Rate for Working-Age Adults by Poverty Level and Ethnicity, 2006
Source: 2006 American Community Survey Public Use Microdata Sample

30
Working‐Age Adults
Hours Worked Low-income working-age Asians are more likely to work full time than the low-income population in that age bracket as a whole. In 2006, almost one-third (31 percent) of working-age Asians living below the poverty level worked 35 or more hours a week, compared with slightly less than one-quarter (24 percent) of all working-age adults in poverty. For low-income adults, 46 percent of working-age Asians worked full time, exceeding 39 percent in general. Asians were also more likely to work long hours. For Asians in poverty, 13 percent of those employed worked more than 50 hours a week, compared with 7 percent of all workers in poverty. For low-income Asians, 15 percent worked more than 50 hours a week, compare with 9 percent.
Occupations and Industries Poor and low-income working-age Asians are more likely than other Asians in New York City to hold jobs in service or production, transportation and material-moving occupations. Further up the income spectrum, more than 2 in 5 working-age Asians living above twice the poverty level in 2006 held jobs in management, professional and related occupations – a much higher proportion than Asians in lower income categories. Figure 5.8: Percentage of Working-Age Asian American Adults in Each Income Category by Occupation in New York City, 2006
Source: 2006 American Community Survey Public Use Microdata Sample Figure 5.9 shows the percentage of working-age Asian New Yorkers in each of three income categories employed in 13 industry groups in 2006.

31
Working but Poor: Asian American Poverty in New York City
Food services, retail trade, manufacturing, construction and other services industry groups were disproportionate employers of poor and low-income Asians. The largest percentages of poor and low-income working-age Asians (19 percent and 22 percent, respectively) worked in the arts, entertainment, and recreation, accommodation and food services industry segment. The vast majority of these employees worked in food services jobs. In contrast, 10 percent of working-age Asians in households which were not low-income held jobs in that industry group. Asians who were not low-income were more likely than Asians in lower income categories to be employed in industries that require more education or skills, such as education, health care, professional and scientific, and finance and insurance industry groups. Figure 5.9: Percentage of Working-Age Asian American Adults in Each Income Category by Industry Group in New York City, 2006
Source: 2006 American Community Survey Public Use Microdata Sample
32
Working‐Age Adults
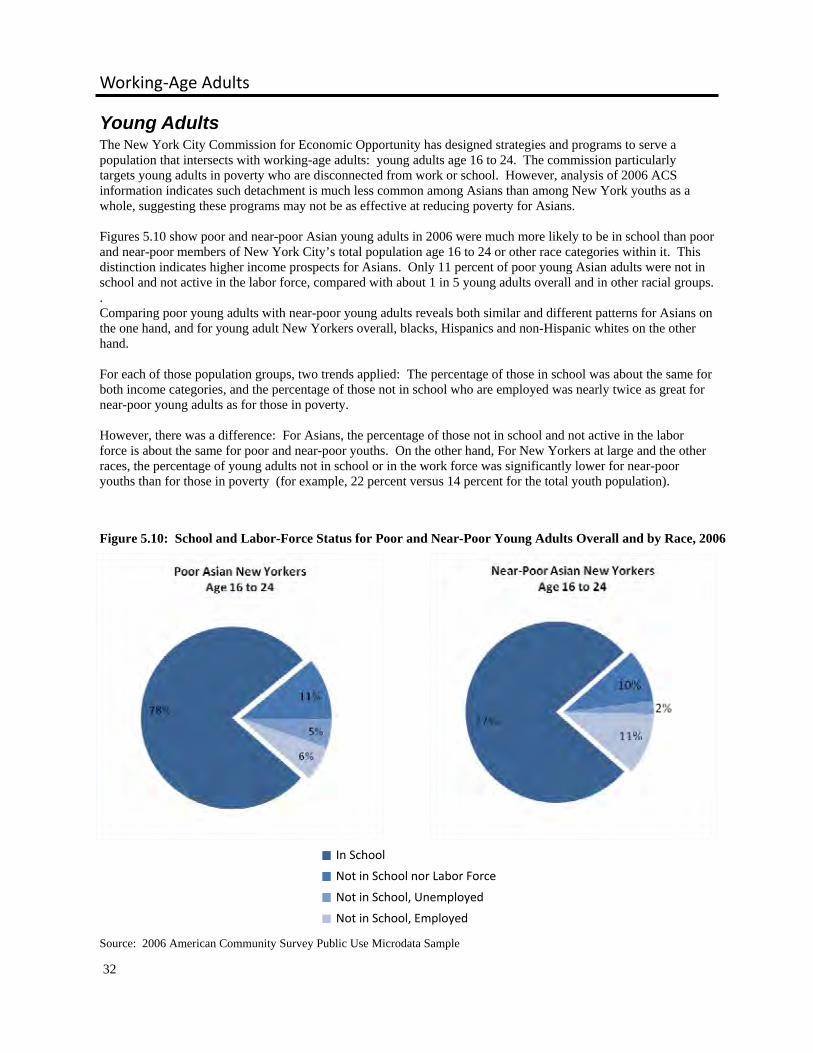
Young Adults The New York City Commission for Economic Opportunity has designed strategies and programs to serve a population that intersects with working-age adults: young adults age 16 to 24. The commission particularly targets young adults in poverty who are disconnected from work or school. However, analysis of 2006 ACS information indicates such detachment is much less common among Asians than among New York youths as a whole, suggesting these programs may not be as effective at reducing poverty for Asians. Figures 5.10 show poor and near-poor Asian young adults in 2006 were much more likely to be in school than poor and near-poor members of New York City’s total population age 16 to 24 or other race categories within it. This distinction indicates higher income prospects for Asians. Only 11 percent of poor young Asian adults were not in school and not active in the labor force, compared with about 1 in 5 young adults overall and in other racial groups. . Comparing poor young adults with near-poor young adults reveals both similar and different patterns for Asians on the one hand, and for young adult New Yorkers overall, blacks, Hispanics and non-Hispanic whites on the other hand. For each of those population groups, two trends applied: The percentage of those in school was about the same for both income categories, and the percentage of those not in school who are employed was nearly twice as great for near-poor young adults as for those in poverty. However, there was a difference: For Asians, the percentage of those not in school and not active in the labor force is about the same for poor and near-poor youths. On the other hand, For New Yorkers at large and the other races, the percentage of young adults not in school or in the work force was significantly lower for near-poor youths than for those in poverty (for example, 22 percent versus 14 percent for the total youth population).
Figure 5.10: School and Labor-Force Status for Poor and Near-Poor Young Adults Overall and by Race, 2006
Source: 2006 American Community Survey Public Use Microdata Sample
In School
Not in School nor Labor Force
Not in School, Unemployed
Not in School, Employed

33
Working but Poor: Asian American Poverty in New York City
Figure 5.10: School and Labor-Force Status for Poor and Near-Poor Young Adults Overall and by Race, 2006 (continued)
Source: 2006 American Community Survey Public Use Microdata Sample
In School
Not in School nor Labor Force
Not in School, Unemployed
Not in School, Employed

34
Working‐Age Adults
Figure 5.10: School and Labor-Force Status for Poor and Near-Poor Young Adults Overall and by Race, 2006 (continued)
Source: 2006 American Community Survey Public Use Microdata Sample
In School
Not in School nor Labor Force
Not in School, Unemployed
Not in School, Employed

35
Working but Poor: Asian American Poverty in New York City
Chapter 6
Seniors Seniors (age 65 or older) are the poorest and fastest-growing Asian age group in New York City. Compared with elderly city residents overall and in other race and ethnic groups, Asian seniors had the highest poverty rate in 2006. Magnifying the issue of Asian senior poverty, the ranks of elderly Asians soared from 2000 to 2006. This chapter defines characteristics of poor and low-income Asian seniors – the most economically vulnerable Asian age group in New York City. It looks at their ethnicity, household type, educational attainment, English ability, linguistic isolation, immigration and citizenship. New York City’s Asian senior population grew 46 percent from 2000 to 2006 while the total senior population increased 6 percent. This rapid aging makes the plight of poor elderly Asians significant. Seniors represented only 9 percent (or 86,531) of Asian New Yorkers in 2006. By comparison, the almost 1 million seniors in New York City constituted 12 percent of the entire city population. Figure 6.1 shows poverty and low-income rates for elderly New Yorkers in 2000 and 2006. The Asian poverty rate rose from 24 percent to 31 percent (nearly one-third) – surpassing increases for the general population and non-Hispanic whites while poverty rates stayed the same for Hispanics and declined for blacks. In 2006, elderly Asians were more likely to be poor than any other race or ethnic group or city seniors overall. During that time period, the percentage of near-poor Asian seniors decreased.
Figure 6.1: Poverty and Low-Income Rates by Race and Ethnicity for Seniors in New York City, 2000 and 2006
Sources: Census 2000 and 2006 American Community Survey

36
Seniors
Ethnicity Table 6.1 presents Census 2000 data, as well as 2006 ACS data if available, on senior poverty in New York City by ethnic group. It conveys wide variance in poverty rates among Asian ethnicities and in rate increases for the city’s largest Asian ethnic groups. Available information demonstrates that in 2000, more than a quarter of Bangladeshi, Chinese (excluding Taiwanese) and Korean seniors – higher percentages than for the general elderly Asian population – were living in poverty, compared with slightly less than 9 percent of Filipinos and Taiwanese and about 8 percent of Japanese seniors. From 2000 to 2006, senior poverty rates jumped from about 27 percent to 35 percent for Chinese but fell from roughly 9 percent to 4 percent for Filipinos. Increases in poverty rates for Indian and Korean seniors were not statistically significant but likely reflect real shifts, given the rise in overall Asian senior poverty rates. Table 6.1: Poverty Rates by Ethnicity for Seniors in New York City, 2000 and 2006
Sources: Census 2000 and 2006 American Community Survey N/A indicates sample size too small for data to be reported. * indicates the difference from Census 2000 is not statistically significant.
Population Group Population, 2000
Poverty Rate, 2000
Population, 2006
Poverty Rate, 2006
City 937,857 17.8% 997,364 19.0%
Non-Hispanic White 533,982 11.8% 512,044 13.3%
Asian 59,184 24.3% 86,531 28.9%
Bangladeshi 368 38.3% N/A N/A
Cambodian 68 N/A N/A N/A
Chinese 38,333 26.9% 50,746 35.4%
Chinese excluding Taiwanese 38,009 27.0% N/A N/A
Filipino 4,121 8.9% 7,353 3.9%
Indian 6,838 18.8% 11,838 19.7%*
Indonesian 84 N/A N/A N/A
Japanese 1,117 8.1% N/A N/A
Korean 5,870 28.9% 10,194 29.8%*
Malaysian 19 N/A N/A N/A
Pakistani 611 18.5% N/A N/A
Sri Lankan 87 N/A N/A N/A
Taiwanese 324 8.6% N/A N/A
Thai 98 N/A N/A N/A
Vietnamese 576 20.2% N/A N/A
37
Working but Poor: Asian American Poverty in New York City
Because 2006 ACS information is not available for most Asian ethnic groups, Figure 6.2 shows senior poverty and low-income based on Census 2000 data. Reflecting similar patterns for poverty rates, Bangladeshi, Chinese (excluding Taiwanese), and Korean seniors had low-income rates exceeding that for Asian seniors overall, while Japanese, Taiwanese, Filipinos and Thais were least likely to have low-income status. Figure 6.2: Poverty and Low-Income Rates by Asian Ethnicity for Seniors in New York City, 2000
Household Type In 2006, poor and low-income Asian seniors in New York City were much more likely than the city’s general senior population to live in a family household, especially including married couples and extended families. Almost two-thirds (64 percent) of elderly Asians below the poverty level lived in family households with married couples, compared with 27 percent of all poor elderly residents. Only 28 percent of Asian seniors in poverty lived in non-family households, compared with 59 percent of the total impoverished senior population. Figure 6.3 presents 2006 poverty rates for four types of households: married-couple family, single male head of household family, single female head of household family, and non-family. Seniors in these categories may or may head the household. If not, they are related to the head of the household. While the poverty rate was high (31 percent) for Asian seniors living in married-couple family households, the majority (58 percent) of elderly Asians in non-family households were poor, compared with less than one-third of all city seniors in non-family households. In addition, more than 4 in 5 (83 percent) of Asian seniors in non-family households were low-income. This information suggests that, while many Asian seniors enjoy the support of family members, elderly Asians living alone or in other non-family arrangements are most economically and socially vulnerable.
Source: Census 2000

38
Seniors
Figure 6.3: Poverty and Low-Income Rates by Household Type for Seniors in New York City, 2006
Educational Attainment Greater educational attainment has some correlation with economic well-being of elderly Asian New Yorkers but not as much linkage as for the city’s total elderly population. At each major level of schooling, Asian seniors in 2006 had higher poverty rates, as well as higher low-income rates, than the general elderly population. In two poverty-rate contrasts, 41 percent of Asian seniors and 28 percent of all city seniors without high school diplomas were poor, while elderly Asians with some college education were twice as apt to be poor as older city residents overall. Interestingly, Asian seniors with some college and those with only a high school diploma had nearly identical low-income rates (although those who had not finished high school were much more likely to be poor). Figure 6.4: Poverty and Low-Income Rates by Educational Attainment for Seniors in New York City, 2006
Source: 2006 American Community Survey Public Use Microdata Sample
Source: 2006 American Community Survey Public Use Microdata Sample

39
Working but Poor: Asian American Poverty in New York City
English Proficiency and Linguistic Isolation Among New York City seniors in living in poverty, 91 percent of Asians had limited English ability, compared with 56 percent of all city seniors, in 2006. Likewise, LEP rates for near-poor Asian seniors were also much higher than that of all near-poor seniors, with 79 percent for Asians and 37 percent of the general senior population having limited English proficiency. Figure 6.5 illustrates poverty and low-income rates for Asian seniors and the city’s entire elderly population in relation to five categories of English skills. It shows three patterns for Asian seniors – one similar but the others different from those for the general elderly population. For both elderly Asians and seniors at large, except for seniors who spoke English only, lower English ability corresponded with progressively higher poverty rates. However, at each skill level except the English-only category, Asian seniors were more likely to live in poverty than seniors overall. At the English-only level, results for Asians seem counterintuitive. While seniors in general in this category had about the same poverty rate as those in the next-lower ability level, elderly Asians speaking English only were more apt to live in poverty than those in the next two declining-skills categories. . Figure 6.5: Poverty Rates by English-Ability Category for Seniors in New York City, 2006
Source: 2006 American Community Survey Public Use Microdata Sample

40
Seniors
Three-quarters of Asian seniors living below the poverty level were in linguistically isolated households, compared with less than a half (49 percent) of all elderly New Yorkers. For near-poor seniors, 51 percent of elderly Asians and 27 percent of all elderly New Yorkers were linguistically isolated. By contrast, among those living at or above twice the poverty level (i.e., those who were not low-income), linguistic isolation rates were 30 percent for elderly Asians and 10 percent all seniors.
Immigration and Citizenship Almost all (97 percent) of Asians seniors in New York City as of 2006 were foreign-born, compared with 44 percent of city seniors overall. Elderly Asians had higher poverty rates than the general elderly population when compared across all immigrant and citizenship categories. Almost one-third (31 percent) of foreign-born Asian seniors lived in poverty, compared with one-fourth of the general elderly population. Low-income rates for those born outside the United States were 54 percent for Asian seniors and 48 percent for elderly New Yorkers overall. However, signaling that the immigration factor is only part of the picture, the largest difference in income status was among native-born seniors. The poverty rate for Asian seniors born in the United States (28 percent) was nearly double the rate for all native-born seniors (15 percent). Half of native-born elderly Asians were low-income, compared with 38 percent of all native-born seniors. Figure 6.6: Poverty and Low-Income Rates by Citizenship for Seniors in New York City, 2006
Figure 6.7 presents poverty and low-income data by decade of entry for senior immigrants. In a pattern reflecting that for Asian working-age adults, Asian seniors who arrived in the United States from 2000 to 2006 had the highest poverty rate (54 percent). However, seniors in general were most apt to be poor if they arrived from 1990 to 1999, followed by the 2000-2006 time frame. Poverty rates were similar for Asian seniors arriving before 1980, in the 1980s and in the 1990s.
Source: 2006 American Community Survey Public Use Microdata Sample
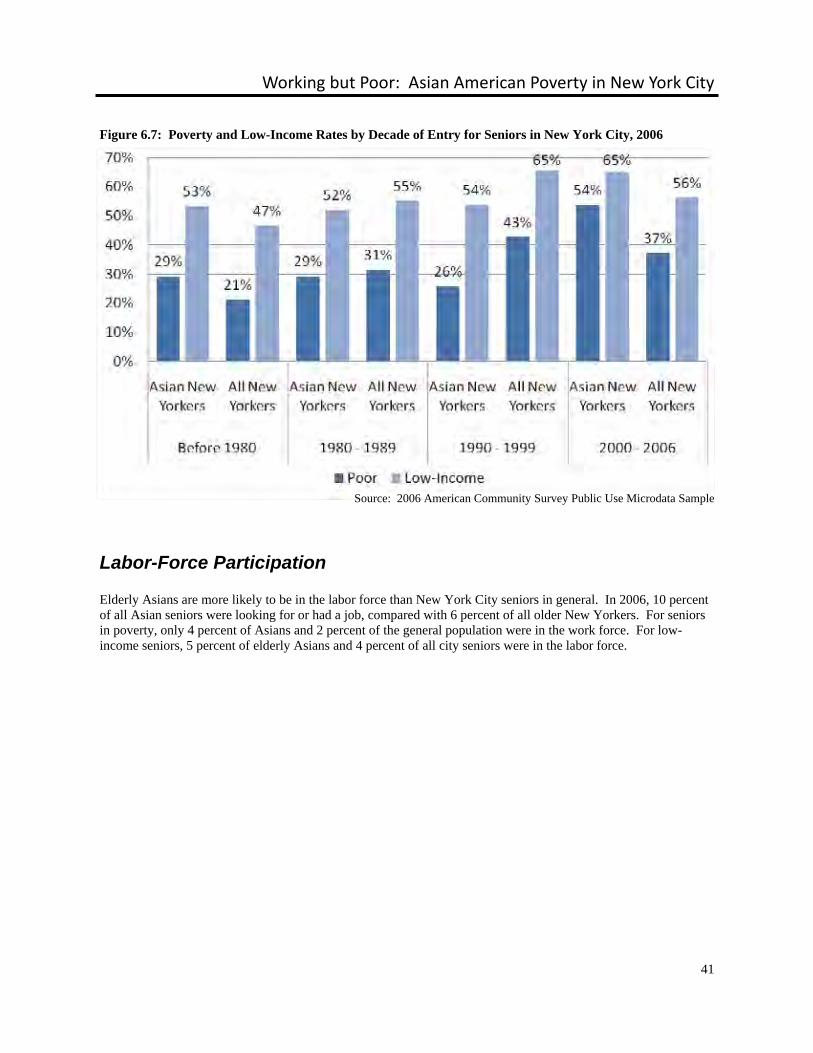
41
Working but Poor: Asian American Poverty in New York City
Figure 6.7: Poverty and Low-Income Rates by Decade of Entry for Seniors in New York City, 2006
Labor-Force Participation Elderly Asians are more likely to be in the labor force than New York City seniors in general. In 2006, 10 percent of all Asian seniors were looking for or had a job, compared with 6 percent of all older New Yorkers. For seniors in poverty, only 4 percent of Asians and 2 percent of the general population were in the work force. For low-income seniors, 5 percent of elderly Asians and 4 percent of all city seniors were in the labor force.
Source: 2006 American Community Survey Public Use Microdata Sample

42
Policy Considerations

43
Working but Poor: Asian American Poverty in New York City
Chapter 7
Policy Considerations This report uncovers a number of patterns of poverty among Asian New Yorkers. Asians typically are working poor. In addition, many poor Asian families are relatively new immigrants with limited English proficiency. Poverty among Asian seniors is high, and it represents a growing problem, given current population trends and the aging of working-age Asians in poverty. The poverty experiences of Asians, in some cases extending to the larger immigrant population, carry implications for efforts to reduce poverty.
Improving Economic Opportunities for Immigrants Decreasing poverty among Asian immigrants requires policies and programs that address its primary causes: low wages and limited employment opportunities. Asian immigrants risk being trapped in poverty because they lack English proficiency and their jobs offer meager prospects for advancement. In 2006, the 10 most common occupations among Asian poor in New York City were cashiers, sewing machine operators, taxi drivers and chauffeurs, retail salespersons, cooks and chefs, construction laborers, waiters, janitors, secretaries and administrative assistants, and painters. At the same time, this report shows that poor Asians received more education than the New York City’s total poor population. More than one-fourth (26 percent) of Asian poor, compared with 18 percent of all poor New Yorkers, have college degrees. This difference, along with Asian occupational data, suggests Asian underemployment. Work-force development strategies that enable employed low-wage workers to gain English ability, learn new skills, and/or better use their education and talents would help them move to better-paying jobs. Many low-income Asian immigrants depend on jobs in immigrant enclaves, such as Manhattan’s Chinatown, Flushing, Jackson Heights, Richmond Hill, and Sunset Park. However, the enclave economy is plagued by highly-competitive, low-profit-margin business environments; low wages; no worker benefits; and poor working conditions. Therefore, lessening poverty is linked to economic development strategies that support local businesses; improve the enclave economy; increase wages; and encourage compliance with legal and regulatory requirements, as well as fair labor practices. Educating the Asian community to document work histories also is vital to enable workers to receive benefits, such as the Earned Income Tax Credit, Social Security and Medicare. Employers need to be encouraged to pay required payroll taxes. Best case, programs can stimulate workers to accept documented employment. Regardless of whether employers report earnings to the Internal Revenue Service or Social Security Administration, workers can be taught to document their earnings and pay all due income taxes. The self-employed should be instructed to file self-employment taxes to receive Social Security and Medicare benefits.

44
Policy Considerations
Increasing the Availability of Affordable Housing Making affordable housing more available is critical to alleviating poverty. For households below the poverty level in rented homes, almost all Asian households (91 percent) spent 30 percent or more of their income on rent, compared with 87 percent of all poor households in New York City. In some Asian immigrant neighborhoods, housing ranges from inadequate to substandard. The demand for affordable housing in the city far exceeds it supply.
Enriching Learning and Development for Children Investing in child care, schools and youth development programs in immigrant communities is crucial to enabling working families to break out of poverty. One essential step is to increase the availability of affordable, licensed child care for low-income Asian families. These families often have both parents working long hours. Of necessity, many parents living outside of Chinatown turn to private, unlicensed child-care providers. Other parents rely on grandparents to be primary caregivers. However, language and cultural barriers between older Asian immigrants and children often hinder child development. Because of long work hours and language differences, immigrant working-poor parents frequently cannot help their children with homework or otherwise become involved in their children’s education. Translating school notices and materials into the languages of immigrant parents and hiring school employees capable of communicating with parents in their languages would ease parental participation in their children’s educational attainment. Immigrant parents who are not familiar with the American educational system may not be aware of the importance of extracurricular experiences both for college applications as well as the myriad of opportunities for success in the U.S. economy. Extending the school day and year would be helpful for Asian immigrants. The Shuang Wen School, a dual-language/dual-culture public school in Chinatown/the Lower East Side, could be a model for extended-day programs. For 10 years, Shuang Wen has demonstrated significant success in educating low-income children in pre-kindergarten through eighth grade from 8 a.m. to 5:30 p.m. The school is academically strong and has cultivated active parental involvement. After-school programs also are important to Asian immigrant children. Besides offering homework help and recreational activities, these programs help children integrate into the social mainstream, as well as expose them to resources, opportunities and information not familiar to their parents. Such acculturation, coupled with good formal education, will foster children’s social, emotional and academic development. The children’s achievement also will help their families escape poverty. Immigrant parents should be encouraged to enroll their children in these programs so youth can fully expand their horizon beyond academic success.
Improving Access to Health Care Expanding health-insurance coverage and making health care more linguistically accessible and culturally appropriate are vital to low-income Asian immigrants. The cost of health care discourages those without coverage from seeking help early, when health problems can be managed most easily. Many Asian working-age adults in low-wage jobs do not receive health-insurance coverage from their employers. Greater outreach to introduce Healthy New York, a state-subsidized insurance program, to immigrant communities would be helpful. Healthy New York allows small-business owners to enroll themselves and their employees for low-premium coverage. Extending the eligibility criteria also may be necessary. Broadening enrollment in the state-sponsored Child Health Plus and Family Health Plus insurance programs is essential to benefit poor Asian children. Asian seniors not eligible for Medicare or Medicaid also need access to affordable insurance (as discussed in greater detail below).

45
Working but Poor: Asian American Poverty in New York City
Language access and cultural competence are key factors influencing immigrants’ use of health-care services. Health-care providers have made substantial progress in serving New York City’s Chinese residents. More efforts are needed to extend health-care access for other Asian ethnic populations.
Expanding the Safety Net for Immigrant Elders Poor elderly Asian immigrants need to be able to benefit fully from the social safety net that protects New York City’s general senior population. According to a Federation study,10 many Asian seniors immigrated to the United States at middle or late middle age. More than half of Asian elders studied did not have a long enough work history or a documented work history to qualify for Social Security benefits. More than one-third of respondents depended on Supplemental Security Income (SSI). The Federation study also found these other poverty-related conditions among elderly Asian New Yorkers: Approximately half of Asian seniors receive health insurance through Medicare, in contrast with 90 percent of the city’s elderly population at large. Many Asian seniors live in substandard apartments, including walk-up units. Asian elders experience depression at a higher rate than the general elderly population. Language barriers and low educational attainment prevent many Asian seniors from applying for benefits. Measures needed to reduce poverty among elderly Asian immigrants include improving retirement protections for those who do not qualify for Social Security and making health-insurance coverage available for those not covered by Medicare or Medicaid. Fulfillment of the mayor’s efforts to increase the federal poverty threshold also would help relieve some seniors not eligible for SSI or Medicaid because they do not meet current income requirements. Family Health Plus or Child Health Plus could be models for extending coverage to seniors currently not eligible for Medicare or Medicaid. Providing employees the option of covering elderly dependents through their employer-based plans could be another solution. For enhanced quality of life, Asian elders also need better and affordable housing, including assisted living, as well as more available and culturally suitable services, such as long-term care and geriatric mental-health care. Efforts should be made to widen opportunities for active elderly Asians to contribute to the community in paying and volunteer roles. Income-producing positions can help these seniors attain steady income, add work history to increase their Social Security benefits, and receive employer-provided health insurance. For example:
• Job-skills retraining and placement in fields such as home-care positions hold high potential. Home care is a growing industry in the Chinese community. Many older Chinese adults who had previously worked in the garment industry have been successfully trained to work in the industry. Similar opportunities should be afforded to other Asian ethnic groups with increasing needs for bilingual home-care workers in their communities. Other potential fields of employment for active Asian seniors should also be investigated.
• Senior Community Service Employment Program (SCSEP) provides subsidized, part-time community service employment and work-based training for low-income adults age 55 or older who have poor employment prospects. Participants are paid at the highest minimum wage standard, whether Federal, state or local, and mostly work part-time. Program goal is to placing 30 percent of participants into unsubsidized jobs. New York City’s Chinese and Korean communities have benefited from SCSEP, which needs to expand to the wider Asian population.
• The Foster Grandparent program offers older volunteers a stipend. The program should be introduced and made more accessible to the city’s Asian seniors, who have not participated in large numbers. Other senior volunteer programs are available and should also be expanded to include all Asian ethnic groups.
10 Asian American Federation, Asian American Elders in New York City: A Study of Health, Social Needs, Quality of Life and Quality of Care. February 2003.

46
Appendix A

47
Working but Poor: Asian American Poverty in New York City
Appendix A
National Asian American Poverty Statistics According to the 2006 American Community Survey (ACS), median household income for Asians nationwide was $63,642, higher than $52,375 for non-Hispanic whites and $48,451 for all Americans. However, the poverty rate for Asian Americans across the country was 10.7 percent, less than the 13.3 percent poverty rate for the nation as a whole, but higher than the poverty rate for non-Hispanic whites (9.3 percent). Asian seniors (age 65 and over) had a much higher poverty rates of 12.3 percent compared to seniors in general who had a poverty rate of 9.9 percent and non-Hispanic white seniors with a 7.8 percent poverty rate. Geographically, poverty among Asian Americans varies from state to state, as shown in Table A.1. With the exceptions of New York, Massachusetts, Minnesota, Pennsylvania, and Wisconsin, Asians had equal or lower poverty rates in 2006 than the general population in the states with more than 65,000 Asians.11 Poverty rates between the general population and the Asian population were statistically tied in Arizona, Colorado, Connecticut, Indiana, Missouri, Ohio, and Oregon. In New York State, Asian Americans were more likely to live in poverty than their fellow residents. In 2006, Asian poverty rates were 15.5 percent compared to 14.2 percent for the entire state of New York. For Census 2000, Asian poverty for New York State was 17.4 percent with the general poverty rate at 14.6 percent. Among the states analyzed, only Hawaii had Asian poverty rates lower than the poverty rates for non-Hispanic whites for both the Census 2000 and the 2006 ACS. In 2006, several more states with 65,000 or more Asians had Asian poverty rates statistically tied or lower than non-Hispanic white poverty rates: Florida, Georgia, Kansas, Maryland, Nevada, New Jersey, Tennessee, Virginia, and Washington.
11 For some states (Idaho, North and South Dakota, Montana, Vermont and Wyoming) and the District of Columbia, the 2006 ACS has too few samples to accurately estimate a poverty rate for Asians in those areas. In addition, while the 2006 ACS reports data for some states with fewer than 65,000 Asians, the single-year ACS estimates for population groups smaller than 65,000 have a wide margin of error and data for those states will not be discussed here. When three-year and five-year period estimates are released in future years, a full evaluation of all states will be possible.

48
Appendix A
Stat
e
Tot
al
Popu
latio
n A
sian
Po
pula
tion
Pove
rty
Rat
e fo
r A
ll R
aces
, 20
06
Non
-His
pani
c W
hite
Pov
erty
R
ate,
200
6
Asi
an
Pove
rty
Rat
e, 2
006
Pove
rty
Rat
e fo
r A
ll R
aces
, 20
00
Non
-His
pani
c W
hite
Pov
erty
R
ate,
200
0
Asi
an
Pove
rty
Rat
e, 2
000
Cal
iforn
ia
36,4
57,5
49
4,48
3,25
2 13
.1%
8.
1%
10.0
%
14.2
%
7.8%
12
.8%
N
ew Y
ork
19,3
06,1
83
1,32
2,97
1 14
.2%
9.
1%
15.5
%
14.6
%
8.5%
17
.4%
Te
xas
23,5
07,7
83
787,
208
16.9
%
8.9%
11
.8%
15
.4%
7.
8%
11.9
%
New
Jers
ey
8,72
4,56
0 65
2,37
8 8.
7%
5.2%
5.
7%
8.5%
4.
7%
6.8%
Ill
inoi
s 12
,831
,970
53
6,99
2 12
.3%
7.
7%
8.9%
10
.7%
6.
3%
9.7%
H
awai
i 1,
285,
498
512,
995
9.3%
9.
8%
6.8%
10
.7%
9.
1%
7.1%
W
ashi
ngto
n 6,
395,
798
423,
976
11.8
%
9.5%
9.
6%
10.6
%
8.3%
12
.8%
Fl
orid
a 18
,089
,889
39
3,42
7 12
.6%
8.
8%
8.7%
12
.5%
8.
1%
12.2
%
Virg
inia
7,
642,
884
365,
515
9.6%
7.
2%
7.0%
9.
6%
6.7%
9.
2%
Mas
sach
uset
ts
6,43
7,19
3 31
0,44
1 9.
9%
6.8%
15
.0%
9.
3%
6.4%
16
.2%
Pe
nnsy
lvan
ia
12,4
40,6
21
289,
289
12.1
%
9.0%
14
.7%
11
.0%
8.
2%
16.7
%
Mar
ylan
d 5,
615,
727
276,
362
7.8%
5.
3%
5.9%
8.
5%
5.3%
8.
3%
Geo
rgia
9,
363,
941
254,
899
14.7
%
9.2%
9.
5%
13.0
%
7.8%
10
.2%
M
ichi
gan
10,0
95,6
43
236,
972
13.5
%
10.0
%
11.2
%
10.5
%
7.4%
11
.2%
M
inne
sota
5,
167,
101
179,
295
9.8%
7.
4%
14.8
%
7.9%
6.
0%
19.0
%
Ohi
o 11
,478
,006
17
5,00
0 13
.3%
10
.5%
12
.8%
10
.6%
8.
1%
12.8
%
Nor
th C
arol
ina
8,85
6,50
5 16
2,57
8 14
.7%
9.
9%
12.0
%
12.3
%
8.1%
10
.1%
N
evad
a 2,
495,
529
147,
363
10.3
%
7.7%
7.
8%
10.5
%
7.3%
8.
3%
Ariz
ona
6,16
6,31
8 14
4,85
8 14
.2%
8.
4%
12.7
%
13.9
%
7.8%
12
.3%
O
rego
n 3,
700,
758
135,
746
13.3
%
11.0
%
12.9
%
11.6
%
9.8%
12
.5%
C
olor
ado
4,75
3,37
7 13
3,07
9 12
.0%
8.
2%
12.6
%
9.3%
6.
5%
11.1
%
Con
nect
icut
3,
504,
809
117,
054
8.3%
5.
1%
7.9%
7.
9%
4.5%
8.
4%
Wis
cons
in
5,55
6,50
6 11
0,77
8 11
.0%
8.
2%
16.6
%
8.7%
6.
3%
19.8
%
Mis
sour
i 5,
842,
713
86,0
10
13.6
%
10.6
%
14.6
%
11.7
%
9.5%
14
.5%
In
dian
a 6,
313,
520
81,0
54
12.7
%
10.4
%
13.5
%
9.5%
7.
7%
15.8
%
Tenn
esse
e 6,
038,
803
76,2
08
16.2
%
13.0
%
11.0
%
13.5
%
10.7
%
12.6
%
Tab
le A
.1: P
opul
atio
n an
d Po
vert
y R
ates
by
Stat
e R
anke
d by
Tot
al A
sian
Pop
ulat
ion,
for
2000
and
200
6

49
Working but Poor: Asian American Poverty in New York City
Kan
sas
2,76
4,07
5 60
,646
12
.4%
10
.1%
8.
9%
9.9%
7.
9%
14.6
%
Okl
ahom
a 3,
579,
212
59,1
64
17.0
%
13.2
%
16.9
%
14.7
%
11.5
%
17.5
%
Loui
sian
a 4,
287,
768
57,0
84
19.0
%
11.4
%
18.2
%
19.6
%
11.0
%
20.7
%
Uta
h 2,
550,
063
49,0
79
10.6
%
8.4%
17
.9%
9.
4%
7.7%
15
.0%
So
uth
Car
olin
a 4,
321,
249
46,9
39
15.7
%
9.5%
9.
3%
14.1
%
8.3%
12
.5%
A
laba
ma
4,59
9,03
0 45
,882
16
.6%
11
.2%
15
.8%
16
.1%
10
.4%
15
.3%
Io
wa
2,98
2,08
5 45
,647
11
.0%
9.
7%
15.6
%
9.1%
8.
1%
14.2
%
Ken
tuck
y 4,
206,
074
38,8
35
17.0
%
15.3
%
13.4
%
15.8
%
14.6
%
12.4
%
Ala
ska
670,
053
30,1
51
10.9
%
6.7%
9.
0%
9.4%
6.
4%
12.2
%
Neb
rask
a 1,
768,
331
29,8
15
11.5
%
9.4%
12
.9%
9.
7%
7.9%
12
.8%
R
hode
Isla
nd
1,06
7,61
0 29
,406
11
.1%
7.
8%
13.7
%
11.9
%
7.9%
21
.7%
A
rkan
sas
2,81
0,87
2 28
,168
17
.3%
13
.3%
10
.5%
15
.8%
11
.8%
13
.5%
N
ew H
amps
hire
1,
314,
895
26,1
36
8.0%
7.
6%
5.4%
6.
5%
6.1%
9.
9%
New
Mex
ico
1,95
4,59
9 25
,983
18
.5%
10
.9%
8.
2%
18.4
%
9.9%
13
.5%
D
elaw
are
853,
476
24,4
13
11.1
%
7.5%
7.
2%
9.2%
5.
9%
8.8%
M
issi
ssip
pi
2,91
0,54
0 22
,116
21
.1%
12
.3%
12
.9%
19
.9%
11
.0%
17
.9%
D
istri
ct o
f Col
umbi
a 58
1,53
0 19
,827
19
.6%
8.
1%
N/A
20
.2%
8.
0%
22.8
%
Idah
o 1,
466,
465
15,3
35
12.6
%
11.1
%
N/A
11
.8%
10
.4%
10
.6%
M
aine
1,
321,
574
12,0
04
12.9
%
12.2
%
25.4
%
10.9
%
10.5
%
19.1
%
Wes
t Virg
inia
1,
818,
470
10,4
79
17.3
%
16.8
%
12.9
%
17.9
%
17.3
%
18.1
%
Sout
h D
akot
a 78
1,91
9 7,
064
13.6
%
9.9%
N
/A
13.2
%
9.7%
12
.0%
V
erm
ont
623,
908
5,69
3 10
.3%
9.
9%
N/A
9.
4%
9.2%
14
.6%
M
onta
na
944,
632
5,52
5 13
.6%
11
.3%
N
/A
14.6
%
12.6
%
20.3
%
Wyo
min
g 51
5,00
4 4,
656
9.4%
8.
4%
N/A
11
.4%
10
.2%
11
.0%
N
orth
Dak
ota
635,
867
4,34
8 11
.4%
9.
8%
N/A
11
.9%
10
.1%
14
.5%
Stat
e
Tot
al
Popu
latio
n A
sian
Po
pula
tion
Pove
rty
Rat
e fo
r A
ll R
aces
, 20
06
Non
-His
pani
c W
hite
Pov
erty
R
ate,
200
6
Asi
an
Pove
rty
Rat
e, 2
006
Pove
rty
Rat
e fo
r A
ll R
aces
, 20
00
Non
-His
pani
c W
hite
Pov
erty
R
ate,
200
0
Asi
an
Pove
rty
Rat
e, 2
000
Sour
ce: C
ensu
s 200
0 an
d 20
06 A
mer
ican
Com
mun
ity S
urve
y N
/A in
dica
tes s
ampl
e si
ze to
o sm
all f
or d
ata
to b
e re
porte
d.

50
Appendix A Table A.2 presents poverty rates for the metropolitan areas with 150,000 or more Asians. Asians in the Boston, Philadelphia, Sacramento, and Minneapolis-St. Paul metro areas had poverty rates higher than that of the general metro area population. With the exception of the Honolulu metro area where the poverty rates were a statistical tie, Asian poverty rates were higher than the non-Hispanic white poverty rates. Table A.2: Poverty Rates for Metro Areas with More than 150,000 Asians Ranked by Total Asian Population, 2006
Source: 2006 American Community Survey In Table A.3, the poverty rates for various Asian ethnic groups across the country range from 5.3 percent for Filipinos to 26.6 percent for Hmong in 2006. All the reported Asian ethnicities showed either no statistical change or a drop in poverty rates from Census 2000 to the 2006 ACS, while the general population and the non-Hispanic white population show an increase in poverty rates over the same time period. Large decreases in poverty rates were reported for Cambodian, Hmong, Indonesian, and Laotian communities.
Metro Area Total Population
Asian Population
Metro Area Poverty Rate
Non-Hispanic White Poverty Rate
Asian Poverty Rate
Los Angeles-Long Beach-Santa Ana, CA 12,950,129 1,770,479 14.1% 7.3% 10.3%
New York-Northern New Jersey-Long Island, NY-NJ-PA 18,818,536 1,729,513 12.8% 6.8% 12.1%
San Francisco-Oakland-Fremont, CA 4,180,027 909,454 9.7% 6.4% 8.6%
San Jose-Sunnyvale-Santa Clara, CA 1,784,826 515,314 9.0% 6.3% 7.8%
Chicago-Naperville-Joliet, IL-IN-WI 9,506,859 492,663 11.9% 5.8% 8.2%
Washington-Arlington-Alexandria, DC-VA-MD-WV 5,288,670 450,392 7.0% 3.6% 5.8%
Honolulu, HI 909,863 402,365 8.4% 7.0% 7.2%
Seattle-Tacoma-Bellevue, WA 3,263,497 338,177 9.6% 7.4% 8.9%
Houston-Sugar Land-Baytown, TX 5,542,048 311,303 14.9% 7.1% 9.5%
San Diego-Carlsbad-San Marcos, CA 2,941,454 302,392 11.7% 6.9% 10.7%
Dallas-Fort Worth-Arlington, TX 6,006,094 284,084 12.9% 6.7% 11.2%
Boston-Cambridge-Quincy, MA-NH 4,455,217 258,046 9.2% 6.4% 14.4%
Philadelphia-Camden-Wilmington, PA-NJ-DE-MD 5,826,742 247,366 11.8% 6.1% 14.8%
Sacramento--Arden-Arcade--Roseville, CA 2,067,117 238,425 11.1% 8.2% 13.1%
Riverside-San Bernardino-Ontario, CA 4,026,135 222,686 13.0% 9.0% 10.5%
Atlanta-Sandy Springs-Marietta, GA 5,134,871 208,881 11.9% 6.6% 8.9%
Minneapolis-St. Paul-Bloomington, MN-WI 3,175,041 158,492 8.9% 5.7% 15.0%

51
Working but Poor: Asian American Poverty in New York City
Table A.3: Nationwide Poverty Rates by Asian American Ethnicity for 2000 and 2006
Source: Census 2000 and 2006 American Community Survey N/A indicates sample size too small for data to be reported. * indicates that the difference from Census 2000 poverty rate is not statistically significant. The map in Figure A.1 identifies states where Asians have a higher poverty rate than the general state population. Because 2006 poverty statistics for Asians were not available for all states, Figure A.1 uses Census 2000 poverty data. Wisconsin, Minnesota, and Rhode Island all had Asian poverty rates exceeding the state poverty rates by 10 percent or more. In states where Asians had lower poverty rates, the rates were only a few percentage points lower than the general poverty rates, the largest difference being 4.9 percent.
Ethnicity Census 2000 Poverty Rate
2006 ACS Poverty Rate
2006 ACS Margin of Error
Nation 12.4% 13.3% ±0.1%
Non-Hispanic White 8.1% 9.3% ±0.1%
Asian 12.6% 10.7% ±0.3%
Bangladeshi 21.3% 22.5%* ±5.5%
Cambodian 29.3% 18.5% ±2.7%
Chinese 13.5% 12.1% ±0.6%
Chinese excluding Taiwanese 13.4% 12.0% ±0.6%
Filipino 6.3% 5.3% ±0.4%
Hmong 37.8% 26.6% ±3.6%
Indian 9.8% 8.2% ±0.5%
Indonesian 20.9% 11.8% ±2.9%
Japanese 9.7% 9.1%* ±0.8%
Korean 14.8% 13.7%* ±0.9%
Laotian 18.5% 11.7% ±2.1%
Malaysian 25.0% N/A
Pakistani 16.5% 17.2%* ±2.8%
Sri Lankan 10.4% N/A
Taiwanese 14.7% 12.8%* ±2.4%
Thai 14.4% 13.3%* ±2.0%
Vietnamese 16.0% 13.6% ±0.9%

52
Appendix A
Figu
re A
.1: D
iffer
ence
in P
over
ty R
ates
bet
wee
n A
sian
s and
the
Gen
eral
Pop
ulat
ions
of E
ach
Stat
e
53
Working but Poor: Asian American Poverty in New York City
About the Asian American Federation The Asian American Federation is a non-profit organization that works to advance the civic voice and well-being of Asian Americans. We raise funds to meet community needs, undertake research to inform policies that affect the Asian American community, and provide capacity-building support to strengthen community organizations. Established in 1990, the Federation is a pan-Asian membership organization. We fund, serve and advocate on behalf of 42 member agencies.
Related Publications Asian American Federation (February 2003). Asian American Elders in New York City: A Study of Health, Social Needs, Quality of Life and Quality of Care. New York, NY. Asian American Federation (June 2008). Revitalizing Chinatown Businesses: Challenges and Opportunities. New York, NY. Asian American Federation (November 2005). Economic Characteristics of Asian Americans in the New York Metropolitan Area. New York, NY.

54
Working but Poor: Asian American Poverty in New York City
Board of Directors Jeffrey Chin, Chairperson Senior Partner, Ernst & Young LLP (Retired) Gary S. Moriwaki, Esq., Vice Chairperson Partner, Fox Rothschild LLP George H. Wang, Esq., Treasurer Partner, Orrick, Herrington & Sutcliffe LLP Ekta Singh, Secretary Principal, Ernst & Young LLP Mir M. Alam Partner, Deloitte & Touche LLP Muzaffar Chishti, Esq. Director, Migration Policy Institute at New York University School of Law Richard C. Hsia Executive Vice President & General Counsel Wright Risk Management Company, Inc. Paul D.C. Huang President, C.J. Huang Foundation Yung Duk Kim, Ph.D. President & CEO, Hyundai Corporation (USA) (Retired) Peter D. Lederer, Esq. Attorney-at-Law Lisa B. Murphy Setsuko Matsunaga Nishi, Ph.D. Principal Investigator, Japanese American Life Course Project Professor of Sociology, The Graduate School and Brooklyn College, The City University of New York (Emerita) Dong Suk Suh President & CEO, Valjean 5425 Corporation Dennis Swanson President of Station Operations, FOX Television Stations Group
Grace Lyu Volckhausen Commissioner, New York City Commission on Human Rights Sunil Wadhwa Director of Client Services, Gravitas Technology Inc. Usha Wright Felicia Yieh Theresa H. Yoon Director, UBS Bank
Honorary Board Senator Daniel K. Inouye, Chairperson United States Senate Francis Y. Sogi, Esq. Life Partner, Kelley Drye & Warren LLP Oscar L. Tang Financier and Philanthropist Procopio U. Yanong, M.D.

Asian American Federation120 Wall Street, 3rd Floor
New York, NY 10005Tel: (212) 344-5878Fax: (212) 344-5636
Email: [email protected]: www.aafederation.org