working capital management and national culture939129/fulltext01.pdf · working capital management...
TRANSCRIPT

Working Capital Management and
National Culture
- A Cross Country Study
Master’s Thesis 30 credits
Department of Business Studies
Uppsala University
Spring Semester of 2016
Date of Submission: 2016-05-27
Elo Katri
Tanska Tuuli
Supervisor: Matthias Holmstedt

Abstract
Earlier research illustrates that national culture influences financial decision making. In working
capital management, the research has been limited and the various results regarding this relationship
have been ambiguous. However research has been limited and the results can differ. Therefore, this
study concentrates on the relationship between the difference on national cultural dimensions and
working capital practices, using the sample of eight culturally differing countries with the total of
240 observations for the year 2014. The national cultural dimensions are based on Hofstede’s
framework. By using multiple regression models, the connection between national cultural
dimensions and working capital is verified and relationships are detected. Individualism versus
collectivism, uncertainty avoidance and masculinity versus femininity provide proof of an existing
relationship between national cultural dimensions and working capital practices and efficiency,
namely cash conversion cycle. The results of this study suggest that national cultural cause
differences to working capital management practices between countries. The length of the cash
conversion cycle seems to change depending on the national cultural score of the country. Managers
need to take this cultural impact into consideration when operating in international business
environment and developing working capital practices.
Keywords: cultural impact, working capital management, working capital determinants, working
capital efficiency, cash conversion cycle, international finance, cultural finance

Table of Contents 1. Introduction ................................................................................................................................... 1
1.1. Finance and Working Capital ................................................................................................ 1
1.2. Country-level Differences and Culture ................................................................................. 2
1.3. Purpose .................................................................................................................................. 3
1.4. Contribution........................................................................................................................... 4
1.5. Disposition............................................................................................................................. 4
2. Theoretical Background ................................................................................................................ 5
2.1. National Culture and Managerial Practices ........................................................................ 5
2.2. Hofstede’s Cultural Framework ......................................................................................... 6
2.3. Additional National Culture Views .................................................................................... 8
2.3.1. Gray’s Framework .......................................................................................................... 8
2.3.2. Schwartz’s Framework .................................................................................................. 8
2.3.3. GLOBE Project .............................................................................................................. 9
2.4. Discussion and Critique of Theoretical Frameworks ......................................................... 9
3. Literature review ......................................................................................................................... 12
3.1. Working Capital Management and Country Differences ................................................ 12
3.2. Cultural Research in Finance Literature .......................................................................... 14
3.3. Hypotheses by Hofstede’s Dimensions ........................................................................... 15
3.3.1. Power Distance ............................................................................................................ 16
3.3.2. Individualism versus Collectivism ............................................................................... 16
3.3.3. Uncertainty Avoidance ................................................................................................ 17
3.3.4. Masculinity versus Femininity ..................................................................................... 18
3.3.5. Long Term versus Short Term Orientation .................................................................. 19
3.3.6. Indulgence versus Restraint ......................................................................................... 19
3.3.7. Summary of the Hypotheses ........................................................................................ 21
4. Methodology ............................................................................................................................... 22
4.1. Research Design ............................................................................................................... 22
4.2. Chosen Variables .............................................................................................................. 23
4.2.1. Dependent and Independent Variables ........................................................................ 23
4.2.1.1. Cash Conversion Cycle – Dependent Variable ................................................... 24
4.2.1.2. National Culture Dimensions - Independent Variables ...................................... 24
4.2.2. Control Variables ......................................................................................................... 25

4.2.2.1. Growth Opportunities ......................................................................................... 25
4.2.2.2. Debt Ratio ........................................................................................................... 25
4.2.2.3. Quick Ratio ......................................................................................................... 26
4.2.2.4. Company Size ..................................................................................................... 26
4.2.2.5. Cash Flow ........................................................................................................... 27
4.2.2.6. Fixed to Total Assets........................................................................................... 27
4.3. Summary of the Variables in the Regression Model ........................................................... 28
4.4. Collecting the Data .............................................................................................................. 29
4.4.1. Data Collection ............................................................................................................ 29
4.4.2. Data Preparation ........................................................................................................... 31
4.5. Descriptive Statistics ........................................................................................................... 31
4.6. Regression Analysis ............................................................................................................ 33
4.6.1 Regression Model ........................................................................................................ 33
4.6.2. Assumptions of Regression Model .............................................................................. 34
4.6.2.1. Linearity ................................................................................................................ 34
4.6.2.2. Normality of Residuals ......................................................................................... 34
4.6.2.3. Heteroskedasticity ................................................................................................ 35
4.6.2.4. Independency of Observations ............................................................................. 35
4.6.2.5. Multicollinearity ................................................................................................... 35
4.6.3. Summary of the Assumptions Tests............................................................................. 36
5. Results ....................................................................................................................................... 37
5.1. Multiple Regression without Control Variables .................................................................. 37
5.1.1. Interpreting the Independent Variables ...................................................................... 37
5.2. Multiple Regression with Control Variables ....................................................................... 38
5.2.1. Interpreting the Independent Variables ...................................................................... 39
5.2.2. Interpreting the Control Variables ............................................................................. 40
5.3. Discussing the Insignificance and Limitations of the Results ............................................ 40
5.4. Summary of the Results ..................................................................................................... 41
6. Analysis ....................................................................................................................................... 42
6.1. National Culture as a Determinant Factor ........................................................................ 42
6.2. Individualism versus Collectivism – Importance of Freedom ......................................... 43
6.3. Uncertainty avoidance - Flexibility of Ideas .................................................................... 44
6.4. Masculinity versus Femininity - Driven by Performance ................................................ 44

6.5. Long Term versus Short Term Orientation- Focus of Short Term Finance ..................... 45
6.6. Indulgence versus Restraint – Change of Behavior ......................................................... 46
6.7. Power distance - Tying Culture Dimensions Together .................................................... 47
6.8. Impact of Control Variables ............................................................................................. 47
6.9. Comparision of National Culture Impact to the Earlier Research .................................... 48
7. Robustness Check ........................................................................................................................ 50
8. Conclusion ................................................................................................................................... 51
9. Suggestions for Further Research ................................................................................................ 53
9. References .................................................................................................................................... 54
10. Appendixes.................................................................................................................................. 62
10.1. Appendix 1: Before Winsorization.................................................................................. 62
10.2. Appendix 2: After Winsorization by 5 percentile ........................................................... 63
10.3. Appendix 3: Assumptions Testing ................................................................................. 64
10.4. Appendix 4: Hoftede’s Dimensions ................................................................................ 67
10.5. Appendix 5: Schwartz’s Dimensions .............................................................................. 68

List of Abbreviations
CCC = Cash conversion cycle
CF = Cash flow
CZ = Company size
DR = Debt ratio
FtoTOT = Fixed to total assets
GLOBE = Global leadership and organizational behavior effectiveness
IDV = Individualism versus collectivism
IND = Indulgence versus restraint
LTO = Long term versus short term orientation
MAS =Masculinity versus femininity
OLS = Ordinary least squares method
PDI = Power distance
QR = Quick ratio
SG = Sales growth
SME = Small and medium sized enterprises
UAI = Uncertainty avoidance

1
1. Introduction
This section provides background and problem formulation of the chosen topic. After which, the
research question is formulated and the purpose and contribution of the study are presented. This
section is concluded with the disposition of the remaining paper.
1.1. Finance and Working Capital
Working capital management has been an area that has been especially acknowledged to need
further research but very little effort has been done to fill in the gaps in this field (Singh & Kumar,
2014). Working capital management is important due to its strong influence on company
performance (Deloof, 2003; Vishnani & Bhypesh, 2007; Garcia-Teruel & Martinez-Solano, 2007;
Falope & Ajilore, 2009; Enqvist et al., 2014; Yazdanfar & Öhman, 2014). As the connection
between working capital efficiency and company performance is evident, it is important to
understand how working capital management practices are shaped and through which channels they
have impact on company performance (Koralun-Bereznicka, 2014).
The main purpose of working capital is to provide a continuing flow of cash to suppliers and
creditors and from customers and debtors. There is a perpetual flow of cash between these parties
(Pass & Pike, 2007). This means that the main task of working capital management is matching the
movements of assets and liabilities over time (Pike & Pass, 1987). The key to being successful in
working capital practices is continuously developing inventory and payable cycles. With working
capital management, a company can estimate how effectively cash flows are managed and discover
if cash is getting stuck in ineffective procedures hindering the company’s growth possibilities.
These actions become increasingly vital when companies have issues with declining revenues, and
are pressured to manage cash flows proactively. This is due to the large amount of assets tied to
working capital and the proven connection between the working capital efficiency and the firm’s
profitability (PwC, 2014).
Efficiently managed inventories and payable peridos are proven to lead improved fim performance
in multiple researches conducted in various geographical regions and time periods (Deloof, 2003;
Vishnani & Bhypesh, 2007; Garcia-Teruel & Martinez-Solano, 2007; Falope & Ajilore, 2009). In
order to enhance profitability, a company needs to determine the optimal level of working capital
and find a balance between the investment risk and efficiency (Nazir & Alfa 2009). Additional

2
investments in working capital may increase the probability of credit risks (Baños-Caballero et al.,
2014) whereas too small investments in working capital management has been proven to lead to
liquidity problems and business failure (PwC, 2014).
Meanwhile working capital management has been recognized as an underresearched area, some
researches have been conducted to determine which factors and to what extent the factors affect
working capital efficiency. Traditionally, industry (Pike & Pass, 1987), company size (Pike & Pass,
1987), debt ratio (Chiou et al., 2002) and growth opportunities (Chiou et al., 2006) have been
noticed to have an effect. Also current ratio and quick ratio have been shown to have a connection
to working capital density (Rimo & Panbunyuen, 2010).
According to Koralun-Bereznicka (2014) one of the biggest influencers to working capital
management is the country the company is operating in. The country influences to working capital
management can differ in various ways, such as; economic growth, legal and institutional
environments and capital market development. However, additional research is needed to
understand the connection between working capital and country characteristics in depth (Koralun-
Bereznicka, 2014).
1.2. Country-level Differences and Culture
There seems to be obvious differences in working capital management practices among different
countries (Sawers 2012; Danske Bank & Ernst & Young, 2009; Koralun-Bereznicka, 2014).
Differences in days of sales outstanding, days of payable outstanding and inventory levels within
various countries have been reported. In the report, information surfaced that some countries are
"one year late" in terms of working capital development compared to other countries (Danske Bank
& Ernst & Young, 2009). Similar evidence on country differences have been presented by Sawers
(2012), who pointed out different working capital practices in North versus South Europe by
comparing 925 European companies.
As some countries’ differences in working capital management are obvious, it is important to
consider how the cultural factors can impact on the phenomenon (Wu, 2016). The research in this
area has been limited but in related fields of finance, namely in capital structure literature, some
evidence discussing culture and financial decision making exists. In the field of capital structure and
culture, Chui, Lloyd and Kwok (2002) questioned whether national culture is the missing piece to
the puzzle and discussed country differences in terms of capital structure decisions. Similarly,

3
additional research on capital structure and culture has proven that a strong relationship between
culture and financial decision making exists (Chang, Wee & Yi, 2011; Zheng, Ghoul, Guedlhami &
Kwok, 2011; Ramirez & Tadesse, 2007).
In working capital management, the only attempts to understand practices leading to efficiency in
terms of culture are studies by Boschker (2011) and Wu (2016). These two researchers found
different results in the connection between working capital management and Hofstede’s cultural
framework (Boschker, 2011; Wu, 2016). They both however, agree on the fact that culture is an
important factor affecting working capital policies; which then again contributes towards working
capital practices and company’s performance. Studying working capital management without
addressing national culture leads to inaccurate results and inefficient models (Wu, 2016). Culture is
a complex phenomen (Hofstede, 1994) and the cultural aspects cannot be separated from the
country characteristics and practices. Its impact on financial decision making and working capital
management should be studied further (Wu, 2016).
Due to the reason that the only existing evidence on culture and working capital management by
Boschker (2011) and Wu (2016) extensively conflicts with one another in terms of Hofstede’s
cultural dimensions and working capital management correlations (Boschker, 2011; Wu, 2016),
additional research is needed to fully comprehend the complex relationship between working capital
management and culture. This is to understand the working capital management practices and the
efficiency of these practices but also its connection to strong performance.
1.3. Purpose
The differences of working capital in cultural aspects are not fully understood; therefore the purpose
of this study is to research the impact of national culture on working capital practices. In this thesis,
the connection between working capital practices and national cultural characteristics in terms of
Hofstede’s dimensions are explored. This way not only the connection between culture and working
capital can be either supported or rejected, but also the way how different building blocks of the
culture affects working capital practices and its efficiency to discovery. Also to understand the
phenomenon of this research uses a sample of mid-size companies in Brazil, Canada, Italy, Sweden,
Japan, Poland, Israel and Malaysia for the fiscal year 2014. The research question is:
How do national cultural characteristics influence working capital management practices?

4
1.4. Contribution
Researches have been conducted in the fields of working capital and company’s performance,
focusing on the level factors that impact the phenomenon. The countries-level factors have been a
topic where there has been less research. Therefore this thesis makes a contribution by focusing on
national cultural aspects of working capital practices in terms of Hofstede’s dimensions from a
multi-country perspective. This thesis will investigate the national cultural impact on working
capital management practices and efficiency, namely cash conversion cycle. The aim is to create
discussion on the topic, and to provide any additional evidence on the connection between national
culture and working capital efficiency. This is of interest especially to managers and companies
operating in an international business environment, as managers need to understand the differences
of working capital practices shaped by the national culture. Taking these possible differences into
consideration is vital as it could be that similar practices are not applicable to the market.
Understanding the cultural impact behind the country differences could therefore help to develop
and implement more effective and customized working capital practices for respective countries.
1.5. Disposition
The remainder of the paper follows a five-part structure. Firstly, theories of cultural approaches are
presented. Secondly, early research on working capital and country differences are discussed and
the hypotheses are formulated. Thirdly, with the aim to test the hypotheses, methodology including
chosen method and variables are discussed. Fourthly, the results of the study are presented and
analysed. Lastly, to finalize the discussion, conclusions and recommendations for further studies are
drawn.

5
2. Theoretical Background
As in the introduction section, the research in culture and working capital management is discussed
in this section. Several cultural approaches are repersented as a theoretical background including
Hofstede, Gray, Schwartz and GLOBE. The values of these frameworks are also in the center of
attention.
2.1. National Culture and Managerial Practices
Culture is “a matter of ideas and values, a collective cast of mind” (Kuper, 1999: 227). Culture
refers to the different values, beliefs and attitudes people share, therefore shaping human’ behaviour
(Hofstede, Hofstede & Minkov, 2011). Culture guides behaviour and daily interactions of people
and therefore same formal rules have different outcomes in various societies (North, 1990). Due to
globalization, cultures are influencing to each other; but changes in culture happen really slowly
(Leung, Bhagat, Buchan, Erez & Gibson, 2005).
Culture also influences companies’ accounting practices and financial statements are shaped by its
culture. Furthermore, culture has influence to internationalization, industry structure, legal
environments and market development (Hofstede et al., 2011). Therefore culture is a vital
influencer to take into consideration (Kolesnik, 2013).
Management practices depend and vary according to the culture they are operated in, and some
systems are not adaptable to another culture without adjustments (Hofstede, 1994). According to
Devine, Oclock & Rooney (2000) companies need to understand the influence of a culture to on
their operation’s failures or successes and its influence to the multinational control systems.
Consequently, when integrating with a new country, companies should take into consideration the
national culture in of their management because the same control systems are not effective in all
countries. Hofstede’s four dimensions of cultural differences are a helpful view of “collective
mental programming” (Devine et al., 2000:38) of a specific country. Nevertheless, these factors are
not perfect, but they show the way how different cultures behave and help to create management
control systems (Devine et al., 2000). Hofstede (2007), Grey (1988), Schwartz (1994) and GLOBE
(2001) researched these cultural differences, among other researchers, and each developed their
own cultural frameworks. These frameworks are discussed here due to their appropriate expression
of culture and cultural differences among countries.
6
2.2. Hofstede’s Cultural Framework
Hofstede conducted three research projects before creating his cultural framework; one among IBM
subsidiaries in 64 countries and two researches among students in 10 countries and in 30 countries,
respectively (Hofstede, 1994: 1). He presented culture through four dimensions, and later on two
more were added to give a complete picture of the cultures. These dimensions are related to basic
problems all countries face but how different answers these different countries found to solve them.
Based on the disparity he created a numerical index between 1-100 and thus making countries
comparable (Hofstede, 1983).
The perspectives are firstly, low versus high power distance which describes how the power in an
organization is distributed and how the members of society accept the differences. In societies of
high power distance, a hierarchical culture is accepted in comparison to low power distance
cultures with less hierarchical culture (Hofstede et al., 2011) and “all societies are unequal, but
some are more unequal than others” (Hofstede, 1994: 2). High power distance organizations have
high discipline, an authoritative and centralized management style in comparison to low power
distance organizations (Hofstede, 2001), discretionary bonuses, tight budgetary control and
subjective performance evaluations are more acceptable in high power distance organizations
(Devine et al., 2007). Power distance determinates the bargaining power between firms and their
partners. This means that in high uncertainty avoidance cultures, larger firms usually have more
bargaining power than smaller firms (Wu, 2016).
A second perspective is high versus low uncertainty avoidance, which determines the level of
people’s uncertainty in unknown situations. ”It ultimately refers to man’s search for truth”
(Hofstede, 1994: 4). When uncertainty avoidance is high, people are following rules and unwilling
to accept peculiar behavior in comparison to low uncertainty avoidance cultures. They also prefer
harmony in cooperation relationships (Hofstede et al., 2011). High uncertainty avoidance working
environments prefer immediate group or business unit rewards, interactive planning in terms of
budget and plans made in short horizon in comparison to low uncertainty avoidance organizations
(Devinet et al., 2007).
Thirdly, individualism versus collectivism refers to which kind of social bonds people prefer. In
collectivism organization, people have tight social bonds and expect other people in the social
group to take care of them (Wu, 2016). People have tight bonds already from birth and the
connection and loyalty is unquestioned (Hofstede, 1994). In Individualism organizations, people

7
does not have strong connections to the groups. People tend to be confident and do not avoid
conflicts (Hofstede et al., 2011). A collectivism working environment, prefers rewards that are
based on group performance, have more acceptance for tight control in terms of budget and people
concern the success of group or company in comparison to individualistic organizations in which
individualistic rewards are preferred (Devine et al., 2007).
Fourthly, masculinity versus femininity refers to people’s performance orientation (Hofstede et al.,
2011). Women’s values have less variation between countries but in men’s values there are huge
gaps between assertiveness and competitiveness (Hofstede, 1994). Masculinity organizations do not
avoid conflicts: “let the best man win” (Hofstede et al., 2011:207). Meanwhile, in femininity
organizations compromising is more common and team- orientation and participativeness is valued.
Masculinity organizations are result driven and incentives are usually personally based (Hofstede et
al., 2011). In masculinity working environments, people desire to have evaluations where others’
performances are is used as a counterpart, incentive-based rewards are preferred and stretch budgets
are accepted (Devine et al., 2007).
Fifthly, long versus short term orientation, also called “Confucian dynamism”, determines people’s
attitudes towards future-oriented pragmatism. In short-term orientation, people are normative and
have strong notions to the absolute truth in comparision to long term oriented cultures (Kolesnik,
2013). Long term orientation refers to the building of relationships and market position with a long
term focus, whereas companies in short-term orientated countries are more focused on fast received
results (Hofstede et al., 2011). Values in short-term orientation are fulfilling social obligations,
respect for tradition and to be able to protect one's face. Meanwhile, values in long-term orientation
are thrift and perseverance (Hofstede, 1994).
Lastly, indulgence versus restraint refers to the level at which enjoying life is accepted. In
indulgence countries, people are allowed relatively freely to fill their gratification of basic and
natural human drives, whereas restraint societies suppress gratification and have strict regulations
and social norms (Hofstede Research center, 2016). Indulgent cultures place more importance on
freedom of speech and personal control, while in restrained cultures, there is a greater sense of
helplessness about personal destiny. In business, this translates into willingness to voice opinions
and give feedback (Communicaid, 2016).

8
Table 1: Summary of Hofstede’s six dimensions of culture.
Hofstede's Dimension Aspect of Culture
Power Distance Power distribution within the society
Uncertainty Avoidance Level of accepted uncertainty in unknown situations
Individualism versus Collectivism Social ties that are preferred
Masculinity versus Femininity Performance orientation
Long versus Short term orientation Time orientation
Indulgence versus Restraint Attitudes towards gratification
This table states the names of the six dimensions and the aspects of culture that they relate to.
2.3. Additional National Culture Views
2.3.1. Gray’s Framework
Gray (1988) extended Hofstede's dimensions with a framework to help analyze the accounting
systems development, by using the value systems which are based on the each country’s societal
values. Accounting values have influence on accounting systems, consequently cultural factors need
to be taken into consideration due to their impact on financial systems. Based on Hofstede’s
dimensions, Gray created four accounting values that are specifically adjusted to explore culture in
accounting settings. His dimensions refer to accounting practices in individual behavior, the level of
where practices are used, risk taking readiness and information sharing styles. Mostly Gray’s
framework was closely connected to Hofstede’s dimensions individualism and uncertainty
avoidance because it also concerns the level of trust, individual independency, predictable future
profits, conflict avoidance and security preserveness (Gray, 1988).
2.3.2. Schwartz’s Framework
Schwartz's cultural dimensions of values can be seen by researchers as a supplementary to
Hofstede’s dimensions because it offers ethic aspects to the theory. Schwartz dimensions are based
on his theory of basic values and the study is made in 1988-1992. Schwartz states that the
differences between his research and Hofstede’s research are “based on different theoretical
reasoning, different methods, a different set of nations, different types of respondents, data from a
later historical period, a more comprehensive set of values, and value items screened to be
reasonably equivalent in meaning across cultures” (Schwartz, 1994:117).
In Schwartz’s research, national cultures are divided into seven value types, then further split into
two culture level dimensions. These values concern harmonious relationships, individual interests

9
and needs, life enjoyment, people’s ambitious and role in the society, others welfare and harmony
with nature. Schwartz further developed these seven values into two broad dimensions which refers
to traditionally or creative society and group or individually importance society (Kolesnik, 2013).
Although it has been suggested that Schwartz’s values vary from Hofstede’s dimensions,
Hofstede’s dimensions are included in his framework. There seems to be positive correlation
between Hofstede’s dimensions individualism, power distance, uncertainty avoidance and
masculinity (Ng, Lee & Soutar, 2007).
2.3.3. GLOBE Project
GLOBE (Global Leadership and Organizational Behavior Effectiveness, 2001) is a research project
lead by Robert House that examined culture and leadership in 62 societies. The study consists of
results from 951 organizations. Later on the GLOBE project was complemented with 25 societies.
The goal of this project was to investigate and create a theory to understand and predict the cultural
behavior that influences the effectiveness of leadership. GLOBE researchers created nine cultural
dimensions which had their origin from various culture researchers’ dimensions such as Hofstede
(1980), Schwartz (1994) and Smith (1995) in order to detect similarities and differences among
cultural practices. The dimensions concentrated to social practices (“As Is”) and values (“Should
Be”) in various cultural aspects. Based on the research six leadership styles were identified
regarding the characteristics leaders have in different societies (House, Javidan & Javidan, 2001;
House, Javidan, Hanges & Dorfman, 2002).
2.4. Discussion and Critique of Theoretical Frameworks
Hofstede’s cultural dimensions have been criticized because the limited use of sample, therefore it
fails to recognize heterogeneity within countries. When reducing and simplifying culture only in
five dimensions Hofstede’s research does not take into consideration all culture values (Kirkman,
Lowe & Gibson, 2006). Also the research can be seen outdated because the research was made in
1970’s (Littrel, 2012).
This study takes into consideration Hofstede’s frameworks limitations and weaknesses regarding
limited sample size and obsolete data (Kirkman et al., 2006) but because Hofstede created these
dimensions as a framework for developing hypotheses in cross-cultural studies (Hofstede, 1983)
and the framework is much used in accounting research it is most suitable framework for this study.
When comparing Schwartz’s cultural dimensions to Hofstede’s cultural dimensions, Hofstede’s

10
study collected data from more countries and from one company, thus making it more appropriate
for capital structure research (Arosa, Richie & Schumann, 2015).
Both frameworks are valid in terms of managerial decisions and cultural distance research
(Drogendijk & Slangen, 2006) but Hofstede’s dimensions determine better macro-economic
variables, while Schwartz’ dimensions determine better macro-social variables (Gouveia & Ros,
2000). Regardless of that both studies are suitable frameworks for research in managerial decision
making, the fact that Hofstede illustrates better macro-economic variables and has more appropriate
data for capital structure research (Arosa et al., 2015), makes it better fitted for this study than
Schwartz’s framework.
When it comes to Gray’s framework, according to Salter & Niswander (1995) Gray’s model is
useful in terms of accounting practices, but in terms of professional and regulatory structures in
cultural view, it is not appropriate. While Hofstede concentrated on values that influence to legal,
political and economic systems, Gray’s model concentrates to values that have influence to
accounting systems (Salter & Niswander, 1995). Thus due to the reason that Gray’s framework
concentrates more to accounting practices and values that influence the accounting practices and
that the purpose of this study is to explore financial decision making processes beyond accounting
practices, Hofstede’s framework has more importance to the value of this study.
When comparing Hofstede to GLOBE one of the main reasons why GLOBE was not best-fitted for
this study is because of GLOBE’s framework illustrated culture not only in societal level but also
on organizational level (Shi & Wang, 2011). This study concentrates on national cultural
characteristics meaning that the focus is on the societal level aspects. As the GLOBE framework
illustrates also organizational behavior, it does not enhance the value to this study.
The critics of Hofstede’s dimensions have had really limited influence to accounting research
(Joannides, Wickramasinghe & Berland, 2012) and Hofstede’s framework has been used in
thousands of empirical studies. His framework is well-known because of the clarity and
applicability to managerial research (Kirkman et al., 2006). According to Richardson (2008)
Hofstede’s dimensions are the most popular and best-known dimensions to use in empirical study in
national differences. Also, Kirman et al. (2006) states that when researchers have been using
Hofstede’s framework they have been able to select countries which are really different from each
other in terms of cultural values and majority of these studies supported Hofstede’s predicted
differences between these countries.

11
In terms of cross-cultural research, Hofstede’s dimensions can still be seen as applicable in the 21st
century (Kirkman, et al., 2006; Harrison & McKinnon, 2007) and Hofstede’s framework has been
shown to be valid by several studies. Additionally, no other model that has been developed equals
Hofstede’s methodology or acceptance in academic research (Arosa et al., 2015). Also, earlier
research on working capital practices and cultural characteristics (Boschker, 2011; Wu, 2016),
focuses on applying Hofstede’s framework. Thus for repetition and comparability purposes of this
study, using the same framework is the most valid approach.

12
3. Literature review
This section includes a discussion on working capital management and cash conversion cycle as a
measure of working capital managmenet practices and efficiency. Also, the country-level focus in
working capital management research is presented. As research in working capital management
and culture is very limited, the cultural research within both working capital and capital structure
literature are explored to highlight the limited earlier research in terms of national culture and
finance. Building on the discussion and theoretical framework presented under theoretical
background section, six hypotheses are drawn for the study purpose in this paper.
3.1. Working Capital Management and Country Differences
Working capital management has raised interest among academics and practitioners after financial
crises and the decrease of financial resources (Singh & Kumar, 2014). The focus of earlier research
has been especially on working capital management efficiency determinants and financial
performance. Within this field, cash conversion cycle (CCC) has been established as a widely
accepted measure of working capital practice efficiency due to its evident connection to company
performance (Deloof, 2003; Vishnani & Bhypesh, 2007; Garcia-Teruel & Martinez- Solano, 2007;
Falope & Ajilore, 2009). The cash conversion cycle refers to the time lag between the expenditure
for the purchases of raw materials and the collection of sales of finished goods. This includes
inventories, as well as account payables and receivables measuring efficiency of working capital
through practices. The longer the time lag, the larger the investment in working capital is (Deloof,
2003). In general, small but sufficient investments in working capital in terms of shorter cash
conversion cycle have been connected to better performance (Deloof, 2003; Vishnani & Bhypesh,
2007; Garcia-Teruel & Martinez- Solano, 2007; Falope & Ajilore, 2009).
As the connction between cash conversion cycle and company performance has been widely
discussed and agreed on, the determinants of working capital management practices and efficiency
in terms of cash conversion cycle have been of interest for the research (Deloof, 2003; Vishnani &
Bhypesh, 2007; Garcia-Teruel & Martinez- Solano, 2007; Falope & Ajilore, 2009). Especially
those focusing on industry (Vishnani & Bhupesh, 2007), sales growth (Deloof, 2003; Garcia-Teruel
& Martinez-Solano, 2007), debt ratio (Deloof 2003; Enqvist et al., 2014), quick ratio and current
ratio (Rimo & Panbunyuen, 2010), and company size (Deloof, 2003) have been discussed and
therefore the focus of working capital management research has been on company-level aspects

13
affecting working capital efficiency. Little focus has been allocated in country differences and in
creating results that would be a valid comparison between the countries, as recognized by Koralun-
Bereźnicka (2014).
This research gap has long been known, even since 1991. A study comparing the Australian and
American working capital management practices was conducted and brought insight into the
country differences. In this questionnaire of working capital management practices in Australia and
United States, Belt and Smith (1991) found out that when it came to account receivables, the
practices between the two countries were very similar. Some country differences, in terms of the
level of inventory and credit/collection management, were detected and connected to culture and
practice differences (Belt and Smith, 1991).
In a cross-European setting, Koralun-Bereznicka (2014) concluded that among small, medium and
large firms, the country factors are more important than the industry factors, while the industry
factors for the most part, are more important than the size factor, putting the determinants of
working capital in order according to their importance. These results hint that country differences
truly exist (Koralun-Bereźnicka, 2014). Similar evidence highlighting country differences has also
been presented by Sawers (2012). He pointed out different working capital practices in North versus
South Europe by comparing 925 European companies for the fiscal years 2010 and 2011 (Sawers,
2012). The study discovered that in Italy, the average days sales outstanding was 76 in 2011, while
that same figure in Spain was 69. The payables side figures showed a similar trend, as Italy rated at
77 days at payable outstanding with Spain again at 69. Italy and Spain are in the top the list of late
payments in Europe whereas the lowest days outstanding figures are found in Germany and
Scandinavia with around 50 days sales outstanding and around 30 days payable outstanding
(Sawers, 2012).
In contrast to these figures, the data provided by Danske Bank and Ernst & Young (2009) illustrated
that days account receivables for Nordic countries is much lower, as most of the Nordic companies
stated their days sales outstanding being between 15-45 days. Most companies stated that their days
payables outstanding are also between 15-45 days. The inventory times were industry specific,
therefore, no general guidelines of the inventory times in Nordic countries were drawn (Danske
Bank & Ernst & Young, 2009). Even though these findings are not directly comparable to the
research by Sawers (2012) due to different publication time and context, they seem to illustrate the
differences in working capital management in the respective countries. Furthermore, the survey by
Danske Bank and Ernst & Young (2009) seems to be in line with Sawers (2012) who states that the

14
lowest days outstanding figures are found in North Europe; Scandinavia and Germany (Sawers,
2012).
Drawing on the differences in days outstanding, Sawers even went as far as (2012) stating that Italy
and Spain seem to pay less priority on working capital management, compared to northern Europe.
This trend seems to be driven by cultural values. The economies of Italy and Spain are less driven
by the market. This attitude seems to stem from the thinking that Spaniards and Italians do not
focus on the pressure and changes in the stock market in a the same way as northern European
countries, that in general have a shorter time orientation. Also, in Spain and Italy, business
relationships are paramount and companies do not wish to push collections. The thinking behind it
being that the clients and customers will pay their bills eventually (Sawers, 2012). Similar findings
on differences in working capital practices on a global scale are reported also by other organizations
(KPMG, 2010; PwC, 2014).
As both the academics (Belt & Smith, 1991; Koralun-Bereznicka, 2014) and practitioners (Sawers,
2012; Ernst & Young, 2009; Sawers, 2012; KPMG, 2010; PwC, 2014) have discussed the
phenomenon, it seems quite obvious that country differences truly exist and that this fact is
generally acknowledged. These differences have even been linked to country characteristics called
practices or operating environment (Sawers, 2012; Danske Bank & Ernst & Young, 2009; Koralun-
Bereznicka, 2014). There is, however, very little research conducted in trying to explain the
connection of these country differences and working capital efficiency. Also there is a lack of
research on country differences by applying cultural frameworks or theories. Also, the complexity
of cultural impact on working capital management practices has not been fully explored (Boschker,
2011 & Wu, 2016). Therefore discussing these themes in depth is of interest.
3.2. Cultural Research in Finance Literature
In finance, national culture has recently increased its popularity as a research topic, as it has been
stated that national cultures are a phenomenon that affects financial decision making (Chang et al.,
2011). Research of the cultural impact on financial decision making using cultural frameworks as a
base, has been conducted among others in the fields of investors legal rights (Goldsmith, Licht &
Schwartz, 2001; Goldsmith, Licht & Schwartz, 2005), dividend payouts (Guidlhami, Kwok & Shao,
2009), earnings management (Han, Kang, Salter & Yoo, 2010), remuneration (Schuler &
Rogovsky, 1998), cross-country investment densities (Licht, Schwartz & Siegel, 2011) and trading
patterns (Griffin, Ji & Martin, 2003). Additionally, in the capital structure literature, which has a

15
close connection to working capital management (Koralun-Bereznicka, 2014), plenty of resources
have been allocated into exploring the country and cultural differences (Stonehill & Snizel, 1969;
Collings & Sekely, 1988; Chui et al., 2002; Chang et al., 2011; Griffin et al., 2009; Ramirez &
Tadesse, 2007).
As early as 1969, Stonehill and Snizel (1969) found out that local practices and attitudes have an
impact on the capital structure which was later supported by Collins and Sekely (1988). Recently,
Chui, Lloyd and Kwok (2002), questioned whether national culture is a missing piece to the puzzle,
adding to the same topic as Stonehill and Snizel (1969) and Collins and Sekely (1988) before.
Using Schwartz’s cultural framework, Chui et al. (2002) found a connection between national
culture and countries debt ratios (Chui et al., 2002). In addition to that, Chang, Wee and Yi (2011)
find a negative relation between debt maturity and uncertainty avoidance using Hofstede’s
framework. Similar research investigating the risk taking of companies was conducted also by
Griffin, Li, Yue and Zhoe (2009). Additionally, Ramirez and Tadesse (2007) found a connection
regarding cash management and cash levels (Ramirez & Tadesse, 2007).
As far as the writers of this thesis are aware, the first paper using a cultural framework to address
the connection between the working capital efficiency and national cultures was written by
Boschker (2011). The study is first about the working capital management and culture connection in
terms of how working capital management investment is used. Cultural impacts are reported also by
Wu (2016) who similar to Boschker (2011) studies the connection between cash conversion cycle
and national cultures in terms of Hofstede’s cultural dimensions in his working paper.
3.3. Hypotheses by Hofstede’s Dimensions
Culture is a holistic phenomenon affecting decision making processes. National culture views by
Hofstede, Grey, Schwartz and GLOBE provide a tool to understand and measure cultural
differences in financial decision making processes. The determinants of working capital
management have been studied in various countries, but these studies do not fully explain why
firms behave as they do. Cultural differences have been suggested to be the missing piece in the
puzzle in understanding behavior in working capital management. Some evidence has shown the
cultural impact. However, the research has been limited and the results conflicting. Therefore, to
understand the phenomenon of working capital management and country differences, further
research is needed. To gain a deeper understanding of the relationship between national culture and
working capital, to add on the discussion on the importance of the different dimensions of working

16
capital management and company performance, the remainder of the paper will focus on testing and
analysing the below presented six hypotheses.
3.3.1. Power Distance
Boschker (2011) found that SMEs from countries with high power distance have a longer cash
conversion cycle, illustrating a positive relationship that indicates that working capital management
is less efficient. Also it seemed that the companies in high power distance hold larger inventories
(Boschker, 2011) in order to gain more time and thus negotiate with power (Ghoul & Zheng, 2015).
Wu´s results (2016) are in line with Boschker’s (2011) by confirming that the relationship between
working capital management and power distance is positive. Wu (2016) argues that in working
capital management setting the power distance between firms and their partners depends on the
firm’s bargaining powers. In high power distance cultures, large firms have more negotiating
power, which they can use to their own benefit (Hofstede, 1994). For example, powerful firms may
pay their suppliers later but collect from their clients earlier. In low power distance countries, the
clients would be more open about the possible disagreement and be more inclined to negotiate in
terms of working capital management practices which would be more efficient way of handling
payment policies in the country (Wu, 2016). According to earlier research (Kearney, Mac an
Bhairdad & Lucey, 2012; Arosa et al., 2015) power distance has a positive relationship to short-
term and long-term debts in capital structure. Due to centralized decision making and authoritative
leading styles as presented by Hofstede (2001), earlier illustrated research (Boschker, 2011; Wu;
2016), and also based on previous research on capital structure and culture (Kearney et al., 2012;
Arosa et al., 2015) companies in high power distance countries suffer from the lack of negotiation
skills in their business relationships. Also, centralized decision making patterns make them less
adaptable to the environment resulting in longer cash conversion cycles. Therefore, the hypothesis
is as following:
Hypothesis 1: There is a positive relationship between high power distance and the length of the
cash conversion cycle.
3.3.2. Individualism versus Collectivism
In Boschker´s study individualism versus collectivism aspect did not significantly correlate with
cash conversion cycle. There were small indicators hinting that firms from individualistic countries
do not feel responsible for helping other firms and they therefore try to pay their clients as late as

17
possible which contributed to the longer payment period (Boschker, 2011). Wu (2016) finds a
negative relationship between individualism and CCC, and connects this to the idea that in
individualistic countries, the managers focus on themselves when it comes to financial decision
making (Wu, 2016). This aim to increase their individual well-being could contribute towards more
efficiently managed working capital. This relates to the ideas that in individual countries, decision-
makers trust their own instincts and are even overconfident, whereas in collectivistic countries,
decision-making is more risk-averse and relies on the group (Hofstede, 1994). Managers in
individualistic cultures often choose lower debt to maximize their own apparent success and
enhance their own reputation in the group. Therefore, managers in individualistic countries tend to
seek shorter collection periods and lengthen their payment periods (Wu, 2016).
Companies in individualistic societies do not have similar in-group feeling towards their suppliers
and customers and do not aim to help them through financially hard times, as which would not be
the case in collectivistic countries (Hofstede, 1994). According to earlier research on capital
structure and working capital (Antonczyk & Salzmann, 2014; Kearney et al., 2012) more
individualistic countries have higher debt ratios because of individual freedom and self-
actualization (Hofstede, 2005). Individualistic behavior of companies leads to maximizing the
benefits of their own payment policies, as illustrated on earlier research on culture and working
capital (Wu, 2016) and on working capital and capital structure (Antonczyk & Salzmann, 2014;
Kearney et al., 2012). As the individual countries seem to have shorter collection periods and longer
payment periods (Wu, 2016) resulting in shorter cash conversion cycles compared to collectivistic
countries the hypothesis is as following:
Hypothesis 2: There is a negative relationship between individualism and the length of the cash
conversion cycle.
3.3.3. Uncertainty Avoidance
Earlier research indicates that the use of short-term debt decreases when the uncertainty increases
(Chang, Wee & Yi, 2011) and countries in high uncertainty avoidance companies tend to take less
long-term debt and prefer short-term debt (Arosa et al., 2015; Chang & Noorbakhsh, 2009; Kearney
et al., 2012). Ramirez and Tadesse (2007) found that regarding cash management, companies in
countries with high uncertainty avoidance seem to hold more cash due to longer business cycles.
This would mean that high uncertainty relates to longer business cycles in general (Ramirez &

18
Tadesse, 2007). That could also be seen as affecting the working capital management and cash
conversion cycle components.
Compared to other cultural dimensions, uncertainty avoidance seems to have largest impact on
working capital efficiency (Wu, 2016). Related to the avoidance of lack of inventories, the countries
with high uncertainty avoidance seem to be very conservative with their working capital
management policies and prefer large inventories. They also prefer larger investments in working
capital management and cash conversion cycle (Boschker, 2011). Companies from high uncertainty
avoidance countries are expected to use extensive control systems and planning to monitor their
firm’s working capital in terms of inventory levels and account receivables and payables as a goal
to avoid uncertainty (Hofstede, 1994). As companies in high uncertainty avoidance countries aim
for safe choices, the efficiency of cash conversion cycle deteriorates (Wu, 2016). Based on earlier
research on capital structure and culture, and working capital management and culture, in high
uncertainty avoidance countries, higher investments on working capital are expected (Chang, et
al., 2011; Arosa et al., 2015; Chang & Noorbakhsh, 2009; Kearney et al., 2012; Boschker, 2011;
Wu, 2016). This should lead to longer cash conversion cycles in high uncertainty avoidance
countries in comparison to low uncertainty countries. The hypothesis is as following:
Hypothesis 3: There is a positive relationship between high uncertainty avoidance and the length
of the cash conversion cycle.
3.3.4. Masculinity versus Femininity
Whereas Boschker (2011) illustrated a positive correlation between CCC and masculinity, Wu
(2016) illustrates a negative relationship between these two variables stating that companies in
masculine cultures engage in more aggressive working capital management practices. Instead of
aiming for cooperative decision making in terms of firm-client relationships, companies in
masculine environments emphasize performance (Hofstede, 1994) which happens through paying
suppliers later and collecting receivables early, while companies in feminine cultures would behave
in a more relaxed manner (Wu, 2016). Masculine cultures seem to attach high value to material
rewards, performance and competition (Hofstede, 1994), which has proven to be the case in capital
structure literature (Chang, Wee & Yi, 2015). Delaying payments is a way for masculine cultures
to do this (Wu, 2016). According to earlier research (Chang & Noorbakhsh, 2009; Kearney et al.,
2012) on capital structure and masculinity, masculinity relates negatively to short-term debt because
masculine countries hold more cash and they value earnings, challenges and advancement

19
(Hofstede & Hofstede, 2005). Due to aggressive management style in masculine countries, and that
working capital management is more performance driven, masculine countries should have shorter
cash conversion cycles compared to feminine countries (Chang & Noorbakhsh, 2009; Kearney et
al., 2012; Wu, 2016). Therefore, the hypothesis is as following:
Hypothesis 4: There is a negative relationship between masculinity and the length of the cash
conversion cycle.
3.3.5. Long Term versus Short Term Orientation
Companies with long term orientation tend to focus on long term relationships (Hofstede, 2001),
and therefore would be expected to have more relaxed payment terms and therefore an increased
receivable conversion period. This is backed up by evidence from capital structure literature
(Zheng, Ghoul, Guedlhami & Kwok, 2011), which found evidence suggesting that the time
orientation has an impact on debt maturity. Also, time orientation has been deemed to be relevant
and has an impact on debt maturity and capital structure financial decision making (Chang et al.,
2015; Griffin et al., 2009). According to Chang and Noorbakhs, (2009) and on their research on
capital structure and long term orientation relationship, the relation seems to be positive.
The earlier research on working capital management and long term versus short term orientation
dimension, is very limited and no connection was found between cash conversion cycle and time
orientation (Boschker, 2011). Therefore this dimension needs more research in connection to
working capital to either contradict earlier studies or to proof that a connection to working capital
management exists. Based on the earlier research in capital structure literature and the expectation
that long term orientation companies have more flexible payment terms (Chang & Noorbakhs,
2009), long term orientation should lead to longer cash conversion cycle. The following hypothesis
is suggested:
Hypothesis 5: There is a positive relationship between long term orientation and the length of the
cash conversion cycle.
3.3.6. Indulgence versus Restraint
In indulgent societies, managers are more willing to raise their opinions and trust in creating their
own future, in comparison to restraint societies, where the future is experienced to be in the hands
of others (Hofstede Research center, 2016). In the business relationships this could translate into

20
managers’ willingness to experience and go outside of the box. It could be predicted that in
indulgence societies, managers are more willing to try new policies and implement their own
strategies, instead of just following general policies and norms in the society. This could lead to
more adaptable financial decision making and improved working capital management.
This cultural dimension is linked to national culture but also some differences linked to generations
have been found. It seems that generations within countries could behave differently from one
another and that younger generations could be moving towards indulgence. This is happening as
technologization connects the young people to a global network bringing them close to each other.
The young people could be more indulgence oriented compared to earlier generations which could
be seen in their aim for immediate satisfaction and trust in creating their own faith compared to
earlier generations who relied more on communities and societies in determining their future
(Communicaid, 2016).
Added as recently as 2011, this sixth dimension has not yet been widely studied in the context of
financial decision making research. To the authors’ knowledge, no research was found testing the
connection between indulgence and corporate finance. Therefore additional testing is needed to
explore the connection between financial decision-making and this dimension. If in line with other
dimensions, also this cultural dimension should translate into business context and therefore could
be expected to have an impact on financial decision making. As in indulgent cultures, managers
could be more willing to raise their opinions and create their own futures, the decisions should lead
to more efficiently managed working capital. The hypothesis is as following:
Hypothesis 6: There is a negative relationship between indulgence and the length of the cash
conversion cycle.

21
3.3.7. Summary of the Hypotheses
Table 2: Summary of the Hypotheses by Hofstede’s Framework
Hypothesis Cultural Dimension Working Capital Measure Expected Relationship
H1 High Power Distance CCC Positive
H2 Individualism CCC Negative
H3 High Uncertainty Avoidance CCC Positive
H4 Masculinity CCC Negative
H5 Long Term Orientation CCC Positive
H6 Indulgence CCC Negative This table summarizes the hypotheses discussed in the previous sections. The dimensions and connections to working
capital management in terms of cash conversion cycle are presented.
As both the academics (Belt & Smith, 1991; Koralun-Bereznicka, 2014) and practitioners (Sawers,
2012; Ernst & Young, 2009; Sawers, 2012; KPMG, 2010; PwC, 2014) have discussed the
phenomenon, it seems quite obvious that country differences truly exist and that this fact is
generally acknowledged. These differences have even been linked to country characteristics called
practices or operating environment (Sawers, 2012; Danske Bank & Ernst & Young, 2009; Koralun-
Bereznicka, 2014). There is, however, very little research conducted in trying to explain the
connection of these country differences and working capital efficiency. Also there is a lack of
research on country differences by applying cultural frameworks or theories. Also, the complexity
of cultural impact on working capital management practices has not been fully explored (Boschker,
2011 & Wu, 2016). Therefore discussing these themes in depth is of interest.

22
4. Methodology
In this section, the methodology behind the study will be discussed. The research design and
approach are presented. In addition, the basis applied to the regression analysis will be described,
as well as the procedure of collecting and cleaning the chosen data set. The chosen variables will
be presented.
4.1. Research Design
Building on earlier research of cultural procedures, the research is of a deductive nature, aiming to
test an existing theory basing on Hofstede’s framework. Researching the statistical significance of
the phenomenon, will contribute towards understanding the country specific differences of working
capital management practices in a global setting, and explore the impact of culture on this well
known phenomenon. This is important due to the fact that businesses expanding internationally face
challenges to measure and implement financial processes for global settings (Devine et al., 2007).
The challenge is that the world is not homogenous, and same procedures are not adaptable in all
countries (Wu, 2016). Therefore detecting and understanding working capital practices across
countries are an important topic and needs to be studied further.
As the aim of the study is to detect which kind of relationship between national cultural dimensions
and working capital has, the study is therefore of explanatory nature (Saunders et al., 2009). To test
the relationship, a statistical study approach using a quantitative method and secondary data is
chosen. This study is conducted by applying a mono-method approach, in line with earlier research
(Chang et al., 2011; Wu, 2016). This enables us to study the phenomenon in a general cross-country
level, meaning that the results are generalizable to understanding a culture's impact on working
capital practices on an international scale.
Moreover, multiple regression analysis is chosen to study the relationships between the independent
and dependent variables (Wooldridge, 2013) and to explore the impact of culture as presented by
the earlier research (Wu, 2016; Chang et al., 2011). By using secondary data, a large enough sample
can be collected enhancing the reliability and validity of the study. The results can be generalized to
a larger population (Saunders et al., 2009) which is good for the theory testing purposes of this
study. This is beneficial to understanding cultural impact on working capital management on a
general level. By choosing eight differing countries, the results should be applicable to other
countries in terms of if cultural characteristics affect working capital management practices. The

23
study includes eight chosen countries that were chosen based on their differences on cultural
framework (Hofstede et al., 2011). Choosing countries with large cultural differences, highest
possible contrast of national cultures can be presented. As a robustness check, the regression analys
is then repeated by using Schwartz’s framework to study the cultural impact on working capital.
This will enhance the validity and reliability of the study.
Companies were chosen from industrial industries as these industries have shown to have the largest
country differences (Koralun-Bereznicka, 2014). Therefore, these industries are expected to also
illustrate the largest impact of the national characteristics in working capital management. As
industries in general are not the focus of the study, and since there are proven to be large differences
between industries in terms of working capital practices (Koralun-Bereznicka, 2014), this study will
focus on one industry. This should exclude any industry variation from the results and create focus
on the country level aspects that are the focus of this study. Even though this means that the sample
size will be smaller, it is important considering the purpose of the study.
As the purpose of this study is to study the impact, the timeline in this study is the year of 2014 with
most recent accessible data. Using the year 2014 as the time horizon will also increase the
transparency, as manually checking missing values or randomly checking the correctness of the data
is easier with relatively new data. Also the newest possible results on cultural impact in the
phenomenon will be reached through using the latest year available.
4.2. Chosen Variables
In this section the chosen variables of the study will be presented. Firstly, a summary of chosen
variables is provided together with a short overlook into the variables. Secondly, chosen variables
are discussed in detail to illustrate their connection to working capital management.
4.2.1. Dependent and Independent Variables
The chosen variables include both firm-level financial and country-level variables affecting the
working capital management. Cash conversion cycle is used as the measure of working capital and
will therefore be the dependent variable as presented by Deloof (2003), Garcia-Teruel & Martinez-
Solano (2007), Gill, Biger and Mathur (2010), Enqvist et al. (2014) and Yazdanfar and Öhman
(2014). Hofstede’s dimensions will be used as proxies for culture as the independent variables
following the earlier research (Wu, 2016). This is important for comparability and repetition
purposes. As the aim of this paper is to add to the minimal discussion on working capital

24
management and culture connection, value is added by using similar framework as earlier research.
Also Hofstede’s framework has proven timeless and is still applicable in the 21st century, all the
while providing a holistic view on culture.
4.2.1.1. Cash Conversion Cycle – Dependent Variable
As in any other field of finance, and in working capital, there are several ratios that can be used to
assess the financial situation of the company. One of these, the cash conversion cycle is presented
as a measure to company´s liquidity and efficiency of working capital management. The cash
conversion cycle uses working capital components to assess a company's financial efficiency and as
an outcome, shows the number of days on average it will take to transform the invested capital in
production into cash (Deloof, 2003). Gentry, Vaidyanathan and Lee (1990) developed a weighted
cash conversion cycle, which scales the timing by the amount of funds in each step of the cycle
(Vaidyanathan & Lee, 1990). However, this measure cannot be used because not all information
necessary for calculation is available (Deloof, 2003). For comparison and replication purposes, the
cash conversion cycle is used as an approximation for working capital management and will be
included as the dependent variable of this study (Wu, 2016).
The cash conversion cycle is calculated as following:
CCC= Number of days accounts receivable + number of days inventory - number of days accounts
payable (Deloof, 2003)
In which the number of days accounts receivable is calculated as (accounts receivable x 365)/sales,
the number of days inventory as (inventories x 365)/cost of sales and the number of days accounts
payable as (accounts payable x 365)/purchases (Deloof, 2003).
4.2.1.2. National Culture Dimensions - Independent Variables
The cultural dimensions as presented by Hofstede will be used as proxies for culture and as the
independent variables of this study. These dimensions include uncertainty avoidance, individualism
vs collectivism, masculinity vs femininity, power distance, long term orientation vs short term
normative orientation and indulgence vs restraint. Hofstede’s dimensions uncertainty
avoidance, individualism vs collectivism, masculinity vs femininity, power distance and long term
orientation vs short term normative orientation are used as this way as comparable data in contrast
to earlier research (Boschker, 2011: Wu, 2016). Hofstede’s framework has been proven to be
25
suitable for this kind of business settings. Indulgence vs restraint is a new dimension and is used
first time as a variable in working capital management and culture research in this study. Numerical
values for each dimension and respective country will be used as presented by Hofstede (Hofstede
Research Center, 2016).
4.2.2. Control Variables
The control variables are chosen based on the illustrated impact on working capital management
presented by earlier studies. Chosen control variables include: sales growth, total to fixed assets,
debt ratio, quick ratio, company size and cash flow. As these variables have proven to impact the
working capital management density, it is expected that they have explanatory power in terms of
working capital efficiency also in relation to this study. Controlling these factors will add value to
the research by building a model explaining the working capital efficiency. Leaving out these
factors has shown to have an effect which would lead to false modeling and false results.
4.2.2.1. Growth Opportunities
Correlation between growth opportunities, the cash holdings and short-term investments of the
company is shown. Therefore, expected growth opportunity is detected to lead more attention paid
towards the management of capital. In the case of achieved growth opportunities, the behaviour in
terms of credit policy tightens (Hill, Kelly & Highfoeld, 2010). Working capital is at low demand
and there is proven to be a negative correlation with working capital requirements and growth
opportunities (Chiou et al., 2006).
Sales growth as suggested by earlier research (Chiou et al., 2006; Deloof, 2003) will be included as:
sales growth= (current year´s sales- previous year´s sales)/previous year’s sales
4.2.2.2. Debt Ratio
More debt means less capital available for operations. If a firm experiences high debt, firm might
have to rely on external capital. This leads to cautious working capital management practices. With
a higher debt ratio, efficient working capital management is adapted to avoid increasing capital
requirements that could trigger external borrowing. Therefore, there is a negative correlation
between debt ratio and working capital (Chiou et al., 2006).

26
To follow the earlier research (Deloof 2003; Enqvist et al., 2014) and to assess the debt balance of
the company, debt ratio will be used as a control variable and calculated as following:
debt ratio = total liabilities/ total assets
4.2.2.3. Quick Ratio
Quick ratio is a common financial ratio. Quick ratio is the ratio of current assets to current liabilities
excluding inventories. This measurement is used to determine whether the company has enough
current assets to cover its current liabilities and is expected to have an impact on how working
capital is used (Rimo & Panbunyuen, 2010).
To further assess the financial situation of the companies, quick ratio will be used (Rimo &
Panbunyuen, 2010) and calculated as following:
quick ratio = (current assets-inventories)/current liabilities
4.2.2.4. Company Size
Most research finds size to be significant in terms of its impact on working capital. Especially
earlier research seems to emphasize the fact that smaller companies have more restricted access to
capital, therefore it seems that working capital is an important way of gaining financing for their
operations. In contradiction, larger firms seem to have better access to financing and experience less
pressure on working capital efficiency. This could also be due to the fact that larger companies
simply require larger investments in working capital because of larger levels of sales. Larger firms
may also be able to use their size to build better relationships with suppliers. Firms that have a good
access to the capital markets and those with high credit ratings, tend to hold lower ratios of cash to
total non-cash assets (Kieschnick et al., 2006). Pike and Pass (1987) found that among British
companies, there was no large difference between large companies versus medium and small
companies when it comes to working capital and how much that company’s assets are tied to it
(Pike & Pass, 1987). This contradicts Kieschnick et al. (2006) findings.
Medium sized companies that were determined as having annual turnover between ten and fifty
million euros (EU, 2016) were used as the sample for this study. This leaves quite a gap between
large and small medium sized companies and therefore allowing controlled company size. Since
earlier research has presented conflicting results regarding the impact of size on working capital,
company size will be used as a control variable and a either positive or negative relationship will

27
not be expected. The natural logarithm of total assets is used as a measure for company size, as used
by earlier research (Rimo & Panbunyuen, 2010; Deloof, 2003).
4.2.2.5. Cash Flow
The cash flow variable implies a capacity to generate internal financial resources. Mixed results
have been presented regarding the relationship between working capital management and cash
flows. It has been shown that firms with greater cash flows have a longer cash conversion cycle
(Banos-Caballero et al., 2010). However, also contradicting results (Chiou et al., 2006) have been
presented. It is possible that optimization of working capital management minimizes working
capital requirements, leading to an increase in a firm's free cash flow. Due to the contradicting
results from earlier research the study does not expect negative or positive relationship between
cash flow and working capital. To control for this possible impact, cash flow is included as a
control variable and calculated as:
cash flow=(net income + depreciation)/total assets
4.2.2.6. Fixed to Total Assets
Wu (2016) finds a negative relationship between fixed assets and the length of cash conversion
cycle stating that firms with higher fixed assets are more active in their working capital
management (Wu, 2016). Therefore, fixed assets are included as a control variable and calculated
as:
fixed assets/total assets

28
4.3. Summary of the Variables in the Regression Model
Table 3: Summary of the Dependent, Independent and Control Variables
Variable Description Measurement Expected influence to the
Dependent variable
Dependent Variable
Cash conversion cycle
Number of Days Accounts receivable + Number
of Days Inventory - Number of Days Accounts
payable
Independent Variables
Power Distance Hofstede’s power distance index Positive
Individualism Hofstede’s individualism index Negative
Masculinity Hofstede’s masculinity index Negative
Uncertainty avoidance Hofstede’s uncertainty avoidance index Positive
Confucian dynamism Hofstede’s Confucian dynamism index Positive
Indulgence Hofstede’s indulgence index Negative
Control Variables
Cash flow (Net Income + Depreciation)/Total assets Positive/Negative
Sales growth (Current year’s sales – previous year’s
sales)/Previous year’s sales Negative
Debt ratio Total liabilities/Total assets Negative
Quick ratio (Current assets – Inventories)/Current liabilities Positive
Fixed to total assets Fixed/Total Assets Negative
Company size Natural log of total assets Positive/Negative
This table is a summary of the chosen variables to the multiple regression model. The dependent, independent and
control variables are presented. Also the calculations of the measurements and the independent and control variables
expected relationship to the dependent variable are presented.

29
4.4. Collecting the Data
In this section, the collection process of the data is described and the preparation of the data set
prior to data analysis will be discussed. This is done to increase the transparency of the conducted
study.
4.4.1. Data Collection
For the purpose of the analysis, data regarding middle sized companies in the Industrial industry in
Israel, Japan, Sweden, Poland, Canada, Malaysia, Brazil and Italy is gathered. Middle sized
companies refer to companies with annual revenue between 10 and 50 million euros as defined by
the European Union (EU, 2016). Middle sized companies were chosen to minimize the size effect
and its impact on working capital management practices. Industrial industry includes construction,
agriculture, fisheries, foresty and manufacturing companies. Insutrial industry was chosen because
these industries have shown to have the largest country differences (Koralun-Bereznicka, 2014).
In his framework, Hofstede scored countries from 0 to 100 on every dimension. The scores define
cultural behavior in countries giving them a unique position in comparison to one another. For the
purpose of the analysis, data regarding mid-sized companies in Israel, Japan, Sweden, Poland,
Canada, Malaysia, Brazil and Italy will be gathered. These countries were chosen based on
Hofstede’s (2001) cultural area divisions to grasp the widest possible variety of cultures and to
provide an insight into possible differences in countries (appendix 4). Sweden is extremely feminine
(5), whereas Japan is very masculine (95), Malaysia has high power distance (100) whereas Israel’s
power distance is low (13). Poland has high uncertainty avoidance (93) and Sweden has low
uncertainty avoidance (29). Canada is individualistic (80) meanwhile Malaysia is collectivistic (26).
Japan has high score in long-term orientation (88) meanwhile Canada is short-term orientated (36).
Sweden has high indulgence rating (78) and Poland has high restraint score (29) (Hofstede research
center, 2016).
When societies with different ideas, feelings and behavior are handling same problems, in this study
working capital, the differences in dimensions’ scoring play a huge role. In order to have workable
cooperation between countries these differences needs to be understood and adapted (Hofstede,
Hofstede & Minkov, 2011) because countries which present the opposite numbers in the
dimensions have opposing views of standards for measurements and disclosure (Salter &
Niswander, 1995). By choosing culturally diverse sample, the connection between national culture

30
and working capital management can be studied in international settings. The results are
generalizable for other countries when taken that the data regarding the cultural framework is
rightly collected. The national culture measurements were used for all of the observations within
the respective country as presented by earlier research (Chang et al., 2011; Wu, 2016).
The companies representing these countries are chosen at random quota sampling to avoid biases in
company selection, giving each company of the country a likewise possibility to be chosen in the
study (Saunders et al., 2009). Information regarding 1,500 companies in every country was
retrieved. The original sample size consisted of total of 12,000 companies from the eight chosen
countries. After removing companies with any missing data and companies not operating in
industrial industries, there were only 30 companies left in the Brazilian dataset. Therefore, of the
other 7 countries, 30 companies were also randomly chosen. This was done to enhance the fact that
all countries were similarly weighed in the study. This number of companies fulfills the minimum
requirements of the dataset, meaning that the results should be applicable for generalization of the
population (Saunders et al., 2009) and even though ideally the sample size could be larger, this is
the best possible estimate in this study considering the lack of data in the field.
All the data for the variables is gathered from the Thompson Reuters Datastream database, the
World Bank Database or Hofstede’s framework website. The Thompson Reuters Datastream is a
global financial and macroeconomic database covering equities, stock market indices, currencies,
company fundamentals, fixed income securities and key economic indicators for 175 countries and
60 markets. The data is available with up to 50 years coverage and on monthly, quarterly and
annual basis. Data regarding the company specific variables are gathered through Datastream
(Thompson Reuters Datastream: unrivalled, global time series content, n.a.). World Bank provides
information on world economies (World Bank, 2016) and will be used to include country-level
factors in the study. Hofstede’s research center provides cultural evaluation in terms of Hofstede´s
framework for all the studied countries (Hofstede Research Center, 2016).
These sources of data are chosen to provide the most reliable and valid data, in order to do a
comprehensive research on the chosen topic. To have the most consistent and comparable data,
these three sources are most suitable due to the access of data concerning all countries from the
same source. These databases allowed for collecting all the data in the same currency enhancing the
reliability of the results. For this study, all the financial variables were collected in euros
(Thompson Reuters Datastream: unrivalled, global time series content, n.a.). All of the data was

31
collected for the fiscal year 2014 so that the latest information available could be used in the
analysis.
4.4.2. Data Preparation
Firstly, as Saunders et al. (2009) presents the data should be checked for missing values and errors
(Saunders et al., 2009). As the data collected for this study includes thousands of missing data
points and manually checking all of the missing data points would be impossible, this study will
adapt the procedure of earlier research and deal with missing points by removing companies with
complete lack of data (Wu, 2016). To enhance reliability and validity, the data set will be randomly
checked for missing variables from annual reports and match those with the information available in
the database (Saunders et al., 2009).
Secondly, the data will be explored by descriptive statistics to detect general trends and describe the
values of the dataset (Chang et al., 2011). This is in line with earlier research in this field (Wu,
2016; Chang, 2015). Outliers were winsorized at 5 and 95 percentile respectively to minimize the
impact of outlier values on the data set. This was done separately for each country as presented by
earlier research (Wu, 2016). The results of winsorization are presented in appendixes 1 and 2.
4.5. Descriptive Statistics
Means as descriptive statistics for chosen variables are presented in the following summary table 4.
After this the correlation matrix is presented in table 5.
Table 4: The Means of Dependent, Independent and Control Variables
Countries Dependent Independent Control
CCC PDI IDV UAI MAS LTO IND SG DR QR CZ CF FtoTot
Brazil 154,5 69 38 76 49 44 59 -0,17 0,6 1,46 0,13 -0,01 0,27
Canada 51,7 39 80 48 52 36 68 -0,08 0,4 2,25 0,08 -0,04 0,46
Israel 85,98 13 54 81 47 38
-0,05 0,51 1,93 0,07 0,04 0,19
Italy 61,97 50 76 75 70 61 30 -0,06 0,63 1,33 0,06 0 0,23
Japan 65,87 54 46 92 95 88 42 -0,07 0,53 1,64 0,09 0,04 0,24
Malaysia 73,7 100 26 36 50 41 57 0,02 0,51 1,56 0,23 0,05 0,43
Poland 78,96 68 60 93 64 38 29 0,03 0,41 1,41 0,04 0,04 0,47
Sweden 85,54 31 71 29 5 53 78 0 0,41 1,7 0,02 0,04 0,09
This table displays the dependent, independent and control variables values for different countries. The eight countries
are presented in the first column. The dependent variable CCC and independent variables PDI, IDV, UAI, MAS, LTO,
and IND are presented. Also control variables SG, DR, QR, CS, CF and FToTot are introduced.

32
Based on table 4 the average length of cash conversion cycle seems to differ between countries. The
shortest cash conversion cycle is in Canada, where the average cycle is 51.7 days. The longest cycle
is in Brazil, where the average is 154.5 days. Therefore the longest cycle is over three times as long
as the shortest one illustrating large differences in terms of the length of the cash conversion cycle.
As all the companies in the study are from industrial industries, the differences must be caused by
another factor that could be either a country or company level determinant of working capital.
SG ratio ranges from 0.03 in Poland to -0.17 units in Brazil. DR illustrates differences ranging from
0.4 in Canada to 0.63 in Italy. QR ranges from 1.33 units in Italy to 2.25 units in Canada. CZ is in
average largest in Malaysia with the average of 0.23 whereas smallest companies by average are
located in Sweden with an average of 0.02. CF policies show similar trend between countries with
most countries receiving an average score of 0.04 or 0.05. However Canada and Brazil have in
average a negative cash flow. FtoTot ratio is highest in Poland with a score of 0.47 and lowest in
Israel with a score of 0.19. EG ranges from -0.40 in Italy to 5.31 in Malaysia. As there seem to be
notable differences between countries, a regression analysis is used to explore if there really exists a
statistical relationship between the variables.
Table 5: Correlation Matrix
This table displays the correlation between the different variables.
In order to examine the relation between cultural dimensions and the length of cash conversion
cycle a Pearson correlation matrix is conducted in table 5. Based on this table, the correlation
between CCC and PDI is 0.198, CCC and IDV -0.155, CCC and UAI 0.007 and CCC and MAS -
CCC PDI IDV UAI MAS LTO IND SQ DR QR CR CZ CF FtoTot
CCC 1
PDI 0,198** 1
IDV -0,155* -0,645** 1
UAI 0,007* -0,085* -0,080 1
MAS -0,179* 0,265* -0,179** 0,737** 1
LTO -0,113 -0,025 -0,041 0,022** 0,524** 1
IND -0,041 -0,283** 0,028 -0,813** -0,764** -0,280** 1
SQ -0,084*** 0,047 0,023 -0,093 -0,076 -0,063 -0,046 1
DR -0,109 0,066 -0,104 0,105 0,123 0,114 -0,13 -0,072 1
QR 0,156* -0,107 0,065 -0,064 -0,045 -0,058 0,128 -0,043 -0,592** 1
CR 0,183** -0,108 0,085 -0,025 -0,01 -0,034 0,078 -0,073 -0,621** 0,871** 1
CZ 0,262** 0,376** -0,404** -0,148* 0,077 -0,056 0,064 -0,063 0,117 -0,019 -0,037 1
CF 0,007 0,038 -0,144* 0,041 0,001 0,065 -0,075 0,158* -0,289** 0,119 0,168** 0,025 1
FtoTot -0,093 0,266** -0,065 0,032 0,160* -0,211** -0,122 0,0105 -0,045 -0,086 -0,039 0,115 -0,075 1
* Correlation is significant at the 0,01 level (2-tailed),
** Correlation is significant at the 0,05 level (2-tailed),
*** Correlation is significant at the 0,10 level (2-tailed),

33
0.179 at a significant level. When explored individually there seems to be some level of correlation
within these variables. LTO and IND seem not to correlate with CCC at a significant level.
4.6. Regression Analysis
In this section the chosen data analysis method, namely regression model is presented in detail. The
assumptions for using the chosen model are described and the results of the assumptions tests
summarized.
4.6.1 Regression Model
The quantitative data analysis is conducted by using the SPSS statistics program which allows the
examination of relationships between the variables, as well as the comparison between the
countries. Regression analysis is a well-known tool used in empirical work (Wooldridge, 2013).
The most basic regression is a simple linear regression, where a model with one dependent variable,
y, is explained by one independent variable, x. In a multiple regression, the dependent variable is
explained by multiple independent variables (Wooldridge, 2013). Given the hypotheses, a multiple
linear regression will be used for the main analysis. Firstly, the relationship between the national
culture dimensions and cash conversion cycle will be tested (Model 1) after which, secondly, the
relationship will be tested with control variables in the model (Model 2). In accordance with the
hypotheses, the following general models are postulated as:
Model 1) CCCi = 𝛽0+𝛽1𝑃𝐷𝐼𝑖+𝛽2𝐼𝐷𝑉𝑖+𝛽3𝑀𝐴𝑆𝑖+𝛽4𝑈𝐴𝐼𝑖+𝛽5LTO𝑖+𝛽6ICE+𝜀𝑖
Model 2) CCCi = 𝛽0+𝛽1𝑃𝐷𝐼𝑖+𝛽2𝐼𝐷𝑉𝑖+𝛽3𝑀𝐴𝑆𝑖+𝛽4𝑈𝐴𝐼𝑖+𝛽5LTO𝑖+𝛽6ICE+𝐶𝑜𝑛𝑡𝑟𝑜𝑙𝑠i+𝜀𝑖
Where CCC is the dependent variable and refers to the length of cash conversion cycle, 𝛽0 refers to
the intercept which is also known as the constant of the study, 𝛽1𝑃𝐷𝐼𝑖 to 𝛽6ICE refer to the
independent cultural dimensions including 1𝑃𝐷𝐼𝑖 power distance, 𝛽2𝐼𝐷𝑉 individualism versus
collectivism, 𝛽3𝑀𝐴𝑆𝑖 masculinity versus feminism, 𝛽4𝑈𝐴𝐼𝑖 uncertainty avoidance, 𝛽5LTO𝑖 long
term versus short term orientation as well as 𝛽6ICE indulgence versus restraint. The term
𝐶𝑜𝑛𝑡𝑟𝑜𝑙𝑠i refers to the control variables; sales growth, quick ratio, debt ratio, company size, cash
flow, fixed to total assets, economic growth, legal origin and economic freedom included in the
regression analysis and 𝜀 to the error term in the regression model.
A regression model fits a line that coincides with the actual observations as precisely as possible,
using the ordinary least squares (OLS) method. This results in a line where the squared distance

34
from the line to each observation is minimized. The difference between the actual observation and
the value predicted by the model is represented by an error term 𝜀 (Wooldridge, 2013). Using the
OLS model is in line with earlier methods in cash conversion cycle research (Deloof, 2003; Wu,
2016).
4.6.2. Assumptions of Regression Model
To use OLS method, there are some assumptions that need to be fulfilled so that the properties of
the method can be benefitted from (O’brien, 2007). These assumptions include linearity, normality
of residuals, heteroskedasticity, autocorrelation, independency of observations and multicollinearity
(Burke & Term, 2010).
4.6.2.1. Linearity
To fill the requirements of OLS method the data needs to be in linear parameters. This means that
there must exist a linear relationship between the independent and dependent variables. Violation of
linear parameters means that the OLS method might not be the best method for the data set and the
results might be biased (Burke & Term, 2010). The linearity is tested through visualization of the
dataset (Wooldridge, 2013). Based on these results (appendix 3), it is concluded that the data sets
shows linear trends. Depending on the independent variable, the relation is negative or positive. The
assumption of linearity is therefore supported.
4.6.2.2. Normality of Residuals
To avoid biases in the results, the residuals need to be normally distributed (Burke & Term,
2010). Testing is done through a visual presentation (appendix 3), which illustrates a slight
violation of normality of residuals assumptions. However, the residuals are close to normal
distribution. Considering that there are only few phenomenon in the world that purely follow the
normal distribution (Burke & Term, 2010), and therefore, this result does not hinder this research
from testing an OLS regression. However, reading must be cautious into the confidence intervals of
the results (Burke & Term, 2010). The normality of residuals is due to the lack of pure normality,
illustrated in the appendix 3, to highlight the fact that the residuals almost follow the normal
distribution.

35
4.6.2.3. Heteroskedasticity
Heteroskedacity versus homoskedacity refers to the constant or nonconstant variance of residuals.
When the residuals have a constant variance, they illustrate a homogenous variance, which is ideal
for OLS method. If heterogenous trends exist, the assumptions would not be filled. The results of
the regression analysis could be biased (Burke & Term, 2010). In the data set of this study
(appendix 3), the residuals illustrate homoskedasticity in terms of visual illustration (Woodridge,
2013) and therefore the assumption is not violated.
4.6.2.4. Independency of Observations
Taken that the data is a random sample of the population the data should be statistically
independent/uncorrelated from each other (Burke & Term, 2010: 3). In this study, on the country
level observations are dependant to each other referring to the cultural dimension measurements
(Hofstede et al., 2011) and to the country level control variables. This violates against the
independent observation assumption. A Similar method has been successfully illustrated by earlier
research, as it is noted that country level variables logically are the same to all the companies within
the country as they represent the country conditions that are the same for all the companies
operating in the country (Chang et al., 2015; Wu, 2016). As the method has been seen suitable by
the academy and earlier research, there is no reason why violation of this assumption should hinder
the results of the regression model in this study.
4.6.2.5. Multicollinearity
When multicollinearity exists, the variables are strongly collinear meaning that they correlate with
each other (Burke & Term, 2010). To explore the level of multicollinearity in the dataset, the
Variance Inflation Test is used. The results should not exceed over 5 in order for multicollinearity
to be at an acceptable level (O´Brien, 2007).
There seems to be high multicollinearity between some of the variables because the variance
inflation factor (VIF) is more than 10. Therefore the independent assumptions of the multiple
regression results can be violated (Burns & Bush, 2003: 567). Due to the high level of VIF in some
of the variables, the variables needed to be adjusted. Power distance had high level of
multicollinearity with other independent variables and was therefore excluded from the final

36
multiple regression model. After removal of the above mentioned variable, the variance inflation
test values are below 5 and are therefore at an acceptable level.
4.6.3. Summary of the Assumptions Tests
After adjusting the variables due to multicollinearity, the assumptions are met on a sufficient level
that enables the use of OLS-regression with confidence on the results. This means that analysis
using the OLS method and multiple linear regression analysis can be conducted to explore the
relationship between culture and working capital management. The results of the regression
analysis are according to the assumption tests reliable. However, the slight variance from normal
distribution could have an impact on the confidence levels of the results. For detailed results of
assumptions tests, see appendix 3.

37
5. Results
In this section the results are presented and discussed. First, the results related to the testing of the
six hypotheses are presented. Secondly, these results are presented in line with each other, and the
applicability and limitations of the results are discussed.
5.1. Multiple Regression without Control Variables
When conducting the multiple linear regression on the full sample, the independent variables;
individualism, uncertainty avoidance, masculinity, LTO, indulgence are regressed on CCC without
control variables.
Large error rate 0,10 should be used when the sample size is relatively small because when the
sample size is small even the large differences may not reach the predetermined level (Morrison &
Henkel, 2006; Bowerman & O’Connell, 2003). By using the 0,10 significance level this research
accepts the null when p≥ 0,10, and when p≤ 0,01 it is rejected (Rosenthal, 2012).
5.1.1. Interpreting the Independent Variables
Table 5: Results without Control Variables
Model Standardized Coefficients t Sig.
Beta
1 (Constant) 0,627 0,531
IDV -0,151** -2,13 0,034
UAI 0,338** 2,566 0,011
MAS -0,249*** -1,851 0,066
LTO -0,026 -0,313 0,755
IND 0,132 1,024 0,307
ANOVA 0,041 * Correlation is significant at the 0,01 level (2-tailed),
** Correlation is significant at the 0,05 level (2-tailed),
*** Correlation is significant at the 0,10 level (2-tailed).
This table displays the results for the multiple regression model without control variables, where CCC is the dependent
variable. In the first column independent variables are presented. The table also presents the coefficients, standard error,
p-value and the ANOVA-test results.
According to ANOVA-test this multiple linear regression is statistically significant at 10% level in
table 5. Individualism, uncertainty avoidance and masculinity are statistically significant at a 10%
level. The Beta-value of individualism is -0,151, meaning that each cultural dimension’s point
increase in individualism leads to a 0,151 days decrease in predicted CCC with other variables held

38
constant. The Beta-value of uncertainty avoidance is 0,338, meaning that each cultural dimension’s
point increase in uncertainty avoidance leads to a 0,338 days increase in predicted CCC with other
variables held constant. The Beta-value of masculinity is -0,249, meaning that each cultural
dimension’s point increase in masculinity leads to a 0,249 days decrease in predicted CCC with
other variables held constant. Due to the fact that power distance was excluded from the
independent variables in because of high multicollinearity, the hypothesis 1 could not be verified
with the multiple regression results.
5.2. Multiple Regression with Control Variables
When conducting the multiple linear regression on the full sample, the individualism, uncertainty
avoidance, masculinity, LTO, indulgence and control variables (sales growth, quick ratio, debt
ratio, company size, cash flow, fixed to total assets) are regressed on CCC.
Based on the multiple regression model results control variables excluded (table 5), and the multiple
regression results where the control variables were icluded (table 6), it is shown that cultural
dimensions influence the length of cash conversion cycle but also other factors, namely control
variables, seem to have an impact changing the explanatory power of the independent variables in
relation to the dependant variable.

39
5.2.1. Interpreting the Independent Variables
Table 6: Results on the Multiple Regression with Control Variables
Model Standardized Coefficients t Sig.
Beta
2 (Constant) 1,218 0,224
IDV -0,129*** -1,704 0,090
UAI 0,360* 2,678 0,008
MAS -0,253*** -1,773 0,078
LTO -0,078 -0,875 0,383
IND 0,056 0,426 0,670
SG -0,060 -0,877 0,382
DB -0,141 -1,620 0,107
QB 0,103 1,264 0,208
CS 0,161** 2,072 0,040
CF -0,055 -0,753 0,452
FtoTot -0,227** -3,053 0,003
ANOVA 0,000
Adjusted R-Square 0,108
* Correlation is significant at the 0,01 level (2-tailed),
** Correlation is significant at the 0,05 level (2-tailed),
*** Correlation is significant at the 0,10 level (2-tailed).
This table displays the results for the multiple regression model with control variables, where CCC is the dependent
variable. In the first column the independent and control variables are presented. The table presents the coefficients,
standard error, p-value and the ANOVA-test results. The adjusted R-Square is also presented in order to show how
much the variation in the dependent variable is explained by the independent variables.
According to the ANOVA-test in table 6 this multiple linear regression is statistically significant at
10 % level. The adjusted R2 is 0,108 implying that 11 % of the variation in CCC, is explained by
the variables.
In table 6, the final multiple regression results, the p-value of individualism is 0,090, uncertainty
avoidance 0,008 and masculinity 0,078. These variables are statistically significant at the 10% level.
The research on the full sample, shows that the prediction following the earlier research made by
Boschker (2011) and Wu (2016), namely that cultural dimensions influence to working capital
management, does not seem to hold in practice for all of the Hofstede’s cultural dimensions. As the
results show a clear connection between all of the Hofstede’s six dimensions and the data in this
study cannot be uncovered. Therefore, the hypotheses 5 and 6 are rejected LTO and indulgence

40
have influence to CCC. The hypotheses concern the relationship of the cultural dimensions and
CCC, whether the relationship is positive or negative, but because the results were statistically
insignificant, the direction of the relationship could not be confirmed. Due to the fact that power
distance was excluded from the independent variables, the hypothesis 1 could not be verified with
the multiple regression results.
The hypothesis 2 assumed that the relationship between individualism and CCC is negative, and
this hypothesis is supported because the Beta-value of individualism is -0,129, meaning that each
cultural dimension’s point increase in individualism leads to a 0,129 days decrease in predicted
CCC with other variables held constant. The hypothesis 3 assumed that the relationship between
uncertainty avoidance and CCC is positive. This hypothesis is supported because the Beta-value for
uncertainty avoidance is 0,360, meaning that each cultural dimension’s point increase in uncertainty
avoidance leads to a 0,360 days increase in predicted CCC with other variables held constant.
Finally, the hypothesis 4 assumed that the relationship between masculinity and CCC is negative.
This hypothesis is also supported because the Beta-value for masculinity is -0,253 meaning that
each cultural dimension’s point increase in masculinity leads to a 0,253 days decrease in predicted
CCC with other variables held constant.
5.2.2. Interpreting the Control Variables
In table 6 the p-value for company size is 0,040 and fixed to total assets 0,003, and therefore they
were significant at 10% level. Hence these control variables have an influence to CCC. The Beta-
value of company size is 0,161, meaning that for each euro increase in company size leads to a
0,161 days increase in predicted CCC with other variables held constant. The Beta-value of fixed to
total assets is -0,227 meaning that for each euro increase in fixed to total assets leads to a 0,227
days decrease in predicted CCC with other variables held constant.
5.3. Discussing the Insignificance and Limitations of the Results
Statistically insignificant results can be a consequence of faulty assumptions. However, as tested in
appendix 3 this should not be the reason. Another reason might be that the model is wrong, simply
because the tested relationship is too weak to detect or that our model is too simple (Wooldridge,
2013). LTO and indulgence have the weakest Beta-value in table 6, meaning that they have the
weakest influence to the predicted CCC.

41
There might be several explanations for the findings. First, if it is assumed that cultural dimensions
in fact have an effect on the CCC, the cultural dimensions most likely are not so strongly
influencing CCC. There might be several factors that support the cultural dimensions influence to
CCC and the research may not have taken into consideration all of the factors in control variables.
Also, the control variables may be false, and with another control variable, the results may have
been significant for the cultural dimensions that now received an insignificant result. This is a
limitation with the simple framework, and could be addressed in future research.
Due to a large amount of missing data, this study included testing with only eight countries.
Similarly, the tests should be repeated with other industries. Testing the model with an alternative
data set from another source could be beneficial, which could also be addressed in further studies.
5.4. Summary of the Results
This table illustrates the hypotheses and whether the results of this study were significant and
supported the presented hypotheses. The hypotheses 2, 3 and 4 were significant and supported.
Meanwhile, the hypotheses 5 and 6 were insignificant.
Table 7: Summary of the Results of the Hypotheses
Hypotheses The Result Relationship
Supported
H2: There is a negative relationship between individualism and
the length of the cash conversion cycle.
Significant Yes
H3: There is a positive relationship between high uncertainty
avoidance and the length of the cash conversion cycle.
Significant Yes
H4: There is a negative relationship between masculinity and
the length of the cash conversion cycle.
Significant Yes
H5: There is a positive relationship between long term
orientation and the length of the cash conversion cycle.
Insignificant
H6: There is a negative relationship between indulgence and
the length of the cash conversion cycle.
Insignificant
This table displays the summary of the results for the hypotheses. The hypotheses are presented. Also the results from
the multiple regression model and whether the relationship was supported.

42
6. Analysis
Given the hypothesis and data material, the analysis concentrates firstly on national cultures
influence to working capital management practices. Then the section further discusses Hofstede’s
dimensions influence to working capital management practices. Lastly, control variables influence
to working capital management practices and the differences to earlier research’s results are
discussed.
6.1. National Culture as a Determinant Factor
Based on the results, national culture impacts working capital management practices, as Hypotheses
2, 3 and 4 were supported. However, results regarding hypotheses 5 and 6 were insignificant, and
due to multi-correlation, no results regarding hypothesis 1 could be concluded. The above
mentioned findings will be further discussed in the analysis section.
According the multiple regression results, uncertainty avoidance is the strongest influencer to the
length of cash conversion cycle, followed by masculinity versus femininity, fixed to total assets and
company size and lastly individualism versus collectivism. These results indicate that country level
factors have overall a larger impact on working capital practices than company specific factors.
This is in line with Koralun-Bereznicka (2014) who found that country factors were the largest
influencer in working capital management density. The country factor has been connected to
national culture practices or operating environments (Sawers 2012; Danske Bank & Ernst & Young,
2009; Koralun-Bereznicka, 2014) affecting the financial decision making which was supported by
the significant results of this study. The impact was found to be in line with earlier capital structure
literature (Stonehill & Snizel, 1969; Collins & Sekely, 1988; Chui et al., 2002; Chang et al., 2011;
Griffin et al., 2009; Ramirez & Tadesse, 2007) proving the connection between national culture and
finance practices.
National culture seems to be an important contributor towards choosing working capital practices
that yields shorter cash conversion cycle and improved company performance. As shorter CCC is
connected to improve company performance (Deloof, 2003; Vishnani & Bhypesh, 2007; Garcia-
Teruel & Martinez-Solano, 2007; Falope & Ajilore, 2009; Enqvist et al., 2014; Yazdanfar &
Öhman, 2014), the companies that are score high in masculinity, and companies that rate high in
individualism and low in uncertainty avoidance, seem to yield shorter conversion cycles. Therefore
it can be possible that the companies operating in countries with above mentioned national cultural

43
characteristics can experience a better performance yielded from working capital management
efficiency.
6.2. Individualism versus Collectivism – Importance of Freedom
There is a negative relationship between individualism versus collectivism and the length of the
cash conversion cycle with a beta-value of -0,129. The hypothesis 2 was therefore supported. This
means that companies in high individualism countries tend to have a shorter cash conversion cycle
compared to companies in collectivist countries. The findings are in line with Wu (2016) who found
a negative relationship between individualism and the cash conversion cycle. Meanwhile, Boschker
(2011) did not find a statistically significant correlation between individualism and cash conversion
cycle.
People in individualistic countries tend to be overconfident and they do not avoid conflicts. This can
lead to inflexible payment terms because most probably the leaders in individualistic countries do
not feel a need to support other companies. Companies in individualistic countries tend to pay their
customer as late as possible (Boschker, 2011) and shorter collection period (Wu, 2016).
Individualistic countries’ leaders are not afraid of conflicts in order to have best-fit solutions for
themself (Wu, 2016). They prefer individualism freedom and self-actualization and the connection
to groups are looser in terms of business relationships compared to collectivism countries (Hofstede
et al., 2011). Individualistic countries do not efficiently take care of the business relationships with
their cooperative companies because they do not have strong group feelings towards their customers
(Hofstede, 1994) and will adjust the payment terms for their own best which will most probably
lead to more effective working capital.
Individualist countries may have lack of an effective leadership control system and therefore their
leadership style can lead to substantial errors because nobody is calling into question the leaders’
decisions or performance. However, individualistic countries leadership style can lead to better
control over cash conversion cycle and therefore shorter CCC. Whereas in collectivist countries the
decision making relies on group (Hofstede et al., 2011) and can therefore be slow and inefficient
which is in line with the results of this study. In terms of working capital individualistic countries
are more efficient in working capital due to freedom of pressure in business relationships. This
enables them to follow their own practices instead of those of the business network. Therefore
companies can achieve best-fit practices suitable for themselves. This again makes countries that
are more individualistic more efficient in working capital management practices.

44
6.3. Uncertainty avoidance - Flexibility of Ideas
There is a positive relationship between uncertainty avoidance and the length of cash conversion
cycle with a beta-value of 0,360. The hypothesis 3 was therefore supported. This means that
companies in high uncertainty avoidance tend to have higher cash conversion cycle compared to
companies in low uncertainty avoidance countries. The findings are in line with Boscher (2011) and
Wu (2016) who also found a positive relationship between uncertainty avoidance and cash
conversion cycle.
When comparing to other cultural dimension and control variables, uncertainty avoidance seems to
have strongest influence to cash conversion cycle (Wu, 2016). In the multiple regression results
uncertainty avoidance had highest beta-value compared to other variables. Therefore, also
according to this study the relationship between uncertainty avoidance and cash conversion cycle is
strong. The reasons behind this strong relationship can be as following.
Companies in high uncertainty avoidance countries tend to hold large inventories and prefer large
investments in working capital (Boschker, 2011). In order to avoid uncertainty companies prefer
control systems and they want to be able to monitor the working capital components closely
(Hofstede, 1994). With the aim to safe choices (Wu, 2016) the efficiency of cash conversion cycle
may suffer. Companies in high uncertainty avoidance countries do not prefer taking risks and avoid
unknown situations. They prefer harmony and peculiar behavior is not accepted (Hofstede et al.,
2011).
In terms of working capital, low uncertainty avoidance countries seem to perform better. This is
most probably because companies in these countries are not afraid of uncertainty and therefore have
the courage to develop and implement new working capital management practices. Also, companies
are more flexible in their financial decision making processes meaning that they are able to make
more dynamic decisions and adapt to changing environment. This may lead to improved, shorter
cash conversion cycles and improved overall performance of the company.
6.4. Masculinity versus Femininity - Driven by Performance
There is a negative relationship between masculinity versus femininity and the length of the cash
conversion cycle with a beta-value of -0,253. The hypothesis 4 was therefore supported. This means
that companies in masculine countries with high score in this dimension tend to have a lower cash
conversion cycle compared with companies operating in more feminine countries with a low score

45
in this dimension. The findings are in line with Wu (2016) who also found a negative relationship
between cash conversion cycle and masculinity versus femininity. However, both the results of this
study and Wu (2016) were contradicting with the findings of Boschker (2011) who found a positive
relationship.
Masculine cultures emphasize harder value sets compared to feminine culture which are more
nurturing also in business relationships (Hofstede, 1994). As the focus on masculine countries is on
results and performance, and the business relationships contain less focus on the wellbeing of the
other actor in the relationship (Hofstede et al., 2011). Companies therefore use more power
bargaining in their relationship and aim for fast and performance concentrated results (Wu, 2016).
Engaging in this kind of behavior seems to pay off. It seems that companies in masculine countries
enhance the importance of performance (Hofstede, 1994). Therefore also the management style in
masculine countries seems to be more aggressive than in feminine cultures (Wu, 2016). Most
probably because of the fact that companies in masculine countries engage in more aggressive
practices and enhance performance the companies have tighter payment terms (Wu, 2016). The
decision makers trust their own skills.
The aim of the managers in masculine countries seems to be in maximizing the company’s own
results and payment terms leading often to a shorter cash conversion cycle rather than focusing on
the wellbeing of other partners in the relationship. Other companies are usually seen rather as a
competition than as a support for each other. Achieving the most beneficial solution to your own
company instead of thinking others is favored. This then again contributes most probably towards
more efficient cash conversion cycle, which has been linked to better overall company performance
(Deloof, 2003: Vishnani & Bhypesh, 2007; Garcia-Teruel & Martinez-Solano, 2007; Falope &
Ajilore, 2009). Therefore it seems that companies in masculine countries contribute towards
developing more efficient working capital management practices compared to companies in
feminine countries.
6.5. Long Term versus Short Term Orientation- Focus of Short Term Finance
There is an insignificant relationship between the long term versus short term orientation and the
length of the cash conversion cycle. Therefore, the hypothesis 5 was rejected. Similar to Boschker
(2011) no statistically significant results were found regarding this dimension. This is contradicting
to earlier research in capital structure literature (Zheng et al., 2011; Chang et al., 2015; Griffin et al.,

46
2009) which found a statistically significant relationship. Wu (2016) did not study the impact of this
dimension on working capital management.
It could be that the time orientation does not play a significant role because working capital
management and the discussion of its connection to culture refers to short term assets management
and usage. Working capital management and cash conversion cycle periods aim for relatively short
cycles compared to other instruments and financial elements. Therefore, the impact of time
orientation on this dimension could be different than when investigating its connection to financial
elements that are applicable for longer time periods.
It could be that the differences between countries ratings on this dimension are more vivid when
studying longer term financial instruments with more constant behavioral patterns. This would be in
line with the fact that research in capital structure literature has found significant connection
between long versus short time orientation and capital structure related financial decision making
(Zheng et al., 2011; Chang et al., 2015; Griffin et al., 2009).
6.6. Indulgence versus Restraint – Change of Behavior
There was an insignificant relationship between indulgence versus restraint dimension and the
length of the cash conversion cycle. Therefore the hypothesis 6 was rejected. The dimension has
been introduced only recently and lacks research in business settings. Therefore also its connections
to financial decision making and working capital management were unclear and needs more
research.
According to Hofstede’s research center (2016), in indulgence societies, managers are more willing
to raise their opinions and trust in creating their own future in comparison to restraint cultures
societies, where the future is experienced to be in the hands of others (Hofstede Research center,
2016). The effects of this kind of behavior on working capital management could not be detected. It
could be that the dimension has a stronger connection to individual behavior and that the impact on
organizational culture and decision making processes within the company are not that strong. This
is because perhaps the company culture is not very easily changing according to the indulgence
versus restraint orientation of the employees.
Also, it could be that globalization and technologization change the attitudes of indulgence versus
restraint behavior (Communicaid, 2016). If that would be the case it could be that individuals would
rate on these dimensions differently depending on their age group. Young people that are more used

47
to having an instant reward would rate more towards indulgence than older age groups. On business
level this would mean a large variation of people’s rating on this scale even within the company.
This would impact the country level results as well and therefore the no significant patterns could
be detected in this study.
6.7. Power distance - Tying Culture Dimensions Together
Power distance was excluded from the multiple regression model due to multi-correlation with
other individual variables. Therefore, the hypothesis 1 could not been verified.
It seems that power distance multi-correlates with other dimensions more than other dimensions.
High power distance can be closely linked to high uncertainty avoidance because of the acceptance
that one group of people has the power and are able to reduce uncertainty. In contrast, masculinity
countries in high power distance countries have an authoritative and centralized leadership style
(Hofstede et al., 2011). Restrain countries are closely linked to high power distance countries with
tight control and strict regulations, (Hofstede Research center, 2016) while collectivism societies
have more acceptance to tight control (Devine et al., 2007). Short-term orientation is closely
connected to high power distance countries because the respect for traditions (Hofstede, 1994).
These closely linked connections between the dimensions can be one reason behind the removal of
power distance from the multiple regression model. Power distance was strongly correlated with
other dimensions and therefore power distance can be seen as an umbrella which connects all the
dimensions together. Power distance as a umbrella defines people’s behavior in financial decision
making by linking all the dimensions together. This role as a connector is crucial because culture
according to Hofstede (2001) is a holistic phenomenon and the dimensions are meant to
complement one another and should not be used individually. Without the umbrella role there
would not be a one single phenomenon called culture. Culture can be seen as a unique combination
of national characteristics.
6.8. Impact of Control Variables
Control variables were included in the model to create the best possible model to investigate the
determinants of cash conversion cycle. Company size and fixed to total assets were significant
factors impacting cash conversion cycle. Company size has a positive relationship with the length

48
of cash conversion cycle whereas fixed to total assets has a negative relationship with the length of
cash conversion cycle.
Regarding company size, even among middle sized companies as in this study, clear patterns
emerged. In line with earlier research (Kieschnick et al., 2006), it seems that larger companies have
a better access to outside capital compared to smaller companies and therefore they can afford more
easily than smaller companies to be more inefficient with their working capital instruments which
lead to a longer cash conversion cycle period. Similarly, smaller companies should be more
efficient with their working capital practices as they do not have similar access to additional capital
as larger companies (Kieschnick et al., 2006).
Fixed to total assets was also in line with earlier research in finding a negative relationship between
the fixed to total assets ratio and the length of the cash conversion cycle (Wu, 2016). It could be that
companies that have higher amount of fixed assets are less flexible in their operations and therefore
are less lean in their working capital management practices. This may lead to a longer cash
conversion cycle whereas companies that have a lower fixed assets ratio, are more flexible in their
working capital practices and therefore have a shorter cash conversion cycle period.
The other control variables did not provide any significant results in the model even though earlier
research had found significant relationships. Because of earlier research results, these variables
were included in this study. Reasons for insignificant results in this study could be that as additional
explanatory factors were added to the model compared to those of earlier research, factors that
earlier had been found to have a connection to working capital management practices did not
illustrate a similar trend in this study.
6.9. Comparision of National Culture Impact to the Earlier Research
Compared to earlier research made by Boschker (2011) and Wu (2016) there were differences in the
significance of variables. One reason behind the differences in the results might be the time period
used in the studies. Earlier studies used time periods 2006-2009 (Boschker, 2011) and 1998-2010
(Wu, 2016) while this study utilized data from 2014. When going looking deeper to at the time
periods of earlier researches there seems to be one determinant that has had influence to world
economy, meaning financial crisis in 2008. The financial crisis raised the interest of working capital
among researchers due to decreased financial resources (Deloof, 2003; Vishnani & Bhypesh, 2007;
Garcia-Teruel & Martinez-Solano, 2007; Falope & Ajilore, 2009). Most probably the influence of
financial crisis to working capital behavior made this study different from previous research.

49
Another reason for different results between this study and earlier research (Boschker, 2011; Wu,
2016) can be the newer the data used in this study and due to globalization’s influence to on cultural
differences, and made different cultures more identical. Culture changes slowly (Leung, et al.,
2005) but nevertheless there can be possibility that countries have had influence from other
countries. Based on these ideas, culture seems to be a complex phenomenon. Therefore
understanding how national cultures impact each other and business environment in an international
context is important.

50
7. Robustness Check
To ensure the validity of the study, robustness of the results is controlled. As mentioned, Hofstede’s
dimensions were used as cultural proxies in the study. By rather controlling for different measures
of culture, equivalent results would imply that the findings seem robust. It was therefore chosen to
control for Schwartz’ dimensions as a measure of culture. According to Schwartz (1994) Hofstede’s
framework is included in Schwartz’s framework.
As the regression output shows below, the coefficients are similar to the results of Hofstede’s
dimensions, that all of the dimensions are not statistically significant at the 10% level but when the
dimensions are significant they have strong influence to CCC. Similarly, some of the variables were
multi-correlating and therefore excluded from the multiple regression results. Also similarly,
country level control variables and mastery, one of the independent variables, were multi-
correlating and therefore excluded from the multiple regression results. It can be concluded that
culture has influence to working capital. This is equivalent to our findings in table 10 and supports
the use of Hofstede’s framework for this study.
Table 7: The Multiple Regression Results with Schwartz’s Framework
Model Standardized Coefficients t Sig.
Beta
3 (Constant) 3,394 0,001
Conservatism -0,666* -3,530 0,001
Hierarchy -0,275*** -1,715 0,088
Harmony -0,376 -1,621 0,107
Intellectual Autonomy -0,529* -4,395 0,000
Egalitarian Commitment 0,185 1,078 0,283
SG -0,049 -0,670 0,504
DR -0,220** -2,420 0,017
QR 0,039 0,465 0,643
CS 0,228** 2,983 0,003
CF 0,019 0,262 0,793
FtoTot -0,122*** -1,673 0,096
* Correlation is significant at the 0,01 level (2-tailed),
** Correlation is significant at the 0,05 level (2-tailed),
*** Correlation is significant at the 0,10 level (2-tailed),
This table displays the results for the multiple regression model with Schwartz’s framework, where cash
conversion cycle is the dependent variable. In the first column the independent and control variables are
presented. The table presents the coefficients, standard error and p-value.

51
8. Conclusion
The purpose of this study is to examine how national culture impacts on working capital practices to
efficiency. Previous research on national cultural frameworks suggests a strong correlation between
financial decision making practic, and national culture. However, the relationship in connection to
working capital management has been limited to two previous studies (Boschker, 2011; Wu, 2016)
which had contradicting results.
To add on to the existing research in the fields of working capital management and financial
cultural research, in this paper, the connection between national culture and working capital
management efficiency was researched by using Hofstede’s cultural framework (1983; 1994). The
hypotheses were based on six cultural dimensions and their influence on the working capital
measurement cash conversion cycle. Exploring the phenomenon, data regarding eight culturally
different countries was collected through Thompson Reuters Datastream, Worldbank and
Hofstede’s research center databases. A multiple regression model was then tested to detect
significant trends in the relation of national culture dimensions and working capital efficiency,
namely the cash conversion cycle.
The results illustrate a significant relationship between Hofstede’s dimensions; masculinity versus
femininity, uncertainty avoidance and individualism versus collectivism, and the length of the cash
conversion cycle (Hofstede, 1983; 1994). The results are in line with previous research by
confirming that national cultural impacts on working capital practices and efficiency. It seems that
companies in some countries are more prone to have a shorter cash conversion cycle, which has
been illustrated to contribute towards improved company performance. Therefore, it seems that
companies in especially masculine countries with their performance driven management, and
individualistic countries’ freedom of business relationships as well as low uncertainty avoidance
countries with their flexibility of ideas contribute towards developing and implementing efficient
working capital management practices. Long term versus short term time orientation and
indulgence versus restraint, did not illustrate a significant relationship. The power distance
dimension was multi-correlating with other aspects and no conclusions could be drawn regarding
this dimension.
This is of interest especially to managers and companies operating in an international business
environment, as managers need to understand the differences of working capital practices shaped by
national culture. This is important as markets are not homogenous and national culture explains

52
part of these differences (Wu, 2016). Taking these possible differences into consideration is vital as
it could be that similar practices are not applicable in every market. This is seen in differences in
days accounts payables, receivables and inventories between countries (Ernst & Young & Danske
Bank, 2014). Differences in these practices have a straight connection to working capital
efficiency. Therefore, understanding the cultural impact behind the country’s differences could help
to develop and implement more effective and customized working capital practices for respective
countries.
This is important especially when expanding to a new country. It is vital to understand how
differently this country’s market operates and what the working capital management practices in
this exact country are. In the pressure between the local and parent company practices, emphasizing
the importance of local culture in terms of how working capital is managed is important for the
everyday operations of the company.

53
9. Suggestions for Further Research
This study focused on exploring the relationship between national culture and working capital
practices in normal economic conditions. To add to this research and address the discussed
hypotheses, the following suggestions for further research are given.
Firstly, as working capital management practices and the cash conversion cycle have been
suggested to change according to economic situation in a country, a study comparing different time
periods could be conducted. This way economic fluctuations could be included in the model and it
could be discovered whether or not this could impact the differing results between this study and the
earlier studies conducted in the field.
Secondly, as this study focused on testing the theoretical framework with mid-size companies from
industrial industries, further research could be conducted to study additional industries. Additionally
it was researched if small or large companies behave differently compared to mid-size companies in
terms of working capital management and cultural impact.
Thirdly, this study focused on national cultural impact on working capital practices. Further studies
should focus on investigating the impact of organizational culture versus national culture on
company's working capital practices when operating in an international business environment. The
focus could be on detemining how strongly parent company’s organizational culture influences over
the operating country’s national culture.
Lastly, as the model in this study did not manage to explain all the variation in the cash conversion
cycle, further research of cash conversion cycle determinants should be conducted to gain a deeper
understanding of the complex phenomenon. Understanding the phenomenon as a whole, would lead
to better financial modelling and improved working capital management practices.

54
9. References
Antonczyk, R. & Salzmann, A. 2014. “Overconfidence and optimism: The effect of national culture
on capital structure”, Research in International Business and Finance, vol. 31, pp. 132-151.
Arosa, C., Richie, N. and Schuhmann, P. 2015. “The impact of culture on market timing in capital
structure choices”, Research in International Business and Finance, vol. 35, pp. 180-196.
Banos-Caballero, S., Garcia-Teruel, P. and Martinez-Solano, P. 2014. “Working Capital
Management, Corporate Performance and Financial Constraints”, Journal of Business
Research, 67, pp. 332-338.
Baños-Caballero, S., García-Teruel, P., and Martínez-Solano, P., 2010. “Working capital
management in SMEs”, Accounting and Finance, vol. 50, pp. 511–527.
Belt and Smith. 1991. “Comparison of Working Capital Management practices in Australia and
United States”, Working Paper
Boschker, B. 2011. Determinants of Working Capital Management in SMEs: National Culture, a
Missing Piece?. Retrieved February 29, 2016, from http://arno.uvt.nl/show.cgi?fid=127697
Bowerman, B.L. & O’Connell, R.T. 2003. “Business Statistics in Practice”, McGraw-Hill/Irwin.
Burke, O. and Term, M., 2010, More Notes for Least Square. Department of Oxford OX1 3TG.
Retrieved March 23, 2016, from
http://www.stats.ox.ac.uk/~tomas/html_links/LMLSnotes.pdf
Burns, A. and Bush, R. 2003. Marketing Research, Online research applications. Prentice Hall.
Chang, K and Noorbakhsh, A. 2009. “Does national culture affect international corporate cash
holdings?”, Journal of Multinational Financial Management 19, pp. 323–342.
Chang, K., Wee, J-B., and Yi, H-C. 2011 Does national culture influence the firm’s choice of debt
maturity?. Retrieved February 29, 2016, from
http://www.apjfs.org/conference/2011/cafmFile/9-1.pdf
Chiou, J., Cheng, L. and Wu, H. 2006. “The Determinants of Working Capital Management”.
Journal of American Academy of Business, vol. 10, no. 1, pp. 149.

55
Chiou,. Chui, L., and Kowak, C. 2002. “The determination of Capital Structure: Is national culture
a missing piece to the puzzle?”, Journal of International Business Studies, vol 33, no 1, pp.
99-127.
Chui, C. W., Lloyd, A. E., & Kwock, C. C. Y. 2002. “The determination of capital structure: Is
national culture a missing piece to the puzzle?”, Journal of International Business Studies, no.
33, pp. 99-127.
Collins, W.S. & Sekely, M. J. 1988. “Cultural influences on international capital structure”, Journal
of International Business Studies, no 19, pp. 87-100.
Communicaid, 2016, Indulgence VS Restraint 6th Dimension. Retrieved February 16, 2016, from
https://www.communicaid.com/cross-cultural-training/indulgence-vs-restraint-6th-dimension/
Danske Bank and Ernst & Young. 2009. Working capital management 2009 – a survey of Nordic
companies. Retreived February 21, 2016, from file:///C:/Users/Omistaja/Downloads/Report-
Working-Capital-Management-2009.pdf
Deloof, M. 2003. “Does Working Capital Management Affect Profitability of Belgian Firms?”, J
Bus Fin & Acc, vol. 30, no. 3-4, pp. 573-588.
Devine, K., O Clock, P. and Rooney, C.J. 2000 “Implications of culture on the development of
control systems, Ohio CPA Journal”, vol. 5, no. 1, pp. 37-41.
Enqvist, J., Graham, M. and Nikkinen, J. 2014. “The Impact of Working Capital Management on
Firm Profitability in Different Business Cycles: Evidence from Finland”, SSRN Electronic
Journal.
European Union. 2016. Definition of Middle size companies. Retrieved April 28, 2016,
from http://eur-lex.europa.eu/legal-content/EN/TXT/?uri=URISERV%3An26026
Falope, O. and Ajilore, O. 2009. “Working Capital Management and Corporate Profitability:
Evidence from Panel Data Analysis of Selected Quoted Companies in Nigeria”, Research
Journal of Business Management, vol. 3, no. 3, pp. 73-84.
Garcia-Teruel, J. P. and Martinez-Solano, P. 2007. “Effects of working capital management on
SME profitability”, Int J of Managerial Finance, vol. 3, no. 2, pp. 164-177.

56
Gentry, J., Vaidyanathan, R. and Lee, H. 1990. “A Weighted Cash Conversion Cycle”, Financial
Management, vol. 19, no.1, p. 90.
Ghoul. and Zheng. 2015. Trade Credit Provision and National Culture. Retrieved February 29,
2016, from http://capitalism.wfu.edu/wp-content/uploads/2015/04/S.-El-Ghoul-Trade-Credit-
Provision-and-National-Culture.pdf
Gill, A., Biger, N. and Mathur, N. 2010. “The Relationship Between Working Capital Management
and Profitability: Evidence from the United States”, Business and Economics Journal, 1, pp.
1-9.
Goldschmidt, C., Licht, A.N., & Schwartz, S.H. 2001. Cultural Dimensions of Corporate
Governance Laws. Retrieved March 16, 2016, from http://ssrn.com/abstract=267190 or
http://dx.doi.org/10.2139/ssrn.267190
Goldschmidt, C., Licht, A. N., & Schwartz, S. H. 2005. “Culture, law, and corporate governance”,
International Review of Law & Economics, no. 25, pp. 229-255.
Gray. S. J. 1988. “Towards a Theory of Cultural Influence on the development of Accounting
Systems Internationally”. A journal of Accounting, Finance and Business Studies, Vol. 24,
Issue 1, pp. 1-15.
Griffin, D., Li, K., Yue, H., & Zhao, L. 2009. “Cultural values and corporate risk taking”. Working
Paper
Griffin, J. M., Ji, X., Martin, S. 2003. “Momentum investing and business cycle risk: Evidence from
pole to pole”, Journal of Finance, no. 58, pp. 2515-2547.
Guedhami, O., Kwok, C.C.Y., Shao, 2009. “National culture and dividend policy”, Journal of
International Business Studies, no. 41, pp. 1391-1414.
Han, S., Kang, T., Salter, S., Yoo, Y. K. 2010. “A cross-country study on the effects of national
culture on earnings management”, Journal of International Business Studies, no 41, pp. 123-
141.
Harrison, G., & McKinnon, J. 2007. “National culture and management control”. Issues in
management accounting, vol. 3, pp. 93-116.
Hawkins D. 1980. “Identification of Outliers”, Chapman and Hall, 1980.

57
Hill, M., Kelly, W., and Highfoeld, M., 2010. “Net operating working capital behavior: A first
look”, Financial Management, vol. 39, pp. 783.
Hofstede, G. 1983 “National cultures in four dimensions: A research-based theory of cultural
differences among nations”, International Studies of Management & Organization, vol. 13,
no. 1 , pp. 46-74.
Hofstede, G. 1994. “The Business of International Business is Culture”, International Business
Review, vol. 3, no. 1, pp. 1-14.
Hofstede, G. 2001. “Culture’s consequences: Comparing values, behaviors, institutions, and
organizations across nations”. Behaviour Research and Therapy 41.
Hofstede, G., Hofstede, G. and Minkov, M. 2011. Organisationer och kulturer. Studentlitteratur
AB, Lund.
Hofstede Research Center, 2016. The Hofstede Centre, Strategy, Culture, Change. Retrieved
February 7, 2016, from http://geert-hofstede.com/national-culture.html.
House, R., Javidan, M. & Dorfman, P. 2001. “Project GLOBE: An Introduction”, Applied
psychology: an International Review, vol. 50, no. 4, pp. 489-505.
House, R., Javidan, M., Hanges, P. & Dorfman, P. 2002. “Understanding cultures and implicit
leadership theories across the globe; an introduction to project GLOBE”, Journal of World
Business 37, pp. 3-10.
Joannides., V, Wickramasinghe. D., Berland.N., 2012. Critiques on Gray- Hofstede’s Model: What
Impact on Cross-Cultural Accounting Research. Retrieved March 15, 2016, from
from: https://halshs.archives-ouvertes.fr/hal-00690933/document
Kearney, C., Mac and Bhairdad, C. and Lucey, B. 2012. Culture and capital structure in small and
medium sized firms. Retrieved April 10, 2016, from http://ssrn.com/abstract=2185284
Kieschnick, R., Laplante, M. and Moussawi, R. 2006. “Corporate Working Capital Management:
Determinants and Consequences”. Working Paper The Wharton School.
Kieschnick, R., Laplante, M., and Moussawi, R., 2013. “Working capital management and
shareholders’ wealth”, Review of Finance, vol 17, pp. 1827.

58
Kirkman, B., Lowe, K. and Gibson, C. 2006. “A quarter century of culture’s consequences: A
review of empirical research incorporating Hofstede’s cultural values framework”, Journal of
International Business Studies 37, pp. 285-320.
Kolesnik, K. 2013. The role of culture in accounting in the light of hofstede's, Gray's and
Schwartz's cultural dimensions theories - a Literature Review. Retrieved February 20, 2016,
from http://e-finanse.com/artykuly_eng/254.pdf
Koralun-Bereznicka, J. 2014. “On the Relative Importance of Corporate Working Capital
Determinants: Findings from the EU Countries”. Contemporary Economics, vol. 8, no. 4, pp.
1-103.
KPMG. 2010. Cash Matters cash and working capital management in China Retrieved March 16,
2016, from
https://www.kpmg.com/CN/en/IssuesAndInsights/ArticlesPublications/Documents/Cash-
matters-201003.pdf
Kuper, A. 1999. “Culture - the anthropologists account”. London: Harvard University Press.
La Porta, R., Lopez–de–Silanes, F., Shleifer, A., and Vishny, R.W., 1998. “Law and finance”,
Journal of Political Economy, vol 106, pp. 1113–1155.
Leung, K., Bhagat, R.S., Buchan, N.R., Erez, M. and Gibson, C.B. 2005. “Culture and international
business: recent advances and their implications for future research”. Journal of International
Business Studies, vol. 36, no. 4, pp. 357-378.
Littrel, R. 2012. Cultural Value Dimension Theories: Hofstede- A Work in Progress.
Retrieved April 15, 2016, from
http://documents.aib.msu.edu/publications/insights/archive/insights_v012n04.pdf
Morrison, D.E. & Henkel, R.E. 2006. “The Significance Test Controversy: A Reader”. Transaction
Publishers.
Nazir, M. and Alfa, T. 2009. Impact of Aggressive Working Capital Management Policy on Firm's
Profitability. Retrieved February 23, 2016, from
http://search.proquest.com/openview/17d573e97ddb0594ccb2879145ee511f/1?pq-
origsite=gscholar

59
Ng, S., Lee, J. and Soutar, G. 2007. “Are Hofstede’s and Schwartz’s value frameworks
congruent?”, International Marketing Review, vol. 24, no. 2, pp. 164-180.
North, D.C. 1990. “Institutions, Institutional Change and Economic Performance”, Cambridge
University Press, Cambridge.
O’Brien, R. M. 2007, “A caution regarding rule of thumb for variance inflation factors”, Quality
and Quantity, 41: pp. 673-90.
Pass, C. and Pike, R. 1984. “An Overview of Working Capital Management and Corporate
Financing”. Managerial Finance, vol. 10, no. 3, pp. 1-11.
Pass, C. and Pike, R. 1987. “Management of Working Capital: A Neglected Subject”, Management
Decision, vol. 25, no. 1, pp. 18-24.
Pinkowitz, L., Stulz, R., and Williamson, R., 2006. “Does the contribution of corporate cash
holdings and dividends to firm value depend on governance? A cross–country analysis”.,
Journal of Finance, vol. 61, pp. 2725.
Richardson, G. 2008. ”The relationship between culture and tax evasion across countries:
Additional evidenceand extensions”. Journal of International Accounting, Auditing and
Taxation 17, 67-78.
PwC. 2014. Cash for Growth PWC Annual Global Working Capital Survey. Retrieved March 16,
2016, from http://download.pwc.com/ie/pubs/2014-cash-for-growth-annual-global-working-
capital-survey.pdf
Ramirez, A., & Tadesse, S. A. 2007. “Cash holdings, national culture, and multinationality”.
Working paper (SSRN).
Rimo A. and Panbunyuen, P. 2010. The effect of company characteristics on working capital
management A quantitative study of Swedish listed companies. Retrieved April 20, 2016, from
http://www.diva-portal.org/smash/get/diva2:346166/FULLTEXT01.pdf
Rogovsky, N., & Schuler, R. S. 1998. “Understanding compensation practice variations across
firms: The impact of national culture”. Journal of International Business Studies, no 29, pp.
159-177.

60
Rosenthal, J. 2012. Statistics and data interpretation for social work. New York. Springer
Publishing Company, LLC.
Salter, S. and Niswander, F. 1995. “Cultural Influence on the Development of Accounting Systems
Internationally – A Test of Gray [1988] Thoery”, Journal of International Business Studies,
vol. 26, no. 2, pp. 379-397.
Saunders, M., Lewis, P. and Thornhill, A. (2009). Research Methods for Business Students. 5th
edn., S.I.
Sawers, 2012, Countries’ Culture and Working Capital, Retrieved February 29, 2016, from
http://ww2.cfo.com/cash-flow/2012/07/countries-culture-and-working-capital/
Schwartz, S. H. 2006. “A Thoery of Cultural Value Orientations: Explication and Applications”.
Comparative Sociology, vol. 5, issue 2-3, pp. 137-179.
Shi, X. & Wang, J. 2011. “Interpreting Hofstede Model and GLOBE Model: Which Way to Go for
Cross-Cultural Research?” International Journal of Business and Management, vol. 6, no. 5.
Singh, P. H. and Kumar, S. 2014. “Working capital management: a literature review and research
agenda”. Qualitative Research in Financial Markets, vol. 6 no. 2, pp. 173-197.
Licht, A.N., Schwartz, S. H. and Siegel, J.I. 2011. “Egalitarianism and International Investment”.
Journal of Financial Economics (JFE), Forthcoming.
Stonehill, A., & Stitzel, T. 1969. “Financial structure and multinational corporations.” California
Management Review, no 12, pp. 91-96.
Thompson Reuters Datastream, 2013. Thompson Reuters Datastream. February 23, 2016, from
http://www.eui.eu/Documents/Research/Library/ResearchGuides/Economics/PDFs/GAUSSli
brary/DatastreamContent2013.pdf
Vishnani, S. and Shah, B. 2007.” Impact of Working Capital Management Policies on Corporate
Performance-An Empirical Study”. Global Business Review, vol. 8, no. 2, pp. 267-281.
Wang, Y. 2002, "Liquidity management, operating performance, and corporate value: evidence
from Japan and Taiwan", Journal of Multinational Financial Management, vol. 12, no. 2, pp.
159-169.
World Bank. 2016. Databank. Retrieved April 2, 2016, from http://data.worldbank.org/

61
Wooldridge, J. 2013. Introductory econometrics. Australia: South-Western College Pub.
Wu, W-L. 2016 ´”The Impact of National Culture on Working Capital Management”. Working
Paper. Feng Chia University, Taiwan
Yazdanfar, D. and Öhman, P. 2014. “The impact of cash conversion cycle on firm profitability”,
International Journal of Managerial Finance, vol. 10, no. 4, pp. 442-452.

62
10. Appendixes
10.1. Appendix 1: Before Winsorization
The following pictures represent the boxsplots for the variables in the data set of this study before
winsorization that is further discussed in the data preparation section of this paper. The
winsorization was conducted to each country on their own to avoid the bias that the natural country
variations would be lost from the results. Here in the pictures for illustration reasons, the boxsplots
are presented for the data set as a whole including all the values for all the countries.

63
10.2. Appendix 2: After Winsorization by 5 percentile
The following pictures represent the bloxspots for the variables in the data set of this study after
winsorization that is further discussed in the data preparation section of this paper. The boxsplots
that again illustrate the overall dataset trends meanwhile the winsorization was conducted for each
country individually. Based on these overall illustrations it seems evident that the approach of using
winsorization helped to eliminate great deal of outliers. The remaining outliers are due to the
country differences and the fact that each country had their own patterns in the data set.
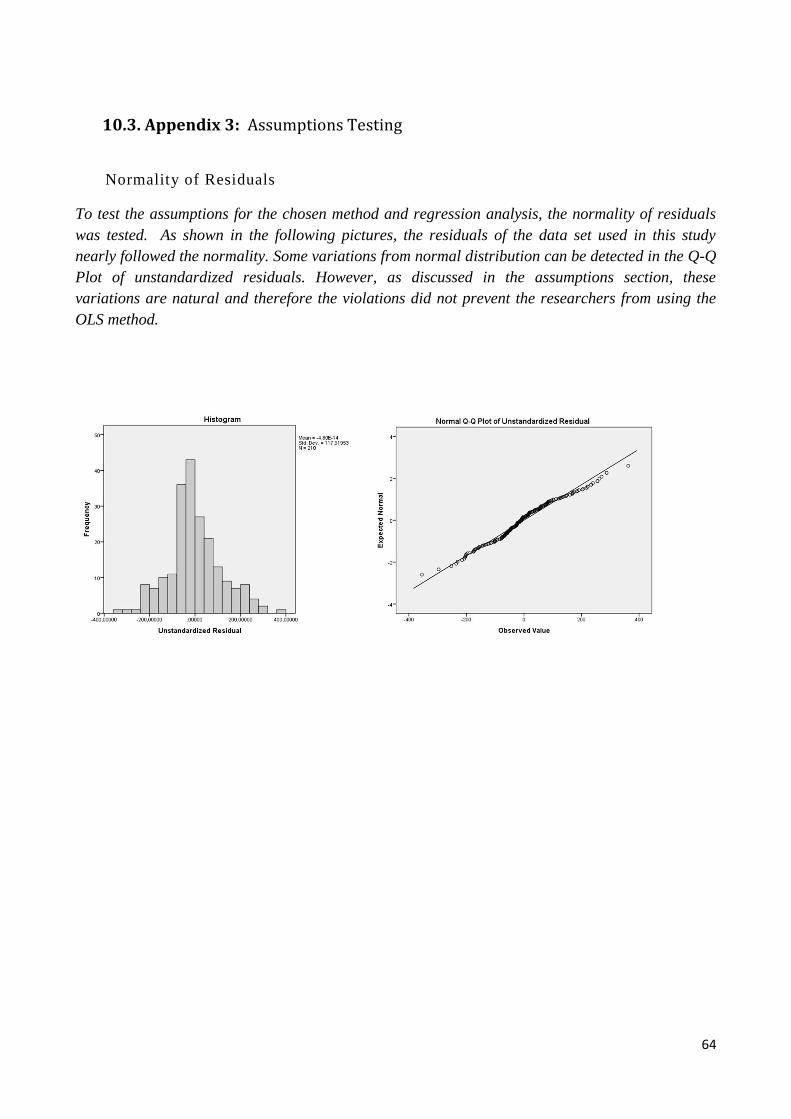
64
10.3. Appendix 3: Assumptions Testing
Normality of Residuals
To test the assumptions for the chosen method and regression analysis, the normality of residuals
was tested. As shown in the following pictures, the residuals of the data set used in this study
nearly followed the normality. Some variations from normal distribution can be detected in the Q-Q
Plot of unstandardized residuals. However, as discussed in the assumptions section, these
variations are natural and therefore the violations did not prevent the researchers from using the
OLS method.

65
Heteroskedasticity
In regards the assumptions testing, the possible heteroskedastic trends were explored. The test
results in form of illustrations are displayed in the following pictures. No patterns that would
hinder the use of OLS method were detected.

66
Linearity
To explore the answer to the assumption test of linearity, the following displays of correlations in
the datasets were conducted. Based on these illustrations, hints of linearity were detected, which
enhanced the use of OLS method.

67
10.4. Appendix 4: Hoftede’s Dimensions
Hofstede’s framework scores countries on six dimensions from 0-100. In the following table, scores
given for the countries (Hofstede’s Researchcenter, 2016) used in this study are presented.

68
10.5. Appendix 5: Schwartz’s Dimensions
To enhance the validity and reliability of the research, Schwartz’s framework (1994) was tested in
terms of robustness check. In the following table, the scores for the countries used in this research
are presented in accordance to Schwartz (1994).