working document no. 7 - european...
TRANSCRIPT

G:\C4\Core activities\Indicators\WD 7 draft 2009-06-17.doc 1
EUROPEAN COMMISSION DIRECTORATE-GENERAL REGIONAL POLICY Policy Development Evaluation
July 2009
The Programming Period 2007-2013
INDICATIVE GUIDELINES ON EVALUATION METHODS: REPORTING ON CORE INDICATORS FOR THE EUROPEAN REGIONAL
DEVELOPMENT FUND AND THE COHESION FUND
Working Document No. 7

G:\C4\Core activities\Indicators\WD 7 draft 2009-06-17.doc 2
Table of contents 1. INTRODUCTION ....................................................................................................................................... 3
1.1. OBJECTIVES OF THE WORKING DOCUMENT .......................................................................................... 3 1.2. SCOPE ................................................................................................................................................... 3 1.3. MAIN MESSAGES................................................................................................................................... 3
1.3.1. Need to Report on Achievements..................................................................................................... 3 1.3.2. Core Indicators ............................................................................................................................... 3 1.3.3. Programme Specific Indicators....................................................................................................... 4 1.3.4. Simplified Reporting for Better Quality .......................................................................................... 4 1.3.5. Next Steps ........................................................................................................................................ 4
2. GUIDANCE ON REPORTING ON INDICATORS................................................................................ 6 2.1. THE SFC 2007 SYSTEM ........................................................................................................................ 6 2.2. INDICATOR INPUT ................................................................................................................................. 6
2.2.1. Indicator.......................................................................................................................................... 6 2.2.2. Baseline and Target ........................................................................................................................ 7
2.3. ANNUAL IMPLEMENTATION REPORT INPUT .......................................................................................... 7 2.3.1. Achievement .................................................................................................................................... 7 2.3.2. Examples ......................................................................................................................................... 8
ANNEX I: CORE INDICATORS FOR ERDF AND COHESION FUND – RECOMMENDED DEFINITIONS ...................................................................................................................................................... 9

G:\C4\Core activities\Indicators\WD 7 draft 2009-06-17.doc 3
1. INTRODUCTION
1.1. Objectives of the Working Document The purpose of this working document is to provide practical guidance to managing authorities on the reporting of core indicators through the electronic system for exchange of data established by the Commission under Article 39 of the Implementing Regulation1 (SFC2007). Working Document No. 2 provided guidance on the establishment of indicators for monitoring and evaluation2. In the time since the Working Document was adopted, Member States have drawn up Operational Programmes, agreed these with the Commission and implementation of programmes on the ground has started. In June 2008, Managing Authorities submitted their first Annual Implementation Reports, related to the year 2007. While there was little actual activity to report at this stage, the experience demonstrated a need for further reflection and guidance on the electronic transfer of information on physical indicators, particularly the core indicators.
1.2. Scope The scope of this working document is the European Regional Development Fund (ERDF) and the Cohesion Fund.
1.3. Main messages
1.3.1.Need to Report on Achievements
There is an ever growing emphasis in the policy debate on the need to report on the achievements of Cohesion Policy. This requires that Member States and the Commission develop strategies to monitor and evaluate the results of Cohesion Policy programmes and communicate these. Working Document No. 5 provided guidance on the development of plans for ongoing evaluations. In addition to evaluation, however, monitoring systems should be able to deliver information on progress against the indicators in the Operational Programmes. This information is important for managers of programmes to monitor progress and to take action where problems arise. It is also important, however, to demonstrate what is being achieved with public money.
1.3.2.Core Indicators
Working Document No. 2 proposed a list of common minimum core indicators for use in ERDF and Cohesion Fund programmes3. During the negotiations on Operational
1 Commission Regulation (EC) No 1828/2006 of 8 December 2006, setting out rules for the implementation of Council Regulation (EC) No 1083/2006 laying down general provisions on the European Regional Development Fund, the European Social Fund and the Cohesion Fund and of Regulation (EC) No 1080/2006 of the European Parliament and of the Council on the European Regional Development Fund 2 Working Document No. 2: The New Programming Period 2007-2013: Monitoring and Evaluation Indicators (2006) at http://ec.europa.eu/regional_policy/sources/docoffic/2007/working/wd2indic_082006_en.pdf 3 Section 4.5 of Working Document No. 2

G:\C4\Core activities\Indicators\WD 7 draft 2009-06-17.doc 4
Programmes, the Commission strongly recommended their use where appropriate. These indicators are particularly important for accountability at EU level, as for these indicators, we should be able to aggregate information to demonstrate what Cohesion Policy resources are being spent on and what they are achieving. In discussions between the Member States and the Commission, a demand for definitions for the core indicators was expressed by some Member States. Based on discussions with the evaluation authorities and representatives of Member States, the Commission has refined the list of core indicators and provided recommended definitions for the Convergence and Regional Competitiveness and Employment Objectives. These are provided in Annex 1. It should be noted that the use of these definitions is not obligatory. A key challenge for the Commission and the Member States is to ensure that core indicators are used where appropriate and they are reported on through the electronic system for the transfer of information on indicators. If the core indicators are not reported on through this system, it is impossible to aggregate them electronically.
1.3.3.Programme Specific Indicators
The heart of any monitoring system is the programme specific indicators. These indicators have been designed to monitor progress towards achieving the objectives of each Operational Programme. They are an essential management tool and should support effective running of the programme and debate on progress at monitoring committee meetings. Reporting on all the indicators (core and programme specific) of the Operational Programme is a requirement of the Annual Implementation Report.
1.3.4.Simplified Reporting for Better Quality
Because only the core indicators are capable of being aggregated at the EU level, it is proposed to limit the electronic transfer of physical data (in SFC2007) to the core indicators. Data entry will also be simplified. Part 2 of this document explains how the data should be entered. It should be understood that this simplification must be accompanied by a willingness on the part of the Managing Authorities to use the core indicators where they are relevant. The Commission seeks the support of Member State authorities in communicating these messages to Managing Authorities.
1.3.5.Next Steps
The Commission proposes that the following steps should be taken to improve reporting on core indicators:
1. The SFC2007 system will be adapted and simplified by June 2009. 2. Annual Implementation Reports for 2008 should be transmitted to the Commission by
30 June 2009, as required by Article 67 of the General Regulation4, by uploading the
4 Council Regulation (EC) No 1083/2006 of 11 July 2006 laying down general provisions on the European Regional Development Fund, the European Social Fund and the Cohesion Fund and repealing Regulation (EC)

G:\C4\Core activities\Indicators\WD 7 draft 2009-06-17.doc 5
document into SFC2007. Information on progress in relation to all programme indicators (core and programme specific) will be included.
3. The Directorate General for Regional Policy does not require structured transfer of
achievements against indicators in 2009 for ERDF and CF financed OPs. 4. By the end of 2009, Managing Authorities should upload targets and baselines for the
core indicators in SFC2007 (see 2.2 "Indicator Input"). Indicators already input as core will be migrated to the simplified system.
5. By 30 June 2010 and for the following years, Managing Authorities should upload
achievements against core indicators in SFC2007 (see 2.3 "Annual Implementation Report Input"). Where activity has taken place in 2007 and 2008, this should also be uploaded at this time.
The Commission invites interested Member States to test the simplified system in order to ensure its user-friendliness. The results of this testing will be communicated to all Member States.
No 1260/1999.

G:\C4\Core activities\Indicators\WD 7 draft 2009-06-17.doc 6
2. GUIDANCE ON REPORTING ON INDICATORS
2.1. The SFC 2007 System The electronic system for the transfer of data from Member States to the Commission is called SFC2007. Three screens are of interest for the purposes of reporting on core indicators:
• the "Indicator Usage" in the Programme Indicators module (see Figure 1);
• the "Baselines / Targets" in the Programme Indicators module (see Figure 2); and
• the "Indicators" in the Annual/Final Implementation Report module (see Figure 3). The purpose of this working document is to provide guidance on the information to be inserted in these screens. Because the objective is to electronically aggregate data, it is necessary that all Managing Authorities use the same conventions when providing the data
2.2. Indicator Input
2.2.1.Indicator
There is no need to manually type in indicators. In the SFC2007 system, "core" indicators are selected from the drop-down menu (under the "Indicator Usage" tab) which is available in all Community languages.
Figure 1: Core Indicators in SFC2007
Managing Authorities are asked to reflect on whether their programme specific indicators are actually "core" indicators and could in fact be inserted in as such.
G:\C4\Core activities\Indicators\WD 7 draft 2009-06-17.doc 7
The unit of an indicator is particularly important for the core indicators. All core indicators specify the unit and this unit should be used by every Managing Authority using this indicator.
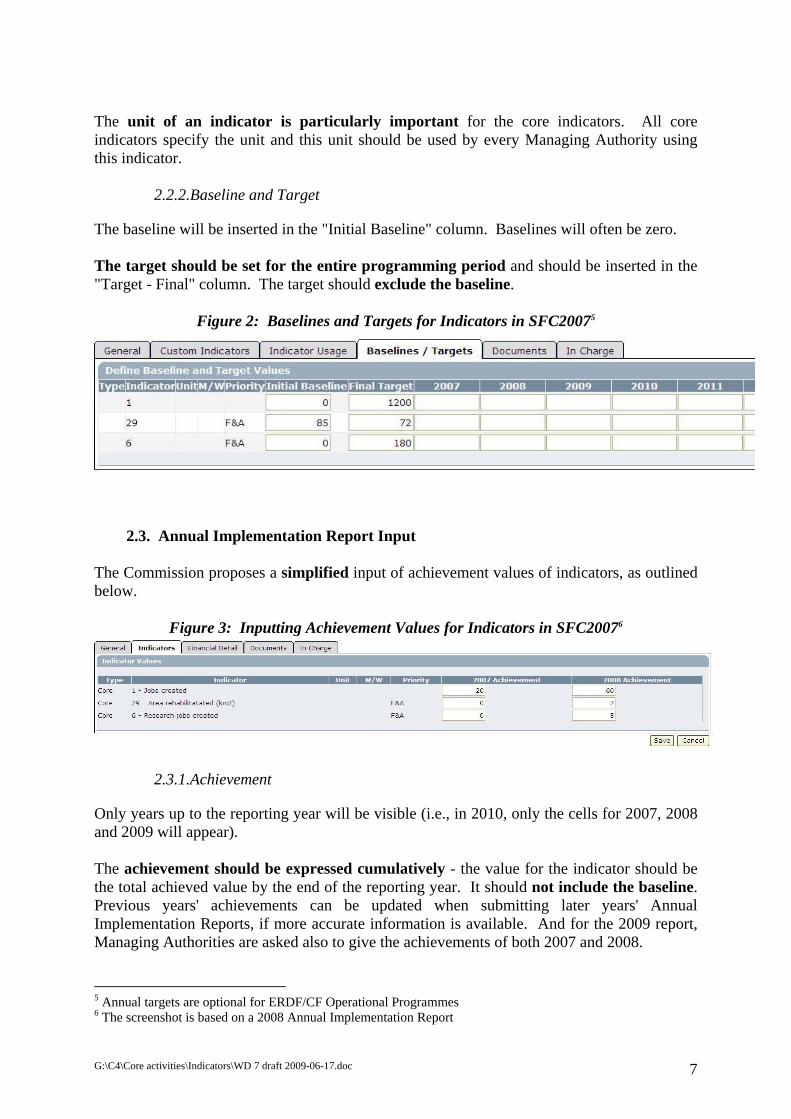
2.2.2.Baseline and Target
The baseline will be inserted in the "Initial Baseline" column. Baselines will often be zero. The target should be set for the entire programming period and should be inserted in the "Target - Final" column. The target should exclude the baseline.
Figure 2: Baselines and Targets for Indicators in SFC20075
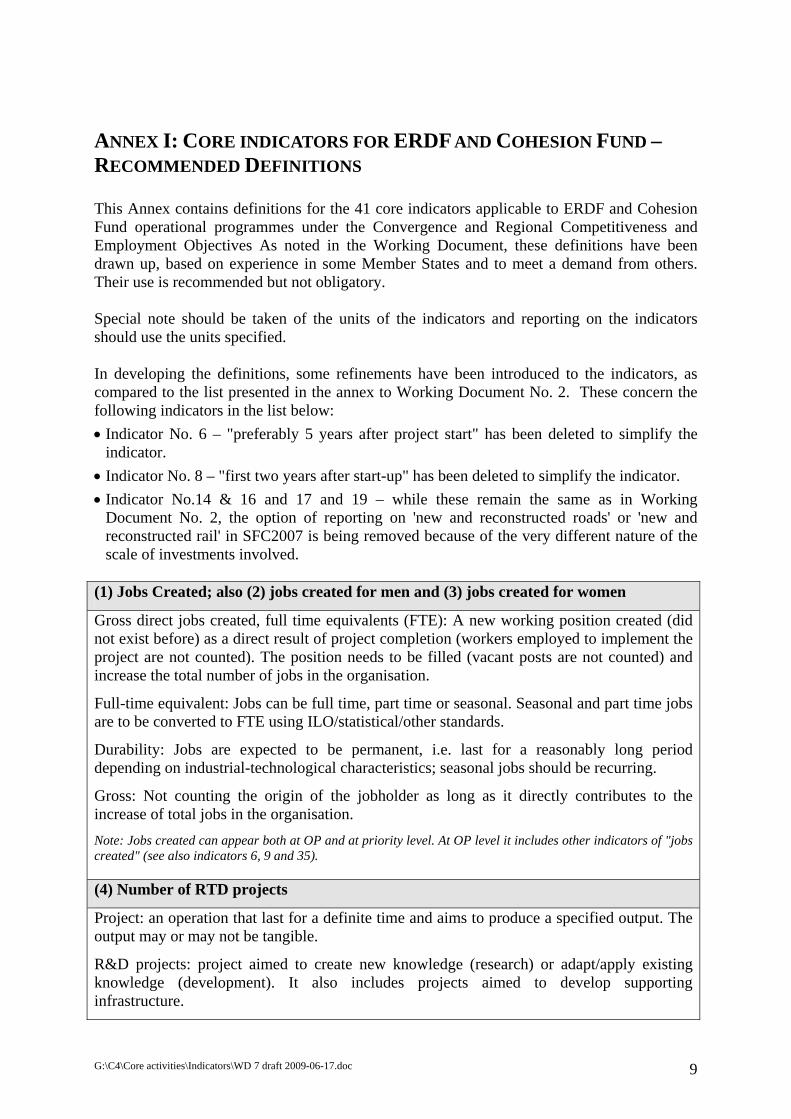
2.3. Annual Implementation Report Input The Commission proposes a simplified input of achievement values of indicators, as outlined below.
Figure 3: Inputting Achievement Values for Indicators in SFC20076
2.3.1.Achievement
Only years up to the reporting year will be visible (i.e., in 2010, only the cells for 2007, 2008 and 2009 will appear). The achievement should be expressed cumulatively - the value for the indicator should be the total achieved value by the end of the reporting year. It should not include the baseline. Previous years' achievements can be updated when submitting later years' Annual Implementation Reports, if more accurate information is available. And for the 2009 report, Managing Authorities are asked also to give the achievements of both 2007 and 2008. 5 Annual targets are optional for ERDF/CF Operational Programmes 6 The screenshot is based on a 2008 Annual Implementation Report

G:\C4\Core activities\Indicators\WD 7 draft 2009-06-17.doc 8
2.3.2.Examples
Below are some worked examples of core indicators correctly filled in to SFC2007 for a 2009 Annual Implementation Report, in the same structure as they would appear in the "Annual Implementation Report Display Page".
Achievements Indicator Initial Baseline Final Target
2007 2008 2009
Jobs Created 0 5,000 0 200 600
Number of RTD Projects 0 7,500 200 700 1500
Km of New Roads 1,000 200 0 0 10
Km of Reconstructed Roads 5,000 3,000 0 300 750
G:\C4\Core activities\Indicators\WD 7 draft 2009-06-17.doc 9
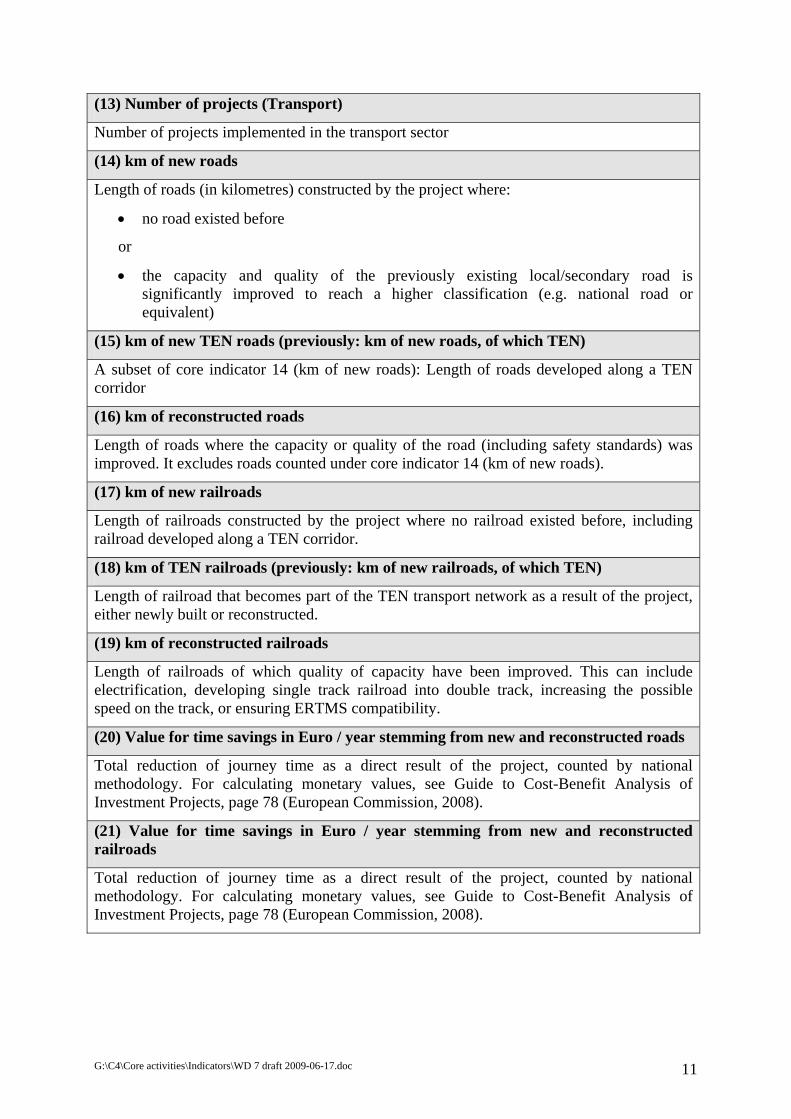
ANNEX I: CORE INDICATORS FOR ERDF AND COHESION FUND – RECOMMENDED DEFINITIONS This Annex contains definitions for the 41 core indicators applicable to ERDF and Cohesion Fund operational programmes under the Convergence and Regional Competitiveness and Employment Objectives As noted in the Working Document, these definitions have been drawn up, based on experience in some Member States and to meet a demand from others. Their use is recommended but not obligatory. Special note should be taken of the units of the indicators and reporting on the indicators should use the units specified. In developing the definitions, some refinements have been introduced to the indicators, as compared to the list presented in the annex to Working Document No. 2. These concern the following indicators in the list below: • Indicator No. 6 – "preferably 5 years after project start" has been deleted to simplify the
indicator. • Indicator No. 8 – "first two years after start-up" has been deleted to simplify the indicator. • Indicator No.14 & 16 and 17 and 19 – while these remain the same as in Working
Document No. 2, the option of reporting on 'new and reconstructed roads' or 'new and reconstructed rail' in SFC2007 is being removed because of the very different nature of the scale of investments involved.
(1) Jobs Created; also (2) jobs created for men and (3) jobs created for women
Gross direct jobs created, full time equivalents (FTE): A new working position created (did not exist before) as a direct result of project completion (workers employed to implement the project are not counted). The position needs to be filled (vacant posts are not counted) and increase the total number of jobs in the organisation.
Full-time equivalent: Jobs can be full time, part time or seasonal. Seasonal and part time jobs are to be converted to FTE using ILO/statistical/other standards.
Durability: Jobs are expected to be permanent, i.e. last for a reasonably long period depending on industrial-technological characteristics; seasonal jobs should be recurring.
Gross: Not counting the origin of the jobholder as long as it directly contributes to the increase of total jobs in the organisation. Note: Jobs created can appear both at OP and at priority level. At OP level it includes other indicators of "jobs created" (see also indicators 6, 9 and 35).
(4) Number of RTD projects
Project: an operation that last for a definite time and aims to produce a specified output. The output may or may not be tangible.
R&D projects: project aimed to create new knowledge (research) or adapt/apply existing knowledge (development). It also includes projects aimed to develop supporting infrastructure.

G:\C4\Core activities\Indicators\WD 7 draft 2009-06-17.doc 10
(5) Number of cooperation projects enterprises – research institutions
R&D projects where at least one enterprise and one research institution participates in the project. The cooperation should last at least for the duration of the project.
Enterprise: Organisation producing products or services to satisfy market needs in order to reach profit.
Research institution: an organisation of which R&D is a primary activity.
(6) Research jobs created (preferably 5 years after project start)
Gross direct jobs created to directly perform R&D activities, in full time equivalents, as a result of a finished or on-going R&D project. If less than 100% of working time is devoted to R&D activity, the FTE should be modified accordingly. Support staff for R&D (i.e. jobs not directly involved in R&D activities) is not counted.
(7) Number of projects (Direct investment aid to SME)
Number of projects implemented by an SME using financial aid from Structural Funds. The form of the aid may vary (refundable, non-refundable, guarantee, etc.). The project should result in an investment (increasing the fixed or intangible assets of the enterprise).
Project: an operation that last for a definite time and aims to produce a specified output. The output may or may not be tangible.
(8) Number of start-ups supported (first two years after start-up)
Number of enterprises created receiving financial aid or assistance (consultancy, guidance, etc.) from Structural Funds or Structural Funds financed facility. The created enterprise did not exist one year before the project started. The legal form of enterprise may be various (self-employed persons, partnerships, etc.).
(9) Jobs created (gross, full time equivalent) (Direct investment aid to SME)
Gross direct jobs created in an SME, in full time equivalents, as a direct result of a finished project where (1) the project owner is the SME and (2) the project was implemented using financial aid from Structural Funds (the form of the aid may vary, e.g. refundable, non-refundable, guarantee).
(10) Investment induced (million €)
Private investment in enterprise supporting projects.
(11) Number of projects (Information society)
Number of projects aimed to develop ICT infrastructure, equipment, use or application.
Project: an operation that last for a definite time and aims to produce a specified output. The output may or may not be tangible.
(12) Number of additional population covered by broadband access
Number of persons who can access to the internet with a download speed of at least 256 Kbit/sec and who did not have access before at all or only had more limited access. The capacity to access must be a direct result of the assistance.
G:\C4\Core activities\Indicators\WD 7 draft 2009-06-17.doc 11
(13) Number of projects (Transport)
Number of projects implemented in the transport sector
(14) km of new roads
Length of roads (in kilometres) constructed by the project where:
• no road existed before
or
• the capacity and quality of the previously existing local/secondary road is significantly improved to reach a higher classification (e.g. national road or equivalent)
(15) km of new TEN roads (previously: km of new roads, of which TEN)
A subset of core indicator 14 (km of new roads): Length of roads developed along a TEN corridor
(16) km of reconstructed roads
Length of roads where the capacity or quality of the road (including safety standards) was improved. It excludes roads counted under core indicator 14 (km of new roads).
(17) km of new railroads
Length of railroads constructed by the project where no railroad existed before, including railroad developed along a TEN corridor.
(18) km of TEN railroads (previously: km of new railroads, of which TEN)
Length of railroad that becomes part of the TEN transport network as a result of the project, either newly built or reconstructed.
(19) km of reconstructed railroads
Length of railroads of which quality of capacity have been improved. This can include electrification, developing single track railroad into double track, increasing the possible speed on the track, or ensuring ERTMS compatibility.
(20) Value for time savings in Euro / year stemming from new and reconstructed roads
Total reduction of journey time as a direct result of the project, counted by national methodology. For calculating monetary values, see Guide to Cost-Benefit Analysis of Investment Projects, page 78 (European Commission, 2008).
(21) Value for time savings in Euro / year stemming from new and reconstructed railroads
Total reduction of journey time as a direct result of the project, counted by national methodology. For calculating monetary values, see Guide to Cost-Benefit Analysis of Investment Projects, page 78 (European Commission, 2008).

G:\C4\Core activities\Indicators\WD 7 draft 2009-06-17.doc 12
(22) Additional population served with improved urban transport
Number of persons using improved public transport who did not use it before.
Improved public transport: increase of the capacity or the quality (increase comfort, improve safety and security, reduce journey time, reduce delays, etc.) of services offered by the public transport network as direct result of projects.
(23) Number of projects (Renewable energy)
Number of projects aimed to increase or improve the production or transportation capacity of renewable energy.
Renewable energy: Energy produced by renewable energy sources (i.e. excluding fossil or nuclear energy).
(24) Additional capacity of renewable energy production (MW)
Increase in energy production capacity (in megawatts) of facilities using renewable energy resources, built/equipped by the project.
Renewable energy resource: Any energy source that is not fossil or nuclear.
(25) Additional population served by water projects
Number of persons provided with drinking water through the drinking water transportation network as a result of increased drinking water production/transportation capacity built by the project, and who were previously not connected. It includes reconstruction projects but excludes projects aiming to create/improve irrigation systems.
(26) Additional population served by waste water projects
Number of persons (in population equivalent) whose wastewater is transported to wastewater treatment plants through wastewater transportation network as a result of increased waste water treatment/transportation capacity built by the project, and who were previously not connected.
(27) Number of waste projects
Number of projects aimed at
• waste prevention, or • recycling of communal or industrial waste, or • increasing landfill capacity or improving waste storage facilities, or • closing substandard landfills.
(28) Number of projects on improvement of air quality
No recommended definition
(29) Area rehabilitated (km2)
Surface of contaminated or derelict land (in square kilometres) made available for economic (except agriculture) or community activities.

G:\C4\Core activities\Indicators\WD 7 draft 2009-06-17.doc 13
(30) Reduction greenhouse gas emissions (CO2 and equivalents, kt)
The gross total reduction in greenhouse gas emissions (in CO2 equivalents, kiloton per annum) as a result of interventions financed by Structural Funds. Calculating CO2 equivalent is in line with United Nations Framework Convention on Climate Change (UNFCCC) standards (also see Decision No 280/2004/EC).
(31) Number of projects (Risk prevention)
Number of projects aimed to decrease the risk exposure of certain group of people or territories to natural disasters. The project can aim to decrease the chance of the disaster affecting the population or decrease the damage that potential disasters can cause. Projects that are primarily aimed to increase the capacity to deal with the after-effects of natural disasters are not considered as risk prevention projects.
(32) Number of people benefiting from flood protection measures
Number of people exposed to flood risk and whose vulnerability decreased as a direct result of a Structural Funds project.
(33) Number of people benefiting from forest fire protection and other protection measures
Number of people exposed to a certain risk and whose vulnerability decreased as a direct result of a Structural Funds project.
(34) Number of projects (Tourism)
Number of projects aimed to develop the tourism industry in the region.
Project: an operation that last for a definite time and aims to produce a specified output. The output may or may not be tangible.
(35) Number of jobs created (Tourism)
Gross direct jobs created (in full time equivalents) by tourism projects (projects counted under core indicator 34)
(36) Number of projects (Education)
Number of projects for education / training infrastructure development (includes buildings and equipment)
(37) Number of benefiting students (Education)
Number of students using the buildings or equipment provided by the project for their education or training (average users per year).
(38) Number of projects (Health)
Number of projects for health infrastructure development (includes buildings and equipment).
(39) Number of projects ensuring sustainability and improving the attractiveness of towns and cities (Urban development)
No recommended definition

G:\C4\Core activities\Indicators\WD 7 draft 2009-06-17.doc 14
(40) Number of projects seeking to promote businesses, entrepreneurship, new technology (Urban development)
No recommended definition
(41) Number of projects offering services to promote equal opportunities and social inclusion for minorities and young people (Urban development)
No recommended definition