working draft screening level ecological risk assessment
TRANSCRIPT

Prepared for:
Utah Department of Environmental Quality
Division of Water Quality
Working Draft Screening Level Ecological Risk Assessment
Lower Red Butte Creek Salt Lake City, Utah
June 2012
www.erm.com

Draft
i

Draft
ii
Utah Department of Environmental Quality Division of Water Quality
Working Draft Screening Level Ecological Risk Assessment
Lower Red Butte Creek Salt Lake City, Utah
June 2012
Project No. 0145323
Brent Robinson Partner-in-Charge
Mark Shibata Program/Technical Director
Sandra Mulhearn Senior Scientist
ERM-West, Inc. 102 West 500 South Salt Lake City, UT 84101-2334 T: 801-595-8400 F: 801-595-8484

Draft
ii
• This page intentionally left blank •

Draft
iii
TABLE OF CONTENTS
Appendices ........................................................................................................... v
List of Tables ....................................................................................................... vii
List of Figures .................................................................................................... viii
List of Acronyms and Abbreviations ............................................................ viiii
Executive Summary ............................................................................................ ix
1.0 Introduction .............................................................................................. 1 1.1 Incident History ..................................................................................... 1 1.2 Overview of The Ecological Risk Assessment .................................. 1
2.0 Site Description ........................................................................................ 5 2.1 Location / General Setting ................................................................... 5 2.2 Geology ................................................................................................... 6 2.3 In-Creek Flows ....................................................................................... 6 2.4 Flora and Fauna ..................................................................................... 6
3.0 Data Evaluation ........................................................................................ 9 3.1 Data Collection ...................................................................................... 9 3.2 Data Validation .................................................................................... 12 3.3 Data Usability ...................................................................................... 13 3.4 Handling Non-Detected Values ........................................................ 16
4.0 Reference Creek (Ambient) Evaluation .............................................. 17 4.1 Statistical Comparisons ...................................................................... 18 4.2 Comparision to Background Threshold Values.............................. 19 4.3 polycyclic aromatic hydrocarbons Composition Analysis ............ 20 4.4 Summary .............................................................................................. 20
5.0 Problem Formulation ............................................................................ 23 5.1 Biotic Receptors of Concern ............................................................... 23 5.2 Constituents of Potential Ecological Concern ................................. 25 5.3 Potentially Complete Exposure Pathways ...................................... 27 5.4 Assessment Endpoints ........................................................................ 29
Draft
iv
6.0 Exposure Assessment ............................................................................ 31 6.1 Total Petroleum hydrocarbons Concentrations .............................. 31 6.2 Exposure Point Concentrations ......................................................... 31 6.3 Aquatic and Benthic Macroinvertebrates ........................................ 32 6.4 Riparian Wildlife ................................................................................. 32
7.0 Effects Assessment ................................................................................. 37 7.1 Aquatic Biota toxicity reference values ............................................ 38 7.2 Benthic Macroinvertebrate Toxicity Reference Values .................. 38 7.3 Riparian Wildlife Toxicity Reference Values .................................. 39 7.4 In-Creek Benthic Macroinvertebrate Community Structure ........ 40
8.0 Risk Characterization ............................................................................ 43 8.1 Hazard Quotients ................................................................................ 43 8.2 Aquatic Biota ........................................................................................ 44 8.3 Benthic Macroinvertebrates ............................................................... 44 8.4 Riparian Birds ...................................................................................... 50 8.5 Riparian Mammals .............................................................................. 52 8.6 Uncertainty Analysis .......................................................................... 55
9.0 Discussion and Conclusions ................................................................. 63
10.0 Liturature Cited ...................................................................................... 65

Draft
v
Appendices
Appendix A: Ecological Risk Assessment Work Plan
Appendix B: Photographs of Sampling Locations
Appendix C: Quality Assurance/Quality Control (QA/QC) Memorandums
Appendix D: Reference Creek (Ambient) Evaluation
Appendix E: Ecological Risk Analyses
Appendix F: Analysis of Benthic Macroinvertebrate Community Indices
Appendix G: Data Used in Risk Assessment (provided by McDaniel-Lambert) [see attached CD]

Draft
vi
LIST OF TABLES
Table 3-1. Incident Monitoring Sampling and Analysis Plan and Supplemental Sampling Stations to Support the Ecological Risk Assessment
Table 3-2. Criteria Used to Identify Data Usability
Table 5-1. Risk-Based Ecological Screening Levels Table 5-2. Constituents of Potential Ecological Concern Table 5-3. Assessment Endpoints for Lower (Urban) Red Butte Creek
Table 6-1. Wildlife Exposure Factors Table 6-2. Bioaccumulation Factors
Table 7-1. Sources of Toxicity Reference Values Table 7-2. Aquatic Biota Toxicity Reference Values Table 7-3. Macroinvertebrate Community Toxicity Reference Values Table 7-4. Wildlife Toxicity Reference Values Table 7-5. In-Creek Benthic Macroinvertebrate Community Metrics
Table 8-1. Risk Calculations for Aquatic Biota Table 8-2. Risk Calculations for Benthic Macroinvertebrates Table 8-3. Risk Calculations for the Mallard Table 8-4. Risk Calculations for the Sandpiper Table 8-5. Risk Calculations for the Muskrat Table 8-6. Risk Calculations for the Raccoon Table 8-7. Benthic Macroinvertebrate Sampling Locations within Lower Red Butte
Creek Table 8-8. Benthic Macroinvertebrate Community: Results of Nonparametric Two-
Sample Tests Table 8-9. Benthic Macroinvertebrate Community: Results of Nonparametric
Regression Analyses
Note: Tables 8-1 through 8-6 found at end of the document.
Draft
vii
LIST OF FIGURES
Figure 1-1. ERA Approach Figure 1-2. Elements of the SLERA
Figure 2-1. Map of Red Butte, Emigration, City, and Parleys Creeks Figure 2-2. Longitudinal profile plot of Lower Red Butte Creek Streambed
Figure 3-1. Map of Sampling Locations
Figure 5-1. Conceptual Site Model for the Lower Red Butte Creek SLERA
Figure 8-1. Macroinvertebrate Community Metrics Boxplots
Draft
viii
LIST OF ACRONYMS AND ABBREVIATIONS
95UCL 95 percent upper confidence limits
AF assimilation factor
ARCS Assessment and Remediation Contaminated Sediments
ATSDR Agency for Toxic Substances and Disease Registry
BAF bioaccumulation factor
BERA baseline ecological risk assessment
BROC biotic receptor of concern
BTEX benzene, toluene, ethylbenzene, xylene
BTV background threshold value
BW body weight
CD compact disk
COPEC constituent of potential ecological concern
CR contact rate
CSM conceptual site model
DQO data quality objective
Es sorting effectiveness
EPC exposure point concentration
EPT ephemeroptera, plecoptera, trichoptera
ERA ecological risk assessment
ESL ecological screening level
ESSL ecological soil screening level
FC fraction of media contacted
Ho null hypothesis
ha hectare
HBI Hilsenhoff biotic index
HHRA human health risk assessment
HI hazard index
HQ hazard quotient
kg kilogram
L liter
LD50 lethal dose for 50 percent of the population
LOAEL lowest observable adverse effect level

Draft
ix
MaDEP Massachusetts Department of Environmental Protection
mg milligram
ug microgram
NAWQC National ambient water quality criteria
ND non-detect
NFG National Functional Guidelines
NOAA National Oceanic and Atmospheric Administration
NOAEL no observable adverse effect level
ns not significant
p probability
PAH polycyclic aromatic hydrocarbon
PCE tetrachloroethene
PEC probable effect concentration
PERA probabilistic ecological risk assessment
ORNL Oak Ridge National Laboratory
QA/QC quality assurance/quality control
QAPP quality assurance program plan
Q-Q plot quantile-quantile plot
QSAR quantitative structure-activity relationship
RAGS risk assessment guidance for Superfund
RBSL risk-based screening level
RPD relative percent difference
SAP sampling and analysis plan
SLERA screening-level ecological risk assessment
SLVHD Salt Lake Valley Health Department
SQG sediment quality guideline
SQUiRT screening quick reference table
SVOC semivolatile organic compounds
TEC threshold effect concentration
TIC tentatively identified compound
TPH total petroleum hydrocarbon
TPHCWG Total Petroleum Hydrocarbon Criteria Working Group
TRV toxicity reference value
UCL upper confidence limit

Draft
x
UDEQ Utah Department of Environmental Quality
UPL upper prediction limit
USEPA US Environmental Protection Agency
VOC volatile organic compounds
WEF wildlife exposure factor
WQS water quality standard
WRS Wilcoxon rank sum test
Draft
xi
EXECUTIVE SUMMARY
E1.0 INTRODUCTION
On 12 June 2010, approximately 800 barrels of crude oil was released (hereafter referred to as the Incident) into Lower Red Butte Creek (in Salt Lake City, Utah) just downstream of the Red Butte Garden Arboretum (Chevron Pipeline Company [CPL] 2011). As of 9 September 2010, a total of 778 of the 800 barrels were accounted for through recovery from water, soil removal, and evaporation (CPL 2011). The purpose of this ecological risk assessment (ERA) is to evaluate the potential for adverse ecological impacts that may occur as a result of potential exposures to residual concentrations of spill-related petroleum hydrocarbons following remediation efforts in Lower Red Butte Creek. Methods used to conduct the ERA are consistent with the State of Utah and USEPA guidance. Findings of this ERA are intended to support evaluations/determinations of whether:
• The remediation response was sufficient to protect biota of concern;
• A more detailed ERA is warranted for this urban creek; and/or
• There is a need for additional risk management actions, and, if needed, what is the scope of these actions.
Consistent with guidance, a screening-level ERA (SLERA) was conducted and the elements of this SLERA included:
Problem formulation; Effects assessment; and
Exposure assessment; Risk characterization.
Key features of this SLERA include:
Where applicable and possible, the SLERA is consistent in approach and methodology with the human health risk assessment (HHRA) that was performed concurrently.
UDEQ (2005) TPH Fractionation guidance was used to evaluate total petroleum hydrocarbons (TPH). UDEQ’s fractionation guidance builds on approaches previously described by the Total Petroleum Hydrocarbon Criteria Working Group (TPHCWG) and the Massachusetts Department of Environmental Protection (MaDEP). Where UDEQ TPH benchmarks were lacking, MaDEP benchmarks were used to evaluate potential risks due to exposures to petroleum
Draft
xii
hydrocarbons—specifically, to aliphatic and aromatic carbon-chain fractions.
Reference creeks were identified to characterize ambient conditions of urban creeks not impacted by the Incident and were established to correctly identify concentrations and biological responses attributable to the Incident. Reference creeks identified in the Red Butte Creek Crude Oil Spill Water, Sediment and Macroinvertebrate Sampling Plan, v. 17 (CPL 2011) and used in this ERA are Emigration Creek, Parleys Creek, City Creek, and Mill Creek.
In-creek benthic community structure was evaluated as an added line of evidence to characterize the ecological significance of any identified ecological risks.
E2.0 DATA EVALUATION
In August 2011, bank soil, creek bed sediment, water, and benthic macroinvertebrate samples were collected in Lower Red Butte Creek and identified reference (urban) creeks in Salt Lake City, Utah. Data collection activities were designed to characterize (i) concentrations of petroleum-related constituents and (ii) structure of benthic macroinvertebrate communities for use in the risk assessment. For consistency and where possible to provide a baseline data set, all methods used to conduct the field collection and laboratory analyses were the same as those described in the Red Butte Creek Crude Oil Spill Water, Sediment and Macroinvertebrate Sampling Plan v. 17 [Incident Monitoring Sampling and Analysis Plan (SAP)] (CPL 2011).
Surface water, sediment, and bank soil samples were analyzed for:
Total petroleum hydrocarbons (TPH);
Volatile organic compounds (VOCs), including benzene, toluene, ethylbenzene, xylenes (BTEX); and
Semivolatile organic compounds (SVOCs), including polycyclic aromatic hydrocarbons (PAHs); and
Grain size and total organic carbon [for soil and sediment only].
Benthic macroinvertebrate samples were collected by Division of Water Quality personnel and analyzed by the National Aquatic Monitoring Center (also known as the “BugLab”) at Utah State University. To the extent possible, macroinvertebrate sampling locations were co-located with surface water and sediment sampling stations to facilitate correlation

Draft
xiii
of chemistry and biological data. Collection of macroinvertebrate community structure data is intended to provide additional evidence for characterizing/verifying potential ecological risks due to exposures to residual Incident-related petroleum hydrocarbons.
Data validation was conducted according to USEPA National Functional Guidelines (NFGs) (USEPA 1999a, 2004). Newer NFGs are available, but the SW-846 methods are better represented by the earlier versions of NFGs. All of the chemistry data were subject to a Level II review. A Level IV data validation was conducted on 10 percent of the data. Appropriate validation qualifiers were assigned to the data. Benthic macroinvertebrate data underwent the BugLab quality control procedures.
An organic compound was presumed not to exist in a particular environmental medium if it was never detected (100 percent non-detect) and detection limits met data quality objectives. Consistent with guidance (USEPA 1989), constituents that were detected at a frequency less than 5 percent were not quantitatively evaluated in this SLERA. The omission of a quantitative evaluation for these rarely detected constituents is discussed further in the uncertainty analysis
E3.0 REFERENCE CREEK (AMBIENT) EVALUATION
Reference creeks were selected to represent in-creek conditions having similar environmental expectations as Lower Red Butte Creek in the absence of the effects of the Incident. As such, reference creeks can be used to characterize the ”reasonable attainable“ state and can provide the point-of-reference to assess the potential impairment. A reference creek (ambient) evaluation was performed by McDaniel-Lambert to support both the HHRA and ERA (McDaniel-Lambert 2012). The purpose of this evaluation was to determine whether concentrations of PAHs detected in samples within Lower Red Butte Creek are comparable to concentrations of PAHs detected in reference creeks.
There were insufficient data to conduct reference creek (ambient) comparisons for:
Bis(2-ethylhexyl)phthalate and bromoform in surface water
1-Methylnapthalene, 2-methylnapthalene, anthracene, benzo(a)anthracene, benzo(b)fluoranthene, benzo(g,h,i)perylene, benzo(k)fluoranthene, dibenzo(a,h)anthracene, fluorine, indeno(1,2,3-cd)pyrene, and naphthalene in creek bed sediments

Draft
xiv
1-Methylnapthalene, 2-methylnapthalene, dibenzo(a,h)anthracene, fluorene, and naphthalene in soil/sediment.
However, where there were at least six detections, findings of both two-sample and quantile tests suggest that concentrations of PAHs and TPH in Red Butte Creek were comparable or less than in reference creeks.
There are uncertainties regarding the power of statistical comparisons to discern differences (McDaniel-Lambert 2012). In addition, visual examination of Q-Q plots indicated inconsistencies with statistical tests for some PAHs and TPH-motor oil. Hence, individual site observations were compared against a background threshold value (BTV) to determine whether or not point-by-point site concentrations are within reference creek concentrations. The BTV analysis supports the conclusion that elevated site PAH concentrations occur in localized areas of Lower Red Butte Creek—namely 1731 East 900 South, Above 1500 East, and 1225 East Harvard Avenue. All other sampling locations are within expected reference creek (ambient) levels.
The PAH composition analysis did not reveal any differences between Lower Red Butte Creek and background PAH ratios, including the PAH ratios for the maximum detections in Lower Red Butte Creek sediment. These findings suggest that petroleum-related hydrocarbons detected in Red Butte Creek appear to be consistent with PAHs typical of urban run-off.
For the most part, the weight of evidence shows that most Lower Red Butte Creek PAHs are consistent with reference creek (ambient) sources; however, a few creek locations exceed background levels. However, for the purposes of this SLERA, comparisons to reference creek concentrations were not used to identify constituents of potential ecological concern and findings of this reference creek (ambient) evaluation were discussed in the uncertainty analysis and conclusions.
E4.0 PROBLEM FORMULATION
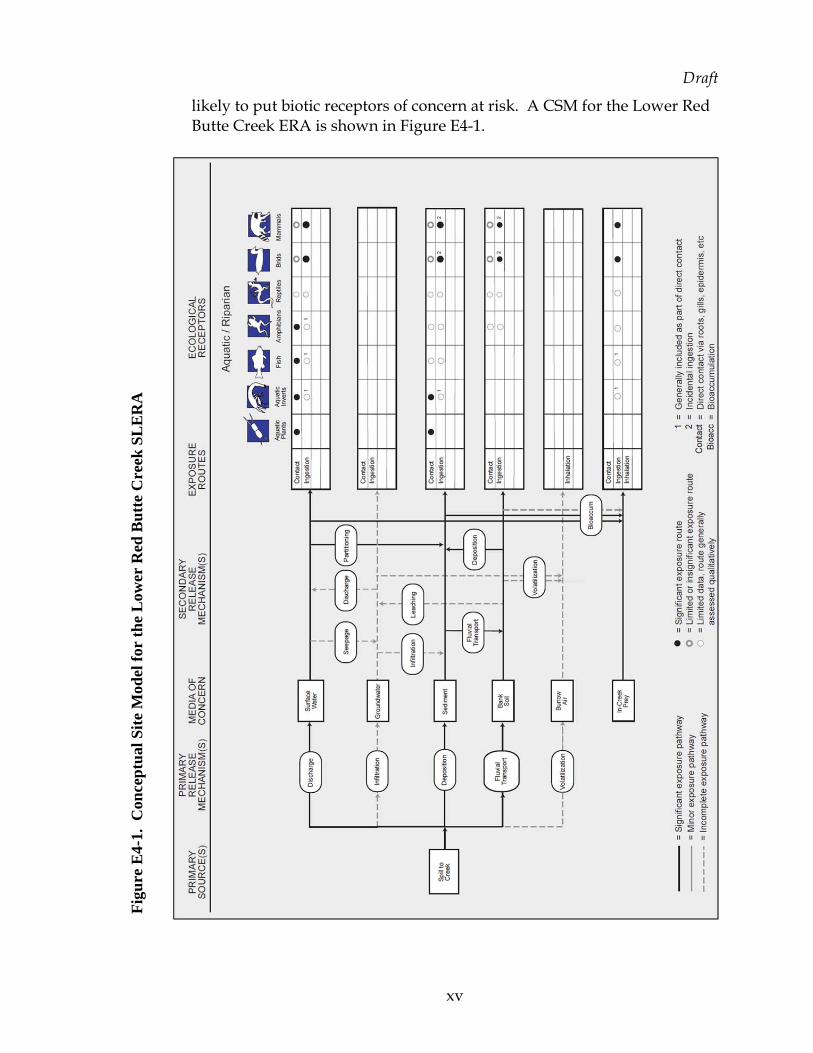
Problem formulation establishes the scope of the ecological risk assessment, identifies the major factors to be considered, and ensures that ecological receptors likely to be exposed and exposure scenarios most likely to contribute to ecological risk are evaluated. A conceptual site model (CSM) was prepared that identifies and summarizes the sources, mechanisms of transport, media of concern, exposure routes, and receptor groups and is intended to identify those exposure scenarios that are most
Draft
xv
likely to put biotic receptors of concern at risk. A CSM for the Lower Red Butte Creek ERA is shown in Figure E4-1.
Fig
ure
E4-
1. C
once
ptu
al S
ite
Mod
el f
or t
he
Low
er R
ed B
utt
e C
reek
SL
ER
A

Draft
xvi
Note that no federal- or state-listed threatened and endangered species reside and no designated critical habitat was identified in the reach of interest for Lower Red Butte Creek.
Constituents of potential ecological concern (COPECs) are petroleum-related constituents that may adversely affect biota. Petroleum-related constituents include TPH, TPH fractions, and hazardous components of TPH (in particular, PAHs and BTEX) (ATSDR 1999; TPHCWG 1997a). COPECs do not necessarily signify a risk; rather, they are merely constituents that have been identified for further examination. COPECs for each medium of concern are listed in Table E4-1.
Table E4-1. Constituents of Potential Ecological Concern
Constituent Surface Water*
Creek Bed Sediment
Creek Soil/ Sediment
VOCs
Acetone** X Tetrachloroethene (PCE)** X
Low Molecular Weight PAHs
Anthracene X
High Molecular Weight PAHs
Benzo(a)anthracene X Benzo(a)pyrene X Benzo(b)fluoranthene X Benzo(g,h,i)perylene X Benzo(k)fluoranthene X Dibenzo(a,h)anthracene X Indeno(1,2,3-cd)pyrene X Pyrene X
Other SVOCs
Bis(2-ethylhexyl)phthalate X
TPH
TPH Diesel
Aromatics X X Aliphatics X X

Draft
xvii
Constituent Surface Water*
Creek Bed Sediment
Creek Soil/ Sediment
TPH Motor Oil
Aromatics X X Aliphatics X X
Notes: X = COPEC * Bromoform was detected in surface water, but at a maximum concentration less
than its risk-based ESL ** Acetone, bromoform, and PCE are not considered petroleum-related constituents,
but are included for consistency with the HHRA
E5.0 SUMMARY OF SLERA FINDINGS
A key feature of this SLERA is the use of multiple lines of evidence (where available) to support characterizations of risk. The use of multiple lines of evidence (e.g., reference creek evaluation, risk estimates for reference creeks, benthic macroinvertebrate community metrics) is intended to provide several perspectives to assist in characterizing the potential for ecological risk.
Aquatic Biota. Potential risks to aquatic biota due to residual exposures of petroleum-related constituents in surface water appear to be limited. All analytes, except for bis(2-ethylhexyl)phthalate, were either not detected or had maximum concentrations less than risk-based ESLs. Note that bis(2-ethylhexyl)phthalate was only detected in 1 of 16 surface water samples. This single detection suggests that bis(2-ethylhexyl)phthalate may pose a potential risk, but that exposures are likely to be spatially limited.
Benthic Macroinvertebrate Community. Potential risks to benthic macroinvertebrate communities due to residual exposures of petroleum-related constituents in creek bed sediments also appear to be limited. COPECs were limited to acetone, tetrachloroethene (PCE), eight PAHs, TPH-diesel, and TPH-motor oil. Exposures for 6 of 8 PAHs were less than TECs leading to a conclusion that adverse effects are not expected to occur (MacDonald et al. 2000). Exposures to PCE and anthracene were greater than TECs, but less than PECs, and a determination of toxicity or nontoxicity cannot be confidently predicted (MacDonald et al. 2000).
An evaluation of reference creeks found that concentrations of PAHs in creek bed sediments of Lower Red Butte Creek were comparable or less than concentrations in creek bed sediments of reference creeks. In addition, exposures used in this SLERA appear to be comparable between

Draft
xviii
Lower Red Butte Creek and reference creeks. Finally, metrics suggest that the structure of the benthic macroinvertebrate community in Lower Red Butte Creek is comparable to reference creeks. These lines of evidence suggest that potential exposures/risks in Lower Red Butte Creek are comparable to conditions observed in reference creeks and are unlikely to be attributable to residual Incident-related petroleum hydrocarbons.
Riparian Birds and Mammals. Potential risks to riparian birds and mammals due to residual exposures to aromatic and aliphatic fractions of TPH in Lower Red Butte Creek were identified. Note that exposures and risk estimates for aromatic and aliphatic fractions of TPH-diesel were comparable to or less than those measured/calculated for the reference creeks. Although statistical tests found no significant difference, visual examination of Q-Q plots suggest that TPH-motor oil concentrations appear to be greater in Red Butte Creek as compared to reference creeks. Risk estimates for the aliphatic fraction of TPH-motor oil were greater than one and greater than risk estimates calculated for the reference creeks.
Reference Creek (Ambient) Evaluation. An evaluation of reference creeks found that concentrations of several PAHs and TPH-diesel in creek bed sediment of Lower Red Butte Creek were comparable or less than concentrations in creek bed sediment of reference creeks. Similarly, this evaluation found that concentrations of several PAHs and TPH-diesel in soil/sediment of Lower Red Butte Creek were comparable or less than concentrations in soil/sediments of reference creeks. Although visual examination of Q-Q plots found inconsistencies with the statistical analyses, an analysis of PAH composition suggests a pyrogenic source of PAHs that is consistent with urban runoff. This evaluation of the reference creek (ambient) conditions suggest that petroleum hydrocarbons detected in Red Butte Creek may not be Incident-related.
Uncertainties. Uncertainties associated with the risk analyses were identified for this SLERA. To reduce uncertainties, focused verification of this SLERA may be considered. However, given potential risks to biota in Lower Red Butte Creek, for the most part, appear to be comparable to or less than risks for ambient conditions in reference creeks, the need for verification may not be considered essential to support decision-making.

Draft
ERM 1 UDEQ/0145323 – 2012 June
1.0 INTRODUCTION
Red Butte Creek is a perennial third-order stream found in Salt Lake City, Utah. Red Butte Creek has a lengthy wild land reach in the Wasatch Front Range, and then flows through residential/urban reaches before entering the Jordan River. On 12 June 2010, approximately 800 barrels of a 33 API (= sp. gr. 0.825) crude oil was released (hereafter referred to as the Incident) into Lower Red Butte Creek just downstream of the Red Butte Garden Arboretum (Chevron Pipeline Company [CPL] 2011). Immediately following the Incident (summer/fall 2010), Phase 1 of the creek cleanup was initiated. Approximately 400 barrels were recovered at the spill site on land and about 400 barrels entered Lower Red Butte Creek. As of 9 September 2010, a total of 778 of the 800 barrels were accounted for through recovery from water, soil removal, and evaporation (CPL 2011).
On behalf of the Utah Department of Environmental Quality (UDEQ) Division of Water Quality, the oversight agency of the Incident, ERM has prepared this Ecological Risk Assessment (ERA) to assess the potential risks to biota associated with residual oil in Lower Red Butte Creek in Salt Lake City County, Utah.
1.1 INCIDENT HISTORY
Under the oversight of the Unified Command, CPL initiated cleanup, recovery, and restoration activities. Immediate measures were taken to minimize the impact of the crude oil. Remediation activities were carried out in accordance with the approved Removal Action Plan (ENACT 2010) developed by CPL, Salt Lake City, Salt Lake Valley Health Department (SLVHD), and UDEQ. Response measures included maintaining boom operations and deploying emergency response equipment. Phase 1 of the creek cleanup consisted of crews working the length of the creek (i) manually washing the creek to remove oil from rocks, sediments, and vegetation; and (ii) flushing the creek with high water flow. Efforts to restore conditions within the riparian corridor of this urban creek included restoring vegetation, stabilizing banks, and re-introducing native trout.
1.2 OVERVIEW OF THE ECOLOGICAL RISK ASSESSMENT
The ERA process is used to systematically evaluate and organize data, assumptions, and uncertainties to help understand and predict the

Draft
ERM 2 UDEQ/0145323 – 2012 June
relationships between stressors and ecological effects in a way that is useful for environmental decision-making (USEPA 1989). The purpose of this ERA is to evaluate the potential for adverse ecological impacts that may occur as a result of potential exposures to residual concentrations of spill-related petroleum hydrocarbons following remediation efforts in Lower Red Butte Creek. Methods used to conduct the ERA are discussed in further detail in Appendix A of this report and are consistent with the following State of Utah and USEPA guidance:
Utah Administrative Code, Rule R315-101-5, Health Evaluation Criteria, Risk Assessment;1
Framework for Ecological Risk Assessment (USEPA 1992a);
Ecological Risk Assessment Guidance for Superfund: Process for Designing and Conducting Ecological Risk Assessments (USEPA 1997); and
Guidelines for Ecological Risk Assessment (USEPA 1998).
Findings of this ERA2 are intended to support evaluations/determinations of whether:
The remediation response was sufficient to protect biota of concern;
A more detailed ERA is warranted for this urban creek; and/or
There is a need for additional risk management actions, and, if needed, what is the scope of these actions.
1.2.1 Tiered Approach
A tiered ERA approach is being employed as needed (Figure 1-1) and includes:
Tier 1: Screening-Level ERA (SLERA);
Tier 2: Baseline ERA (BERA); and
Tier 3: Probabilistic ERA (PERA).
1 Utah Administrative Code, Rule R315-101-5, Health Evaluation Criteria, Risk
Assessment specifically applies to Hazardous Waste sites. Nonetheless, where possible, this ERA will be consistent with this State rule.
2 The findings of the Reference Creek (Ambient) Evaluation (Section 4) were used to determine whether the source of the hydrocarbons detected in Lower Red Butte Creek were related to the Incident.

Draft
ERM 3 UDEQ/0145323 – 2012 June
A scientific/management decision point exists at the conclusion of each tier, when it will be decided:
1. Whether or not the risk assessment, in its current state, is sufficient to support decision-making; and
2. If the assessment is determined to be insufficient, whether or not refinement of the current tier or progression to the next tier would provide a sufficient benefit to warrant the additional effort.
Advantages of a tiered approach include:
Provides opportunities for regular input and direction by decision-makers;
Provides a logical, stepwise approach for compiling and analyzing more site-specific information and incorporating more realistic assessments of exposure and effects; and
Provides opportunities to streamline and focus the ERA-related effort.
1.2.2 Elements and Key Features of this Ecological Risk Assessment
This report focuses on the approach and findings of the SLERA conducted for Lower Red Butte Creek. Elements of this SLERA include (Figure 1-2):
Problem formulation;
Exposure assessment;
Effects assessment; and
Risk characterization.
Key features of this SLERA include:
Where applicable and possible, the SLERA is consistent in approach and methodology with the human health risk assessment (HHRA) that is being performed concurrently.
UDEQ (2005) TPH Fractionation guidance was used to evaluate total petroleum hydrocarbons (TPH). UDEQ’s fractionation guidance builds on approaches previously described by the Total Petroleum Hydrocarbon Criteria Working Group (TPHCWG) and the Massachusetts Department of Environmental Protection (MaDEP).

Draft
ERM 4 UDEQ/0145323 – 2012 June
Where UDEQ TPH benchmarks were lacking, MaDEP benchmarks3 were used to evaluate potential risks due to exposures to petroleum hydrocarbons—specifically, to aliphatic and aromatic carbon-chain fractions.
Reference creeks were identified to characterize ambient conditions of urban creeks not impacted by the Incident and were established to correctly identify concentrations and biological responses attributable to the Incident. Reference creeks identified in the Red Butte Creek Crude Oil Spill Water, Sediment and Macroinvertebrate Sampling Plan, v. 17 (CPL 2011) and used in this ERA are Emigration Creek, Parleys Creek, City Creek, and Mill Creek.4
In-creek benthic community structure was evaluated as an added line of evidence to characterize the ecological significance of any identified ecological risks.
3 MaDEP (2002, 2007)
4 Emigration Creek, Parleys Creek, City Creek, and Mill Creek were not affected by the Incident and are considered to be representative of urban creeks in the Salt Lake City area (CPL 2011). Like Red Butte Creek, these reference creeks have lengthy wild land reaches in the Wasatch front range, and then flow through residential/urban reaches before entering the Jordan River. Emigration Creek, Parleys Creek, City Creek, and Mill Creek were not affected by the Incident and are considered to be representative of urban creeks in the Salt Lake City area (CPL 2011).

Draft
ERM 5 UDEQ/0145323 – 2012 June
2.0 SITE DESCRIPTION
Descriptions of Lower Red Butte Creek were primarily obtained from:
Salt Lake City Riparian Corridor Study: Final Red Butte Creek Management Plan (Bio-West 2010);
Red Butte Creek Crude Oil Spill Water, Sediment and Macroinvertebrate Sampling Plan (CPL 2011); and
Utah Division of Wildlife Resources documents.5
This site description is intended to give a general sense of the setting in Lower Red Butte Creek. It is not intended to be a treatise on the abiotic/biotic features of Lower Red Butte Creek.
2.1 LOCATION / GENERAL SETTING
Red Butte Creek is a narrow rocky creek located between City Creek to the north and Emigration Creek to the south (CPL 2011; Bio-West 2010) (Figure 2-1). For the purposes of the ERA and consistent with the Final Red Butte Creek Management Plan (Bio-West 2010), Red Butte Creek has been divided into Upper Red Butte Creek (upstream of Red Butte Gardens) and Lower Red Butte Creek (downstream of Red Butte Gardens). Upper Red Butte Creek drains approximately 5,400 acres of mountainous land primarily owned and managed by the U.S. Forest Service. Red Butte Reservoir and the Red Butte Creek Research Natural Area are located in Upper Red Butte Creek.
Lower Red Butte Creek passes through an urban area where multiple point and nonpoint sources likely input to the creek. The open channel portion of Lower Red Butte Creek terminates at approximately 900 East where the creek enters a series of culverts that discharge to Liberty Park Lake at Liberty Park. The 1300 South conduit then conveys the flows from Lower Red Butte Creek and Emigration Creek to the Jordan River via a 3.4-mile long pipe. One function of the impacted portion of Lower Red Butte Creek is as an urban storm water conveyance system. There are campus parking lots and roadways immediately adjacent to the spill site.
5 http://wildlife.utah.gov/dwr/
Draft
ERM 6 UDEQ/0145323 – 2012 June
The impacted reach drops about 750 feet over a reach of 18,000 feet, averaging approximately a 4 percent drop (Figure 2-2).
2.2 GEOLOGY
The surface geology of the Upper Red Butte Creek is composed of various members of the Triassic Ankareh formation as well as Jurassic/Triassic Nugget Sandstone (Bio-West 2010). Approximately 50 to 86 percent of the soils in the upper subwatershed have severe erosion potential. Lower Red Butte Creek flows through deposits ranging in size from finer-grained silt and clay to coarser sand and gravel deposits where 20 to 35 percent of the soil has severe to very severe erosion potential. Median streambed particle sizes range from 12 to 75 millimeters. Medium and large-sized gravel are the dominant substrate sizes in riffle areas of Lower Red Butte Creek.
2.3 IN-CREEK FLOWS
Red Butte Creek has a perennial flow upstream of Red Butte Reservoir and is considered to have “perennial-reduced” flow below that point (Bio-West 2010). Although flow is regulated by the Red Butte Reservoir, the creek’s hydrology is characterized by a distinct springtime peak in flow, which is typical of snowmelt systems. Flows in Lower Red Butte Creek are “flashy” with rapid, brief rises in flow during storms, a typical pattern followed by urban creeks. Average annual high flows are 22 cubic feet per second (cfs), while typical base flows are 2 cfs. Episodic high flows are likely to affect the transport/spatial distribution of chemicals, as well as physically affect biotic communities.
2.4 FLORA AND FAUNA
The most common trees along the streamside areas of Red Butte Creek are box elder (Acer negundo) and cottonwood (Populus sp.), with Gambel oak (Quercus gambelii) dominant in undeveloped upper slope areas. Siberian elm (Ulmus pumila), an introduced invasive tree species, is also fairly common. Russian olive (Elaeagnus angustifolia), an introduced invasive tree, is present, but less prominent. Common shrub species include redosier dogwood (Cornus sericea), twinberry honeysuckle (Lonicera involucrata), and narrowleaf willow (Salix exigua), with Woods’ rose (Rosa woodsii) common on upper portions of slopes. The understory vegetation layer includes native species such as Western poison ivy (Toxicodendron rydbergii) and Virginia creeper (Parthenocissus quinquefolia), and field horsetail (Equisetum arvense). Introduced species such as ornamental

Draft
ERM 7 UDEQ/0145323 – 2012 June
English ivy (Hedra helix), common periwinkle (Vinca minor), climbing nightshade (Solanum dulcamara), smooth brome (Bromus inermis), and lesser burdock (Arctium minus) are significant components of the understory cover in several reaches. In addition, the upper slope portions of some reaches contain the invasive species whitetop (Cardaria draba) and houndstongue (Cynoglossum officinale). Canopy (tree) cover is generally high, though is markedly reduced in the lower urban reaches (Bio-West 2010).
A review of the Utah Natural Heritage Program’s Biodiversity Tracking and Conservation System, Utah Division of Wildlife Resources, and U.S. Fish and Wildlife Service found (i) no federal- or state-listed threatened and endangered species; and (ii) no designated critical habitat residing in the reach of interest for Lower Red Butte Creek. A refuge population of endangered June sucker (Chasmistes liorus) currently inhabits Red Butte Reservoir (Bio-West 2010). However, Red Butte Reservoir is located upstream of the spill site, and there are no known occurrences of the June sucker in Lower Red Butte Creek.
A managed population of native Bonneville cutthroat trout (Oncorhynchus clarki utah) exists in the creek above the Red Butte Reservoir (Bio-West 2010). Lower Red Butte Creek is not reported in agency publications as supporting a fishery (SLCO 2009), but trout have been observed in the creek, perhaps from private landowners stocking small numbers of trout for fishing (Bio-West 2010).
Bio-West (2010) concludes that limited information is available about the wildlife of the urban lower portion of Red Butte Creek. Deer, raccoon, and skunk have been observed along the Lower Red Butte Creek. During the Audubon Society’s 2005 Christmas bird count, over 30 different species of birds were observed within the University of Utah survey area, which includes portions of the Lower Red Butte Creek riparian corridor (Bio-West 2010). Miller Bird Refuge and Bonneville Glen Park are generally recommended for recreational bird watching.

Draft
ERM 8 UDEQ/0145323 – 2012 June
• This page intentionally left blank •

Draft
ERM 9 UDEQ/0145323 – 2012 June
3.0 DATA EVALUATION
The following subsections describe data collection, data validation, and data usability in support of this ERA, as well as the handling of non-detected values.
3.1 DATA COLLECTION
In August 2011, bank soil, creek bed sediment, water, and benthic macroinvertebrate samples were collected in Lower Red Butte Creek and identified reference (urban) creeks in Salt Lake City, Utah. Data collection activities were designed to characterize (i) concentrations of petroleum-related constituents and (ii) structure of benthic macroinvertebrate communities for use in the risk assessment.
For consistency and where possible to provide a baseline data set, all methods used to conduct the field collection and laboratory analyses were the same as those described in the Red Butte Creek Crude Oil Spill Water, Sediment and Macroinvertebrate Sampling Plan v. 17 [Incident Monitoring Sampling and Analysis Plan (SAP)] (CPL 2011).
3.1.1 Sampling Locations
Sampling stations were added to supplement sampling stations identified in the Incident Monitoring SAP to provide sufficient sample numbers in support of the SLERA (Table 3-1).
Table 3-1. Incident Monitoring Sampling and Analysis Plan and Supplemental Sampling Stations to Support the Ecological Risk Assessment
Site
Surface Water & Sediment Chemistry Macroinvertebrate
SAPa ERAb # Samples
SAPa ERAb # Samples
Upstrc Urband Upstrc Urband
Lower Red Butte Creek 7 6e 1 12 3 6 1 8
Reference Creeks Emigration Creek 1 3 1 3 2 1 1 2 Parley’s Creek 1 3 0 4 0 2 0 2 Mill Creek 1 3 1 3 2 1 1 2 City Creek 1 3 2 2 1 2 1 2
Total Lower Red Butte Creek d 12 8 Total Reference Creeksd 12 8
Notes: a. Sampling locations from the Incident Monitoring SAP.
Draft
ERM 10 UDEQ/0145323 – 2012 June
3.1.1.1 Lower Red Butte Creek Sampling Locations
Bank soil, creek bed sediment, surface water, and benthic macroinvertebrate samples were collected within Lower Red Butte Creek (Table 3-1). The 12 downstream locations were selected to characterize the potential nature and extent of residual incident-related impacts within Lower Red Butte Creek (CPL 2011) (Figure 3-1; Table 3-1).
3.1.1.2 Reference Creek Sampling Locations
Petroleum hydrocarbons are commonly detected in urban storm water. Hence, to establish relevant ambient concentrations of petroleum hydrocarbons and to assess potential risks attributable to the Incident, bank soil, creek bed sediment, surface water, and benthic macroinvertebrate samples were also collected for the following reference creeks6 selected for Lower Red Butte Creek (Figure 3-1; Table 3-1):
Emigration Creek City Creek
Parleys Creek Mill Creek
Like Red Butte Creek, these reference creeks have lengthy wild land reaches in the Wasatch Front Range, and then flow through residential/urban reaches before entering the Jordan River (Figure 2-1).7 Emigration Creek, Parleys Creek, City Creek, and Mill Creek were not affected by the Incident and are considered to be representative of ambient (reference) levels of hydrocarbons present in urban creeks in the Salt Lake City area (CPL 2011).
Photographs of Lower Red Butte Creek and reference creeks are provided in Appendix B.
6 Emigration Creek, Parleys Creek, City Creek, and Mill Creek are considered
representative of the background (ambient) levels of hydrocarbons present in Lower Red Butte Creek (CPL 2011).
7 The identified reference creeks have land uses and land covers roughly similar to Red Butte Creek.
b. Sampling locations added to support the ERA. c. Sampling locations in upstream (of spill) or natural reach of creeks. d. Sampling locations in urbanized reach of creeks. e. Assumes that the same sample can be used to support both the HHRA and ERA.

Draft
ERM 11 UDEQ/0145323 – 2012 June
3.1.2 Media and Analytes of Interest
Surface water, sediment, and bank soil samples were analyzed for:
TPH;
Volatile organic compounds (VOCs), including benzene, toluene, ethylbenzene, xylenes (BTEX); and
Semivolatile organic compounds (SVOCs), including polycyclic aromatic hydrocarbons (PAHs); and
Grain size and total organic carbon [for soil and sediment only].
3.1.3 Benthic Macroinvertebrates
Benthic macroinvertebrate samples were collected by Division of Water Quality personnel and analyzed by the National Aquatic Monitoring Center (also known as the “BugLab”) at Utah State University. To the extent possible, macroinvertebrate sampling locations were co-located with surface water and sediment sampling stations to facilitate correlation of chemistry and biological data. Collection of macroinvertebrate community structure data is intended to provide additional evidence for characterizing/verifying potential ecological risks due to exposures to residual Incident-related petroleum hydrocarbons. The following community metrics were computed and provided by the BugLab at Utah State University:
Taxa richness Hilsenhoff biotic index (HBI)
Evenness Percent chironomids8
Species diversity Percent EPT9
For further discussion regarding the use and interpretation of these community metrics, please see Sections 7.4 and 8.3.
8 midge—considered to be a pollutant-tolerant taxa (USEPA 1999b).
9 ephemeroptera (mayfly), plecoptera (stonefly), and trichoptera (caddisfly)—considered to be pollutant-sensitive taxa (USEPA 1999b).

Draft
ERM 12 UDEQ/0145323 – 2012 June
3.2 DATA VALIDATION
Data validation was conducted according to USEPA National Functional Guidelines (NFGs) (USEPA 1999a, 2004). Newer NFGs are available, but they are guidelines for USEPA’s Contract Laboratory Program methods. The SW-846 methods are better represented by the earlier versions of NFGs.
3.2.1 Analytical Chemistry Data Quality Control
All of the chemistry data were subject to a Level II review. A Level II review consists of a review of all sample-related quality control parameters, including holding times, blank contamination, laboratory control sample, matrix spike/matrix spike duplicate, and surrogates.
In addition, a Level IV data validation was conducted on 10 percent of the data. Level IV data validation consisted of a review of all parameters reviewed as part of the Level II review with additional review of instrument performance check (as applicable), initial and continuing calibrations, and internal standards (as applicable). In addition, Level IV includes review of the raw data, including chromatograms, log books, quantitation reports, and spectra.
Appropriate validation qualifiers were assigned to the data. All of the data, including qualified data, were considered usable and no data were rejected. The Quality Assurance/Quality Control (QA/QC) memorandums are included as Appendix C.
3.2.2 Benthic Macroinvertebrate Data Quality Control
Benthic macroinvertebrate data underwent the BugLab quality control procedures. The following three potential sources of error were carefully checked to assure quality of the data:
Sample sorting;
Macroinvertebrate identification; and
Data processing.
Sample Sorting. Fifteen percent of all sorted samples were examined to ensure that at least 95 percent of the organisms were removed from the examined material. A sorting effectiveness (Es) number was computed as:
Es = 100 * S / (R + S) …Eq 3-1

Draft
ERM 13 UDEQ/0145323 – 2012 June
Where R is the total number of organisms obtained during the resort of the remnant material and S is the total number of organisms originally obtained from the sample sorting. All samples exceeded the goal of greater than or equal to 95 percent of the organisms removed during the original sort. The average sorting effectiveness was 96.5 percent.
Macroinvertebrate Identification. To assure consistency in sample identification, at least 10 percent of the samples were re-identified by a second taxonomist. The identifications performed by the taxonomists were 99.2 percent similar as measured by the Bray-Curtis similarity index.
Data Processing. Ten percent of samples within this data set were checked against the bench sheets to ensure the accuracy of all of the information.
3.3 DATA USABILITY
The primary objective of the data review and usability evaluation was to identify appropriate data for use in the risk assessment. The analytical data were reviewed for applicability and usability following procedures in the Guidance for Data Usability in Risk Assessment (Part A) (USEPA 1992b, and USEPA 1989). According to USEPA Data Usability Guidance, there are six principal evaluation criteria by which data are judged for usability in risk assessment. The six criteria are:
Availability of information associated with site data;
Documentation;
Data sources;
Analytical methods and detection limits;
Data review; and
Data quality indicators, including precision, accuracy, representativeness, comparability, and completeness.
A summary of the findings of the data usability effort in support of the ERA is provided in the Data Usability Worksheet from the Risk Assessment Guidance for Superfund: Volume I Human Health Evaluation Manual – Part D (USEPA 2001a). The Data Usability Worksheet summarizes the criteria used to identify data usability and is presented in Table 3-2.

Draft
ERM 14 UDEQ/0145323 – 2012 June
Table 3-2. Incident Monitoring Sampling and Analysis Plan and Supplemental Sampling Stations to Support the Ecological Risk Assessment
Activity Comment
Field Sampling Discuss sampling problems and field conditions that affect data usability.
No field conditions resulted in poor sample recovery.
Are samples representative of receptor exposure for this medium (e.g. sample depth, grab vs composite, filtered vs unfiltered, low flow, etc.)?
All samples were discrete samples. All samples were representative of receptor exposures and analyzed for a broad spectrum of analyses.
Were samples appropriately documented and can they be correlated to a specific geographic location?
All samples reported by the laboratory were documented on the chain-of-custodies and were correlated to a specific geographic location.
Assess the effect of field QC results on data usability.
No QAPP was available. Field, equipment and trip blanks and soil duplicate samples were collected during all field sampling activities. No qualifications were made based upon field QC results.
Summarize the effect of field sampling issues on the risk assessment, if applicable.
There were no field sampling issues that affected the data quality for risk assessment purposes.
Analytical Techniques Were the analytical methods appropriate for quantitative risk assessment?
Yes the analytical techniques used were appropriate for risk assessment purposes. Analytical techniques for followed USEPA guidelines.
Were detection limits adequate?
Yes, detection limits were adequate for risk assessment purposes.
Summarize the effect of analytical technique issues on the risk assessment, if applicable.
There were no issues raised which were particular to the analytical techniques used. Analytical techniques for soils and water followed USEPA-based guidelines.
Data Quality Indicators Precision - How were duplicates handled? The field duplicate samples were compared for
consistency (RPD was calculated) and the maximum detection or the minimum reporting limit was selected. Several chemical were analyzed by multiple analyses (e.g. PAHs by 8270SIM and 8270). In a few cases, the laboratory result for PAHs (EPA 8270SIM) exceeded the calibration range. In that case, the laboratory indicated to use the result from the EPA 8270C analysis.
Draft
ERM 15 UDEQ/0145323 – 2012 June
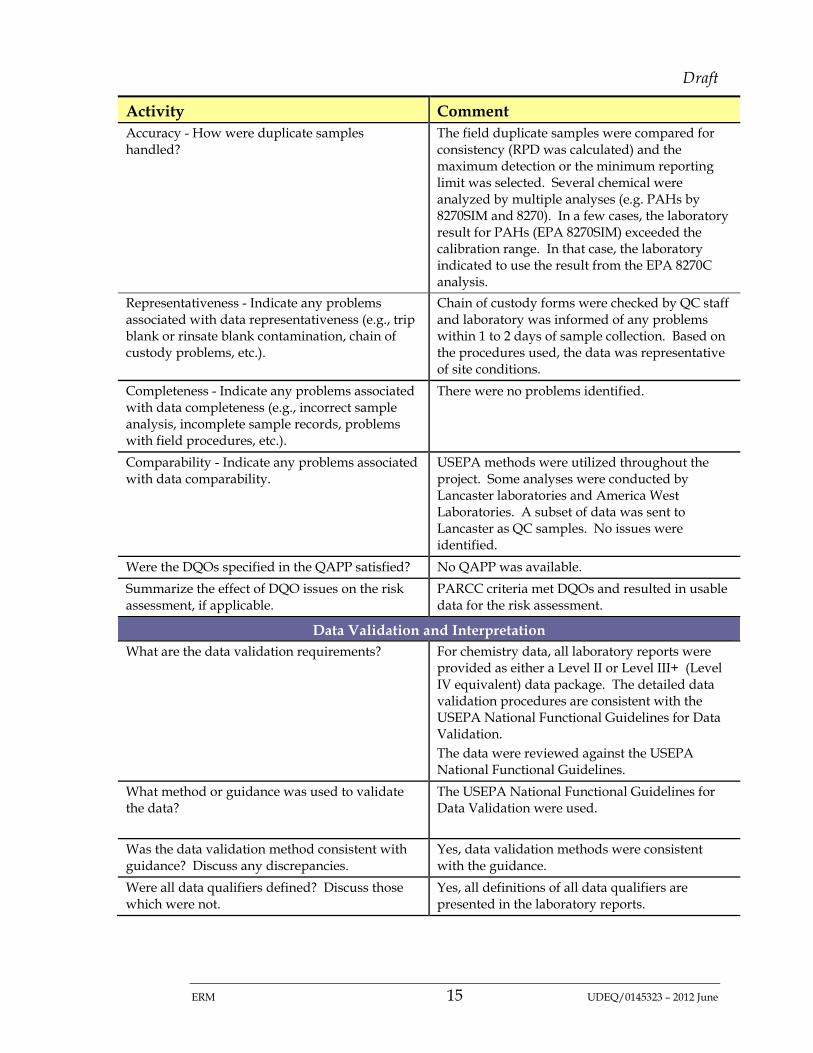
Activity Comment Accuracy - How were duplicate samples handled?
The field duplicate samples were compared for consistency (RPD was calculated) and the maximum detection or the minimum reporting limit was selected. Several chemical were analyzed by multiple analyses (e.g. PAHs by 8270SIM and 8270). In a few cases, the laboratory result for PAHs (EPA 8270SIM) exceeded the calibration range. In that case, the laboratory indicated to use the result from the EPA 8270C analysis.
Representativeness - Indicate any problems associated with data representativeness (e.g., trip blank or rinsate blank contamination, chain of custody problems, etc.).
Chain of custody forms were checked by QC staff and laboratory was informed of any problems within 1 to 2 days of sample collection. Based on the procedures used, the data was representative of site conditions.
Completeness - Indicate any problems associated with data completeness (e.g., incorrect sample analysis, incomplete sample records, problems with field procedures, etc.).
There were no problems identified.
Comparability - Indicate any problems associated with data comparability.
USEPA methods were utilized throughout the project. Some analyses were conducted by Lancaster laboratories and America West Laboratories. A subset of data was sent to Lancaster as QC samples. No issues were identified.
Were the DQOs specified in the QAPP satisfied? No QAPP was available.
Summarize the effect of DQO issues on the risk assessment, if applicable.
PARCC criteria met DQOs and resulted in usable data for the risk assessment.
Data Validation and Interpretation What are the data validation requirements?
For chemistry data, all laboratory reports were provided as either a Level II or Level III+ (Level IV equivalent) data package. The detailed data validation procedures are consistent with the USEPA National Functional Guidelines for Data Validation. The data were reviewed against the USEPA National Functional Guidelines.
What method or guidance was used to validate the data?
The USEPA National Functional Guidelines for Data Validation were used.
Was the data validation method consistent with guidance? Discuss any discrepancies.
Yes, data validation methods were consistent with the guidance.
Were all data qualifiers defined? Discuss those which were not.
Yes, all definitions of all data qualifiers are presented in the laboratory reports.

Draft
ERM 16 UDEQ/0145323 – 2012 June
Activity Comment Which qualifiers represent usable data?
All data collected and validated are usable as qualified unless they are rejected with an R symbol.
Which qualifiers represent unusable data? Data qualified as “R” (rejected) represents unusable data. No data were rejected.
How are tentatively identified compounds handled?
TICs were not evaluated in the risk assessment.
Summarize the effect of data validation and interpretation issues on the risk assessment, if applicable.
Valid data were sufficient to perform the risk assessment. All data collected and validated are usable for the risk assessment as qualified.
Additional notes:
3.4 HANDLING NON-DETECTED VALUES
Non-detects (NDs) or “left censored” data are inevitable in many environmental data sets. An organic compound was presumed not to exist in a particular environmental medium if it was never detected (100 percent non-detect) and detection limits met data quality objectives. Consistent with guidance (USEPA 1989), constituents that were detected at a frequency less than 5 percent were not quantitatively evaluated in this ERA. The omission of a quantitative evaluation for these rarely detected constituents is discussed further in the uncertainty analysis (Section 8.6).
When greater than 5 percent of the data were comprised of non-detected concentrations, NDs were handled in accordance with guidance (USEPA 2006, 2010) and are described further in Appendix D. Appendix D also presents (i) descriptive statistics, including the 95 percent upper confidence limits (95UCLs) and (ii) comparisons between Lower Red Butte Creek and reference creeks.

Draft
ERM 17 UDEQ/0145323 – 2012 June
4.0 REFERENCE CREEK (AMBIENT) EVALUATION
Reference creeks were selected to represent in-creek conditions having similar environmental expectations as Lower Red Butte Creek in the absence of the effects of the Incident. As such, reference creeks can be used to characterize the ”reasonable attainable“ state and can provide the point-of-reference to assess the potential impairment.
A reference creek (ambient) evaluation was performed by McDaniel-Lambert to support both the HHRA and ERA (McDaniel-Lambert 2012) (see Appendix D). In this reference creek (ambient) evaluation, PAH concentrations in Lower Red Butte Creek were compared to reference creeks for each of the following media of concern:
Media of Concern: Evaluate Exposures For:
Surface water Aquatic biota
Creek bed sediments Benthic macroinvertebrates
Creek soil/sediment10 Riparian birds and mammals
The purpose of this evaluation was to determine whether concentrations of PAHs detected in samples within Lower Red Butte Creek are comparable to concentrations of PAHs detected in reference creeks.
A weight of evidence was used in this evaluation, including statistical tests, background threshold values (BTVs), and PAH diagnostic ratio comparisons. The exploratory analyses and comparative methods used are based on USEPA guidance (USEPA 2002). All statistical comparisons were conducted using USEPA’s ProUCL v. 4.01.00. A more detailed discussion of this evaluation is found in the draft Human Health Risk Assessment (McDaniel-Lambert 2012). Findings are briefly discussed below.
10 While riparian wildlife may be exposed to both creek bank and creek bed substrate
(combined bank soil and creek bed sediment), benthic macroinvertebrates were considered to be exposed only to creek bed (in-creek) sediments.
Draft
ERM 18 UDEQ/0145323 – 2012 June
4.1 STATISTICAL COMPARISONS
Concentrations of petroleum-related hydrocarbons in Lower Red Butte Creek were compared to concentrations in reference creeks using one of the following two-sample statistical tests: (i) parametric t-test, or (ii) nonparametric Gehan test. In accordance with USEPA guidance (2002, 2010), the appropriate test was selected based on (McDaniel-Lambert 2012):
Sample size (tests used only when sample size is eight or greater);
Distribution of the data (normal or not normal);
Equal or unequal variances; and
Percent detected values.
These 2-sample tests evaluate the hypothesis:
Ho: Mean/median concentrations in Lower Red Butte Creek are less than mean/median concentrations in reference creek.
To supplement the two-sample tests, the quantile test was conducted to evaluate the hypothesis (USEPA 2002):
Ho: High concentrations in Lower Red Butte Creek are less than high concentrations in reference creeks.
Surface Water. Two constituents were detected in 1 of 17 surface water samples: bis(2-ethylhexyl)phthalate and bromoform. Given the number of detects, no statistical comparisons were conducted for these compounds.
Creek Bed Sediments. The following 11 PAHs that were detected in Lower Red Butte Creek were not evaluated because there were insufficient detected concentrations (i.e., less than four detected concentrations):
1-Methylnapthalene Benzo(k)fluoranthene
2-Methylnapthalene Dibenzo(a,h)anthracene
Benzo(a)anthracene Indeno(1,2,3-cd)pyrene
Benzo(b)fluoranthene Naphthalene
Benzo(g,h,i)perylene
Findings of statistical tests for the remaining PAHs, TPH-diesel, and TPH-motor oil suggest (from Table 5 of McDaniel-Lambert 2012):

Draft
ERM 19 UDEQ/0145323 – 2012 June
There is no difference in median (central tendency) concentrations of PAHs detected in creek bed sediments between Lower Red Butte Creek and reference creeks. 11
There is no difference in high concentrations of PAHs detected in creek bed sediments between Lower Red Butte Creek and reference creeks.
Creek Soil/Sediment. Five PAHs that were detected in Lower Red Butte Creek were not evaluated because there were insufficient detected concentrations—i.e., less than four detected concentrations:
1-Methylnapthalene Fluorene
2-Methylnapthalene Naphthalene
Dibenzo(a,h)anthracene
Findings of statistical tests for the remaining PAHs, TPH-diesel, and TPH-motor oil suggest (from Table 2 of McDaniel-Lambert 2012):
There is no difference in median (central tendency) concentrations of PAHs detected in soil/sediment between Lower Red Butte Creek and reference creeks. 12
There is no difference in high concentrations of PAHs detected in soil/sediment between Lower Red Butte Creek and reference creeks.
4.2 COMPARISION TO BACKGROUND THRESHOLD VALUES
There are uncertainties regarding the power of statistical comparisons to discern differences (McDaniel-Lambert 2012). In addition, visual examination of Q-Q plots indicated inconsistencies with statistical tests for some PAHs and TPH-motor oil. Therefore, individual location observations for soil/sediment were compared against BTVs13 calculated from reference creek data to determine whether specific location concentrations are within reference creek (ambient) levels. Unlike the soil/sediment data, the creek bed sediment data did not show excessive evidence of potential hotspots with higher concentrations for the PAHs
11 Do not reject the Ho hypothesis.
12 Do not reject the Ho hypothesis.
13 BTVs were defined as the 95th percentile upper prediction limits (UPLs) (McDaniel-Lambert 2012).
Draft
ERM 20 UDEQ/0145323 – 2012 June
evaluated—therefore, a BTV analysis was determined to be unnecessary (McDaniel-Lambert 2012).
The BTV analysis for soil/sediment suggests that elevated site PAH concentrations may occur in localized areas of Lower Red Butte Creek—namely 1731 East 900 South, Above 1500 East, and 1225 East Harvard Avenue. All other sampling locations are within expected reference creek (ambient) levels (Table 3 of McDaniel-Lambert 2012).
4.3 POLYCYCLIC AROMATIC HYDROCARBONS COMPOSITION ANALYSIS
A PAH composition analysis was conducted to determine which of the primary sources of PAHs commonly found in urban waterways might be the source of PAHs in Lower Red Butte Creek. These primary sources include:
Pyrogenic: hydrocarbon compounds associated with the combustion of petroleum, wood, coal, etc.;
Petrogenic: hydrocarbon compounds associated with petroleum, including fuel oils, coal, and lubricants; and
Biogenic: associated with plant matter.
The following double-ratio cross plots were used as an exploratory tool to distinguish between pyrogenic and petrogenic sources:
Benzo(a)anthracene to chrysene versus fluoranthene to pyrene; and
Benzo(a)anthracene to benzo(a)pyrene versus fluoranthene to benzo(a)pyrene.
This analysis shows overlap among the Lower Red Butte Creek and reference creek samples, with no distinct clustering. These findings reveal no differences in relative composition of PAHs and suggest that PAH sources in Lower Red Butte Creek and reference creeks are similar (i.e., urban runoff) (McDaniel-Lambert 2012).
4.4 SUMMARY
There were insufficient data to conduct reference creek (ambient) comparisons for:
Bis(2-ethylhexyl)phthalate and bromoform in surface water

Draft
ERM 21 UDEQ/0145323 – 2012 June
1-Methylnapthalene, 2-methylnapthalene, anthracene, benzo(a)anthracene, benzo(b)fluoranthene, benzo(g,h,i)perylene, benzo(k)fluoranthene, dibenzo(a,h)anthracene, fluorine, indeno(1,2,3-cd)pyrene, and naphthalene in creek bed sediments
1-Methylnapthalene, 2-methylnapthalene, dibenzo(a,h)anthracene, fluorene, and naphthalene in soil/sediment.
However, where there were at least six detections, findings of both two-sample and quantile tests suggest that concentrations of PAHs and TPH in Red Butte Creek were comparable or less than in reference creeks.
There are uncertainties regarding the power of statistical comparisons to discern differences (McDaniel-Lambert 2012). In addition, visual examination of Q-Q plots indicated inconsistencies with statistical tests for some PAHs and TPH-motor oil. Hence, individual site observations were compared against a BTV to determine whether or not point-by-point site concentrations are within reference creek concentrations. The BTV analysis supports the conclusion that elevated site PAH concentrations occur in localized areas of Lower Red Butte Creek—namely 1731 East 900 South, Above 1500 East, and 1225 East Harvard Avenue. All other sampling locations are within expected reference creek (ambient) levels.
The PAH composition analysis did not reveal any differences between Lower Red Butte Creek and background PAH ratios, including the PAH ratios for the maximum detections in Lower Red Butte Creek sediment. These findings suggest that petroleum-related hydrocarbons detected in Red Butte Creek appear to be consistent with PAHs typical of urban run-off.
For the most part, the weight of evidence shows that most Lower Red Butte Creek PAHs are consistent with reference creek (ambient) sources; however, a few creek locations exceed background levels. However, for the purposes of this SLERA, comparisons to reference creek concentrations were not used to identify constituents of potential ecological concern (Section 5.2) and findings of this reference creek (ambient) evaluation will be discussed in the uncertainty analysis and conclusions.

Draft
ERM 22 UDEQ/0145323 – 2012 June
• This page intentionally left blank •

Draft
ERM 23 UDEQ/0145323 – 2012 June
5.0 PROBLEM FORMULATION
Problem formulation establishes the scope of the ecological risk assessment, identifies the major factors to be considered, and ensures that ecological receptors likely to be exposed and exposure scenarios most likely to contribute to ecological risk are evaluated.
As described in the ERA work plan (Appendix A), problem formulation consists of the following:
Identify biotic receptors of concern (BROC);
Identify constituents of potential ecological concern (COPECs);
Identify potentially complete exposure pathways; and
Establish assessment endpoints.
5.1 BIOTIC RECEPTORS OF CONCERN
Given the number of species and the complexity of biological communities, all species present in Lower Red Butte Creek cannot be individually assessed. BROCs were identified to (1) focus the ERA on those receptors of concern, and (2) develop specific assessment endpoint statements.
Consistent with guidance (USEPA 1998), BROCs were identified and consider:
Biota of regulatory interest – species and habitats that are protected by federal and state regulations;
Biota of commercial/recreational interest – species that have an economic or recreational value (e.g. crops, livestock, fisheries, hunted game);
Biota of resource management interest or habitats/species that may support functional attributes (e.g., flood control); and
Biota of ecological interest – species that play an important role in mediating processes or interactions that affect the structure/function,

Draft
ERM 24 UDEQ/0145323 – 2012 June
or biodiversity of native habitats, communities, or ecosystems (e.g., keystone species).14
All trophic levels, including primary producers, were considered.
Biota of Regulatory Interest. No federal- or state-listed threatened and endangered species reside and no designated critical habitat was identified in the reach of interest for Lower Red Butte Creek. A refuge population of endangered June sucker (Chasmistes liorus) currently inhabits Red Butte Reservoir (Bio-West 2010). However, Red Butte Reservoir is located upstream of the spill site, and there are no known occurrences of the June sucker in Lower Red Butte Creek.
Biota of Commercial/Recreational Interest. Lower Red Butte Creek is not reported in agency publications as supporting a fishery (SLCO 2009), but trout have been observed in the creek, perhaps from private landowners stocking small numbers of trout for fishing (Bio-West 2010).
Biota of Ecological Interest. Members of the following guilds were considered to play a key role in maintaining the structure/function of in-creek and riparian habitats and these guilds were identified as BROCs:
In-Creek Biota Riparian Biota
Aquatic plants Reptiles13
Aquatic invertebrates Waterfowl/shorebirds
Benthic macroinvertebrates Mammals
Fish
Amphibians15
The SLERA for Lower Red Butte Creek focuses largely on in-creek biota and riparian wildlife. As toxicity benchmarks used in this SLERA are
14 Plants and animals that provide shelter and/or food for special status species were
also considered when identifying receptors of ecological concern.
15 Given the lack of relevant widely accepted toxicity benchmarks, no quantitative evaluation of amphibians or reptiles will be conducted. The lack of a quantitative evaluation for amphibians and reptiles will be qualitatively discussed in the uncertainty analysis (Section 8.6).

Draft
ERM 25 UDEQ/0145323 – 2012 June
inclusively protective of aquatic plants, aquatic invertebrates, and fishes, these receptors will be combined and evaluated as Aquatic Biota.
5.2 CONSTITUENTS OF POTENTIAL ECOLOGICAL CONCERN
For this ERA, COPECs are petroleum-related constituents16 that may adversely affect biota. COPECs do not necessarily signify a risk; rather, they are merely constituents that have been identified for further examination. COPECs were identified for the following media of concern:
Media of Concern Evaluate Exposures To
Surface water Aquatic biota
Creek bed sediments Benthic macroinvertebrates
Creek soil/sediment Riparian birds and mammals
A constituent was identified as a COPEC in Lower Red Butte Creek unless either of the following lines of evidence was true:
Detected in less than 5 percent of the samples; or
Maximum detected concentration is less than the corresponding risk-based ecological screening level (ESL).
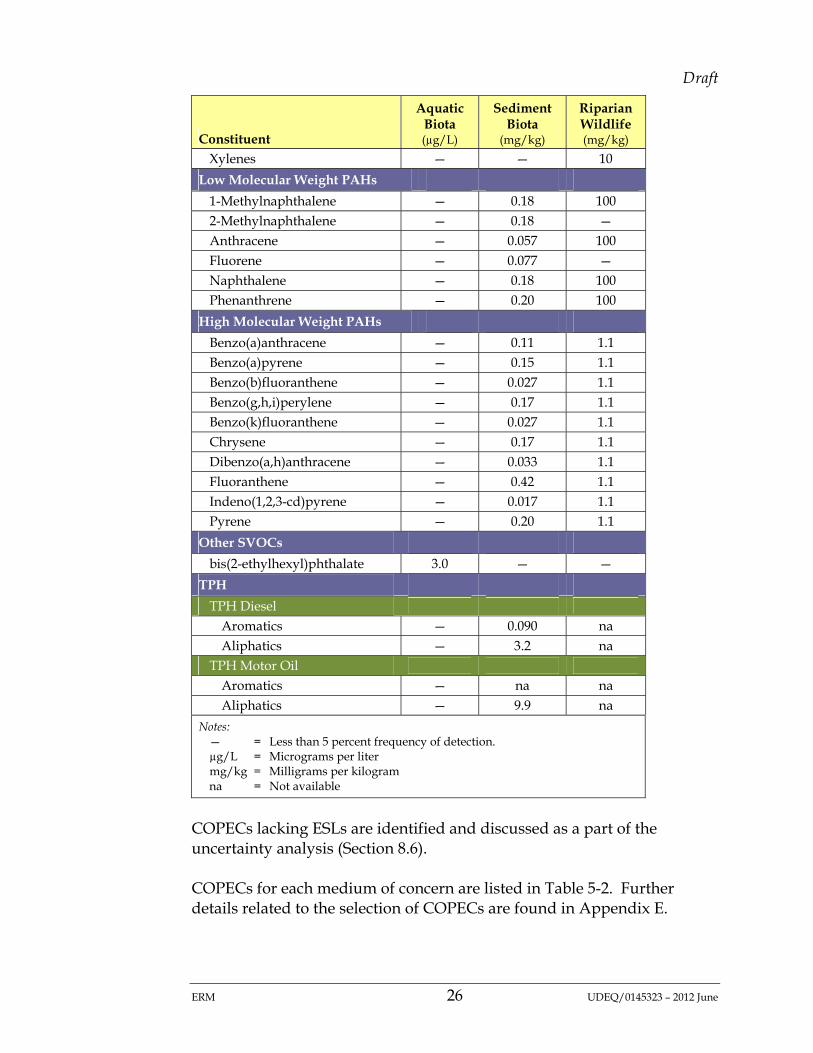
Risk-based ESLs used in this SLERA are listed in Table 5-1 (see also Appendix A for further details).
Table 5-1. Risk-Based Ecological Screening Levels (for constituents with greater than 5 percent frequency of detection)
Constituent
Aquatic Biota (µg/L)
Sediment Biota
(mg/kg)
Riparian Wildlife (mg/kg)
VOCs
Acetone — 0.0087 na Bromoform 293 — — Chloroform — — 1.2 Methylene chloride — 0.018 4.1 Toluene — 0.01 5.5 Tetrachloroethene — 0.0020 9.9
16 Petroleum-related constituents include TPH, TPH fractions, and hazardous
components of TPH (in particular, PAHs and BTEX) (ATSDR 1999; TPHCWG 1997a).
Draft
ERM 26 UDEQ/0145323 – 2012 June
Constituent
Aquatic Biota (µg/L)
Sediment Biota
(mg/kg)
Riparian Wildlife (mg/kg)
Xylenes — — 10
Low Molecular Weight PAHs
1-Methylnaphthalene — 0.18 100 2-Methylnaphthalene — 0.18 — Anthracene — 0.057 100 Fluorene — 0.077 — Naphthalene — 0.18 100 Phenanthrene — 0.20 100
High Molecular Weight PAHs
Benzo(a)anthracene — 0.11 1.1 Benzo(a)pyrene — 0.15 1.1 Benzo(b)fluoranthene — 0.027 1.1 Benzo(g,h,i)perylene — 0.17 1.1 Benzo(k)fluoranthene — 0.027 1.1 Chrysene — 0.17 1.1 Dibenzo(a,h)anthracene — 0.033 1.1 Fluoranthene — 0.42 1.1 Indeno(1,2,3-cd)pyrene — 0.017 1.1 Pyrene — 0.20 1.1
Other SVOCs
bis(2-ethylhexyl)phthalate 3.0 — —
TPH
TPH Diesel Aromatics — 0.090 na Aliphatics — 3.2 na
TPH Motor Oil Aromatics — na na Aliphatics — 9.9 na
Notes: — = Less than 5 percent frequency of detection. µg/L = Micrograms per liter mg/kg = Milligrams per kilogram na = Not available
COPECs lacking ESLs are identified and discussed as a part of the uncertainty analysis (Section 8.6).
COPECs for each medium of concern are listed in Table 5-2. Further details related to the selection of COPECs are found in Appendix E.

Draft
ERM 27 UDEQ/0145323 – 2012 June
Table 5-2. Constituents of Potential Ecological Concern
Constituent Surface Water*
Creek Bed Sediment
Creek Soil/ Sediment
VOCs
Acetone** X Tetrachloroethene (PCE)** X
Low Molecular Weight PAHs
Anthracene X
High Molecular Weight PAHs
Benzo(a)anthracene X Benzo(a)pyrene X Benzo(b)fluoranthene X Benzo(g,h,i)perylene X Benzo(k)fluoranthene X Dibenzo(a,h)anthracene X Indeno(1,2,3-cd)pyrene X Pyrene X
Other SVOCs
Bis(2-ethylhexyl)phthalate X
TPH
TPH Diesel
Aromatics X X Aliphatics X X
TPH Motor Oil
Aromatics X X Aliphatics X X
Notes: X = COPEC * Bromoform was detected in surface water, but at a maximum concentration less
than its risk-based ESL ** Acetone, bromoform, and PCE are not considered petroleum-related constituents,
but are included for consistency with the HHRA
5.3 POTENTIALLY COMPLETE EXPOSURE PATHWAYS
Potentially complete exposure pathways consist of:
A source and mechanism of constituent release;
A transport medium (e.g., soil, water, tissue);
A point or area where receptors of concern may contact petroleum hydrocarbons (media concern); and

Draft
ERM 28 UDEQ/0145323 – 2012 June
An exposure route through which petroleum hydrocarbon uptake occurs (e.g., ingestion, inhalation, or dermal contact, including immersion).
Exposure routes that were considered include:
In-Creek Biota
Direct contact (uptake) by aquatic biota for constituents in surface water; and
Direct contact (uptake) by benthic macroinvertebrate biota for constituents in sediment.
Riparian Biota
Direct (dermal) contact by wildlife for constituents in surface water and creek soil/sediment;
Inhalation by wildlife for volatile constituents in surface water and creek soil/sediment;
Incidental ingestion by wildlife for constituents in creek soil/sediment;
Ingestion (drinking) by wildlife for constituents in creek surface waters; and
Ingestion by wildlife for constituents that have bioaccumulated into riparian plants and benthic macroinvertebrate prey.
A conceptual site model (CSM) was prepared that identifies and summarizes the sources, mechanisms of transport, media of concern, exposure routes, and receptor groups and is intended to identify those exposure scenarios that are most likely to put BROCs at risk. A CSM for the Lower Red Butte Creek ERA is shown in Figure 5-1.
Bank soils are considered to be alluvial deposition of upstream sediments as a result of past high flow events. Although available to riparian wildlife, these sediments are not typically available to and were not quantitatively assessed for in-creek biota. For riparian wildlife (birds and mammals), creek soil/sediment (= bank soil + in-creek sediment) were evaluated.
Inhalation of VOCs and Dermal Contact. VOC vapors are rapidly dispersed in aboveground air following volatilization from soil or surface water. This dispersion, caused by wind and advection, results in very low exposure point concentrations of VOCs in aboveground air (USEPA 1998).
Draft
ERM 29 UDEQ/0145323 – 2012 June
Based on available information and previous experience, VOCs in outdoor air seldom “drive” risk (USEPA 2005). While potentially complete, inhalation exposure to VOCs is considered an insignificant exposure pathway for surface-dwelling wildlife (USEPA 2005).
Feathers of birds, fur on mammals, and scales on reptiles are believed to reduce dermal exposure by limiting the contact of the skin surface with the contaminated media (USEPA 2005). Accordingly, although potentially complete, dermal contact is considered an insignificant exposure pathway for wildlife (Peterle 1991; USEPA 2005).
Lack of a quantitative evaluation for these pathways is discussed in the uncertainty analysis (Section 8.6).
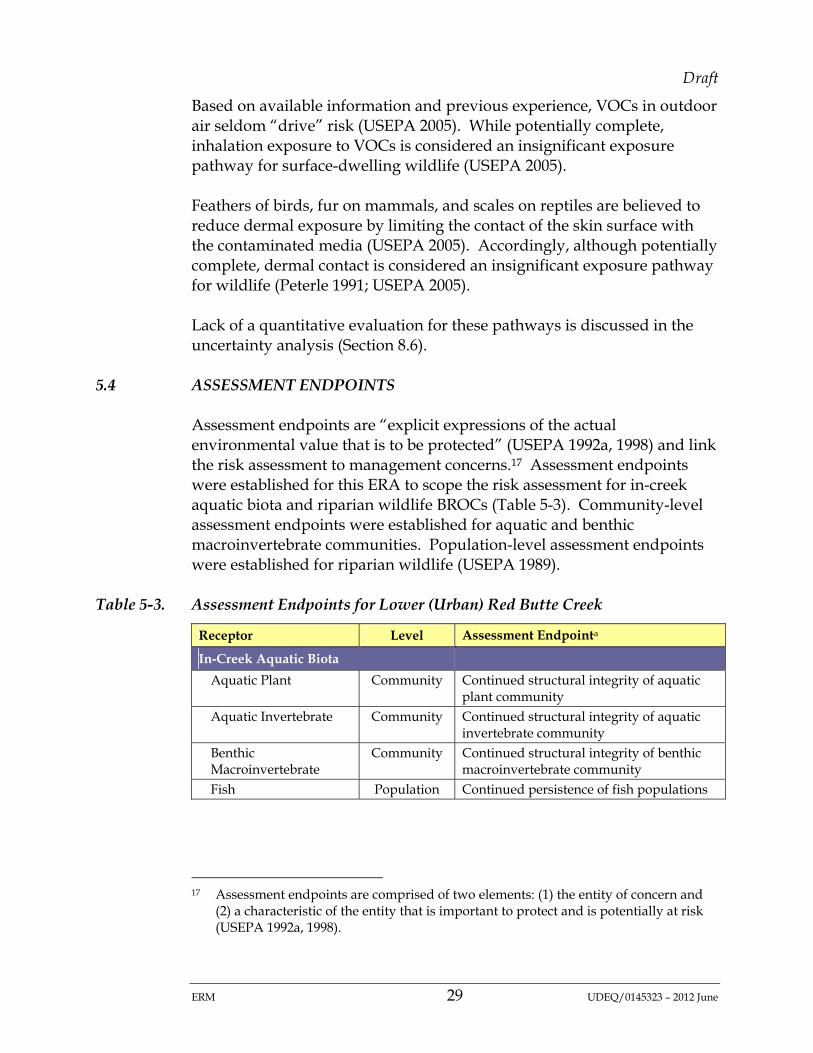
5.4 ASSESSMENT ENDPOINTS
Assessment endpoints are “explicit expressions of the actual environmental value that is to be protected” (USEPA 1992a, 1998) and link the risk assessment to management concerns.17 Assessment endpoints were established for this ERA to scope the risk assessment for in-creek aquatic biota and riparian wildlife BROCs (Table 5-3). Community-level assessment endpoints were established for aquatic and benthic macroinvertebrate communities. Population-level assessment endpoints were established for riparian wildlife (USEPA 1989).
Table 5-3. Assessment Endpoints for Lower (Urban) Red Butte Creek
Receptor Level Assessment Endpointa
In-Creek Aquatic Biota
Aquatic Plant Community Continued structural integrity of aquatic plant community
Aquatic Invertebrate Community Continued structural integrity of aquatic invertebrate community
Benthic Macroinvertebrate
Community Continued structural integrity of benthic macroinvertebrate community
Fish Population Continued persistence of fish populations
17 Assessment endpoints are comprised of two elements: (1) the entity of concern and
(2) a characteristic of the entity that is important to protect and is potentially at risk (USEPA 1992a, 1998).
Draft
ERM 30 UDEQ/0145323 – 2012 June
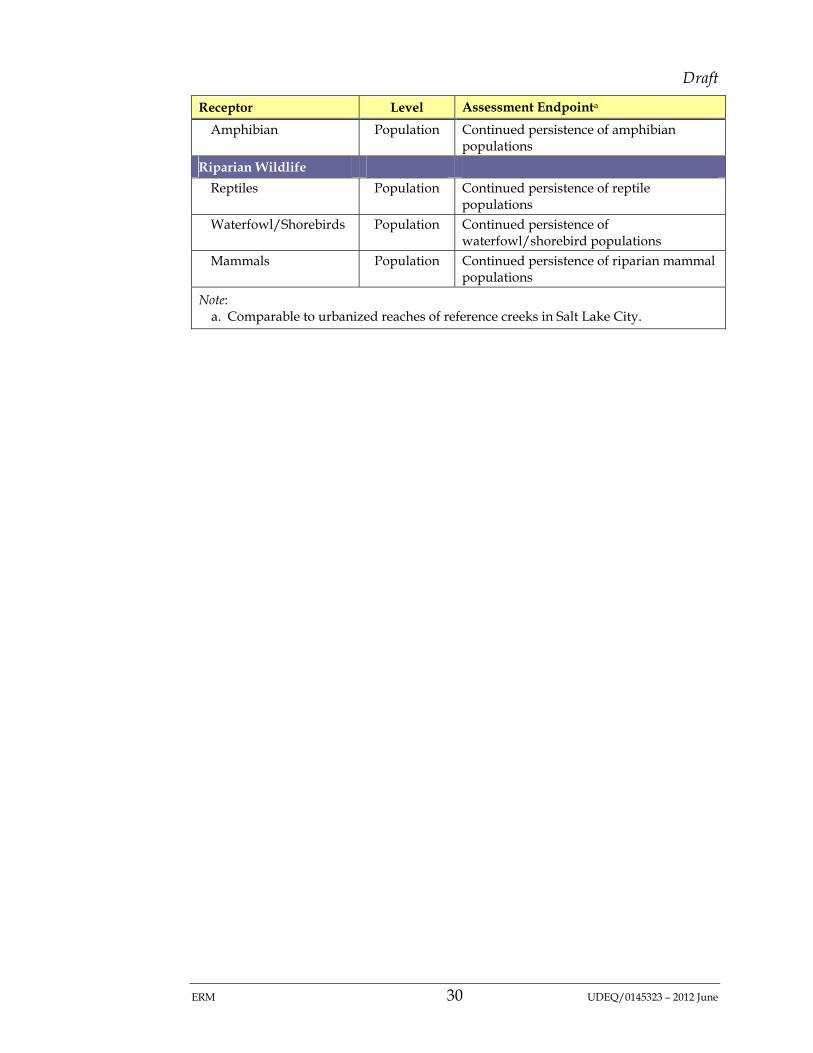
Receptor Level Assessment Endpointa
Amphibian Population Continued persistence of amphibian populations
Riparian Wildlife
Reptiles Population Continued persistence of reptile populations
Waterfowl/Shorebirds Population Continued persistence of waterfowl/shorebird populations
Mammals Population Continued persistence of riparian mammal populations
Note: a. Comparable to urbanized reaches of reference creeks in Salt Lake City.

Draft
ERM 31 UDEQ/0145323 – 2012 June
6.0 EXPOSURE ASSESSMENT
Exposure assessment establishes the information necessary to determine or predict ecological exposures to COPECs under exposure conditions of interest. Given the community coverage and/or home ranges of identified BROCs, the ERA evaluates the reach of Lower Red Butte Creek affected by the Incident18 as a single exposure area. Exposures to wildlife receptors were estimated using exposure models consistent with USEPA’s Wildlife Exposure Factors Handbook (1993).
6.1 TOTAL PETROLEUM HYDROCARBONS CONCENTRATIONS
It is noted that TPH in surface water and sediments were analyzed using USEPA Method 8015 (CPL 2011). This method does not report TPH in terms of carbon-chain fractions as needed when evaluating potential risks using the UDEQ approach. Accordingly and consistent with the HHRA, the results of the USEPA 8015 analyses were allocated to specific aliphatic/aromatic carbon-chain fractions using default (assumed) proportions provided by guidance (Cal/EPA 2009)—i.e., 50-50 percent allocation between aromatic and aliphatic fractions.
6.2 EXPOSURE POINT CONCENTRATIONS
An exposure point concentration (EPC) is the concentration of a constituent in an environmental medium that a receptor of concern is likely to contact. In accordance with regulatory guidance, the lesser value of (i) the 95UCL on the mean or (ii) the maximum measured concentration in accessible media will be used to estimate exposure (USEPA 1989). All calculations of EPCs were performed using USEPA’s ProUCL v. 4.01.00. To ensure consistency, McDaniel-Lambert conducted calculations of all EPCs for both the HHRA and this SLERA.
18 From the Former Lower Underflow Dam (sampling location at the spill site) to Below
900 East (furthest downstream sampling location).

Draft
ERM 32 UDEQ/0145323 – 2012 June
6.3 AQUATIC AND BENTHIC MACROINVERTEBRATES
Exposures for in-creek aquatic and benthic macroinvertebrate biota will be reported in terms of concentrations in surface water and creek sediments, respectively.19
6.4 RIPARIAN WILDLIFE
In addition to environmental point concentrations, the essential inputs needed to estimate exposure to terrestrial wildlife are:
Indicator species;
Exposure equations;
Wildlife exposure factors; and
Biological uptake factors.
6.4.1 Indicator Species
Given the number of species and the complexity of biological communities, all BROCs present in Lower Red Butte Creek cannot be individually assessed. Indicator species are identified to focus the ERA and evaluate risk for a representative set of species. Risks to indicator species are subsequently used to infer the potential for adverse impacts to taxonomically and functionally related BROCs. For further details on indicator species, please see Appendix A.
Indicator wildlife species for Lower Red Butte Creek ERA include:
Mallard – herbivore (waterfowl);
Spotted sandpiper – invertivore (shorebird);
Musk rat – herbivore; and
Raccoon – invertivore.
To bound risk among herbivores and invertivores (invertebrate-consuming animals), indicator species were assumed to have a diet proportion of 100 percent for their particular food type (i.e., omnivores
19 Toxicity benchmarks for aquatic and benthic macroinvertebrate biota are in units of
concentration for surface water and sediment, respectively (see Section 7).

Draft
ERM 33 UDEQ/0145323 – 2012 June
will be considered to have an exposure and risk intermediate to representative surrogate wildlife species.).
6.4.2 Exposure Equations
Exposures (or doses) are calculated using pathway-specific exposure equations for VOCs, SVOCs, and TPH. To facilitate comparisons with available toxicity data, estimates of exposure for COPECs will be reported in the units of dose, mgCOPEC/kgbody wt-day, using the following general equation (USEPA 1993):20
Dose = EPC • CR • FC • AF • BW-1 … Eq. 6-1
where: EPC = COPEC exposure point concentration for the medium of
concern CR = contact rate (e.g., ingestion rate) FC = fraction of media contacted (e.g., diet proportions,
proportion of time spent in Lower Red Butte Creek) AF = assimilation factor21 BW = body weight
For specific exposure equations used in this SLERA, please see Appendix A.
6.4.3 Riparian Wildlife Exposure Factors
In addition to EPCs, wildlife exposure factors (WEFs) are needed to evaluate exposure equations. To estimate exposures due to ingestion, the following WEFs are required:
Food ingestion and water (drinking) rates;
Sediment and food diet proportions;
Body weight; and
20 Estimates of exposure to in-creek aquatic and benthic macroinvertebrate biota are in
units of concentration, and, therefore, do not require exposure equations.
21 Gut absorption factor is equal to the percent of concentration in surface water, sediment, or food that is absorbed across the gastrointestinal tract and is conservatively assumed to be 100 percent.
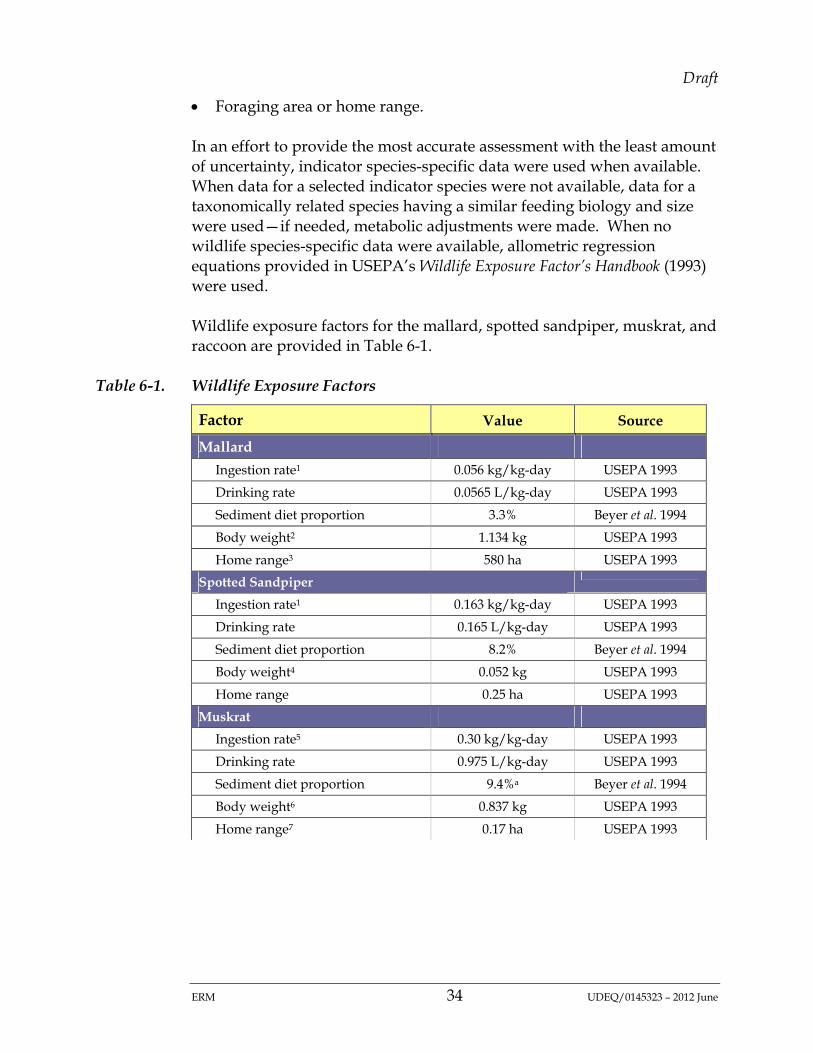
Draft
ERM 34 UDEQ/0145323 – 2012 June
Foraging area or home range.
In an effort to provide the most accurate assessment with the least amount of uncertainty, indicator species-specific data were used when available. When data for a selected indicator species were not available, data for a taxonomically related species having a similar feeding biology and size were used—if needed, metabolic adjustments were made. When no wildlife species-specific data were available, allometric regression equations provided in USEPA’s Wildlife Exposure Factor’s Handbook (1993) were used.
Wildlife exposure factors for the mallard, spotted sandpiper, muskrat, and raccoon are provided in Table 6-1.
Table 6-1. Wildlife Exposure Factors
Factor Value Source
Mallard
Ingestion rate1 0.056 kg/kg-day USEPA 1993
Drinking rate 0.0565 L/kg-day USEPA 1993
Sediment diet proportion 3.3% Beyer et al. 1994
Body weight2 1.134 kg USEPA 1993
Home range3 580 ha USEPA 1993
Spotted Sandpiper
Ingestion rate1 0.163 kg/kg-day USEPA 1993
Drinking rate 0.165 L/kg-day USEPA 1993
Sediment diet proportion 8.2% Beyer et al. 1994
Body weight4 0.052 kg USEPA 1993
Home range 0.25 ha USEPA 1993
Muskrat
Ingestion rate5 0.30 kg/kg-day USEPA 1993
Drinking rate 0.975 L/kg-day USEPA 1993
Sediment diet proportion 9.4%a Beyer et al. 1994
Body weight6 0.837 kg USEPA 1993
Home range7 0.17 ha USEPA 1993

Draft
ERM 35 UDEQ/0145323 – 2012 June
Factor Value Source
Raccoon
Ingestion rate1 0.537 kg/kg-day USEPA 1993
Drinking rate 0.825 L/kg-day USEPA 1993
Sediment diet proportion 9.4% Beyer et al. 1994
Body weight8 3.99 kg USEPA 1993
Home range9 156 ha USEPA 1993
Notes: 1. Calculated from allometric equation (USEPA 1993). 2. Average of means from Nelson & Martin 1953, as cited in USEPA 1993. 3. Average of means from Kirby et al. 1985, as cited in USEPA 1993. 4. Average of means from Maxson & Oring 1980, as cited in USEPA 1993. 5. Average of means from Svihla & Svihla 1931, as cited in USEPA 1993. 6. Average of Reeves & Williams 1956, as cited in USEPA 1993. 7. Neal 1968, as cited in USEPA 1993. 8. Average of means from Johnson 1970, as cited in USEPA 1993. 9. Average of means from Stuewer 1943, as cited in USEPA 1993
6.4.4 Biological Uptake Models
For quantifying food chain exposures, simplified exposure models have been developed for terrestrial and aquatic food webs. COPEC concentrations transferred up the food chain will be calculated using available chemical-specific surface water-to-aquatic biota and sediment-to-benthic macroinvertebrate bioaccumulation factors (BAFs). BAFs used to calculate uptake into the prey of riparian wildlife are listed in Table 6-2 (also see Appendix E).
Table 6-2. Bioaccumulation Factors
BAFs
COPEC sed-to-plant1 sed-to-macroinvert2 Source
TPH-Diesel / TPH-Motor Oil
Aromatics 1.2 1431 USEPA 2007
Aliphatics 0.54 17 USEPA 2007
Notes: sediment-to-plant and sediment-to-macroinvertebrate BAFs were calculated using equations in Attachment 4-1 of USEPA 2007 (see Appendix A and Appendix E)

Draft
ERM 36 UDEQ/0145323 – 2012 June
• This page intentionally left blank •
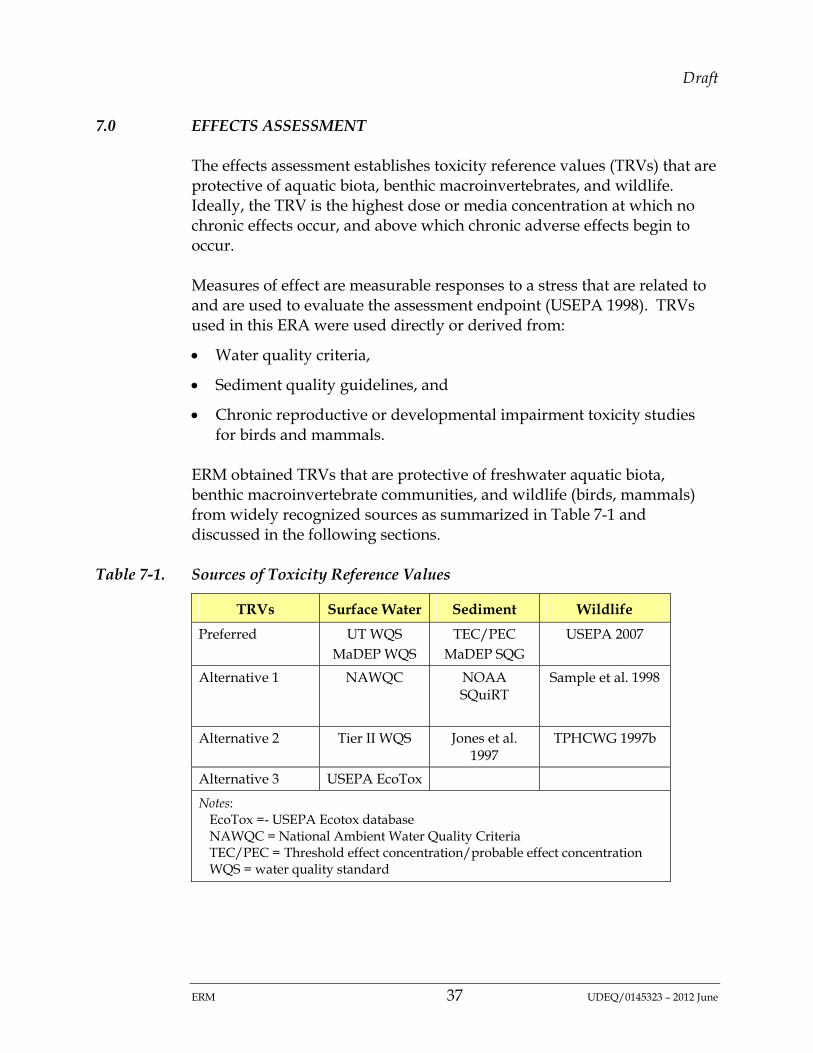
Draft
ERM 37 UDEQ/0145323 – 2012 June
7.0 EFFECTS ASSESSMENT
The effects assessment establishes toxicity reference values (TRVs) that are protective of aquatic biota, benthic macroinvertebrates, and wildlife. Ideally, the TRV is the highest dose or media concentration at which no chronic effects occur, and above which chronic adverse effects begin to occur.
Measures of effect are measurable responses to a stress that are related to and are used to evaluate the assessment endpoint (USEPA 1998). TRVs used in this ERA were used directly or derived from:
Water quality criteria,
Sediment quality guidelines, and
Chronic reproductive or developmental impairment toxicity studies for birds and mammals.
ERM obtained TRVs that are protective of freshwater aquatic biota, benthic macroinvertebrate communities, and wildlife (birds, mammals) from widely recognized sources as summarized in Table 7-1 and discussed in the following sections.
Table 7-1. Sources of Toxicity Reference Values
TRVs Surface Water Sediment Wildlife
Preferred UT WQS MaDEP WQS
TEC/PEC MaDEP SQG
USEPA 2007
Alternative 1 NAWQC NOAA SQuiRT
Sample et al. 1998
Alternative 2 Tier II WQS Jones et al. 1997
TPHCWG 1997b
Alternative 3 USEPA EcoTox
Notes: EcoTox =- USEPA Ecotox database NAWQC = National Ambient Water Quality Criteria TEC/PEC = Threshold effect concentration/probable effect concentration WQS = water quality standard

Draft
ERM 38 UDEQ/0145323 – 2012 June
7.1 AQUATIC BIOTA TOXICITY REFERENCE VALUES
For this SLERA, the following surface water benchmarks were used as TRVs for aquatic biota (in order of preference):
State of Utah numerical water quality standards;
MaDEP TPH numerical surface water guidelines (MaDEP 2002);
National Recommended Water Quality Criteria (NRWQC) (USEPA 2009); and
Tier II values (USEPA 1993, as cited in Suter & Tsao 1996).
TRVs protective of aquatic biota (aquatic plants, aquatic invertebrates, fishes) are listed in Table 7-2.
Table 7-2. Aquatic Biota Toxicity Reference Values
COPEC TRV
(µg/L) Source
Bis(2-ethylhexyl)phthalate 3.0 1
Notes: 1 Tier II value (USEPA 1993, as provided in Suter & Tsao 1996)
7.2 BENTHIC MACROINVERTEBRATE TOXICITY REFERENCE VALUES
For this SLERA, the following sediment benchmarks were used as TRVs for aquatic biota (in order of preference):
Threshold effect concentration (TEC)/probable effect concentrations (PEC) (MacDonald et al. 2000);
MaDEP TPH sediment benchmarks (MaDEP 2007);
USEPA Assessment and Remediation Contaminated Sediments (ARCS) Program values; and
Oak Ridge National Laboratory (ORNL) toxicological benchmarks for sediment-associated biota (Jones et al. 1997).
TRVs for COPECs in sediment are listed in Table 7-3. TECs and PECs were used to bound potential risks as follows (McDonald et al. 2000):
Less than TEC: adverse effects are not expected to occur;
Between TEC and PEC: neither predicted to be toxic nor non-toxic—no guidance provided for this range; and
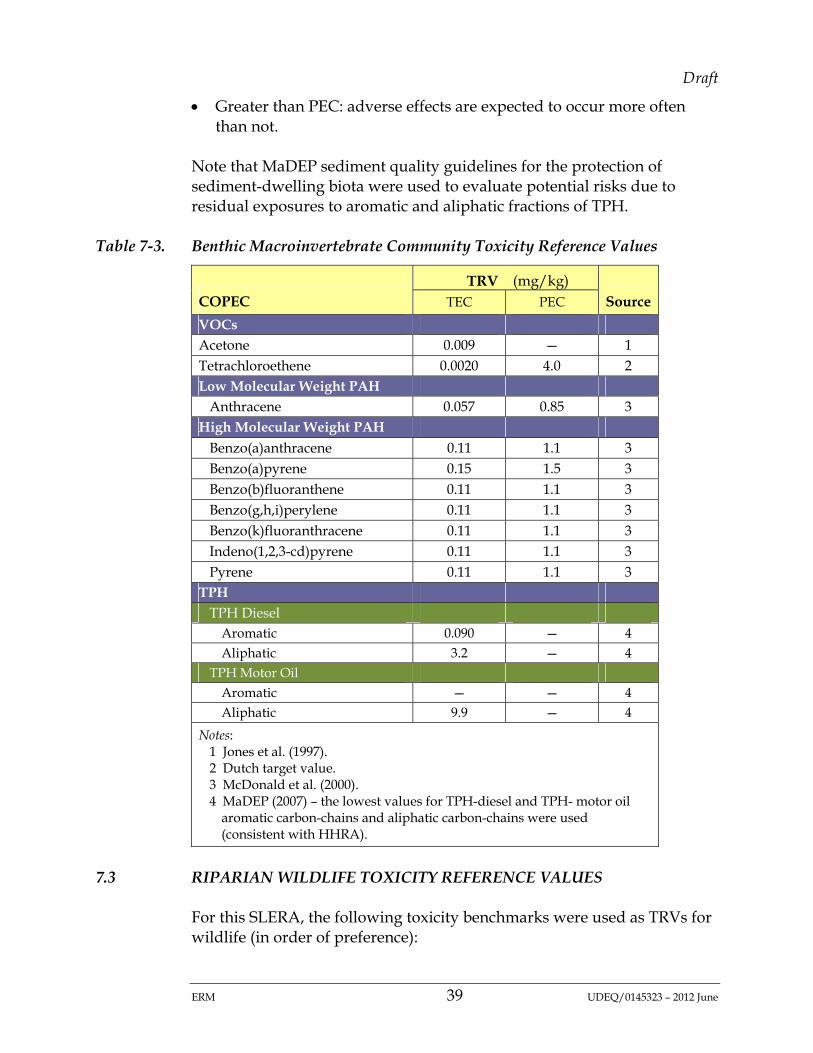
Draft
ERM 39 UDEQ/0145323 – 2012 June
Greater than PEC: adverse effects are expected to occur more often than not.
Note that MaDEP sediment quality guidelines for the protection of sediment-dwelling biota were used to evaluate potential risks due to residual exposures to aromatic and aliphatic fractions of TPH.
Table 7-3. Benthic Macroinvertebrate Community Toxicity Reference Values
COPEC TRV (mg/kg)
Source TEC PEC
VOCs Acetone 0.009 — 1 Tetrachloroethene 0.0020 4.0 2 Low Molecular Weight PAH
Anthracene 0.057 0.85 3 High Molecular Weight PAH
Benzo(a)anthracene 0.11 1.1 3 Benzo(a)pyrene 0.15 1.5 3 Benzo(b)fluoranthene 0.11 1.1 3 Benzo(g,h,i)perylene 0.11 1.1 3 Benzo(k)fluoranthracene 0.11 1.1 3 Indeno(1,2,3-cd)pyrene 0.11 1.1 3 Pyrene 0.11 1.1 3
TPH TPH Diesel
Aromatic 0.090 — 4 Aliphatic 3.2 — 4
TPH Motor Oil Aromatic — — 4 Aliphatic 9.9 — 4
Notes: 1 Jones et al. (1997). 2 Dutch target value. 3 McDonald et al. (2000). 4 MaDEP (2007) – the lowest values for TPH-diesel and TPH- motor oil
aromatic carbon-chains and aliphatic carbon-chains were used (consistent with HHRA).
7.3 RIPARIAN WILDLIFE TOXICITY REFERENCE VALUES
For this SLERA, the following toxicity benchmarks were used as TRVs for wildlife (in order of preference):

Draft
ERM 40 UDEQ/0145323 – 2012 June
USEPA ecological soil screening levels (USEPA 2003-2007);
ORNL toxicological benchmarks for wildlife (Sample et al. 1998); and
TPHCWG toxicity benchmarks.
Wildlife TRVs for COPECs in creek soil/sediment are listed in Table 7-4.
Table 7-4. Wildlife Toxicity Reference Values
COPEC
TRV (mg/kg-day)
Source Bird Mammal
SVOCs bis(2-ehthylhexyl)phthalate 1.1 18 1 TPH
TPH Diesel Aromatic na 3.0 2 Aliphatic na 10 2
TPH Motor Oil Aromatic na na Aliphatic na 60 2
Notes: na = no TRV available 1. Sample et al. (1998). 2. TPHCWG (1997b) – the lowest values for TPH- diesel and TPH- motor oil
aromatic carbon-chains and aliphatic carbon-chains were used (consistent with HHRA). The uncertainty factors for animal-to-human extrapolation and human variability were not included.
7.4 IN-CREEK BENTHIC MACROINVERTEBRATE COMMUNITY STRUCTURE
Findings of the benthic macroinvertebrate survey provide an additional line of evidence to characterize potential risks to in-creek biota. Quantitatively assessing the in-creek benthic macroinvertebrate community provides a number of advantages because they (USEPA 1999b):
Indicate localized conditions given their limited migration patterns or sessile mode of life;
Integrate effects of short-term environmental variations; and
Constitute a broad range of trophic levels and pollution tolerances, thus providing strong information for interpreting cumulative effects.

Draft
ERM 41 UDEQ/0145323 – 2012 June
The benthic macroinvertebrate community can be characterized in a number of ways, including measuring its diversity, its community composition, and its tolerance to perturbation. Specific metrics that allow us to characterize the structure of the benthic macroinvertebrate community are listed in Table 7-5.
Table 7-5. In-Creek Benthic Macroinvertebrate Community Metrics
Category Metric Definition Purpose Diversity measures
Richness Total number of taxa Measures the overall variety of the macroinvertebrate assemblage
Evenness Relative abundance with which each species is represented in an area
Index of how close in numbers the species in the community are
Diversity (Simpson’s or Shannon-Wiener indices)
An index for the combined richness and evenness of species in the community
Provides a measure for the number of species weighted by their abundance
Composition measures
% EPT Percent of composite of mayfly, stonefly, and caddisfly larvae
Measures the composite abundance of sensitive taxa; generally decreases after perturbation
% Chironomidae Percent of midge larvae Measures the abundance of a tolerant taxon; generally increases after perturbation
Tolerance measures
Hilsenhoff biotic index (HBI)
Uses tolerance values to weight abundance in an estimate of overall pollution. Ranges from 1 to 10 (1 = pollutant sensitive to 10 = pollutant tolerant)
Perturbation should increase this value

Draft
ERM 42 UDEQ/0145323 – 2012 June
• This page intentionally left blank •
Draft
ERM 43 UDEQ/0145323 – 2012 June
8.0 RISK CHARACTERIZATION
Risk characterization integrates the results of the analysis phase (i.e., exposure and effects assessments) to evaluate the likelihood of adverse ecological impacts associated with exposure to COPECs (USEPA 1992a). Potential risks were inferred based on:
Hazard quotients; and
Analysis of the benthic macroinvertebrate community structure.
Potential risks were evaluated for:
Aquatic biota community;
Benthic macroinvertebrate community;
Riparian bird populations; and
Riparian mammal populations.
8.1 HAZARD QUOTIENTS
Hazard quotients (HQs) are used to estimate the potential for adverse ecological impacts when sufficient exposure and toxicity data exist. An HQ is simply the ratio of the estimated exposure to the TRV:
Estimated Exposure HQ = TRV
An HQ less than one (HQ < 1) indicates a negligible potential for adverse ecological impacts due to exposure to a particular COPEC, whereas an HQ greater than or equal to one (HQ ≥ 1) indicates a potential for adverse ecological impacts due to exposure to that COPEC.
The hazard index (HI) is the sum of HQs (HI = Σ HQs) and was calculated to evaluate potential cumulative risks for constituents with similar structure activity relationships. Similar to HQs, an HI less than one (HI < 1) indicates a negligible potential for adverse ecological impacts due to cumulative exposures to COPECs, whereas an HI greater than or equal to one (HI ≥ 1) indicates a potential for adverse ecological impacts due to cumulative exposures to COPECs.

Draft
ERM 44 UDEQ/0145323 – 2012 June
Risk estimates (HQs and HIs) for aquatic biota, benthic macroinvertebrates, riparian birds, and riparian mammals are provided in Tables 8-1 through 8-6 (see end of report; also see Appendix E).
8.2 AQUATIC BIOTA
Aquatic biota includes aquatic plants, aquatic (pelagic water column) invertebrates, and fishes (Section 5.1). Numerical water quality criteria used to evaluate potential risks in this SLERA were established by regulatory agencies to be protective of aquatic biota communities.
In Lower Red Butte Creek, all VOCs, PAHs, and TPH were either detected in less than 5 percent of surface water samples or had maximum detected concentrations less than risk-based ESLs. The only COPEC identified for surface waters of Lower Red Butte Creek was the SVOC bis(2-ethylhexyl) phthalate. This phthalate ester was detected in only 1 of 16 surface water samples (6 percent frequency of detection). This single detection of bis(2-ethylhexyl)phthalate of 28 μg/L was greater than the Tier II value22 of 3.0 μg /L (Table 8-1), resulting in an HQ of 9.3. The HQ for bis(2-ethylhexyl)phthalate suggests this COPEC may pose a potential risk to aquatic biota at the Gaging Station within Lower Red Butte Creek. However, the lack of detection of bis(2-ethylhexyl)phthalate at 15 of 16 sampling locations throughout Lower Red Butte Creek suggests that potential exposures may be spatially limited.
Bis(2-ethylhexyl)phthalate was not detected in surface water samples from reference creeks. Uncertainties related to potential risk estimates are discussed further in Section 8.6.
8.3 BENTHIC MACROINVERTEBRATES
In Lower Red Butte Creek, nearly all VOCs were either detected in less than 5 percent of creek bed sediment samples or had maximum detected concentrations less than risk-based ESLs. The only VOC COPECs identified for creek bed sediments of Lower Red Butte Creek were acetone and tetrachloroethene (PCE), each of which was detected in only 1 of 16
22 The State of Utah and USEPA provide no numerical water quality criteria for bis(2-
ethylhexyl)phthalate. Tier II values were developed so that aquatic benchmarks could be established with fewer data than are required for USEPA’s recommended national recommended water quality criteria (Suter & Tsao 1996).

Draft
ERM 45 UDEQ/0145323 – 2012 June
creek bed samples. Note that acetone and PCE are considered to be constituents unlikely to be related to a crude oil release; further, acetone is a common laboratory contaminant. Acetone and PCE are included in this SLERA for consistency with the HHRA.
Other COPECs include eight PAHs and TPH-diesel and TPH-motor oil. The COPECs in creek bed sediments of Lower Red Butte Creek are summarized in Table 8-2.
8.3.1 Hazard Quotients
Sediment quality guidelines used to evaluate potential risks in this SLERA were established by regulatory agencies to be protective of sediment-dwelling benthic communities.
The sole detections of acetone and PCE23 and EPCs for anthracene and indeno(1,2,3-cd)pyrene24 in Lower Red Butte Creek bed sediments resulted in HQs of 2.3, 3.5, 1.6, 1.1, respectively. The EPCs for PCE, anthracene, and indeno(1,2,3-cd)pyrene do not exceed the PEC sediment quality guideline—hence, these COPECs may or may not pose a risk to benthic macroinvertebrate communities in Lower Red Butte Creek. Note that acetone was detected in 1 of 24 and PCE was detected in 5 of 24 creek bed samples from reference creeks. The lack of detections at 15 of 16 sampling locations throughout Lower Red Butte Creek suggests that potential risks due to exposures to acetone is likely to be spatially limited.
TPH-diesel and TPH-motor oil were frequently detected in creek bed sediments of Lower Red Butte Creek. EPCs for aromatic and aliphatic fractions of TPH results in HQs greater than one (HQs > 1), suggesting that these fractions pose a potential risk to benthic macroinvertebrate communities. However, as noted in Section 4, concentrations of TPH-diesel and TPH-motor oil measured in creek bed sediment of Lower Red Butte Creek were comparable to or less than concentrations measured in creek bed sediment of reference creeks (Table 8-2a,b), as shown below:
23 Acetone and PCE are not considered petroleum-related constituents, but were
included for consistency with the HHRA
24 Anthracene was detected in only 2 of 15 sampling locations; while, indeno(1,2,3-cd)pyrene was detected in 3 of 15 samples.
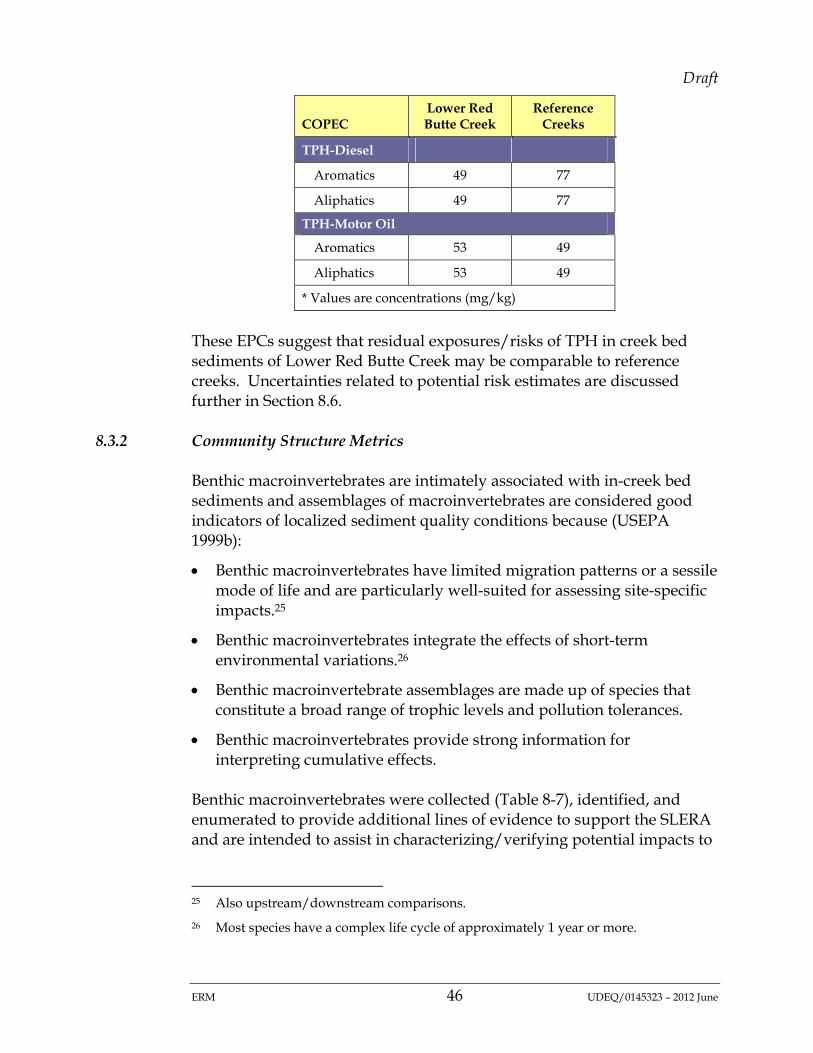
Draft
ERM 46 UDEQ/0145323 – 2012 June
COPEC Lower Red Butte Creek
Reference Creeks
TPH-Diesel
Aromatics 49 77
Aliphatics 49 77
TPH-Motor Oil
Aromatics 53 49
Aliphatics 53 49
* Values are concentrations (mg/kg)
These EPCs suggest that residual exposures/risks of TPH in creek bed sediments of Lower Red Butte Creek may be comparable to reference creeks. Uncertainties related to potential risk estimates are discussed further in Section 8.6.
8.3.2 Community Structure Metrics
Benthic macroinvertebrates are intimately associated with in-creek bed sediments and assemblages of macroinvertebrates are considered good indicators of localized sediment quality conditions because (USEPA 1999b):
Benthic macroinvertebrates have limited migration patterns or a sessile mode of life and are particularly well-suited for assessing site-specific impacts.25
Benthic macroinvertebrates integrate the effects of short-term environmental variations.26
Benthic macroinvertebrate assemblages are made up of species that constitute a broad range of trophic levels and pollution tolerances.
Benthic macroinvertebrates provide strong information for interpreting cumulative effects.
Benthic macroinvertebrates were collected (Table 8-7), identified, and enumerated to provide additional lines of evidence to support the SLERA and are intended to assist in characterizing/verifying potential impacts to
25 Also upstream/downstream comparisons.
26 Most species have a complex life cycle of approximately 1 year or more.
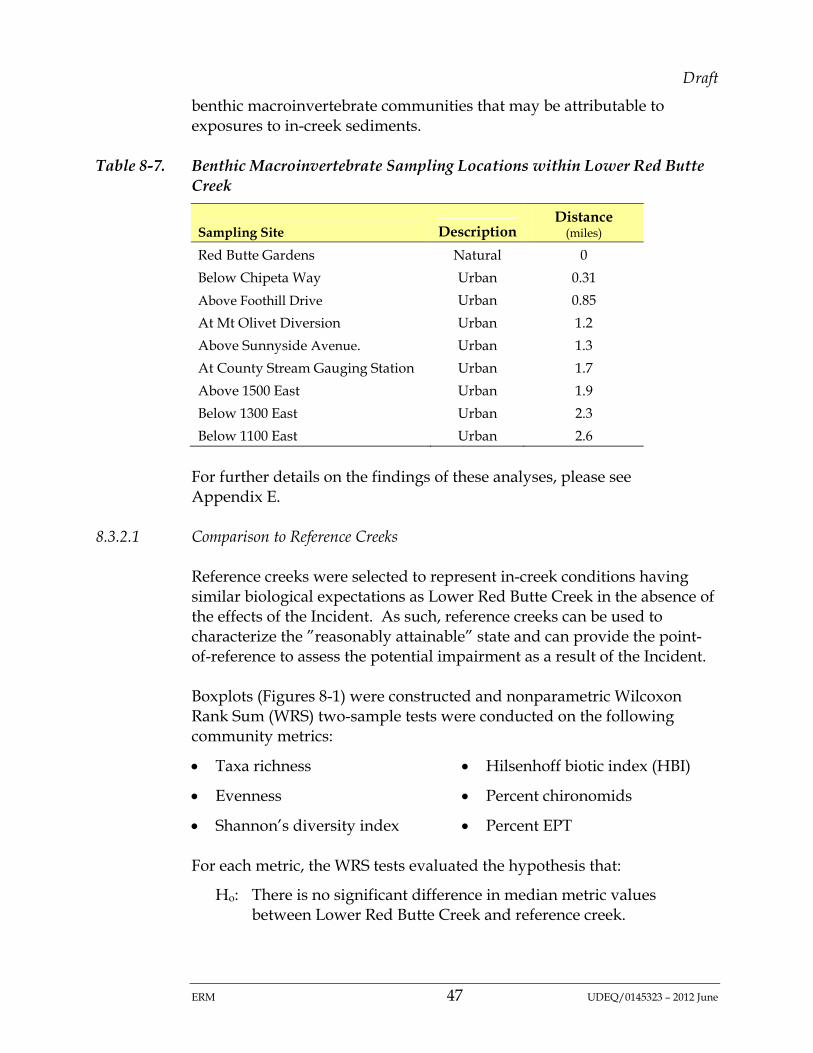
Draft
ERM 47 UDEQ/0145323 – 2012 June
benthic macroinvertebrate communities that may be attributable to exposures to in-creek sediments.
Table 8-7. Benthic Macroinvertebrate Sampling Locations within Lower Red Butte Creek
Sampling Site Description Distance
(miles)
Red Butte Gardens Natural 0
Below Chipeta Way Urban 0.31
Above Foothill Drive Urban 0.85
At Mt Olivet Diversion Urban 1.2
Above Sunnyside Avenue. Urban 1.3
At County Stream Gauging Station Urban 1.7
Above 1500 East Urban 1.9
Below 1300 East Urban 2.3
Below 1100 East Urban 2.6
For further details on the findings of these analyses, please see Appendix E.
8.3.2.1 Comparison to Reference Creeks
Reference creeks were selected to represent in-creek conditions having similar biological expectations as Lower Red Butte Creek in the absence of the effects of the Incident. As such, reference creeks can be used to characterize the ”reasonably attainable” state and can provide the point-of-reference to assess the potential impairment as a result of the Incident.
Boxplots (Figures 8-1) were constructed and nonparametric Wilcoxon Rank Sum (WRS) two-sample tests were conducted on the following community metrics:
Taxa richness Hilsenhoff biotic index (HBI)
Evenness Percent chironomids
Shannon’s diversity index Percent EPT
For each metric, the WRS tests evaluated the hypothesis that:
Ho: There is no significant difference in median metric values between Lower Red Butte Creek and reference creek.

Draft
ERM 48 UDEQ/0145323 – 2012 June
Both boxplots and WRS27 tests suggest that there are no differences between Lower Red Butte Creek and reference creeks for each/all of the community metrics (Table 8-8).
Table 8-8. Benthic Macroinvertebrate Community: Results of Nonparametric Two-Sample Tests
Ho: No significant difference between Lower Red Butte Creek and Reference Creeks
Metric p Significant?
Richness 0.13 ns
Evenness 0.42 ns
Shannon-Wiener Diversity Index 0.25 ns
% EPT 0.38 ns
% Chironomids 0.56 ns
Hilsenhoff biotic index (HBI) 0.59 ns
Notes: ns = Not significant
These findings are consistent with findings of the reference creek (ambient) evaluation (Section 4) that there is no difference in PAH concentrations in creek sediments between Lower Red Butte Creek and the reference creeks.
8.3.2.2 Trends in Community Metrics Relative to Distance from Spill
To test the hypothesis that impacts to benthic macrovinvertebrates would be greatest nearest the Incident and decrease with distance downcreek, a regression analysis was conducted for the same set of metrics as listed in Section 8.3.2.1. For each metric, the regression evaluated the hypothesis that:
Ho: There is no significant trend with distance from the Incident site downstream to lower portions of Lower Red Butte Creek.
27 At a significance level (α) of 0.05, results of WRS tests show none of the community
metrics are significantly different between Lower Red Butte Creek and the reference creeks

Draft
ERM 49 UDEQ/0145323 – 2012 June
The regression analyses found that (Table 8-9):
Taxa richness and percent EPT (pollutant sensitive) decreased with distance downstream from the Incident site;
Percent chironomids (pollutant tolerant) increased with distance downstream from the Incident site;
Evenness, diversity, and HBI28 demonstrated no significant changes with distance downstream from the Incident site; and
Benthic macroinvertebrate metrics from samples collected at locations immediately downstream from the Incident site were “healthier” (i.e., higher richness, higher percent EPT, lower percent chironomids) than samples collected farther downstream in the more urbanized reach of Lower Red Butte Creek.
Table 8-9. Benthic Macroinvertebrate Community: Results of Nonparametric Regression Analyses
Ho: No significant trend with distance downstream of Incident Site in Lower Red Butte Creek
Metric Sign of Slope p Significant?
Richness negative 0.05 *
Evenness negative 0.72 ns
Shannon-Wiener Diversity Index negative 0.16 ns
% EPT negative 0.08 ns
% Chironomids positive 0.05 *
Hilsenhoff biotic index (HBI) positive 0.25 ns
Notes: ns = Not significant * = Significant at significance level (α) = 0.05
These findings suggest that impacts to benthic macroinvertebrates increase with distance downstream (further away) from the Incident site. Two possible conclusions include impacts are due to (i) Incident-related hydrocarbons that were transported and deposited in downstream locations or (ii) urban runoff-related hydrocarbons deposited in lower creek locations. The reference creek (ambient) evaluation found that the
28 Note that HBI ranges from 1 (pollutant sensitive) to 10 (pollutant tolerant)—
i.e., higher values indicate community composed of more pollutant-tolerant taxa.

Draft
ERM 50 UDEQ/0145323 – 2012 June
PAH composition in Lower Red Butte Creek appear to be consistent with pyrogenic sources (typical of urban runoff) (Section 4). These findings suggest that the source of downstream hydrocarbons is likely from urban runoff sources.
8.4 RIPARIAN BIRDS
Riparian birds were considered to be exposed to COPECs in surface waters and creek soil/sediments (Section 5.3). In Lower Red Butte Creek, all VOCs, SVOCs, and PAHs were either detected in less than 5 percent of creek soil/sediment samples or had maximum detected concentrations less than risk-based ESLs. Bis(2-ethylhexyl)phthalate was the only COPEC identified for surface waters and TPH-diesel and TPH-motor oil were the only COPECs identified for creek soils/sediments of Lower Red Butte Creek.
8.4.1 Mallard
Risk estimates for the mallard were used to infer potential risks to birds consuming riparian emergent plants (herbivores).
No avian TRVs were identified for aromatic and aliphatic fractions of TPH-diesel and TPH-motor oil. Hence, no risk estimates were quantified for TPH in creek soil/sediment for these COPECs (Table 8-3).
Note that nearly 95 percent of the exposure to aromatic and 85 percent of the exposure to aliphatic fractions of TPH is due to the ingestion of plants. Doses due to ingestion were derived using kow-modeled BAFs. These BAFs suggest biomagnification of TPH in plants and may not be representative of tissue burdens of plants in Lower Red Butte Creek (also see Section 8.6).
Moreover, as noted in Section 4, concentrations of TPH-diesel and TPH-motor oil measured in soil/sediment of Lower Red Butte Creek were comparable to or less than concentrations measured in soil/sediment of reference creeks. As shown below, exposures (doses) to aliphatic and aromatic fractions of TPH-diesel are greater in reference creeks as compared to Lower Red Butte Creek (from Table 8-3a,b):

Draft
ERM 51 UDEQ/0145323 – 2012 June
COPEC Lower Red Butte Creek
Reference Creeks
TPH-Diesel
Aromatics 3.6 3.7 Aliphatics 1.6 1.7
TPH-Motor Oil
Aromatics 3.4 2.3 Aliphatics 1.5 1.1
* Values are doses (mg/kg-day)
These data suggest that residual exposures/risks of TPH in creek soil/sediments of Lower Red Butte Creek may be comparable to reference creeks.
Bis(2-ethylhexyl)phthalate was detected in only 1 of 16 surface water samples in Lower Red Butte Creek and was not detected in surface waters from the reference creeks. Exposures to bis(2-ethylhexyl)phthalate posed a negligible risk to the mallard (HQ < 1) (Table 8-3).
Uncertainties related to potential risk estimates are discussed further in Section 8.6.
8.4.2 Sandpiper
Risk estimates for the mallard were used to infer potential risks to birds consuming benthic macroinvertebrates (invertivores).
No avian TRVs were identified for aromatic and aliphatic fractions of TPH-diesel and TPH-motor oil. Hence, no risk estimates were quantified for TPH in creek soil/sediment for these COPECs (Table 8-4).
Note that exposures to aromatic and aliphatic fractions of TPH appear to be high. Nearly 100 percent of the exposure to aromatic and aliphatic fractions of TPH is due to the ingestion of macroinvertebrate. Doses due to ingestion were derived using kow-modeled BAFs (also see Section 8.6). BAFs for aromatic fractions are on the order of 10+3, while BAFs extraordinarily aliphatic fractions are on the order of 10+1. These BAFs appear to be particularly high, suggesting biomagnification of TPH in benthic macroinvertebrates, and may not be representative of tissue burdens of benthic macroinvertebrates in Lower Red Butte Creek (also see Section 8.6).

Draft
ERM 52 UDEQ/0145323 – 2012 June
Moreover, as noted in Section 4, concentrations of TPH-diesel and TPH-motor oil measured in soil/sediment of Lower Red Butte Creek were comparable to or less than concentrations measured in soil/sediment of reference creeks. As shown below, exposures (doses) to aliphatic and aromatic fractions of TPH-diesel are greater in the reference creeks as compared to Red Butte Creek (from Table 8-4a,b):
COPEC Lower Red Butte Creek
Reference Creeks
TPH-Diesel
Aromatics 11931 12258 Aliphatics 145 149
TPH-Motor Oil
Aromatics 11181 7839 Aliphatics 136 95
* Values are doses (mg/kg-day)
These data suggest that residual exposures/risks of TPH in creek soil/sediments of Lower Red Butte Creek may be comparable to the reference creeks.
Bis(2-ethylhexyl)phthalate was detected in only 1 of 16 surface water samples in Lower Red Butte Creek and was not detected in surface waters from reference creeks. Exposures to bis(2-ethylhexyl)phthalate posed a negligible risk to the sandpiper (HQ < 1) (Table 8-4).
Uncertainties related to potential risk estimates are discussed further in Section 8.6.
8.5 RIPARIAN MAMMALS
Riparian mammals were considered to be exposed to COPECs in surface waters and creek soil/sediments (Section 5.3). In Lower Red Butte Creek, all VOCs, SVOCs, and PAHs were either detected in less than 5 percent of creek soil/sediment samples or had maximum detected concentrations less than risk-based ESLs. Bis(2-ethylhexyl)phthalate was the only COPEC identified for surface waters and TPH-diesel and TPH-motor oil were the only COPECs identified for creek soils/sediments of Lower Red Butte Creek.

Draft
ERM 53 UDEQ/0145323 – 2012 June
8.5.1 Muskrat
Risk estimates for the muskrat were used to infer potential risks to mammals consuming riparian emergent plants (herbivores).
Risk estimates for the muskrat are provided in Table 8-5. HQs suggest that exposures to the aromatic fraction of TPH-diesel and cumulative exposures to TPH pose a potential risk (HQ > 1).
Note that nearly 95 percent of the exposure to aromatic and 85 percent of the exposure to aliphatic fractions of TPH is due to the ingestion of plants. Doses due to ingestion were derived using kow-modeled BAFs. These BAFs suggest biomagnification of TPH in plants and may not be representative of tissue burdens of plants in Lower Red Butte Creek (also see Section 8.6).
Moreover, as noted in Section 4, concentrations of TPH-diesel and TPH-motor oil measured in soil/sediment of Lower Red Butte Creek were comparable to or less than concentrations measured in soil/sediment of reference creeks. As shown below, exposures (doses) to aliphatic and aromatic fractions of TPH-diesel are greater in reference creeks as compared to Red Butte Creek (from Table 8-5a,b):
COPEC Lower Red Butte Creek
Reference Creeks
TPH-Diesel
Aromatics 20 21 Aliphatics 9.7 9.9
TPH-motor oil
Aromatics 19 13 Aliphatics 9.1 6.4
* Values are doses (mg/kg-day)
However, the HQ due to exposure to the aliphatic fraction29 of TPH-motor was greater than one and exposures were greater in soil/sediments of Lower Red Butte Creek as compared to reference creeks.
29 The aromatic fraction of TPH-motor oil could not be quantitatively evaluated due to
the lack of a mammalian TRV.

Draft
ERM 54 UDEQ/0145323 – 2012 June
Bis(2-ethylhexyl)phthalate was detected in only 1 of 16 surface water samples in Lower Red Butte Creek and was not detected in surface waters from reference creeks. Exposures to bis(2-ethylhexyl)phthalate posed a negligible risk to the muskrat (HQ < 1) (Table 8-5).
Uncertainties related to potential risk estimates are discussed further in Section 8.6.
8.5.2 Raccoon
Risk estimates for the raccoon were used to infer potential risks to mammals consuming benthic macroinvertebrates (invertivores).
Risk estimates for the raccoon are provided in Table 8-6. HQs suggest that exposures to the aromatic fraction of TPH-diesel and cumulative exposures to TPH pose a potential risk (HQ >> 1).
Note that exposures to aromatic and aliphatic fractions of TPH appear to be high. Nearly 100 percent of the exposure to aromatic and aliphatic fractions of TPH is due to the ingestion of macroinvertebrate. Doses due to ingestion were derived using kow-modeled BAFs (also see Section 8.6). BAFs for aromatic fractions are on the order of 10+3, while BAFs extraordinarily aliphatic fractions are on the order of 10+1. These BAFs appear to be particularly high, suggest biomagnification of TPH in benthic macroinvertebrates, and may not be representative of tissue burdens of benthic macroinvertebrates in Lower Red Butte Creek (also see Section 8.6).
However, as noted in Section 4, concentrations of TPH-diesel and TPH-motor oil measured in soil/sediment of Lower Red Butte Creek were comparable to or less than concentrations measured in soil/sediment of reference creeks. As shown below, exposures (doses) to aliphatic and aromatic fractions of TPH-diesel are greater in reference creeks as compared to Red Butte Creek (from Table 8-6a,b):
COPEC Lower Red Butte Creek
Reference Creeks
TPH-Diesel
Aromatics 39307 40383 Aliphatics 477 490

Draft
ERM 55 UDEQ/0145323 – 2012 June
COPEC Lower Red Butte Creek
Reference Creeks
TPH-Motor Oil
Aromatics 36836 25824 Aliphatics 447 313
* values are doses (mg/kg-day)
However, the HQ due to exposure to the aliphatic fraction of TPH-motor was greater than one and exposures were greater in soil/sediments of Lower Red Butte Creek as compared to reference creeks.
Bis(2-ethylhexyl)phthalate was detected in only 1 of 16 surface water samples in Lower Red Butte Creek and was not detected in surface waters from reference creeks. Exposures to bis(2-ethylhexyl)phthalate posed a negligible risk to the raccoon (HQ < 1) (Table 8-6).
Uncertainties related to potential risk estimates are discussed further in Section 8.6.
8.6 UNCERTAINTY ANALYSIS
Consistent with USEPA (1989) guidance, a qualitative discussion of the uncertainties associated with the estimation of risks for Lower Red Butte Creek will be presented in the ERA report. This uncertainty analysis discusses key uncertainties associated the exposure and effects assessments. To reduce uncertainties, focused verification of SLERA analyses may be considered.
8.6.1 Uncertainties Associated with the Exposure Assessment
Sources of uncertainty related to COPEC exposures include:
Constituents detected in less than 5 percent of the samples;
Bis(2-ethylhexyl)phthalate;
Use of indicator species;
Bioaccumulation factors;
Omission of inhalation and dermal contact; and
Comparisons to reference creek (ambient) conditions.

Draft
ERM 56 UDEQ/0145323 – 2012 June
8.6.1.1 Constituents Detected in Less Than 5 Percent of the Samples
Constituents in soil/sediment that were excluded from further quantitative evaluation because they were detected, but at a frequency less than 5 percent include:
2-Methylnaphthalene Bis(2-ethylhexyl)phthalate
Acetone Fluorene
In cases where the sample size was less than 20 samples (i.e., surface water and creek bed sediments), a frequency detection less than 5 percent was equivalent to “not detected in any sample”. Although the omission of a quantitative evaluation for these infrequently detected chemicals may result in an underestimate of risk, this omission is considered to have a minor effect on the overall risk estimate and is consistent with USEPA (1989) RAGS guidance and the HHRA for Red Butte Creek.
8.6.1.2 Bis(2-ethylhexyl)phthalate
Bis(2-ethylhexyl)phthalate is considered a possible petroleum-related organic compound). However, bis(2-ethylhexyl)phthalate is commonly found in plastics, such as polyvinyl chloride (PVC), and is considered a common laboratory contaminant. Further, bis(2-ethylhexyl)phthalate was detected in only 1 of 16 surface water samples from Lower Red Butte Creek. Nonetheless, the detected concentration is well above the practical quantification limit (10 µg/L), suggesting that this detect may not be laboratory-related. Bis(2-ethylhexyl)phthalate was quantitatively evaluated in this SLERA.
8.6.1.3 Tetrachloroethene
PCE is not considered a petroleum-related organic compound. PCE was detected in only 1 of 16 creek bed sediment samples from Lower Red Butte Creek. PCE was included in this SLERA to be consistent with the HHRA. However, risk estimates are included and suggest that PCE does not pose a risk to biota.
8.6.1.4 Indicator Species
Given the number of species and the complexity of biological communities, all species present in Lower Red Butte Creek cannot be individually assessed. Indicator species were used to infer the potential

Draft
ERM 57 UDEQ/0145323 – 2012 June
for adverse impacts to taxonomically and functionally related BROCs. To minimize the chance of underestimating exposure, indicator species were selected to maximize estimates of exposure (e.g., small body size, small home or foraging ranges, forages on ground surface), where possible. However, very little is known about the relative sensitivity to petroleum-related constituents among related species. Therefore, the extrapolation of risks from species to species introduces an unquantifiable amount of uncertainty.
8.6.1.5 Inhalation and Dermal Exposure Pathways
VOC vapors are rapidly dispersed in aboveground air following volatilization from soil or surface water and are considered to result in very low exposure point concentrations of VOCs in aboveground air (USEPA 1998). While potentially complete, inhalation exposure to VOCs is considered an insignificant exposure pathway for surface-dwelling wildlife (USEPA 2005).
Feathers of birds, fur on mammals, and scales on reptiles are believed to reduce dermal exposure by limiting the contact of the skin surface with the contaminated media (USEPA 2005). Although potentially complete, dermal contact is considered an insignificant exposure pathway for wildlife (Peterle 1991; USEPA 2005).
Hence, quantitative evaluation of inhalation and dermal exposure pathways were omitted from this SLERA. Omission of inhalation and dermal contact exposure pathways may result in an underestimate of potential risks.
8.6.1.6 Bioaccumulation Factors
BAFs for aromatic and aliphatic fractions of TPH-diesel and TPH-motor oil were derived from Kow models (USEPA 2007). These Kow models appear to have resulted in inordinately high BAFs for TPH—in particular, for sediment-to-benthic invertebrate BAFs for the aromatic fraction of TPH-diesel and TPH-motor oil. Kow-modeled BAFs introduce an unquantifiable uncertainty into calculations of risk estimates for this SLERA. Consequently, exposures and risk estimates for aromatic and aliphatic fractions of TPH are considered to be uncertain.
To reduce uncertainty in the uptake, exposure, and potential risks via the foodchain, modeled BAFs may be verified by direct measures of tissue burdens of plants and benthic macroinvertebrates in the field. Given that

Draft
ERM 58 UDEQ/0145323 – 2012 June
exposures and potential risks to TPH in Lower Red Butte Creek are comparable or less than in reference creeks, verification of BAFs may not be considered critical to support decision-making.
8.6.1.7 Comparisons to Reference Creek (Ambient) Conditions
For the purposes of this SLERA, comparisons to reference creek concentrations were not used to exclude/eliminate constituents from further evaluation in the SLERA. All constituents with greater than 5 percent frequency of detect and maximum concentrations greater than risk-based ESLs were evaluated further.
However, the reference creek (ambient) evaluation suggests that, for the most part, PAHs and TPH-diesel are consistent with reference creek (ambient) conditions (McDaniel-Lambert 2012). Visual examination of Q-Q plots indicated inconsistencies with statistical tests for some PAHs and TPH-motor oil. However, the PAH composition analysis suggests that petroleum-related hydrocarbons detected in Red Butte Creek appear to be consistent with PAHs typical of urban run-off. Hence, findings of the reference creek (ambient) evaluation suggest that petroleum hydrocarbons detected in Red Butte Creek may not be Incident-related.
8.6.2 Uncertainties Associated with the Effects Assessment
Sources of uncertainty related to effects include:
Use of chronic no observable adverse effect level (NOAEL)-equivalent TRVs;
Species-to-species toxicity extrapolations;
Laboratory-to-field toxicity extrapolations;
Constituent-to-constituent extrapolations; and
Lack of avian TRVs for TPH.
8.6.2.1 Use of Chronic No Observable Adverse Effect Level -Equivalent Toxicity Reference Values
The use of chronic NOAEL-equivalent TRVs is likely to result in conservative assessments of risk because environmental exposures were compared to toxicity levels at which no adverse effects were observed. Studies indicate that acute LD50s derived from multiple dose toxicity tests show a high positive correlation with observed impacts in the
Draft
ERM 59 UDEQ/0145323 – 2012 June
environment (USEPA 1991). DTSC (1996) considers NOAELs to be 100 times more sensitive than LD50s and 10 times more sensitive than lowest observed adverse effect levels (LOAELs). Thus, use of chronic NOAEL-equivalent TRVs provides a substantially greater level of protection than the use of the lowest doses at which effects are observed (LOAELs) or LD50s.
8.6.2.2 Species-to-Species Toxicity Extrapolations
A source of uncertainty in the SLERA is the lack of applicable species-specific toxicity data. Because of this data limitation, TRVs were developed using available toxicity data for laboratory test species. For example, TRV for the muskrat and raccoon were developed from toxicity data for mice and rats.
Species vary with respect to sensitivity to specific chemicals (Calabrese and Baldwin 1993). Based on our review of the toxicological data, the range of sensitivity for members within a class of vertebrates were typically up to 100-fold. This range of uncertainty is substantiated by Calabrese and Baldwin (1993). Although a range in sensitivity may be described, the relative sensitivity (and the “direction” of sensitivity) of riparian wildlife species compared to laboratory test species to COPEC exposures is not known.
8.6.2.3 Laboratory-to-Field Toxicity Extrapolations
A number of studies (primarily for aquatic systems) have evaluated the ability of single-chemical laboratory toxicity test results to predict adverse effects of that chemical on organisms under field conditions. Preliminary chemical contaminant studies suggest that laboratory toxicity tests represent more conservative exposure scenarios than those that occur in nature (USEPA 1991). Furthermore, concentrations of chemicals causing no effect in laboratory tests also do not appear to affect communities in the field. Thus, the use of chronic NOAEL-equivalent TRVs are likely to provide a conservative level of protection to plant and wildlife communities and populations observed in the field.
8.6.2.4 Constituent-to-Constituent Extrapolations
Sufficient toxicity data to develop reference toxicity values for all constituents was not possible. To assess risks, constituent-to-constituent extrapolations were required. Use of constituent-to-constituent extrapolations is supported by the abundance of research work on QSARs
Draft
ERM 60 UDEQ/0145323 – 2012 June
(quantitative structure-activity relationships) reported in the pharmaceutical and medicinal chemistry literature that suggests that chemicals with similar molecular or physicochemical properties have similar biological reactivity and toxicity (Donkin 1994; Nirmalakhandan and Speece 1988). The use of constituent-to-constituent extrapolations is also consistent with guidance for HHRA.
8.6.2.5 Lack of Avian TRVs for TPHs and PAHs
Hazardous components of TPH include PAHs and BTEX.30 The lack of avian ecotoxicity data for TPH and PAHs hampers the quantitative risk assessment of risk for birds. This uncertainty is not unique to this SLERA.
TPH and several PAHs were detected in creek soils/sediments (see Table E-3a of Appendix E). However, there are no widely recognized/accepted avian TRVs for TPH and PAHs. PAHs detected in creek soils/sediments were not present at concentrations greater than USEPA 2007 ecological soil screening levels (ESSLs) for PAHs that are protective of wildlife. However, USEPA ESSLs for wildlife were based on mammalian screening levels—avian ecotoxicity data were not considered sufficient to develop TRVs.
Because TPH and PAHs are of interest for the Incident, in lieu of no assessment, one may consider a tempered, qualitative comparison to risk estimates for mammals as a point-of-reference. For example, the aliphatic fraction of TPH-motor oil posed a risk to the muskrat and raccoon.31 If birds are as sensitive to the aliphatic fraction of TPH-motor oil as small mammals, a similar pattern in potential risk would be observed. Note that the relative sensitivities between birds and mammals to the aliphatic fraction of TPH-motor oil is not known.
The lack of avian TRVs for TPH and PAHs is a data gap shared among any current toxicity-based assessment of risk for birds exposed to
30 Benzene and ethylbenzene were not detected in creek soils/sediments. Although
detected, toluene and xylene were not detected at concentrations greater than USEPA Region 6 ecological screening levels that are protective of wildlife. BTEX analytical detection limits are nearly two orders of magnitude less than these ESLs (see Table E-3a).
31 Note that the HQs for aromatic and aliphatic fractions of TPH-diesel were less than the corresponding HQs for reference creek.
Draft
ERM 61 UDEQ/0145323 – 2012 June
petroleum-related constituents and is considered a fundamental uncertainty in this SLERA.

Draft
ERM 62 UDEQ/0145323 – 2012 June
• This page intentionally left blank •

Draft
ERM 63 UDEQ/0145323 – 2012 June
9.0 DISCUSSION AND CONCLUSIONS
A key feature of this SLERA is the use of multiple lines of evidence (where available) to support characterizations of risk. The use of multiple lines of evidence (e.g., reference creek evaluation, risk estimates for reference creeks, benthic macroinvertebrate community metrics) is intended to provide several perspectives to assist in characterizing the potential for ecological risk.
Aquatic Biota. Potential risks to aquatic biota due to residual exposures of petroleum-related constituents in surface water appear to be limited. All analytes, except for bis(2-ethylhexyl)phthalate, were either not detected or had maximum concentrations less than risk-based ESLs. Note that bis(2-ethylhexyl)phthalate was only detected in 1 of 16 surface water samples. This single detection suggests that bis(2-ethylhexyl)phthalate may pose a potential risk, but that exposures are likely to be spatially limited.
Benthic Macroinvertebrate Community. Potential risks to benthic macroinvertebrate communities due to residual exposures of petroleum-related constituents in creek bed sediments also appear to be limited. COPECs were limited to acetone, PCE, eight PAHs, TPH-diesel, and TPH-motor oil. Exposures for 6 of 8 PAHs were less than TECs leading to a conclusion that adverse effects are not expected to occur (MacDonald et al. 2000). Exposures to PCE and anthracene were greater than TECs, but less than PECs, and a determination of toxicity or nontoxicity cannot be confidently predicted (MacDonald et al. 2000).
An evaluation of reference creeks found that concentrations of PAHs in creek bed sediments of Lower Red Butte Creek were comparable or less than concentrations in creek bed sediments of reference creeks. In addition, exposures used in this SLERA appear to be comparable between Lower Red Butte Creek and reference creeks. Finally, metrics suggest that the structure32 of the benthic macroinvertebrate community in Lower Red Butte Creek is comparable to reference creeks. These lines of evidence suggest that potential exposures/risks in Lower Red Butte Creek are
32 As characterized by richness, diversity, evenness, percent EPT, percent chironomids,
and HBI.

Draft
ERM 64 UDEQ/0145323 – 2012 June
comparable to conditions observed in reference creeks and are unlikely to be attributable to residual Incident-related petroleum hydrocarbons.
Riparian Birds and Mammals. Potential risks to riparian birds and mammals due to residual exposures to aromatic and aliphatic fractions of TPH in Lower Red Butte Creek were identified. Note that exposures and risk estimates for aromatic and aliphatic fractions of TPH-diesel were comparable to or less than those measured/calculated for the reference creeks. Although statistical tests found no significant difference, visual examination of Q-Q plots suggest that TPH-motor oil concentrations appear to be greater in Red Butte Creek as compared to reference creeks. Risk estimates for the aliphatic fraction of TPH-motor oil33 were greater than one and greater than risk estimates calculated for the reference creeks.
Reference Creek (Ambient) Evaluation. An evaluation of reference creeks found that concentrations of several PAHs and TPH-diesel in creek bed sediment of Lower Red Butte Creek were comparable or less than concentrations in creek bed sediment of reference creeks. Similarly, this evaluation found that concentrations of several PAHs and TPH-diesel in soil/sediment of Lower Red Butte Creek were comparable or less than concentrations in soil/sediments of reference creeks. Although visual examination of Q-Q plots found inconsistencies with the statistical analyses, an analysis of PAH composition suggests a pyrogenic source of PAHs that is consistent with urban runoff. This evaluation of the reference creek (ambient) conditions suggest that petroleum hydrocarbons detected in Red Butte Creek may not be Incident-related.
Uncertainties. Uncertainties associated with the risk analyses were identified for this SLERA. To reduce uncertainties, focused verification of this SLERA may be considered. However, given potential risks to biota in Lower Red Butte Creek, for the most part, appear to be comparable to or less than risks for ambient conditions in reference creeks, the need for verification may not be considered essential to support decision-making.
33 The aromatic fraction of TPH-motor oil could not be quantitatively evaluated due to
the lack of a mammalian TRV.

Draft
ERM 65 UDEQ/0145323 – 2012 June
10.0 LITURATURE CITED
Agency for Toxic Substances and Disease Registry. 1999. Toxicological profile for total petroleum hydrocarbons (TPH). Division of Toxicology/ Toxicology Information Branch, U.S. Department of Health and Human Services. Atlanta, GA.
Beyer, W.N., E.E. Connor, and S. Gerould. 1994. Estimates of Soil Ingestion by Wildlife. Journal of Wildlife Management 58(2):375-382.
Bio-West, Inc. (Bio-West). 2010. Salt Lake City Riparian Corridor Study: Final Red Butte Creek Management Plan. Prepared for the Salt Lake City Department of Public Utilities. Salt Lake City, UT.
Calabrese, E.J., and L.A. Baldwin. 1993. Performing Ecological Risk Assessments. Lewis Publishers, Chelsea, MI.
California Environmental Protection Agency (Cal/EPA). 2009. Evaluating Human Health Risks from Total Petroleum Hydrocarbons (TPH). Interim Guidance. Human and Ecological Risk Division. California Department of Toxic Substances Control. June 16.
Chevron Pipe Line (CPL). 2011. Red Butte Creek Crude Oil Spill Water, Sediment and Macroinvertebrate Sampling Plan. Version 17. Salt Lake City, Utah.
Donkin, P. 1994. Quantitative-Structure-Activity Relationships. In: Handbook of Ecotoxicology (P. Calow, ed.). Blackwell Scientific Publications. Oxford, England.
Douben, P.E.T. (ed.) 2003. PAHs: An Ecotoxicological Perspective. John Wiley & Sons Ltd. London, England.
ENTACT LLC (ENTACT). 2010. Removal Action Work Plan, Revision 2 for The Chevron Pipe Line Red Butte Release Mp 174.5, Salt Lake City, UT. Prepared for Chevron Environmental Management Company (CEMC).
Jones, D.S., G.W. Suter II, and R.N. Hull. 1997. Toxicological Benchmarks for Screening Potential Contaminants of Concern for Effects on Sediment-Associated Biota: 1997 revision. Health Sciences Research Division, Oak Ridge National Laboratory (ORNL). Oak Ridge, TN.
MacDonald, D.D., C.G. Ingersoll, T.A. Berger. 2000. Development of Evaluation of Consensus-Based Sediment Quality Guidelines for

Draft
ERM 66 UDEQ/0145323 – 2012 June
Freshwater Ecosystems. Archives of Environmental Contamination and Toxicology. 39: 20-31.
Massachusetts Department of Environmental Protection (MaDEP). 2002. Characterizing Risks Posed by Petroleum Contaminated Sites: Implementation of the MaDEP VPH/EPH Approach. Boston, MA.
Massachusetts Department of Environmental Protection (MaDEP). 2007. Sediment Toxicity of Petroleum Hydrocarbon Fractions. Boston, MA.
McDaniel-Lambert, Inc. (McDaniel-Lambert). 2012. Draft Human Health Risk Assessment, Red Butte Creek, Salt Lake City, Utah. Prepared for the Division of Water Resources, Utah Department of Environmental Quality.
National Oceanic and Atmospheric Administration (NOAA). 2008. Sediment Quick Reference Tables (SQuiRT).
Nirmalakhandan, N., and R.E. Speece. 1988. Structure-Activity Relationships. Environ. Sci. Technol. 22:606-615.
Peterle, T.J. 1991. Wildlife Toxicology. Van Nostrand Reinhold, New York.
Salt Lake County (SLCO). 2009. 2009 Salt Lake Countywide Water Quality Stewardship Plan. Salt Lake City, Salt Lake County, UT.
Sample, B.E., D.M. Opresko, and G.W. Suter, II. 1996. Toxicological Benchmarks for Wildlife: 1996 revision. Health Sciences Research Division, Oak Ridge National Laboratory (ORNL). Oak Ridge, TN.
Suter, G.W. II, and C.L. Tsao. 1996. Toxicological Benchmarks for Screening Potential Contaminants of Concern for Effects on Aquatic Biota: 1996 revision. Health Sciences Research Division, Oak Ridge National Laboratory (ORNL). Oak Ridge, TN.
Total Petroleum Hydrocarbon Criteria Working Group (TPHCWG). 1997a. A risk-based approach for the management of total petroleum hydrocarbons in soil.
Total Petroleum Hydrocarbon Criteria Working Group (TPHCWG). 1997b. Total petroleum hydrocarbon criteria working group series. Volume 4: Development of fraction specific reference doses (RfDs) and reference concentrations (RfCs) for total petroleum hydrocarbons (TPH). Amherst Scientific Publishers. Amherst, MA.
USEPA. 1989. Risk Assessment Guidance for Superfund (ERAGS). EPA/540/1-89/002. Office of Emergency and Remedial Response, U.S. Environmental Protection Agency. Washington, D.C.
Draft
ERM 67 UDEQ/0145323 – 2012 June
USEPA. 1991. Summary Report on Issues in Ecological Risk Assessment. EPA/625/3-91/018. Risk Assessment Forum, U.S. Environmental Protection Agency, Washington, D.C.
USEPA. 1992a. Framework for Ecological Risk Assessment. EPA/630/R-92/001. Risk Assessment Forum, U.S. Environmental Protection Agency. Washington, D.C.
USEPA. 1992b. Guidance for Data Usability in Risk Assessment. EPA-540/G-90-008. Office of Emergency and Remedial Response, U.S. Environmental Protection Agency. Washington, D.C.
USEPA. 1993. Wildlife Exposure Factors Handbook. EPA/600/R-93/187. Office of Research and Development, U.S. Environmental Protection Agency. Washington, D.C.
USEPA. 1997. Ecological Risk Assessment Guidance for Superfund: Process for Designing and Conducting Ecological Risk Assessments. Interim Final. EPA-540-R-97-006. Solid Waste and Emergency Response, U.S. Environmental Protection Agency, Washington, DC.
USEPA. 1998. Guidelines for Ecological Risk Assessment. EPA/630/R-95/002F. Risk Assessment Forum, U.S. Environmental Protection Agency. Washington, D.C.
USEPA. 1999a. National Functional Guidelines for Organic Data Review. USEPA 540/R-99-008. OSWER 9240.1-05A-P. October.
USEPA. 1999b. Rapid Bioassessment Protocols for Use in Streams and Wadeable Rivers: Periphyton, Benthic Macroinvertebrates, and Fish. Second Edition. EPA/841/B-99/002. Office of Office of Wetlands, Oceans, and Watersheds, U.S. Environmental Protection Agency. Washington, D.C.
USEPA. 2001a. Risk Assessment Guidance for Superfund: Volume I Human Health Evaluation Manual—Part D, Standardized Planning, Reporting, and Review of Superfund Risk Assessments. Office of Emergency and Remedial Response, Washington, DC. Publication 9285.7-47. December.
USEPA. 2002. Guidance for Comparing Background and Chemical Concentrations in Soil for CERCLA Sites. EPA 540-R-01-003. Office of Solid Waste and Emergency Response, U.S. Environmental Protection Agency, Washington, D.C.
Draft
ERM 68 UDEQ/0145323 – 2012 June
USEPA. 2004. National Functional Guidelines for Inorganic Data Review. USEPA 540-R-04-004. OSWER 9240.1-45. October.
USEPA. 2005. Guidance for Developing Ecological Soil Screening Levels. Office of Solid Waste and Emergency Response. Directive 9285.7-55. February 2005. Updated 2007.
USEPA (Singh, A., Maichle, R.W. and S. Lee). 2006. On the Computation of a 95% Upper Confidence Limit of the Unknown Population Mean Based Upon Data Sets with Below Detection Limit Observations. EPA/600/R-06/022.
USEPA. 2007. Ecological Soil Screening Levels for Polycyclic Aromatic Hydrocarbons (PAHs). Interim Final. Office of Solid Waste and Emergency Response, Washington, D.C.
USEPA. 2009. National Recommended Water Quality Criteria. Office of Water, Office of Science and Technology (4304T). http://water.epa.gov/scitech/swguidance/standards/current/
USEPA (Singh, A., and A.K. Singh). 2010. ProUCL Version 4.0 Technical Guide. EPA/600/R-07/04. Office of Research and Development, U.S. Environmental Protection Agency, Las Vegas, NV.
Utah Administrative Code. Rule R315-101-5, Health Evaluation Criteria, Risk Assessment.
Utah Department of Environmental Quality (UDEQ). 2005. TPH Fractionation at Leaking Underground Storage Tank Sites, Final Draft. Updated November 2011.

Draft
ERM 69 UDEQ/0145323 – 2012 June
FIGURES
Draft
ERM 70 UDEQ/0145323 – 2012 June
• This page intentionally left blank •

Draft
ERM 71 UDEQ/0145323 – 2012 June
Figure 1-1. ERA Approach
Figure 1-2. Elements of the SLERA
Tier 2: Site-Specific ERA
Tier 1: Screening ERA
Tier 3: Probabilistic ERA
Risk Characterization
Effects Assessment
Exposure Assessment
Problem Formulation

Draft
ERM 72 UDEQ/0145323 – 2012 June
Figure 2-1. Map of Red Butte, Emigration, City, and Parleys Creeks (from Bio-West 2010)
Figure 2-2. Longitudinal profile plot of Lower Red Butte Creek Streambed (from Bio-West
2010)

Draft
ERM 73 UDEQ/0145323 – 2012 June
Fig
ure
3-1
. M
ap o
f S
amp
lin
g L
ocat
ion
s

Draft
ERM 74 UDEQ/0145323 – 2012 June
Fig
ure
5-1
. C
once
ptu
al S
ite
Mod
el f
or t
he
Low
er R
ed B
utt
e C
reek
SL
ER
A

Draft
ERM 75 UDEQ/0145323 – 2012 June
Figure 8-1. Benthic Macroinvertebrate: Boxplots of Community Metrics
(a) (b)
(c) (d)
(e) (f)

Draft
ERM 76 UDEQ/0145323 – 2012 June
• This page intentionally left blank •

Draft
ERM 77 UDEQ/0145323 – 2012 June
TABLES (Tables 8-1a,b through 8-6a,b)

Draft
ERM 78 UDEQ/0145323 – 2012 June
• This page intentionally left blank •

Table 8-1aRisk Calculations for Aquatic Biota in Red Butte Creek
Ecological Risk AssessmentRed Butte Creek
Salt Lake City, Utah
Media EPC
Water Water TRV Hazard1
COPEC (ug/L) (ug/L) Quotient
Bis(2-ethylhexyl) phthalate 27.6 3.0 9.2
COPEC - Chemical of Potential Ecological ConcernEPC - Exposure Point Concentration. The maximum concentration was used as the EPC for this Screening Level evaluation.BAF - Bioaccumulation FactorNA - Not applicable or unavailableTRV - Toxicity Reference ValueHQ - Hazard Quotient1 -Hazard Quotient = Total Dose/TRV
Preliminary DraftDo Not Cite or Quote

Table 8-1bRisk Calculations for Aquatic Biota in Reference Creeks
Ecological Risk AssessmentRed Butte Creek
Salt Lake City, Utah
Media EPC
Water Water TRV Hazard1
COPEC (ug/L) (ug/L) Quotient
bis(2-ethylhexyl)phthalate ND 3.0 --
COPEC - Chemical of Potential Ecological ConcernEPC - Exposure Point Concentration. The maximum concentration was used as the EPC for this Screening Level evaluation.NA - Not applicable or unavailableTRV - Toxicity Reference ValueHQ - Hazard Quotient1 -Hazard Quotient = Total Dose/TRV
Preliminary DraftDo Not Cite or Quote

Table 8-2aRisk Calculations for Benthic Invertebrates in Red Butte Creek
Ecological Risk AssessmentRed Butte Creek
Salt Lake City, Utah
Media EPC Sediment TRV
Sediment Sediment TEC PEC Hazard Quotient1
COPEC (mg/kg) (mg/kg) (mg/kg) TEC PEC
Acetone 0.020 0.0087 -- 2.3 --Low Molecular Weight PAHs
Anthracene 0.090 0.057 0.85 1.6 0.11High Molecular Weight PAHs
Benzo(a)anthracene 0.063 0.11 1.1 0.58 0.060Benzo(a)pyrene 0.085 0.15 1.5 0.57 0.059Benzo(b)fluoranthene 0.082 0.027 1.1 3.0 0.078Benzo(g,h,i)perylene 0.074 0.17 1.1 0.44 0.071Benzo(k)fluoranthene 0.044 0.027 1.1 1.6 0.041Dibenzo(a,h)anthracene 0.058 0.033 1.1 1.8 0.055Indeno(1,2,3-cd)pyrene 0.12 0.017 1.1 7.0 0.12Pyrene 0.087 0.20 1.5 0.45 0.058
Tetrachloroethene 0.0069 0.0020 4.0 3.5 0.002TPH Diesel
Aromatics 49 0.29 -- 172 --Aliphatics 49 9.9 -- 5.0 --
TPH Motor OilAromatics 53 -- -- -- --Aliphatics 53 31 -- 1.7 --
Low Molecular Weight PAHs HI = 1.6 0.11High Molecular Weight PAHs HI = 15 0.54
TPH HI = 179 --
COPEC - Chemical of Potential Ecological ConcernEPC - Exposure Point Concentration. NA - Not applicable or unavailableHQ - Hazard Quotient1 -Hazard Quotient = Total Dose/TRV
Preliminary DraftDo Not Cite or Quote

Table 8-2bRisk Calculations for Benthic Invertebrates in Reference Creeks
Ecological Risk AssessmentRed Butte Creek
Salt Lake City, Utah
Media EPC Sediment TRV
Sediment Sediment TEC PEC Hazard Quotient1
COPEC (mg/kg) (mg/kg) (mg/kg) TEC PEC
Acetone -- 0.0087 -- -- --Low Molecular Weight PAHs
Anthracene 0.0059 0.057 0.85 0.10 0.0070High Molecular Weight PAHs
Benzo(a)anthracene 0.056 0.11 1.1 0.52 0.054Benzo(a)pyrene 0.040 0.15 1.5 0.27 0.028Benzo(b)fluoranthene 0.057 0.027 1.1 2.1 0.054Benzo(g,h,i)perylene 0.031 0.17 1.1 0.18 0.030Benzo(k)fluoranthene 0.027 0.027 1.1 0.99 0.026Dibenzo(a,h)anthracene -- 0.033 1.1 --Indeno(1,2,3-cd)pyrene 0.033 0.017 1.1 1.9 0.031Pyrene 0.11 0.20 1.5 0.55 0.072
Tetrachloroethene 0.0046 0.0020 4.0 2.3 0.0011TPH Diesel 105
Aromatics 53 0.29 -- 184 --Aliphatics 53 9.9 -- 5.3 --
TPH Motor Oil 67Aromatics 34 -- -- -- --Aliphatics 34 31 -- 1.1 --
Low Molecular Weight PAHs HI = 0.10 0.01High Molecular Weight PAHs HI = 6.5 0.29
TPH HI = 190 --
COPEC - Chemical of Potential Ecological ConcernEPC - Exposure Point Concentration. NA - Not applicable or unavailableHQ - Hazard Quotient1 -Hazard Quotient = Total Dose/TRV
Preliminary DraftDo Not Cite or Quote

Table 8-3aRisk Calculations for Mallard at Red Butte Creek
Ecological Risk AssessmentRed Butte Creek
Salt Lake City, Utah
Media EPC
Bioaccumulation Model1
Food EPC Dose2Total Avian
Sediment Soil Surface Water PlantIncidental Sediment
IngestionSurface Water
IngestionPlant
Ingestion Dose TRV Hazard3
COPEC (mg/kg) (mg/L) BAF (mg/kg) (mg/kg-day) (mg/kg-day) (mg/kg-day) (mg/kg-day) (mg/kg-day) Quotient
TPH-DieselAromatics 51 NA 1.2 62 0.095 NA 3.5 3.6 NA --Aliphatics 51 NA 0.54 27 0.095 NA 1.5 1.6 NA --
TPH Motor OilAromatics 48 NA 1.2 58 0.089 NA 3.3 3.4 NA --Aliphatics 48 NA 0.54 26 0.089 NA 1.4 1.5 NA --
Bis(2-ethylhexyl) phthalate NA 0.028 NA NA NA 0.0016 NA 0.0016 1.1 0.0014
COPEC - Chemical of Potential Ecological ConcernEPC - Exposure Point Concentration. The maximum concentration was used as the EPC for this Screening Level evaluation.BAF - Bioaccumulation FactorNA - Not applicable or unavailableTRV - Toxicity Reference ValueHQ - Hazard Quotient1 -Food EPCs calculated using a point estimate bioaccumulation factor.2 -See text for dose calculations. 3 -Hazard Quotient = Total Dose/TRV
Preliminary DraftDo Not Cite or Quote

Table 8-3bRisk Calculations for Mallard in Reference Creeks
Ecological Risk AssessmentRed Butte Creek
Salt Lake City, Utah
Media EPC
Bioaccumulation Model1
Food EPC Dose2Total Avian
Sediment Soil Surface Water PlantIncidental Sediment
IngestionSurface Water
IngestionPlant
Ingestion Dose TRV Hazard3
COPEC (mg/kg) (mg/L) BAF (mg/kg) (mg/kg-day) (mg/kg-day) (mg/kg-day) (mg/kg-day) (mg/kg-day) Quotient
TPH Diesel 154Aromatics 77 NA 1.2 94 0.142 NA 5.2 5.4 NA --Aliphatics 77 NA 0.54 41 0.142 NA 2.3 2.5 NA --
TPH Motor Oil 98Aromatics 49 NA 1.2 60 0.091 NA 3.3 3.4 NA --Aliphatics 49 NA 0.54 26 0.091 NA 1.5 1.6 NA --
bis(2-ethylhexyl)phthalate NA ND NA NA NA -- 1.1 --
COPEC - Chemical of Potential Ecological ConcernEPC - Exposure Point Concentration. The maximum concentration was used as the EPC for this Screening Level evaluation.BAF - Bioaccumulation FactorNA - Not applicable or unavailableTRV - Toxicity Reference ValueHQ - Hazard Quotient1 -Food EPCs calculated using a point estimate bioaccumulation factor.2 -See text for dose calculations. 3 -Hazard Quotient = Total Dose/TRV
Preliminary DraftDo Not Cite or Quote
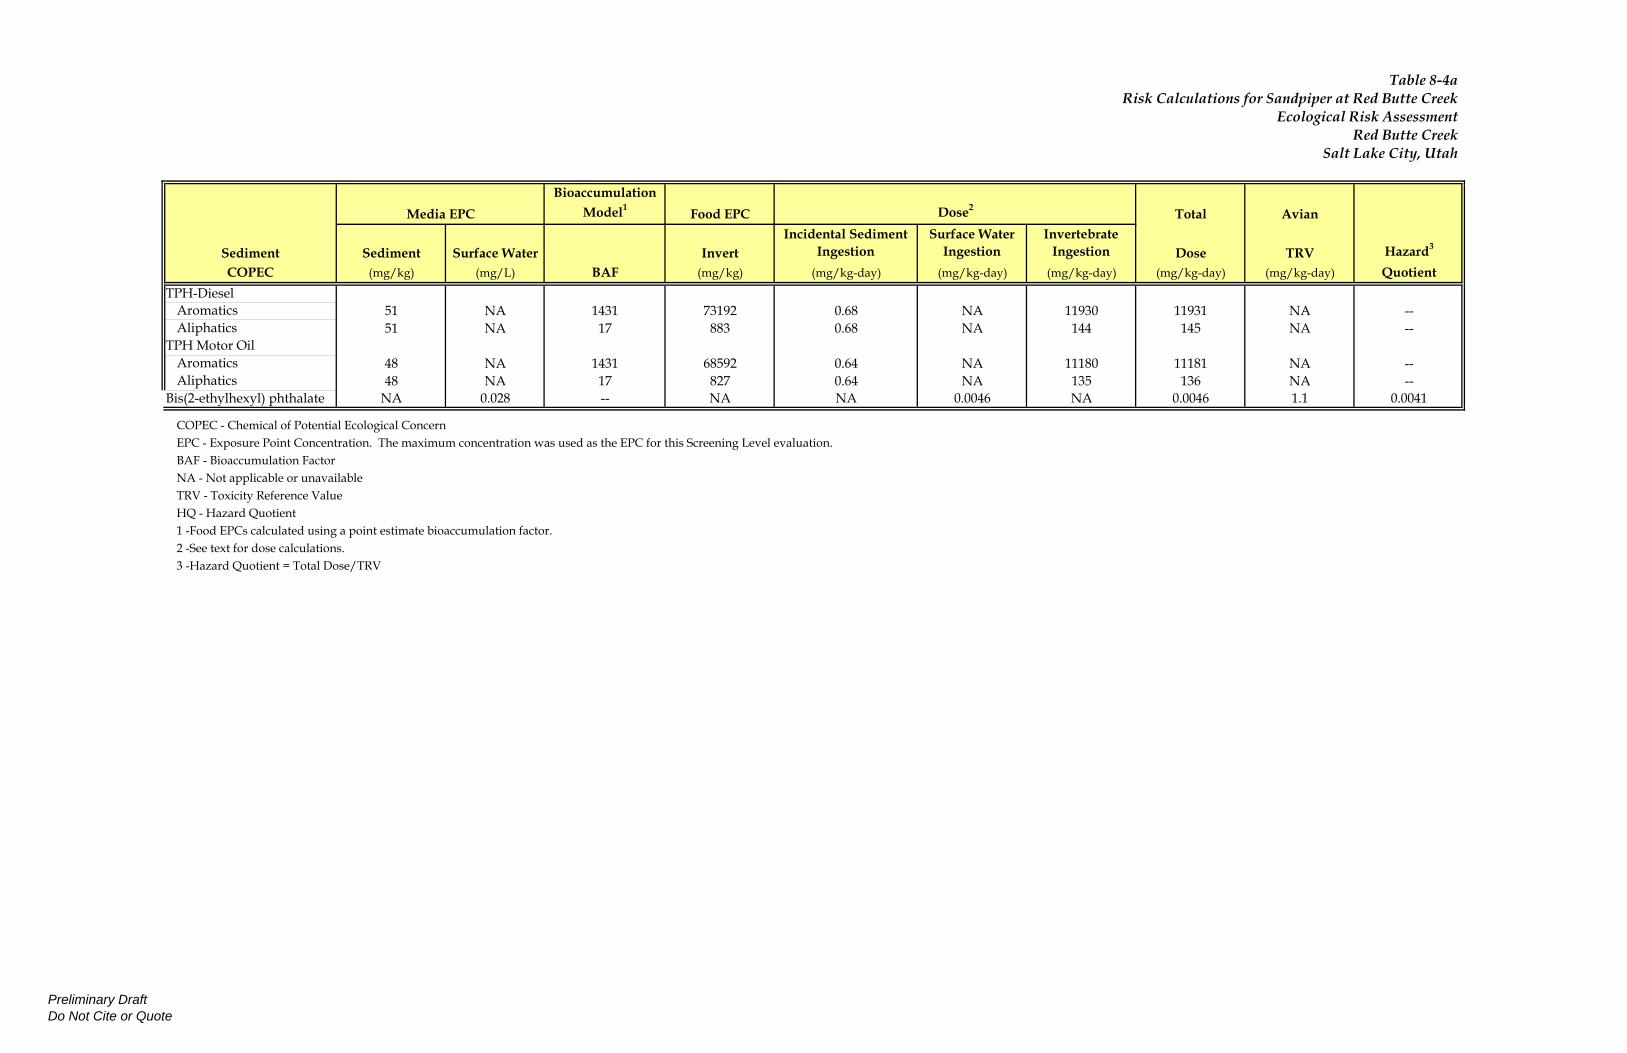
Table 8-4aRisk Calculations for Sandpiper at Red Butte Creek
Ecological Risk AssessmentRed Butte Creek
Salt Lake City, Utah
Media EPC
BioaccumulationModel1
Food EPC Dose2Total Avian
Sediment Sediment Surface Water InvertIncidental Sediment
IngestionSurface Water
IngestionInvertebrate
Ingestion Dose TRV Hazard3
COPEC (mg/kg) (mg/L) BAF (mg/kg) (mg/kg-day) (mg/kg-day) (mg/kg-day) (mg/kg-day) (mg/kg-day) Quotient
TPH-DieselAromatics 51 NA 1431 73192 0.68 NA 11930 11931 NA --Aliphatics 51 NA 17 883 0.68 NA 144 145 NA --
TPH Motor OilAromatics 48 NA 1431 68592 0.64 NA 11180 11181 NA --Aliphatics 48 NA 17 827 0.64 NA 135 136 NA --
Bis(2-ethylhexyl) phthalate NA 0.028 -- NA NA 0.0046 NA 0.0046 1.1 0.0041
COPEC - Chemical of Potential Ecological ConcernEPC - Exposure Point Concentration. The maximum concentration was used as the EPC for this Screening Level evaluation.BAF - Bioaccumulation FactorNA - Not applicable or unavailableTRV - Toxicity Reference ValueHQ - Hazard Quotient1 -Food EPCs calculated using a point estimate bioaccumulation factor.2 -See text for dose calculations. 3 -Hazard Quotient = Total Dose/TRV
Preliminary DraftDo Not Cite or Quote

Table 8-4bRisk Calculations for Sandpiper in Reference Creeks
Ecological Risk AssessmentRed Butte Creek
Salt Lake City, Utah
Media EPC
BioaccumulationModel1
Food EPC Dose2Total Avian
Sediment Sediment Surface Water InvertIncidental Sediment
IngestionSurface Water
IngestionInvertebrate
Ingestion Dose TRV Hazard3
COPEC (mg/kg) (mg/L) BAF (mg/kg) (mg/kg-day) (mg/kg-day) (mg/kg-day) (mg/kg-day) (mg/kg-day) Quotient
TPH Diesel 154Aromatics 77 NA 1431 110325 1.03 NA 17983 17984 NA --Aliphatics 77 NA 17 1331 1.03 NA 217 218 NA --
TPH Motor Oil 98Aromatics 49 NA 1431 70338 0.66 NA 11465 11466 NA --Aliphatics 49 NA 17 848 0.66 NA 138 139 NA --
bis(2-ethylhexyl)phthalate NA ND -- NA NA NA NA -- 1.1 --
COPEC - Chemical of Potential Ecological ConcernEPC - Exposure Point Concentration. The maximum concentration was used as the EPC for this Screening Level evaluation.BAF - Bioaccumulation FactorNA - Not applicable or unavailableTRV - Toxicity Reference ValueHQ - Hazard Quotient1 -Food EPCs calculated using a point estimate bioaccumulation factor.2 -See text for dose calculations. 3 -Hazard Quotient = Total Dose/TRV
Preliminary DraftDo Not Cite or Quote

Table 8-5aRisk Calculations for Muskrat at Red Butte Creek
Ecological Risk AssessmentRed Butte Creek
Salt Lake City, Utah
Media EPC
BioaccumulationModel1
Food EPC Dose2Total Mammal
Soil Soil Surface Water PlantIncidental Soil
IngestionSurface Water
IngestionPlant
Ingestion Dose TRV Hazard3
COPEC (mg/kg) (mg/L) BAF (mg/kg) (mg/kg-day) (mg/kg-day) (mg/kg-day) (mg/kg-day) (mg/kg-day) Quotient
TPH-DieselAromatics 51 NA 1.22 62 1.4 NA 19 20 3.0 6.7Aliphatics 51 NA 0.54 27 1.4 NA 8.2 9.7 10 0.97
TPH Motor OilAromatics 48 NA 1.2 58 1.4 NA 17 19 -- --Aliphatics 48 NA 0.54 26 1.4 NA 7.7 9.1 60 0.15
Bis(2-ethylhexyl) phthalate NA 0.028 NA 0.027 NA 0.027 18 0.0015TPH HI = 7.8
COPEC - Chemical of Potential Ecological ConcernEPC - Exposure Point Concentration. The maximum concentration was used as the EPC for this Screening Level evaluation.BAF - Bioaccumulation FactorNA - Not applicable or unavailableTRV - Toxicity Reference ValueHQ - Hazard Quotient1 -Food EPCs calculated using a point estimate bioaccumulation factor.
Preliminary DraftDo Not Cite or Quote
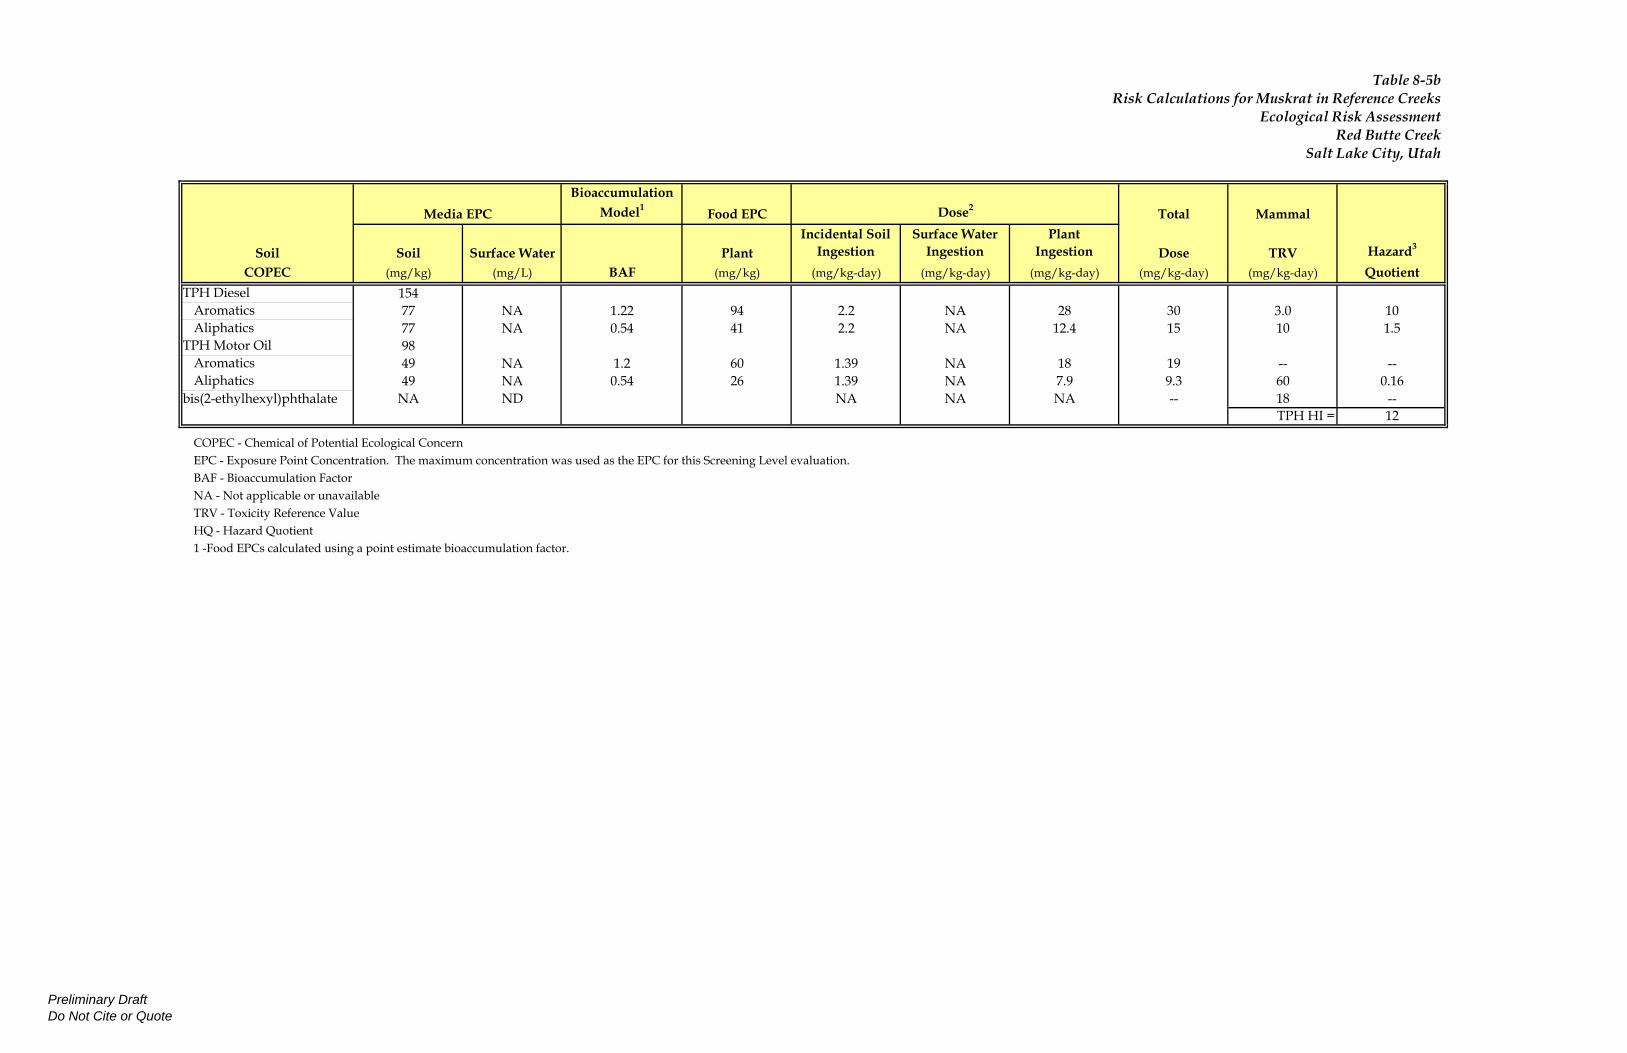
Table 8-5bRisk Calculations for Muskrat in Reference Creeks
Ecological Risk AssessmentRed Butte Creek
Salt Lake City, Utah
Media EPC
BioaccumulationModel1
Food EPC Dose2Total Mammal
Soil Soil Surface Water PlantIncidental Soil
IngestionSurface Water
IngestionPlant
Ingestion Dose TRV Hazard3
COPEC (mg/kg) (mg/L) BAF (mg/kg) (mg/kg-day) (mg/kg-day) (mg/kg-day) (mg/kg-day) (mg/kg-day) Quotient
TPH Diesel 154Aromatics 77 NA 1.22 94 2.2 NA 28 30 3.0 10Aliphatics 77 NA 0.54 41 2.2 NA 12.4 15 10 1.5
TPH Motor Oil 98Aromatics 49 NA 1.2 60 1.39 NA 18 19 -- --Aliphatics 49 NA 0.54 26 1.39 NA 7.9 9.3 60 0.16
bis(2-ethylhexyl)phthalate NA ND NA NA NA -- 18 --TPH HI = 12
COPEC - Chemical of Potential Ecological ConcernEPC - Exposure Point Concentration. The maximum concentration was used as the EPC for this Screening Level evaluation.BAF - Bioaccumulation FactorNA - Not applicable or unavailableTRV - Toxicity Reference ValueHQ - Hazard Quotient1 -Food EPCs calculated using a point estimate bioaccumulation factor.
Preliminary DraftDo Not Cite or Quote

Table 8-6aRisk Calculations for Raccoon at Red Butte Creek
Ecological Risk AssessmentRed Butte Creek
Salt Lake City, Utah
Media EPC
BioaccumulationModel1
Food EPC Dose2Total Mammal
Sediment Sediment Surface Water InvertsIncidental Sediment
IngestionSurface Water
IngestionInvertebrate
Ingestion Dose TRV Hazard3
COPEC (mg/kg) (mg/L) BAF (mg/kg) (mg/kg-day) (mg/kg-day) (mg/kg-day) (mg/kg-day) (mg/kg-day) Quotient
TPH-DieselAromatics 51 NA 1431 73192 2.6 NA 39304 39307 3.0 13102Aliphatics 51 NA 17 883 2.6 NA 474 477 10 48
TPH Motor OilAromatics 48 NA 1431 68592 2.4 NA 36834 36836 -- --Aliphatics 48 NA 17 827 2.4 NA 444 447 60 7.4
Bis(2-ethylhexyl) phthalate NA 0.028 -- NA NA 0.023 NA 0.023 18 0.0012
TPH HI = 13157
COPEC - Chemical of Potential Ecological ConcernEPC - Exposure Point Concentration. The maximum concentration was used as the EPC for this Screening Level evaluation.BAF - Bioaccumulation FactorNA - Not applicable or unavailableTRV - Toxicity Reference ValueHQ - Hazard Quotient1 -Food EPCs calculated using a point estimate bioaccumulation factor.2 -See text for dose calculations.
Preliminary DraftDo Not Cite or Quote

Table 8-6bRisk Calculations for Raccoon in Reference Creeks
Ecological Risk AssessmentRed Butte Creek
Salt Lake City, Utah
Media EPC
BioaccumulationModel1
Food EPC Dose2Total Mammal
Sediment Sediment Surface Water InvertsIncidental Sediment
IngestionSurface Water
IngestionInvertebrate
Ingestion Dose TRV Hazard3
COPEC (mg/kg) (mg/L) BAF (mg/kg) (mg/kg-day) (mg/kg-day) (mg/kg-day) (mg/kg-day) (mg/kg-day) Quotient
TPH Diesel 154Aromatics 77 NA 1431 110325 3.9 NA 59244 59248 3.0 19749Aliphatics 77 NA 17 1331 3.9 NA 715 719 10 72
TPH Motor Oil 98Aromatics 49 NA 1431 70338 2.5 NA 37771 37774 -- --Aliphatics 49 NA 17 848 2.5 NA 456 458 60 7.6
bis(2-ethylhexyl)phthalate NA ND -- NA NA NA NA -- 18 --TPH HI = 19829
COPEC - Chemical of Potential Ecological ConcernEPC - Exposure Point Concentration. The maximum concentration was used as the EPC for this Screening Level evaluation.BAF - Bioaccumulation FactorNA - Not applicable or unavailableTRV - Toxicity Reference ValueHQ - Hazard Quotient1 -Food EPCs calculated using a point estimate bioaccumulation factor.2 -See text for dose calculations.
Preliminary DraftDo Not Cite or Quote