working group on international deep pelagic ecosystem surveys
TRANSCRIPT
ICES SCIENTIFIC REPORTS
RAPPORTS SCIENTIFIQUES DU CIEM
ICES INTERNATIONAL COUNCIL FOR THE EXPLORATION OF THE SEA CIEM CONSEIL INTERNATIONAL POUR L’EXPLORATION DE LA MER
WORKING GROUP ON INTERNATIONAL DEEP PELAGIC ECOSYSTEM SURVEYS (WGIDEEPS)
VOLUME 3 | ISSUE 43

International Council for the Exploration of the Sea Conseil International pour l’Exploration de la Mer
H.C. Andersens Boulevard 44-46 DK-1553 Copenhagen V Denmark Telephone (+45) 33 38 67 00 Telefax (+45) 33 93 42 15 www.ices.dk [email protected]
ISSN number: 2618-1371
This document has been produced under the auspices of an ICES Expert Group or Committee. The contents therein do not necessarily represent the view of the Council. © 2021 International Council for the Exploration of the Sea.
This work is licensed under the Creative Commons Attribution 4.0 International License (CC BY 4.0). For citation of datasets or conditions for use of data to be included in other databases, please refer to ICES data policy.
ICES Scientific Reports
Volume 3 | Issue 43
WORKING GROUP ON INTERNATIONAL DEEP PELAGIC ECOSYSTEM SUR-VEYS (WGIDEEPS)
Recommended format for purpose of citation:
ICES. 2021. Working Group on International Deep Pelagic Ecosystem Surveys (WGIDEEPS). ICES Scientific Reports. 3:43. 32pp. https://doi.org/10.17895/ices.pub.8056
Editors
Matthias Bernreuther • Hannes Höffle
Authors
Alexey Astakhov • Matthias Bernreuther • Hannes Höffle • Vladimir Khlivnoy • Kristján Kristinsson Aleksei Rolskiy
ICES | WGIDEEPS 2021 | i
Contents
i Executive summary ....................................................................................................................... ii ii Expert group information ..............................................................................................................iii 1 Cancellation of the Icelandic participation and future of the survey in the Irminger Sea
and adjacent water ........................................................................................................................ 1 2 Planning of the international trawl/acoustic survey on redfish in the Irminger Sea and
adjacent waters in June/July 2021 ................................................................................................ 2 2.1 Vessels, timing and survey area ....................................................................................... 2 2.2 Data exchange ................................................................................................................. 2 2.3 Trawling ........................................................................................................................... 3 2.4 Further Issues ................................................................................................................... 3 2.4.1 Exchange of experts ......................................................................................................... 3 Germany and Russia invited other participants to join their part of the survey.
Due to staff limitation, the German survey partner will not be able to send a guest scientist from its labs onto the other vessel. The Russian Federation has expressed interest in the offer and communications have started, whether a participation is practically feasible due to the various Covid-19 restrictions. .................................................................................................... 3
2.4.2 Participation of further countries .................................................................................... 3 2.4.3 Time schedule for the survey report................................................................................ 4
3 Evaluation of the calculation of biomass and abundance indices derived from the trawl method in the Irminger Sea. .......................................................................................................... 5
4 Extent of the deep scattering layer in the deep pelagic ecosystem survey 2019 in the Norwegian Sea ............................................................................................................................... 7
5 ICES Acoustic Data Portal .............................................................................................................. 9 6 References ................................................................................................................................... 10 Annex 1: List of participants.......................................................................................................... 11 Annex 2: Information on communication between vessels for the Irminger Sea survey ............. 12 Annex 3: Cruise tracks ................................................................................................................... 13 Annex 4: Terms of Reference for next meeting. ........................................................................... 15 Annex 5: Working Document 1 ..................................................................................................... 16 Annex 6: Working Document 2 ..................................................................................................... 24

ii | ICES SCIENTIFIC REPORTS 3:43 | ICES
i Executive summary
The Working Group on International Deep Pelagic Ecosystem Surveys (WGIDEEPS) plans and reports on the international hydroacoustic-trawl surveys on pelagic redfish in the Irminger and Norwegian seas.
The detailed planning of the international trawl/acoustic survey on pelagic redfish in the Irminger Sea and adjacent waters in June/July 2021 has been agreed by all participating countries. Prior to the meeting, the Icelandic delegation informed group members that Iceland will not participate in the June/July 2021 IDEEEPS. To cover the whole distribution area of pelagic redfish in the Irminger Sea a minimum three vessels are needed. The scope of the survey therefore needed to be altered and will be carried out in a similar manner as in 2015 where the emphasis is on covering the main distribution area of redfish in the north and south-eastern area (subareas A and B) and part of the south-western area (subarea E). Two vessels from Germany and Russia will participate in the survey and operate within an area of around 270 000 square nautical miles (NM2) in the Irminger Sea to estimate the abundance and biomass of pelagic redfish (Sebastes mentella). In the depth zone that can be surveyed by hydroacoustic measurements, i.e. shallower than the deep-scattering layer (DSL; down to about 350 m), hydroacoustic measurements and identification trawls will be carried out. Within and below the DSL (down to about 950 m), red-fish abundance will be estimated by trawls. The trawl method applied is the same as in the 2009-2018 surveys and is in line with the recommendation from ICES to study separately the stocks shallower and deeper than 500 m. As in past surveys, biological data will be collected from the redfish caught in the pelagic trawls, and hydrographical measurements will be taken on regular stations on the survey tracks.
Work on a more direct approach to biomass and abundance estimation was presented and dis-cussed at the meeting, but no decision was taken on applying the new method for the estimation of biomass and abundance of the deep pelagic stock. Additionally, two alternative methods of standardizing the biomass index were presented and discussed, but no decision was taken on applying an alternative method in the index estimation.
It was recognized that the methods presented to the group should best be presented, discussed and tested for their applicability at a future benchmark of redfish stocks.
ICES | WGIDEEPS 2021 | iii
ii Expert group information
Expert group name Working Group on International Deep Pelagic Ecosystem Surveys (WGIDEEPS)
Expert group cycle Multiannual fixed term
Year cycle started 2020
Reporting year in cycle 2/3
Chair(s) Hannes Höffle, Norway
Matthias Bernreuther, Germany
Meeting venue(s) and dates 25-27 August 2020, Virtual meeting (4 participants)
16-19 February 2021, Virtual meeting (6 participants)
ICES | WGIDEEPS 2021 | 1
1 Cancellation of the Icelandic participation and fu-ture of the survey in the Irminger Sea and adjacent water
In December 2020, the Freshwater and Marine Research Institute (MFRI) in Iceland informed the group that Iceland will not participate in the survey in June/July 2021. No specific reasons were given for the withdrawal.
It is the view of the Group that the withdrawal of Iceland from the international redfish survey in the Irminger Sea and adjacent waters is very unfortunate. No alternatives that could be ar-ranged for compensating the corresponding loss of survey coverage at the time being. For this reason, the group decided to focus mainly on surveying pelagic redfish in areas where in previ-ous surveys it has been observed to be most abundant, which is in the north and south-eastern part of the research area (subareas A and B), but also to cover part of the south-western area (subarea E), where in the past a relative high abundance of the shallow pelagic S. mentella has been observed.
With only two vessels participating in the survey in 2021, the quality of the survey is seriously hampered and it may also undermine any scientific advice that ICES may provide to national and international bodies.
The future of the pelagic redfish survey in the Irminger Sea and adjacent waters was briefly dis-cussed during the meeting. It is clear to the group that both management bodies and individual nations consider the pelagic redfish research not a high priority. Cancellation of participation of individual nations is often with short notice which means it is impossible to compensate the corresponding loss of survey coverage. The group encourages participant nations and relevant institutes to discuss the importance and priority of pelagic redfish surveys in the Irminger Sea and adjacent waters and decide whether the surveys should be carried out in the future.
2 | ICES SCIENTIFIC REPORTS 3:43 | ICES
2 Planning of the international trawl/acoustic survey on redfish in the Irminger Sea and adjacent waters in June/July 2021
The survey manual for the survey conducted in the Irminger Sea and adjacent waters is pub-lished under the Series of ICES Survey Protocols (SISP) and describes in detail the planning of the survey (ICES, 2015). Specific issues that are revised before the survey are described in this section.
2.1 Vessels, timing and survey area
The main objective of this survey is the trawl-acoustic assessment of the pelagic redfish stocks in the Irminger Sea and adjacent waters in June/July 2021. The group agreed to continue to cover the area from 55°00’N to 65°30´N and from the 25°W in the east till western boundary to 50°W.
Below is the list of research vessels which will participate in the IDEEP survey in the Irminger Sea and adjacent waters in June/July 2021, time period engaged to the survey and approximate time and number of days in the field:
Name of the vessel Country Period Approx. working period in the field Days in field
Atlantida Russia 6 June – 27 July 15 June – 16 July 32
Walther Herwig III Germany 7 June – 11 July ~14 June – 4 July 20
The vessels will communicate daily via e-mail or telex or telephone. Information on the commu-nication between vessels is given in Annex 2.
In Figure 1 and Table 1 in Annex 3 the planned survey tracks are displayed for each participating vessel.
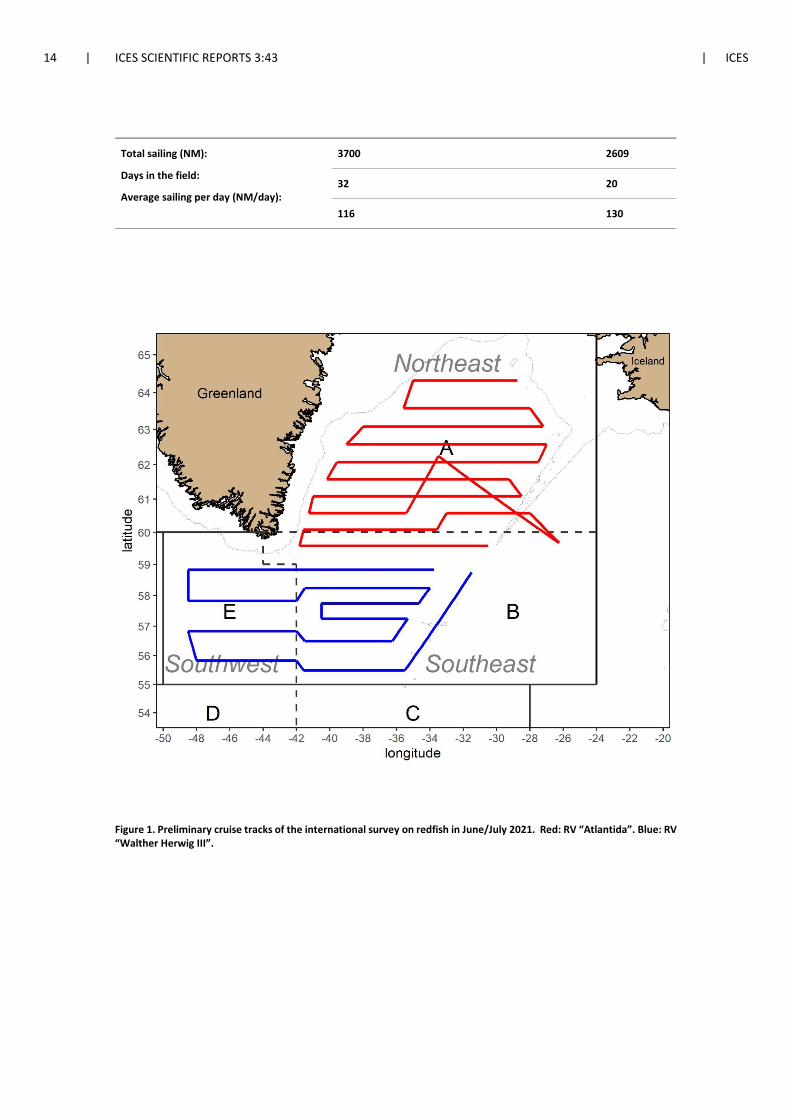
“Atlantida” will cover the northeastern area (subarea A) completely and part of subarea B. “Wal-ther Herwig III” will cover part of the southeastern area (subarea B) and part of the southwestern area (subarea E). The total length of the planned survey tracks is about 6,309 nautical miles (NM), divided between the vessels as follows: “Atlantida” 3,700 NM and “Walther Herwig III” 2,609 NM.
The cruise leaders of these vessels will apply for entry into the relevant EEZs by notifications to Greenland and Iceland. The operations in the NAFO Convention Area will be notified to NAFO by the German cruise leader.
2.2 Data exchange
Daily reporting between the vessels is performed using the data sheet given in Annex 2 of the survey manual (ICES, 2015). A deviation from this reporting scheme is the reporting of round-nose grenadier (Coriphaenoides rupestris). Catches of roundnose grenadier will be reported be-tween the research vessels in the data sheet in Annex 2 (ICES, 2015) as additional columns or as an additional work sheet. Length of each individual grenadier will be reported with a precision of 1 mm (below) and weight with a precision of 1 g because usually small juvenile individuals

ICES | WGIDEEPS 2021 | 3
are expected to be present in the catches. Maturity stage and stomach fullness will be recorded and otoliths and scales will also be collected.
2.3 Trawling
Russia’s position regarding the stock structure of redfish in the Irminger Sea remains unchanged, i.e. that there is a single stock of S. mentella in that area. With that in view, Russia does not agree with the ICES advice splitting the stock into two nor with the recommendation to conduct strat-ified surveys dividing the water column arbitrarily into 0-500 and 500-1000 m depth intervals, which generally does not contribute to better quality of stock assessment.
However, recognizing the need to obtain more accurate abundance and biomass estimates, in the light of possible underestimation of the stock by the 2009 international TAS results, the Rus-sian Federation agrees to conduct sampling in the international trawl and acoustic survey of S. mentella as described in the ICES Survey Protocol (ICES, 2015). However, Russia will not be able to agree with separate estimates for the stock distributing above 500 m and below 500 m.
If possible, the inflow of redfish into the trawl at the depth intervals described above should be estimated by a probe device mounted to the net.
2.4 Further Issues
2.4.1 Exchange of experts
Germany and Russia invited other participants to join their part of the survey. Due to staff limi-tation, the German survey partner will not be able to send a guest scientist from its labs onto the other vessel. The Russian Federation has expressed interest in the offer and communica-tions have started, whether a participation is practically feasible due to the various Covid-19 restrictions. 2.4.2 Participation of further countries
The Group is again facing the problem of covering the entire survey area with only two vessels, resulting in a large spacing of survey tracks and trawl hauls and the geographical area of redfish not being covered completely. To improve the precision of the survey by increasing the density of the tracks and trawl stations, additional vessels should take part in the survey. The Group recommended as in 2005 that “at least four vessels should participate to allow a sufficiently dense coverage of the survey area and to permit an improvement in the quality of the derived abun-dance and biomass estimates. Thus, the efforts directed at involving other nations in the survey should be continued.”
Notwithstanding the disappointing outcome of earlier attempts, the group will continue its ef-forts in involving further countries in the survey. The group also notes that other non-EU coun-tries involved in the fishery should consider their participation in the survey.
The group considered it appropriate to approach NEAFC to get nations involved in the commer-cial fishery to participate in the surveys. This should be done through the ICES Secretariat with an official letter to NEAFC.
4 | ICES SCIENTIFIC REPORTS 3:43 | ICES
2.4.3 Time schedule for the survey report
The final reporting will take place during the next virtual WGIDEEPS meeting from 17–19 Au-gust 2021. To finalize the work in three days, the following plan will be followed:
As soon as the vessel has finished scrutinizing the acoustic data, after the survey tracks are fin-ished, the data must be sent to the other participant. Not later than 1 August 2021, all data shall be sent via e-mail to the cruise leaders and co-chairs. The data shall be sent in the format de-scribed in Annexes 3 and 4 in the SISP manual (ICES, 2015) and all participants shall have a copy in an electronic format.
Russia will calculate the abundance estimation of the redfish within and deeper than the DSL, including writing of the material and methods, results and discussion.
Russia will work up the environmental data, including the drawing of graphs, writing of the material and methods, results and discussion.
Russia will calculate and finalize the acoustic data, including writing of the material and meth-ods, results and discussion. Russia will also draw the cruise tracks and information on stations.
Germany will be responsible for writing about biological results, including writing of the mate-rial and methods, results and discussion.
All drafts must be sent to the WGIDEEPS co-chairs before 19 August 2021.
ICES | WGIDEEPS 2021 | 5
3 Evaluation of the calculation of biomass and abun-dance indices derived from the trawl method in the Irminger Sea.
Summary of the proposal by Iceland for the calculation of the survey index of deep pelagic redfish (Working document 1, Annex 5).
The method currently used to calculate biomass indices within and deeper than the Deep Scat-tering Layer (DSL) from the trawl data are based on a combination of standardized survey catches and the hydroacoustic data. A proportional relationship is assumed between trawl catch and acoustic values (sA) during trawling in the shallower layer (0–350 m) where redfish can be acoustically identified. This relationship is used to predict acoustic values (sA) for trawl catch in the deeper layer. That is, trawl catch indices are transformed into acoustic values (sA) and then biomass is estimated in similar manner as biomass estimates based on acoustic measurements.
It was recognized by the group in 2017 (ICES, 2017) that the current approach used to estimate biomass in deeper layers, that is to translate trawl catch indices into acoustic energy (sA), should be replaced by a more direct approach to biomass and abundance estimation, using swept vol-ume estimates.
In this Working Document the approach proposed in 2017 (see Annex 3 in the 2017 ICES WGIDEEPS report) was tested. Results indicate that in relative terms the results are similar to the results obtained with the current method. Results are presented in Working Document 1.
Summary of the proposal by Russia for a standardization of biomass indices of the beaked redfish stock in the Irminger Sea (Working document 2, Annex 6).
During the international trawl-acoustic survey of the beaked redfish in the Irminger Sea, a grad-ually decrease in the research area is noted. There has been a rapid decrease in the survey area since 2015. The area covered by the survey was reducing from 420 thousand square miles in 2001 to 200 thousand square miles in 2015, what means that the survey area was reduced more than two times. In 2018, the research area was decreased to 103 thousand square miles. The interan-nual differences in the research area has a negative impact on the assessment.
Currently, surveys can be carried out only in a small part of the initial survey area due decrease in the number of countries participating in the survey. It can lead to incorrect conclusions about the state of the stock. An analysis of the impact of decrease in the survey area on the stock as-sessment was presented at the NWWG (Khlivnoy, Astakhov, Gavrilik, Popov, 2019).
In 2019, following the submission of information on the difference in the survey area and impact of decrease in research area on stock assessment, the North-Western Working Group (NWWG) recommended that the compilation of the survey indices should be reviewed at WGIDEEPS.
In WD 2 (see Annex 6), two alternative derivations of a biomass index were presented and dis-cussed at WGIDEEPS 2021. The aim of that work was a standardization of indices to exclude the effect of annual changes in the size of surveyed area. Two methods of deriving indices were presented in WD2:

6 | ICES SCIENTIFIC REPORTS 3:43 | ICES
1. Biomass index was estimated in similar fashion described as has been done since 1999 but restricted in the standard area, which was covered by all surveys (Subarea A). In the future, the standard area can be increased with including the part of Subareas B and E covered by all the surveys. Standardized indices were estimated for three layers: above the DSL, in the DSL above 500 m and in the layer deeper than 500 m. Biomass estimates in Subarea A are found in Tables 7 and 9 in the 2018 WGIDEEPS report (ICES, 2018) and in Tables 10.2.1, 10.2.2a and 10.2.2b the 2004 NWWG report (ICES, 2004).
2. Density index (t/nmi2) was derived from the total annual survey biomass divided by the total annual survey area covered. Data on the stock biomass and the survey area were taken from the reports of the 2018 WGIDEEPS (ICES, 2018) and 2014 NWWG (ICES, 2014).
The analysis showed that generally there is a similarity in the dynamics of the non-standardized indices (assessed the entire survey area) and standardized indices (assessed by both methods). However, an increase in the research area leads to an increase in the calculated biomass index and in value of differences between those indices. WD2 concludes that standardization of indices reduces the impact of interannual differences in the survey area and propose used that indices to stock assessment.
During the working group meeting this proposal for calculation of biomass indices was dis-cussed. It was recognized that this method should best be discussed and tested for its applicabil-ity at a future benchmark of this stock.
NOTE: The methods presented here were discussed at the NWWG meeting in April 2019. There was and is no consensus within the NWWG group on how to derive survey biomass index used in the assessment. NWWG recommended that the compilation of the survey indi-ces should be reviewed at WGIDEEPS. During the WGIDEEPS meeting in 2021, the methods presented above were introduced to the group, but no consensus was reached.
The effect of the survey area coverage in 2015 and 2018 surveys, and the appropriateness of the biomass indices, was investigated at the 2019 meeting. The most extensive coverage was in 2001 (440 000 nmi2) which most likely comprise most of the stock distribution. In 2003–2013 the area covered by the survey was around 350 000 nmi2 and covered the main part distribution of the stock. However, in the last two surveys the area covered was reduced. In the 2015 survey, when the survey area was reduced to 201 000 nmi2, attempts were made to ensure that the distribution of the deep pelagic stock was covered by surveying areas A and B. Unfortunately, due to unfore-seen circumstances in 2018 survey was unable to cover area B, reducing the survey area to area A with a coverage of 103 000 nmi2. Therefore in 2018, the total area of coverage was reduced twofold compared with the previous survey area in 2015.
ICES | WGIDEEPS 2021 | 7
4 Extent of the deep scattering layer in the deep pe-lagic ecosystem survey 2019 in the Norwegian Sea
In the open Norwegian Sea, the Deep Scattering Layer (DSL), formed by a high density of mes-opelagic organisms below 200 m depth, can be very pronounced. The DSL is part of the mesope-lagic zone. Many of these organisms perform characteristic diurnal vertical migrations, rising to the epipelagic zone during the night. However, the long daylight length during the survey pe-riod (11 - 28 August in 2019) largely prevents to observe such migrations.
Like for earlier surveys, the acoustic energy reflected by organism in the two zones (meso- and epipelagic) was registered as an integrated abundance measure, following the method of Siegel-man-Charbit and Planque (2016). Here, the biological signals in the two zones are categorized as separate acoustic categories. Whereas the lower boundary of the mesopelagic zone was specified as 800 m, the upper boundary varied between 400 m and 200 m depending on the extent of the DSL. The biological signal above this upper mesopelagic boundary was categorized as the epi-pelagic zone. As this is a deep sea pelagic survey, areas with a bottom depth of less than 400 m were not considered, which applies to small portions of the survey track above the shelf break.
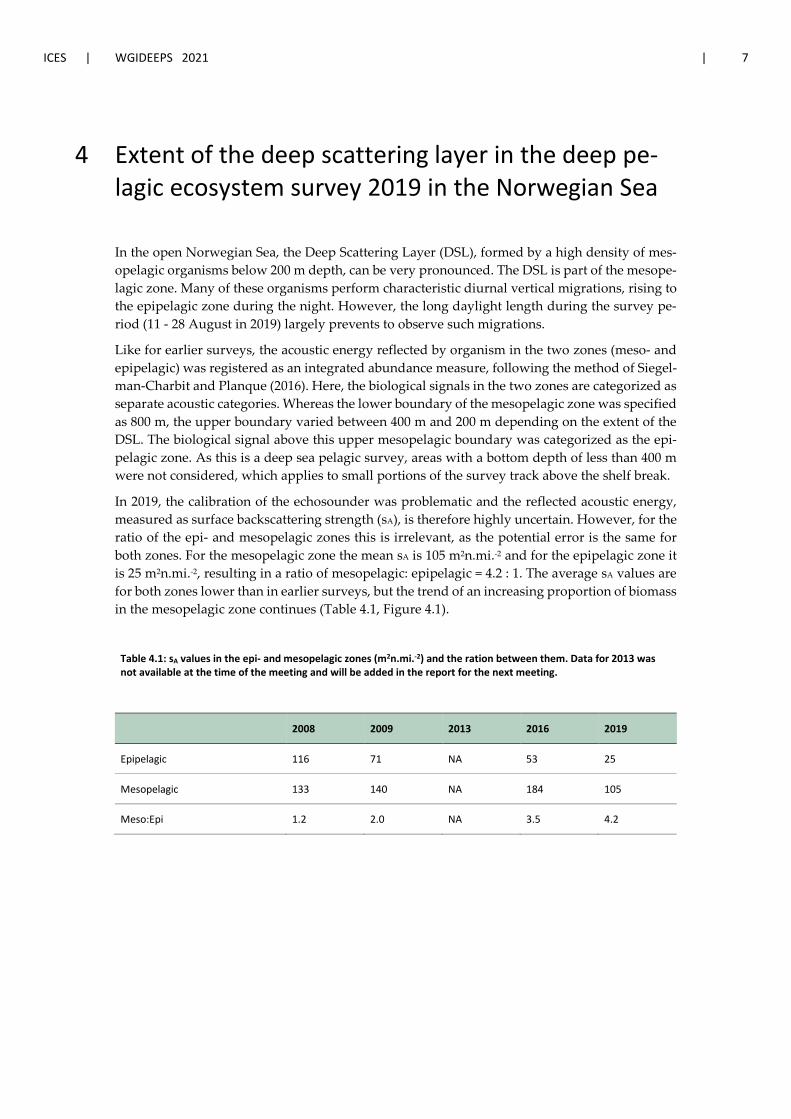
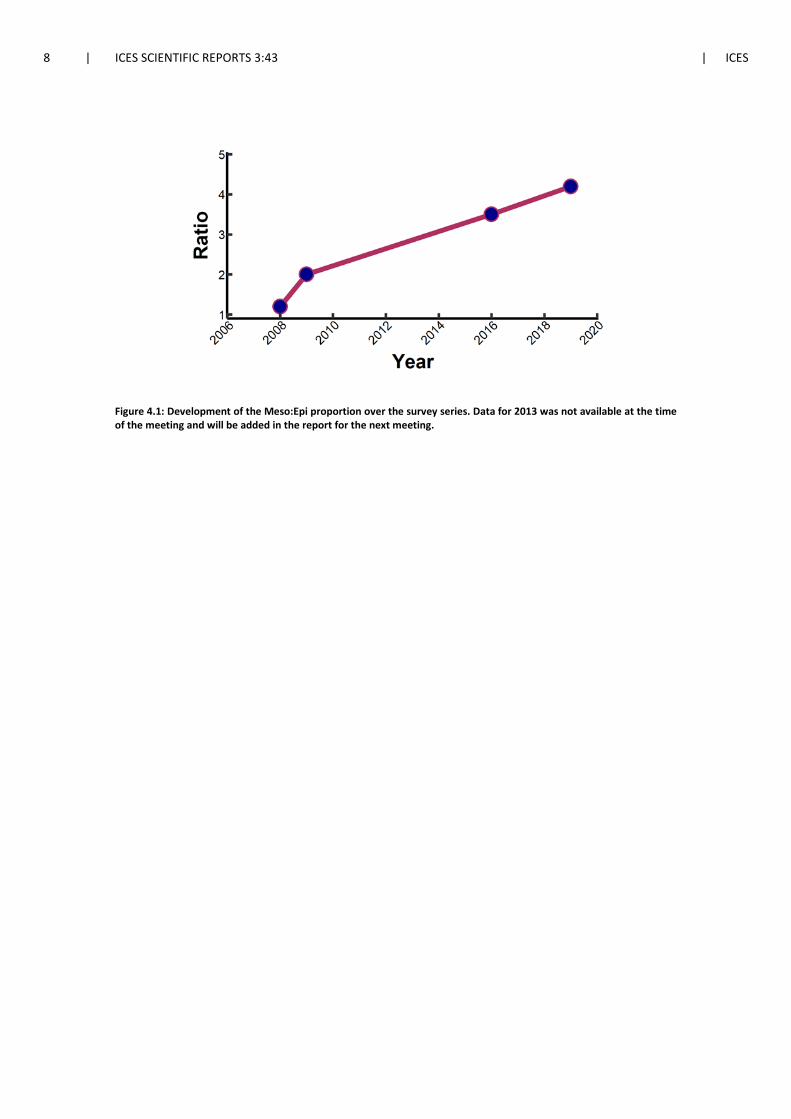
In 2019, the calibration of the echosounder was problematic and the reflected acoustic energy, measured as surface backscattering strength (sA), is therefore highly uncertain. However, for the ratio of the epi- and mesopelagic zones this is irrelevant, as the potential error is the same for both zones. For the mesopelagic zone the mean sA is 105 m2n.mi.-2 and for the epipelagic zone it is 25 m2n.mi.-2, resulting in a ratio of mesopelagic: epipelagic = 4.2 : 1. The average sA values are for both zones lower than in earlier surveys, but the trend of an increasing proportion of biomass in the mesopelagic zone continues (Table 4.1, Figure 4.1).
Table 4.1: sA values in the epi- and mesopelagic zones (m2n.mi.-2) and the ration between them. Data for 2013 was not available at the time of the meeting and will be added in the report for the next meeting.
2008 2009 2013 2016 2019
Epipelagic 116 71 NA 53 25
Mesopelagic 133 140 NA 184 105
Meso:Epi 1.2 2.0 NA 3.5 4.2
8 | ICES SCIENTIFIC REPORTS 3:43 | ICES
Figure 4.1: Development of the Meso:Epi proportion over the survey series. Data for 2013 was not available at the time of the meeting and will be added in the report for the next meeting.
ICES | WGIDEEPS 2021 | 9
5 ICES Acoustic Data Portal
One of the recurring ToRs of WGIDEEPS is the finalization of the transfer of trawl survey data from international deep pelagic ecosystem surveys coordinated by the group to ICES DATRAS databases. The group has so far not been successful in completing this task. At this year´s plan-ning meeting, Hjalte Parner from ICES Data Centre presented the ICES Acoustic Data Portal. In the course of the presentation, the group recognized the possibilities of that portal in hosting not only the hydroacoustic data, but also the trawl and hydrographic data. The WG discussed the switch from uploading the trawl data to DATRAS to start uploading the hydroacoustic, trawl and hydrographic data to the Acoustic Data Portal. However, a decision has not been made and will be discussed in the upcoming working group meetings.
10 | ICES SCIENTIFIC REPORTS 3:43 | ICES
6 References
ICES (2004). Report of the North Western Working Group (NWWG). 27 April-6 May. Copenhagen, Den-mark. ICES CM 2004/ACFM:25. 476 pp.
ICES (2014). Report of the North-Western Working Group (NWWG), 24 April-1 May 2014, ICES HQ, Co-penhagen, Denmark. ICES CM 2014/ACOM:07.902 pp.
ICES (2015). Manual for the International Deep Pelagic Ecosystem Survey in the Irminger Sea and Adjacent Waters. Series of ICES Survey Protocols SISP 11 – IDEEPS VI. 49 pp.
ICES (2017). Interim Report of the Working Group on International Deep Pelagic Surveys. WGIDEEPS Re-port 2017 25-27 April 2017. ICES Headquarters, Denmark. ICES CM 2017/SSGIEOM:14. 13 pp.
ICES (2018). Report of the North Western Working Group (NWWG). 26 April-3 May 2018. Copenhagen, Denmark. ICES CM 2018. 802 pp.
Khlivnoy V.N., Astakhov A.Yu., Gavrilik T.N., Popov V.I., (2019). Refining the assessment of the beaked redfish stock in the Irminger Sea taking into account the data of the International Trawl-Acoustic Sur-vey in 2018. WD on NWWG. Copenhagen, Denmark. 28 pp.
Kristinsson, Kristján (2015). Methodology of biomass estimation of deep pelagic beaked redfish (Sebastes mentella) from the international redfish survey in the Irminger Sea and adjacent waters. Working Group on International Deep Pelagic Ecosystem Survey (WGIDEEPS) 2015, Working document 1, 17 pp.
Siegelman-Charbit, L., Planque, B. (2016). Abundant mesopelagic fauna at oceanic high latitudes. Marine Ecology Progress Series, 546: 277-282.

ICES | WGIDEEPS 2021 | 11
Annex 1: List of participants
Name Institute Country (of insti-tute)
Alexey Astakhov Atlantic Branch of the Russian Federal Re-search Institute of Fisheries and Oceanog-raphy (AtlantNIRO)
Russian Federation [email protected]
Matthias Bernreuther (co-chair)
Thünen Institute of Sea Fisheries Germany [email protected]
Hannes Höffle (co-chair)
Institute of Marine Research Norway [email protected]
Vladimir Khlivnoy Polar Branch of the Russian Federal Re-search Institute of Fisheries and Oceanog-raphy (PINRO named after N.M. Knipovich)
Russian Federation [email protected]
Kristján Kristinsson Marine and Freshwater Research Institute Iceland [email protected]
Aleksei Rolskii Polar Branch of the Russian Federal Re-search Institute of Fisheries and Oceanog-raphy (PINRO named after N.M. Knipovich)
Russian Federation [email protected]

12 | ICES SCIENTIFIC REPORTS 3:43 | ICES
Annex 2: Information on communication be-tween vessels for the Irminger Sea sur-vey
RV “Atlantida” (Russia)
Call sign: UALU
Inmarsat C IMN: 427301487
E-mail: [email protected]
RV “Walther Herwig III” (Germany)
Call sign: DBFR
Telephone: 00870 763936068
Telefax: 00870 763936070 or
00870 600365043
Data: 00870 600365042
Inmarsat C (Telex): +581 421121550
e-mail: [email protected]
ICES | WGIDEEPS 2021 | 13
Annex 3: Cruise tracks
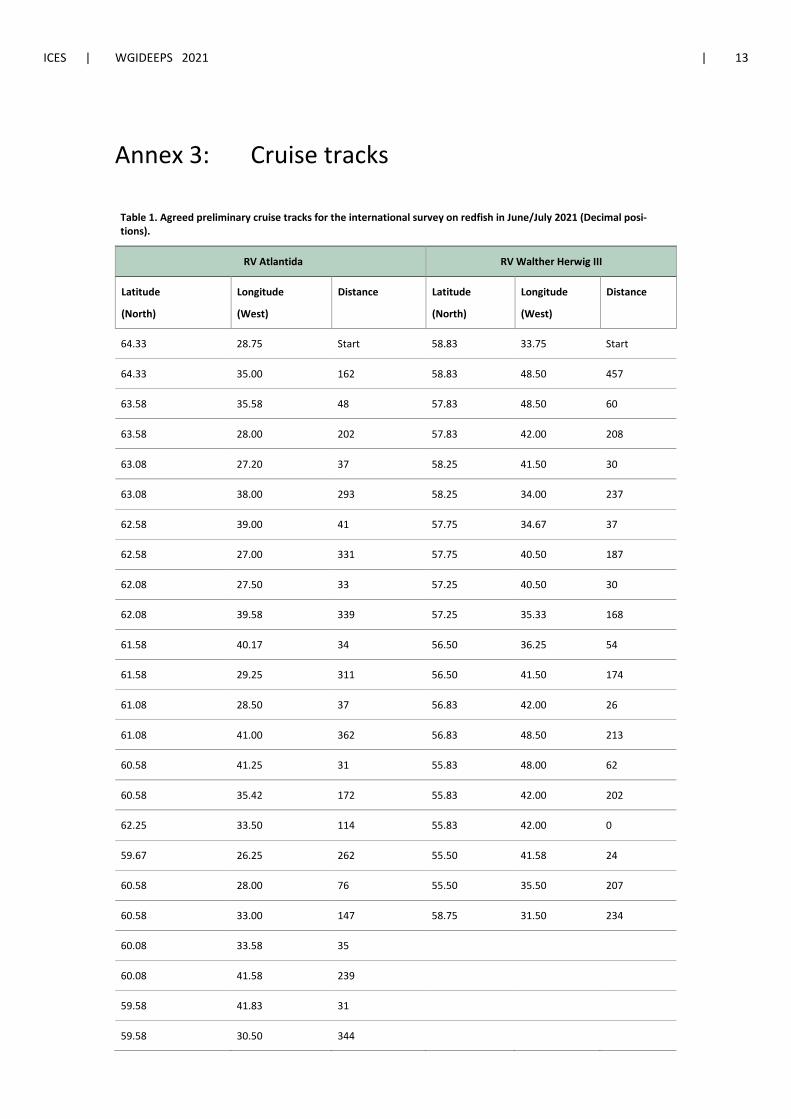
Table 1. Agreed preliminary cruise tracks for the international survey on redfish in June/July 2021 (Decimal posi-tions).
RV Atlantida RV Walther Herwig III
Latitude
(North)
Longitude
(West)
Distance Latitude
(North)
Longitude
(West)
Distance
64.33 28.75 Start 58.83 33.75 Start
64.33 35.00 162 58.83 48.50 457
63.58 35.58 48 57.83 48.50 60
63.58 28.00 202 57.83 42.00 208
63.08 27.20 37 58.25 41.50 30
63.08 38.00 293 58.25 34.00 237
62.58 39.00 41 57.75 34.67 37
62.58 27.00 331 57.75 40.50 187
62.08 27.50 33 57.25 40.50 30
62.08 39.58 339 57.25 35.33 168
61.58 40.17 34 56.50 36.25 54
61.58 29.25 311 56.50 41.50 174
61.08 28.50 37 56.83 42.00 26
61.08 41.00 362 56.83 48.50 213
60.58 41.25 31 55.83 48.00 62
60.58 35.42 172 55.83 42.00 202
62.25 33.50 114 55.83 42.00 0
59.67 26.25 262 55.50 41.58 24
60.58 28.00 76 55.50 35.50 207
60.58 33.00 147 58.75 31.50 234
60.08 33.58 35
60.08 41.58 239
59.58 41.83 31
59.58 30.50 344
14 | ICES SCIENTIFIC REPORTS 3:43 | ICES
Total sailing (NM):
Days in the field:
Average sailing per day (NM/day):
3700 2609
32 20
116 130
Figure 1. Preliminary cruise tracks of the international survey on redfish in June/July 2021. Red: RV “Atlantida”. Blue: RV “Walther Herwig III”.
ICES | WGIDEEPS 2021 | 15
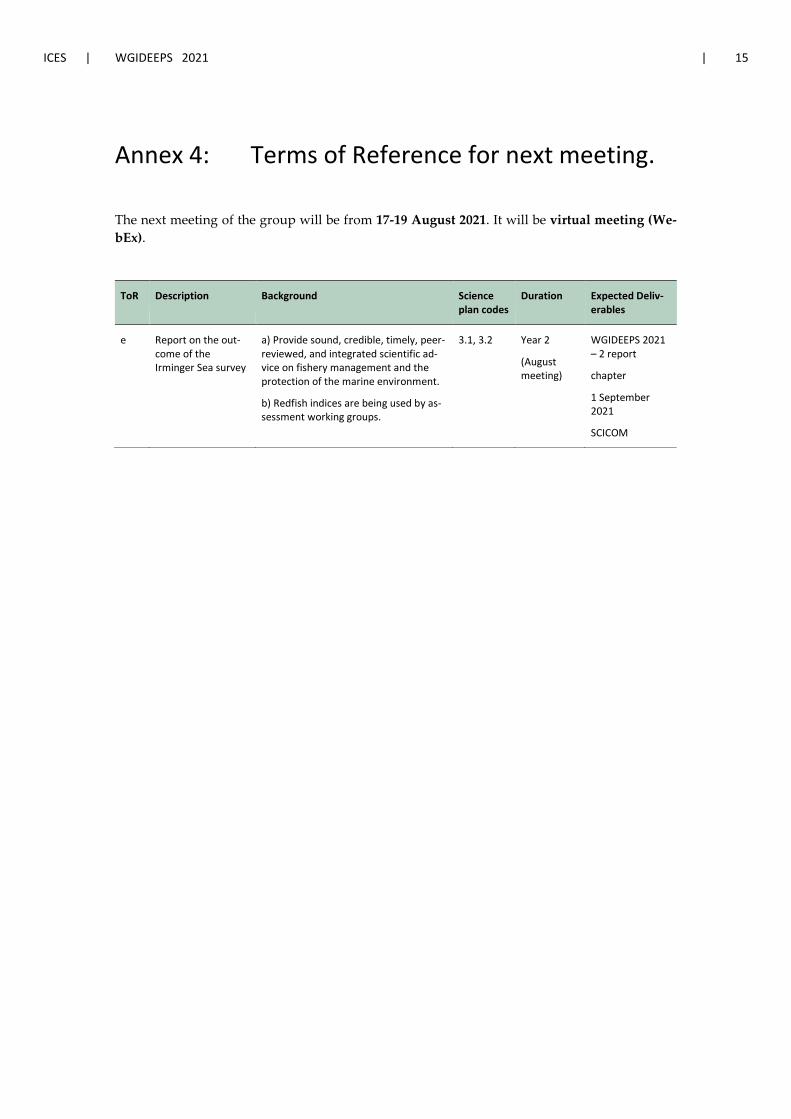
Annex 4: Terms of Reference for next meeting.
The next meeting of the group will be from 17-19 August 2021. It will be virtual meeting (We-bEx).
ToR Description Background Science plan codes
Duration Expected Deliv-erables
e Report on the out-come of the Irminger Sea survey
a) Provide sound, credible, timely, peer-reviewed, and integrated scientific ad-vice on fishery management and the protection of the marine environment.
b) Redfish indices are being used by as-sessment working groups.
3.1, 3.2 Year 2
(August meeting)
WGIDEEPS 2021 – 2 report
chapter
1 September 2021
SCICOM
16 | ICES SCIENTIFIC REPORTS 3:43 | ICES
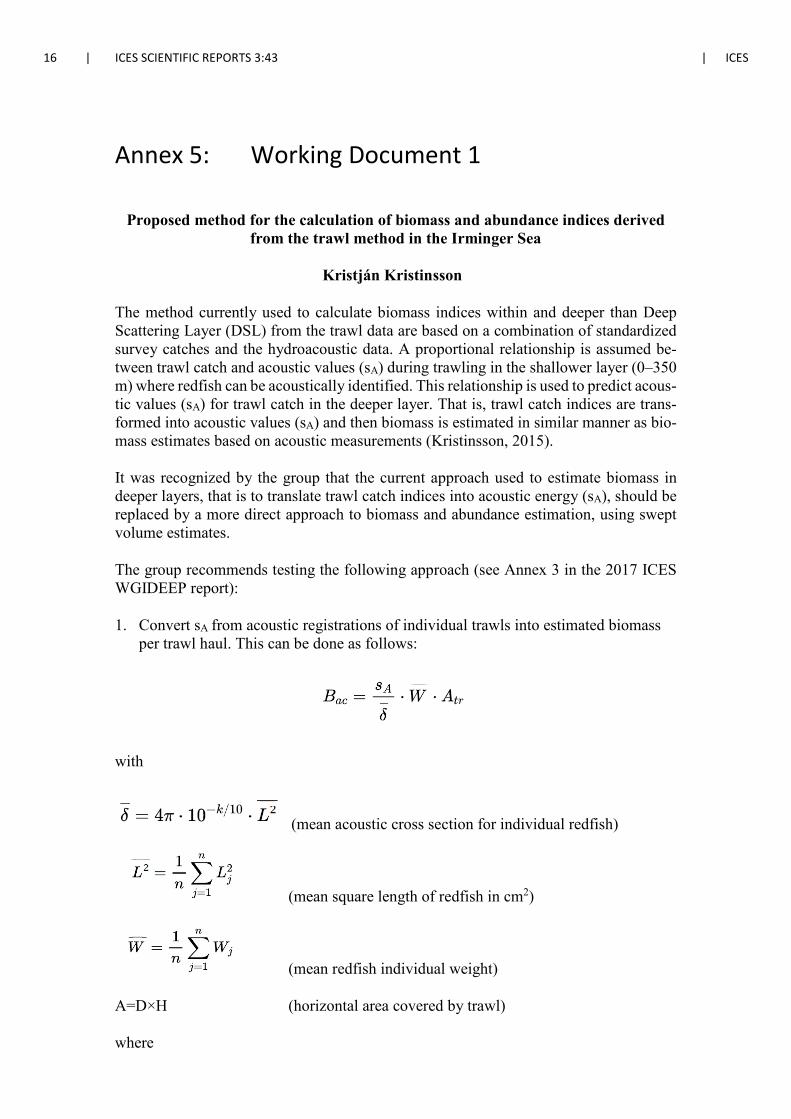
Annex 5: Working Document 1
Proposed method for the calculation of biomass and abundance indices derived from the trawl method in the Irminger Sea
Kristján Kristinsson
The method currently used to calculate biomass indices within and deeper than Deep Scattering Layer (DSL) from the trawl data are based on a combination of standardized survey catches and the hydroacoustic data. A proportional relationship is assumed be-tween trawl catch and acoustic values (sA) during trawling in the shallower layer (0–350 m) where redfish can be acoustically identified. This relationship is used to predict acous-tic values (sA) for trawl catch in the deeper layer. That is, trawl catch indices are trans-formed into acoustic values (sA) and then biomass is estimated in similar manner as bio-mass estimates based on acoustic measurements (Kristinsson, 2015).
It was recognized by the group that the current approach used to estimate biomass in deeper layers, that is to translate trawl catch indices into acoustic energy (sA), should be replaced by a more direct approach to biomass and abundance estimation, using swept volume estimates.
The group recommends testing the following approach (see Annex 3 in the 2017 ICES WGIDEEP report):
1. Convert sA from acoustic registrations of individual trawls into estimated biomass per trawl haul. This can be done as follows:
with
(mean acoustic cross section for individual redfish)
(mean square length of redfish in cm2)
(mean redfish individual weight)
A=D×H (horizontal area covered by trawl)
where

ICES | WGIDEEPS 2021 | 17
Lj = length of redfish j in cm, j=1,2,…,n
Wj = weight of redfish j
n = number of redfish
D = trawl distance (in NM)
H = horizontal trawl opening (in NM)
K = parameter in TS equation TS = 20 log L−k
2. Compare the calculated acoustic estimates, Bac,j, with the corresponding trawl catches, Btr,j, and estimate the trawl-acoustic conversion factor, q:
where n is the number of trawl hauls.
This can be performed for distinct strata, years, vessels, etc. Alternatively, q could be estimated using linear mixed effect models to derive stratum-, year-, or vessel- effects from the whole dataset.
3. For the deeper layer with only trawl estimates, calculate the trawl based biomass density of redfish (e.g. tonne/NM3), ρj , for each trawl haul:
with
Vj = Dj × Hj × ΔZj
where Dj is trawled distance, Hj is horizontal opening and ΔZj is vertical opening in NM-units (1m = 1/1852 NM), and Bj is the total redfish biomass in the trawl catch. The total trawl based biomass in a stratum, s, is then estimated as
with
Vs = As × ΔZs
18 | ICES SCIENTIFIC REPORTS 3:43 | ICES
where As[NM2] is the area and ΔZs[NM²] is the vertical extension of stratum s and m is the total number of distinct strata. Assuming independent density estimates and sta-tionary conditions within the stratum, the variance of can be estimated as follows:
The total biomass, B, and its variance, Vs, are estimated by accumulating over the m strata:
with estimated cv
The utility of the above approach is critically dependent on the appropriateness of the approach to estimate the trawl-acoustic conversion factor q. This factor can be defined as the expected ratio between the number of fish caught by the trawl and the number of fish acoustically observed in the same volume at the time of acoustic registration. This is in general different from the trawl catchability defined as the expected ratio of trawl catch to the number of fish that would have been present in the covered volume at the same time as trawling, if the fish was not disturbed by any trawling activity. The trawl-acoustic conversion factor as well as the trawl catchability may depend on several factors such as fish length, fish age, light and vibrations induced by the vessel or fishing gear.
In the present case, the echosounder is mounted on the hull, and fish are typically detected by acoustics about 1 km ahead of the trawl and in the order of 10 min before the trawl covers the same volume as the acoustics which gives enough time between registration and trawling for the fish density to change. This will easily cause a trawl-acoustic con-version factor to be different from one, even in the case when the trawl catchability equals one. In addition, it is difficult to be sure that the trawl-acoustic conversion factor (as well as the trawl catchability) is not substantially different below and above the mesopelagic layer.
Ideally the estimated trawl-acoustic conversation factors should not vary too much be-tween trawl hauls. A way to examine this is to bootstrap trawl hauls many times, with the number of bootstraps draw equal to the number of trawl hauls in each simulation. For each simulation, a new value of q is estimated, and if the cv of these simulated values is considerably lower than one, this is a good sign of strong proportionality between acous-tic and trawl-based estimates. If one assumes the acoustic estimate to be close to real fish density in the ocean, and that the fish density is close to stationary on a time-scale equal to the time-lag of the trawl compared to the acoustics, the trawl-acoustic conversion co-efficient q will be a reasonable proxy for trawl catchability. In this case a value consid-erably larger than one will indicate a strong herding effect, while a value close to zero

ICES | WGIDEEPS 2021 | 19
will indicate a strong escaping behaviour. Both outcomes may indicate that the trawl is too small to provide reliable abundance and biomass estimates.
Applying the method with current data
Calculating q, the catchability. Linear mixed effect model is used to derive stratum-, year-, or vessel- effects from the whole dataset.
1. Convert sA from acoustic registrations of individual trawls into estimated biomass per trawl haul
• Mean square length of redfish in cm2 per station • Mean individual weight in kg per station:
2. Compare the calculated acoustic estimates, Bac,j, with the corresponding trawl catches, Btr,j, and estimate the trawl-acoustic conversion factor, q
Calculate q. Robust linear regression used:
### RLS library(MASS) y <- rlm(q ~ as.factor(Year) + as.factor(Country) + Subarea, data=st2, na.action = na.omit) summary(y)
##
## Call: rlm(formula = q ~ as.factor(Year) + as.factor(Country) + Subarea,
## data = st2, na.action = na.omit)
## Residuals:
## Min 1Q Median 3Q Max
## -0.39760 -0.12991 -0.01117 0.12865 1.56754
##
## Coefficients:
## Value Std. Error t value
## (Intercept) 0.1899 0.0757 2.5103
## as.factor(Year)2005 0.1192 0.0617 1.9327
## as.factor(Year)2007 0.1558 0.0670 2.3255
## as.factor(Year)2009 0.1567 0.0880 1.7809
20 | ICES SCIENTIFIC REPORTS 3:43 | ICES
## as.factor(Year)2011 0.0592 0.0632 0.9368
## as.factor(Year)2013 0.0680 0.0749 0.9074
## as.factor(Year)2015 -0.0559 0.1074 -0.5203
## as.factor(Year)2018 0.1658 0.0897 1.8474
## as.factor(Country)46 -0.0713 0.0561 -1.2703
## as.factor(Country)90 -0.1698 0.0606 -2.8045
## SubareaB 0.0550 0.0545 1.0107
## SubareaC -0.0018 0.1399 -0.0128
## SubareaD 0.1005 0.0808 1.2437
## SubareaE 0.1462 0.0606 2.4107
## SubareaF -0.0870 0.1668 -0.5216
##
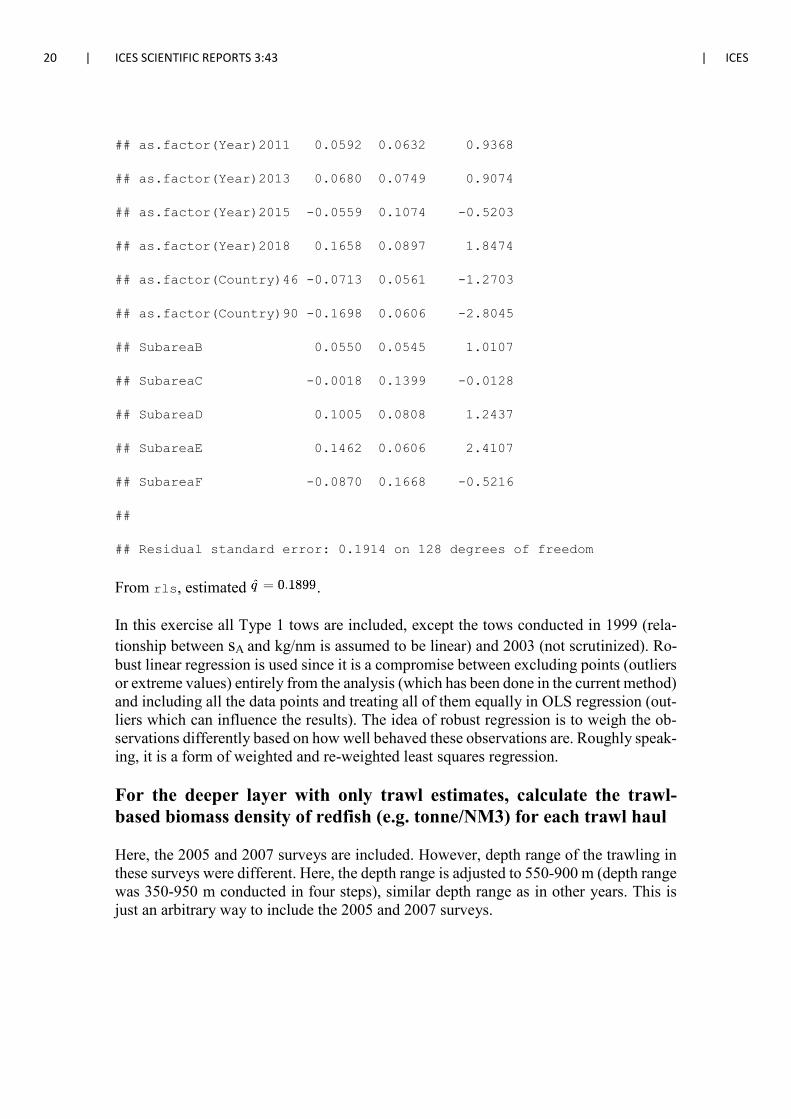
## Residual standard error: 0.1914 on 128 degrees of freedom
From rls, estimated .
In this exercise all Type 1 tows are included, except the tows conducted in 1999 (rela-tionship between sA and kg/nm is assumed to be linear) and 2003 (not scrutinized). Ro-bust linear regression is used since it is a compromise between excluding points (outliers or extreme values) entirely from the analysis (which has been done in the current method) and including all the data points and treating all of them equally in OLS regression (out-liers which can influence the results). The idea of robust regression is to weigh the ob-servations differently based on how well behaved these observations are. Roughly speak-ing, it is a form of weighted and re-weighted least squares regression.
For the deeper layer with only trawl estimates, calculate the trawl-based biomass density of redfish (e.g. tonne/NM3) for each trawl haul
Here, the 2005 and 2007 surveys are included. However, depth range of the trawling in these surveys were different. Here, the depth range is adjusted to 550-900 m (depth range was 350-950 m conducted in four steps), similar depth range as in other years. This is just an arbitrary way to include the 2005 and 2007 surveys.

ICES | WGIDEEPS 2021 | 21
Table 2.1: Biomass estimates (tonnes) of deep pelagic beaked redfish (500-950 m depth) by sub-areas in the Irminger Sea and adjacent waters 1999-2018.
Year A B C D E F Total
1999 257577 188301 14361 13043 18210 NA 491493
2001 213558 117693 5464 21987 19591 8057 386350
2003 97517 53022 18099 23403 19275 96 211411
2005 72374 58670 570 18440 47525 1515 199094
2007 83186 69964 330 4628 35162 3027 196298
2009 98675 57093 NA 4820 27969 NA 188557
2011 101498 31281 0 589 14780 48 148198
2013 61359 23948 NA 1271 5000 0 91578
2015 64170 21093 NA NA NA NA 85264
2018 41744 NA NA NA NA NA 41744
The results show, large biomass declines over the period, both total biomass and biomass in Subarea A, the main distribution area of the stock.
3. Comparison of results with current method and kg/nm (scaled with area size cov-ered)
• All areas combined
The problem here is that not all areas have been covered in some years. In 2018, only Subarea A was covered. The 2018 estimate was scaled to the area of the 2015 survey by the proportion of biomass found outside the 2018 survey area.
Table 2.2: Current biomass estimates (tonnes) of deep pelagic beaked redfish (500-950 m depth) by sub-areas in the Irminger Sea and adjacent waters 1999-2018. Zero values indicate that the area was not covered.
Year A B C D E F Total
1999 277000 568000 12000 27000 52000 0 935000
2001 497000 316000 28000 79000 64000 18000 1001000
2003 476000 142000 20000 13000 27000 0 678000
2005 221000 95000 0 8000 65000 3000 392000
2007 276000 166000 1000 5000 62000 11000 522000
2009 291000 121000 0 8000 37000 1000 458000
2011 342000 112000 0 1000 18000 0 474000
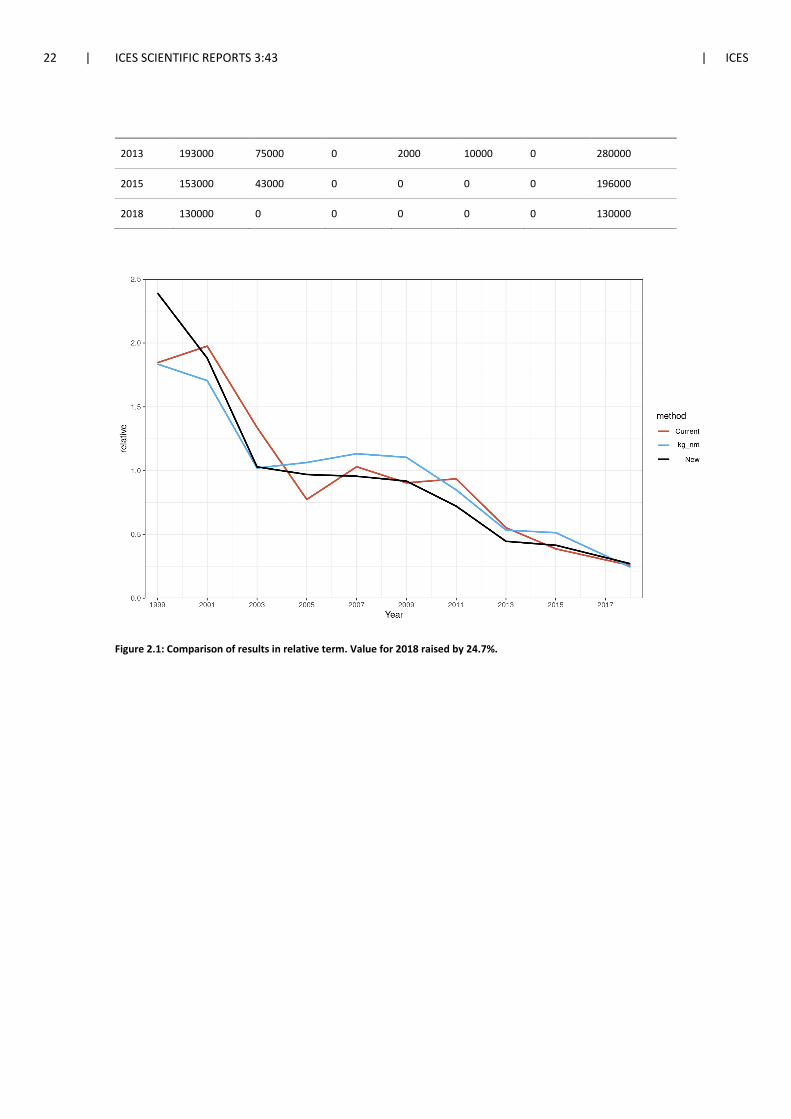
22 | ICES SCIENTIFIC REPORTS 3:43 | ICES
2013 193000 75000 0 2000 10000 0 280000
2015 153000 43000 0 0 0 0 196000
2018 130000 0 0 0 0 0 130000
Figure 2.1: Comparison of results in relative term. Value for 2018 raised by 24.7%.

ICES | WGIDEEPS 2021 | 23
• Only Subareas A and B
Figure 2.2: Comparison of results in relative term for subareas A and B. Value for 2018 raised by 24.7%.
In relative terms, there is little difference in the results and the perception of the stock. The main difference is that the 1999 estimate is higher in the new method compared to the current method.
Variance
To be done.
Next Step
The next step is to apply these estimates to the GADGET model. It is, however, highly likely that the new method will not change anything regarding the stock assessment.
To include any new methods in calculation of the survey index, the stock needs to be benchmarked. The proposed method is though much simpler than current method used to derive abundance and biomass estimates of the deep pelagic stock.
24 | ICES SCIENTIFIC REPORTS 3:43 | ICES
Annex 6: Working Document 2
The Working Group on International Deep Pelagic Ecosystem Surveys (WGIDEEPS)
Working Document 2
V.N. Khlivnoy, A.Yu. Astakhov
Standardization of biomass indices of the beaked redfish stock in the Irminger Sea
Substantiation of the need to refine the assessment
During the international trawl-acoustic survey of the beaked redfish in the Irminger Sea, a de-crease in the research area is noted. The survey area was gradually reducing from 420 thousand square miles in 2001 to 200 thousand square miles in 2015, what means that the survey area was reduced more than two times (Figure 1). In 2018, the survey area was also reduced twofold com-pared with the previous survey in 2015 and amounted to 103 thousand square miles (Figure 1).
The situation has worsened in recent years when the number of vessels involved in the Interna-tional Trawl-Acoustic Survey decreased as a result of a decrease in the number of countries par-ticipating in the survey. Currently, surveys can be carried out only in a small part of the initial survey area, leading to incorrect conclusions about the state of the stock.
Data, obtained in surveys of maximum coverage, indicated that a significant part of the stock was distributed in areas, where no surveys were conducted in recent years (Figure 1). In 2021 (survey area is 420 thousand square miles) and in 2005 (survey area is 386 thousand square miles), about 19% of the total part of the stock, distributed in the layer deeper than 500 m, were estimated at survey sites located outside A and B areas. Subsequently, as the water area of the International Trawl-Acoustic Survey decreased, the share of the stock, estimated outside these areas, decreased and amounted to less than 5% in 2011 (survey area is 343 thousand square miles) and in 2013 (survey area is 340 thousand square miles) (ICES, 2018a , ICES, 2019). In 2015 and 2018, these Subareas accounted for 100 % of the estimated biomass, as surveys were carried out only in Subareas A and B. At the same time, even in the years with the maximum water area covered by the survey, the stock was not fully estimated, since the stock distribution limit was not reached. As a result of the reduction in the survey area, the stock of pelagic redfish S. mentella in the Irminger Sea is currently estimated within only a small part of the original study area, leading to incorrect conclusions about the state of the stock. An increase in the research area leads to an increase in the calculated biomass index and a decrease in the water area leads to its decrease. There is a high probability that the indices, used in the assessment, reflect the change in the survey area to a greater extent than the dynamics of the stock.
Under these conditions it becomes impossible to use the old method of calculating the indices based on the comparison of data obtained in the area covered by the survey in each separate
ICES | WGIDEEPS 2021 | 25
year. The indices, calculated for survey areas of different coverage, are not comparable and do not reflect the real change in biomass. Indexes are used to set up an analytical model for assessing the state of the stock and this cause erroneous calculation. Therefore, the use of these indices for stock status assessing is incorrect. Analysis of impact of decrease in the survey area on the stock assessment was presented at the NWWG (Khlivnoy, Astakhov, Gavrilik, Popov, 2019).
In 2019, following the submission of information on the difference in the survey area and impact of decrease in research area on stock assessment, the North-Western Working Group recom-mended revising the calculation of the Irminger beaked redfish stock biomass indices by the ICES WG on International Deep Pelagic Ecosystem Surveys (WGIDEEPS).
Taking into account the above, in order to obtain a reliable assessment of the stock state, it seems appropriate to switch over to the methodology of assessing the biomass indices of the beaked redfish stock smoothing over the interannual changes in the survey area. To do this, you need to standardize the indexes.
Data and methods
To exclude the influence of interannual changes in the survey area, the indices were standardized by two methods:
a) Indices were determined by the biomass of the beaked redfish stock in the standard area, which was covered by the survey in all years (method A).
b) Indices were calculated by the biomass of the stock per unit area covered by the survey (method B).
This working document provides standardized indices derived from the International Trawl-Acoustic Survey of pelagic redfish conducted in the Irminger Sea in 1999-2018. Previously, the methodology of index standardization was presented at the ICES North-Western Working Group (Khlivnoy, Astakhov, Gavrilik, Popov, 2019).
Determination of indices by stock biomass in a standard area, which was covered by survey during all years of study (method A).
In order to remove the effect of interannual changes in the area covered by the survey, area-standardized indices of the beaked redfish stock biomass were used. For this purpose, a standard area was used, which was covered by survey in all years of survey. The survey area is divided into six geographic strata (Subareas): A, B, C, D, E and F. In 2015, due to participation of only two vessels in the survey, it was decided to cover only Subareas A and B. At the same time, the Subarea B was only partially covered by the survey (ICES, 2015). In 2018, only Subarea A was covered by the survey (Figure 1). Until 2015, the research area was also not permanent. During all the International Trawl-Acoustic Surveys, only Subarea A was fully covered, so it was chosen as the standard area.
Determination of the biomass indices in the standard area was conducted by analogy with the calculations previously performed by ICES, which were carried out with full coverage of the survey areas. Calculations were made in accordance with the adopted ICES guideline (Mamylov,
26 | ICES SCIENTIFIC REPORTS 3:43 | ICES
1999), which has been used for the International Trawl-Acoustic Survey since 1999, but the data obtained in the area selected as standard (Subarea A) were used (Figure 1).
In the future, the standard area can be increased by obtaining a representative data for other areas. For example, the standard area can include the part of Subareas B and E that was covered by all the surveys.
During the survey, the stock assessment is performed separately in three layers: above the deep-scattering layer (DSL), in the deep-scattering layer above 500 m and deeper than 500 m. This is due to the differences in the sound transmitting properties of these layers. Subsequently, these data are combined depending on the interpretation. For the layer above the DSL, an acoustic estimation of the beaked redfish biomass indices is used. For deeper layers, calculations are per-formed using trawl data. For 2005 and 2007, within the WG on summarizing the results of Inter-national Trawl-Acoustic Survey, the indices were initially evaluated for only two layers: above 350 m and below 350 m. In 2014, the data from these two surveys were recalculated with the allocation of three layers and presented in the report of the North-West Working Group (ICES, 2014). However, this report provided information for a range of depths covering the deep-scat-tering layer up to 500 m (Layer 2) without division by area. In this regard, data on this layer for Subarea A for 2005 and 2007 are not available. To clarify the index estimates, the data for 2005 and 2007, divided by areas, should be presented and included in the report of the North-West Working Group.
Currently, in ICES, the biomass for two layers: in the DSL up to 500 m and above the DSL is combined into the shallow-water component of the beaked redfish stock. Biomass, estimated in the layer below DSL, is considered to correspond to the deep sea component. Combining of data, obtained from all layers, can show the overall biomass index of pelagic redfish in the Irminger Sea.
The indices were standardized using data on stock biomass in layers given in the reports of ICES WG on summarizing the results of International Trawl-Acoustic Survey WGIDEEPS (ICES, 2018) and North-West Working Group (NWWG) 2018 (ICES. 2018a). To obtain detailed information for Subarea A for the period up to 2005, the data provided in the 2004 NWWG report (ICES. 2004) were used.
Calculation of indices per unit area covered by the survey (method B). In practice, for many trawl surveys, average catch per trawl or per unit area covered by the survey is used to calculate the indices of biomass and stock abundance. Similarly, to remove the influence of differences in the area covered by the International Trawl-Acoustic Survey of redfish in the Irminger Sea, the biomass indices can also be recalculated per unit area covered by the survey.
Area normalization was performed for all three layers: above the deep-scattering layer, in the deep-scattering layer above 500 m and in the layer deeper than 500 m. Standardized indices are obtained in accordance with formula (1) by dividing the biomass of the stock, estimated over the entire survey area, by its area.
, where (1)
I(y) - area-standardized biomass index in year y;
B(y) - biomass of the stock estimated over the entire survey area in year у;
ICES | WGIDEEPS 2021 | 27
S(y) - the entire survey area in year y.
In the calculations, data on stock biomass and survey area were taken from the report of ICES WG on summarizing the results of International Trawl-Acoustic Survey WGIDEEPS (ICES, 2018). Data on trawl estimate of the stock in the deep-scattering layer above 500 m for 2005 and 2007, which are not available in the WGIDEEPS report, are taken from the NWWG reports of 2014 and 2018 (ICES. 2014; ICES. 2018a).
The results
The biomass indices of the pelagic redfish stock, obtained for the standard water area, are pre-sented in Table 1. Subarea A, which was covered by surveys in all years, was used as the standard area. The calculations are given for all three layers and the total indices are also determined. For the layer above the deep-scattering layer, the data are presented for all years, except for 2015, because for this year the survey participants did not carry out calculations to estimate the bio-mass of the stock in this layer. For a layer deeper than 500 m, information is available in all years. There are gaps in the stock estimation for the deep-scattering layer located above 500 m. This is explained by the fact that after the recalculation of the results of the 2005 and 2007 surveys, per-formed in 2014, the data for the depth range, covering the deep-scattering layer above 500 m, were presented to ICES without division by areas. In this regard, data on this layer for Subarea A, as well as for other Subareas, are not available in 2005 and 2007. For complete information, it is necessary to provide information with a division by Subareas.
The biomass value estimated in the standard water area is less than its value obtained for the entire survey area (Figure 2). Standardized indices are not indicator of the absolute biomass of the stock. They characterize trends in the state of the stock.
The analysis showed that in recent years there has been a decrease in the differences between the indices of the redfish stock biomass, calculated for the entire survey area, and the indices esti-mated for the area selected as a standard area (Subarea A), which may be due to a decrease in the area covered by surveys outside Subarea A (Figure 2). The stock valuation in recent years has been reduced to the definition of it in the Subarea A or Subareas A and B. This allows us to conclude that standardized indices smooth over the impact of interannual differences in the re-search area on the assessment.
In general, there is a similarity between the trends of changes in the indices of the redfish stock biomass, assessed for the standard and for the entire survey area (Figure 3). However, the indi-ces, determined by biomass for the entire area, do not take into account the effect of changes in the research area on the stock biomass estimation. For example, they did not reflect that in 2018, with a threefold reduction in the research area in relation to 2013, from 340 to 103 square miles, the stock in the layer above the deep-scattering layer was estimated at almost equal levels of 91 and 82 thousand tons, respectively. At the same time, in previous years, a significant part of the stock was distributed outside the area assessed in 2018. All this indicates an increase in biomass in the layer above the deep-scattering layer in 2018, which is reflected by the indices estimated in the standard area.
Normalized to unit area indices, which were obtained by dividing the stock biomass, in the entire area covered by the survey, by its area are presented in Table 2. The trends in the temporal dy-namics of indices estimated by the biomass of the redfish stock throughout the survey area (un-standardized indices) and by its value per unit area (standardized indices) are similar. However, in the years with the maximum research area, a relative increase in the non-standardized indices in relation to the standardized ones was reflected. This can probably be a consequence of an

28 | ICES SCIENTIFIC REPORTS 3:43 | ICES
increase in the estimated biomass due to an increase in the research area (Figure 4). Conversely, as the area covered by the survey decreased, the estimated biomass decreased. Also, in contrast to the unstandardized indices, the standardized ones reflect the growth of the biomass of the redfish stock in the layer above the deep-scattering layer in 2018. This allows us to conclude that the standardized indices smooth over the impact of interannual differences in the research area on the assessment (Figure 3).
The conclusion
Interannual changes in the area, covered by the trawl survey, influence significantly the value of assessed biomass indices. As a result of the reduction in the study area, the share of Subareas A and B in the stock, estimated throughout the survey area, increased. This is a consequence of the reduction of survey area outside these subareas. The stock valuation in recent years has been reduced to the definition of it in the Subarea A or Subareas A and B. In 2011 and 2013, the share of Subareas A and B in the total biomass indices in the layer deeper than 500 m was 96 % com-pared to 81 % in 2001 and 2005 and 84 % in 2008 (ICES, 2019). In 2015 and 2018, these Subareas accounted for 100 % of the estimated biomass, as surveys were carried out only in Subareas A and B. This means that there was an increase in the undervalued biomass by at least 15-20 % due to a reduction in the research area. There is a high probability that the indices, calculated using different areas, reflect the change in the survey area to a greater extent than the dynamics of the stock.
Currently, surveys can be carried out only in a small part of the initial survey area, leading to incorrect conclusions about the state of the stock.
Taking into account the above, in order to obtain a reliable assessment of the stock state, it seems appropriate to switch over to the methodology of assessing the biomass indices of the beaked redfish stock smoothing over the interannual changes in the survey area. To this end, it seems appropriate to all years, including 2018, to estimate the indices for the standard area, covered by the survey in all years, or recalculate them per unit area covered by the survey.
Standardized indices are not an indicator of the absolute biomass of the stock, since they are determined in the part of the area of the beaked redfish distribution. They characterize trends in the state of the stock. However, the biomass of the stock, estimated for the entire area covered by the International Trawl-Acoustic Survey, is also not complete, as when the surveys were car-ried out, part of the stock remained outside it.
In general, there is a similarity in the dynamics of the biomass indices of the beaked redfish stock, assessed for the standard and for the entire survey area. The same tendencies are observed for the indices calculated by the stock biomass per unit area. At the same time, the indices, deter-mined by the biomass for the entire area, do not take into account the impact of the research area reduction on them. Thus, in 2018, with a threefold reduction in the research area compared to 2013, the biomass of the stock in the layer above the DSL practically did not change. Taking into account the fact that in previous years a significant part of redfish accumulations in this layer was distributed outside the area covered by the survey, this indicates an increase in the biomass of redfish in the layer above the DSL. In 2018, the abundance of redfish individuals with a length of less than 35 cm, estimated in the survey area, was the highest in the entire history of the survey, which may indicate the appearance of large number of recruits (ICES, 2018). These facts confirm the information on the growth of biomass in this layer in 2018. The indices, determined by the biomass estimated over the entire survey area, do not reflect this increase. Standardized indices record the growth of the stock in this layer. The standardization of indices by area makes it
ICES | WGIDEEPS 2021 | 29
possible to smooth over the interannual changes in the research area and gives a more accurate idea of the dynamics of the stock.
In 2015, the survey area decreased by more than two times compared to the initial period, which calls into question the possibility of using the data obtained during the survey. Standardization of indices by area allows us to use the data of all surveys conducted in 1999-2018.
To improve the quality of information on the state of the stock of redfish in the Irminger Sea, it is necessary to strive to collect data for full survey coverage of its distribution area. In the future, due to accumulation of data from number of surveys carried out over the entire area of redfish distribution, it will be possible to use these data to assess the state of the stock.
There are gaps in the data for the deep-scattering layer located above 500 m. This is explained by the fact that after the recalculation of the results of the 2005 and 2007 surveys, performed in 2014, the data for the depth range, covering the deep-scattering layer above 500 m, were pre-sented to ICES without division by areas. In this regard, data on this layer for standard Subarea A, as well as for other areas, are not available in 2005 and 2007. For complete information, it is necessary to provide information with a divide by Subareas.
The indices, given in this Working Document, allow us to remove the impact of interannual changes in the study area, since they were determined in the area covered by the survey in all years, which makes them more reliable compared with the indices estimated from surveys that differ in area.
References Mamylov V.S., 1999. Methodical aspects of trawl-acoustic surveys on redfish stock in the Irminger Sea.
Working Document 3, Report of the study group on redfish stocks. ICES CM 1999/G:9.
ICES, 2004. Report of the North Western Working Group (NWWG). 27 April-6 May. Copenhagen, Den-mark. ICES CM 2004/ACFM:25. 476 pp.
http://ices.dk/sites/pub/Publication%20Reports/Expert%20Group%20Re-port/acfm/2004/nwwg/NWWG04.pdf
ICES, 2015. Beaked redfish (Sebastes mentella) in Subareas V, XII, and XIV (Iceland and Faroes grounds, north of Azores, east of Greenland) and NAFO Subareas 1+2 (deep pelagic stock > 500 m). ICES Advice 2015, Book 2, Section 2.3.4a.
ICES, 2015a. Introduction to the redfish (Sebastes spp.) complex in ICES Subareas V, VI, XII and XIV (Ice-land and Faroes grounds, north of Azores, and east of Greenland). ICES Advice 2015, Book 2, Section 2.3.3.
Khlivnoy V.N., Astakhov A.Yu., Gavrilik T.N., Popov V.I., 2019. Refining the assessment of the beaked redfish stock in the Irminger Sea taking into account the data of the International Trawl-Acoustic Sur-vey in 2018. WD on NWWG. Copenhagen, Denmark. 28 pp.
ICES. 2018. Report of the Working Group on International Deep Pelagic Ecosystem Surveys (WGIDEEPS). 6-8 August 2018. Bremerhaven, Germany. ICES CM
http://www.ices.dk/sites/pub/Publication%20Reports/Expert%20Group%20Re-port/EOSG/2018/WGIDEEPS/WGIDEEPS%20report%202018%20-%202.pdf
ICES, 2018a. Report of the North Western Working Group (NWWG). 26 April-3 May 2018. Copenhagen, Denmark. ICES CM 2018. 802 pp.
http://prep.ices.dk/sites/pub/Publication%20Reports/Expert%20Group%20Re-port/acom/2018/NWWG/01%20NWWG%20Report%202018.pdf
30 | ICES SCIENTIFIC REPORTS 3:43 | ICES
ICES, 2019. Report of the North Western Working Group (NWWG). April-May 2019. Copenhagen, Den-mark. ICES CM 2019. 802 pp.
Tables and Figures
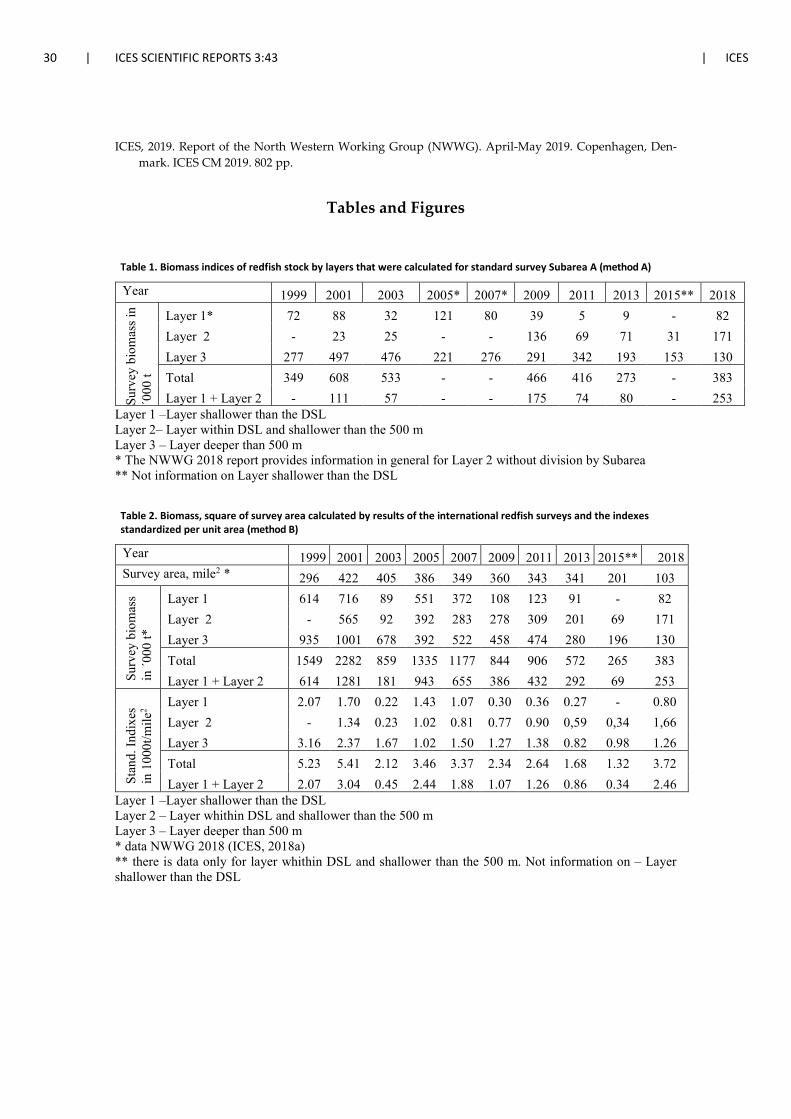
Table 1. Biomass indices of redfish stock by layers that were calculated for standard survey Subarea A (method A)
Year 1999 2001 2003 2005* 2007* 2009 2011 2013 2015** 2018
Surv
ey b
iom
ass i
n ´0
00 t
Layer 1* 72 88 32 121 80 39 5 9 - 82 Layer 2 - 23 25 - - 136 69 71 31 171 Layer 3 277 497 476 221 276 291 342 193 153 130 Total 349 608 533 - - 466 416 273 - 383 Layer 1 + Layer 2 - 111 57 - - 175 74 80 - 253
Layer 1 –Layer shallower than the DSL Layer 2– Layer within DSL and shallower than the 500 m Layer 3 – Layer deeper than 500 m * The NWWG 2018 report provides information in general for Layer 2 without division by Subarea ** Not information on Layer shallower than the DSL
Table 2. Biomass, square of survey area calculated by results of the international redfish surveys and the indexes standardized per unit area (method B)
Year 1999 2001 2003 2005 2007 2009 2011 2013 2015** 2018 Survey area, mile2 * 296 422 405 386 349 360 343 341 201 103
Surv
ey b
iom
ass
in ´0
00 t*
Layer 1 614 716 89 551 372 108 123 91 - 82 Layer 2 - 565 92 392 283 278 309 201 69 171 Layer 3 935 1001 678 392 522 458 474 280 196 130 Total 1549 2282 859 1335 1177 844 906 572 265 383 Layer 1 + Layer 2 614 1281 181 943 655 386 432 292 69 253
Stan
d. In
dixe
s in
100
0t/m
ile2 Layer 1 2.07 1.70 0.22 1.43 1.07 0.30 0.36 0.27 - 0.80
Layer 2 - 1.34 0.23 1.02 0.81 0.77 0.90 0,59 0,34 1,66 Layer 3 3.16 2.37 1.67 1.02 1.50 1.27 1.38 0.82 0.98 1.26 Total 5.23 5.41 2.12 3.46 3.37 2.34 2.64 1.68 1.32 3.72 Layer 1 + Layer 2 2.07 3.04 0.45 2.44 1.88 1.07 1.26 0.86 0.34 2.46
Layer 1 –Layer shallower than the DSL Layer 2 – Layer whithin DSL and shallower than the 500 m Layer 3 – Layer deeper than 500 m * data NWWG 2018 (ICES, 2018a) ** there is data only for layer whithin DSL and shallower than the 500 m. Not information on – Layer shallower than the DSL
ICES | WGIDEEPS 2021 | 31
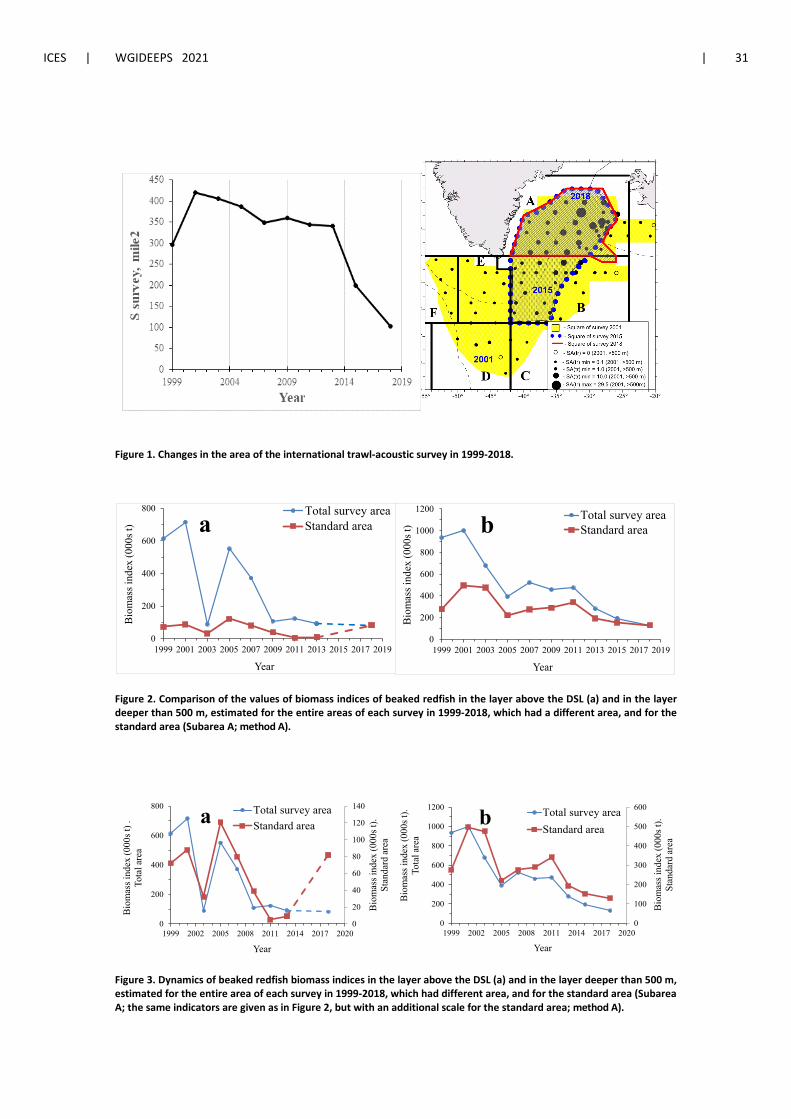
Figure 1. Changes in the area of the international trawl-acoustic survey in 1999-2018.
Figure 2. Comparison of the values of biomass indices of beaked redfish in the layer above the DSL (a) and in the layer deeper than 500 m, estimated for the entire areas of each survey in 1999-2018, which had a different area, and for the standard area (Subarea A; method A).
Figure 3. Dynamics of beaked redfish biomass indices in the layer above the DSL (a) and in the layer deeper than 500 m, estimated for the entire area of each survey in 1999-2018, which had different area, and for the standard area (Subarea A; the same indicators are given as in Figure 2, but with an additional scale for the standard area; method A).
0
200
400
600
800
1999 2001 2003 2005 2007 2009 2011 2013 2015 2017 2019
Bio
mas
s ind
ex (0
00s t
)
Year
aTotal survey areaStandard area
0
200
400
600
800
1000
1200
1999 2001 2003 2005 2007 2009 2011 2013 2015 2017 2019
Bio
mas
s ind
ex (0
00s t
)
Year
b Total survey areaStandard area
0
100
200
300
400
500
600
0
200
400
600
800
1000
1200
1999 2002 2005 2008 2011 2014 2017 2020
Biom
assi
ndex
(000
s t).
Stan
dard
area
Biom
ass i
ndex
(000
s t).
Tota
l are
a
Year
b Total survey areaStandard area
0
20
40
60
80
100
120
140
0
200
400
600
800
1999 2002 2005 2008 2011 2014 2017 2020
Biom
ass i
ndex
(000
s t).
Stan
dard
area
Biom
ass i
ndex
(000
s t) .
To
tal a
rea
Year
a Total survey areaStandard area
32 | ICES SCIENTIFIC REPORTS 3:43 | ICES
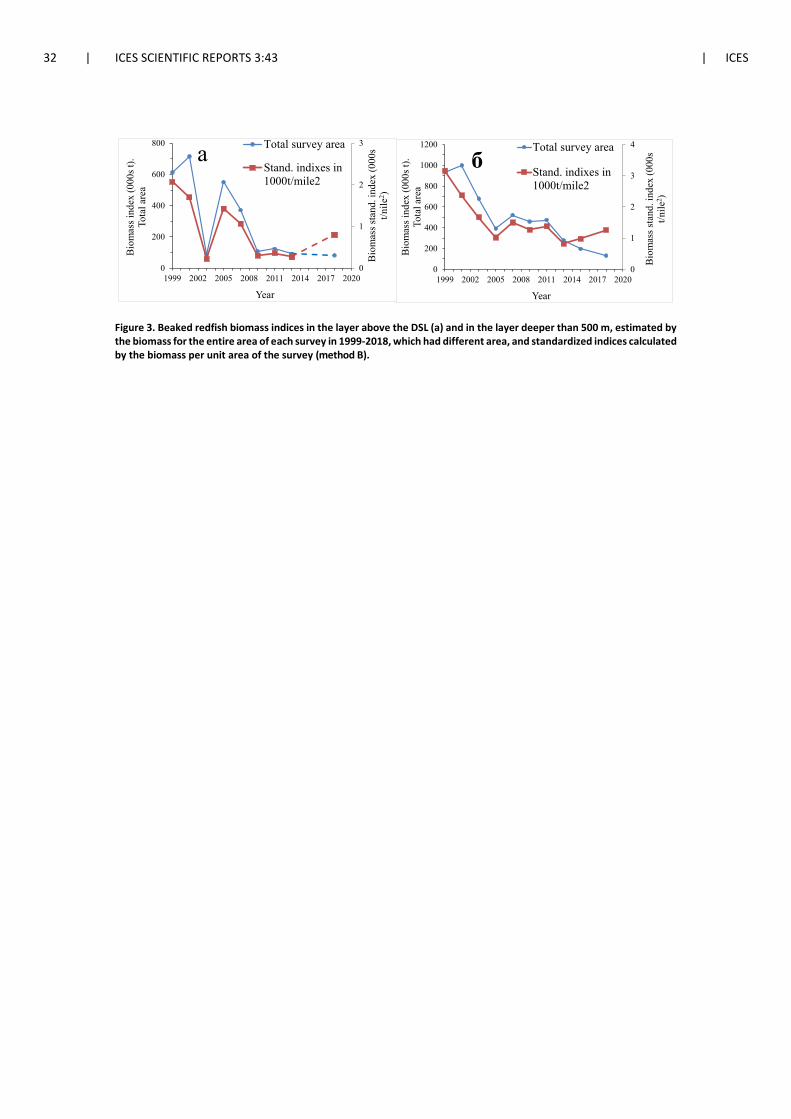
Figure 3. Beaked redfish biomass indices in the layer above the DSL (a) and in the layer deeper than 500 m, estimated by the biomass for the entire area of each survey in 1999-2018, which had different area, and standardized indices calculated by the biomass per unit area of the survey (method B).
0
1
2
3
4
0
200
400
600
800
1000
1200
1999 2002 2005 2008 2011 2014 2017 2020
Bio
mas
ssta
nd. i
ndex
(000
s t/n
ile2 )
Bio
mas
s ind
ex (0
00s t
). To
tal a
rea
Year
бTotal survey area
Stand. indixes in1000t/mile2
0
1
2
3
0
200
400
600
800
1999 2002 2005 2008 2011 2014 2017 2020
Bio
mas
ssta
nd. i
ndex
(000
s t/n
ile2 )
Bio
mas
s ind
ex (0
00s t
). To
tal a
rea
Year
a Total survey area
Stand. indixes in1000t/mile2